35
India’s IT/ITeS Industry: The Next Phase Non-linear Growth & Broad-Based Innovation Dr. Anupam Khanna. Chief Economist Knowledge-Based Capital Conference OECD, Paris February 14, 2013

India’s IT/ITeS Industry: The Next Phase
Non-linear Growth & Broad-Based Innovation
Dr. Anupam Khanna. Chief Economist
Knowledge-Based Capital Conference
OECD, Paris February 14, 2013

Implications for the IT-BPO Industry
2 22-Feb-13

Hardware Products Services
IT Services BPO
• Project
Oriented
• Outsourci
ng
• Support &
Training
Embedded
Systems
• Software
Products
• System
Software
• Enterprise
applications
• Vertical
applications
• Personal
Computers
• Network
Equipment
• Storage and
Security
• Servers
• Printers
IT-BPO
ER&D OSPD
• Horizontal
Specific
• Vertical
Specific
3 22-Feb-13
The IT-BPO industry segmentation

INDIAN IT-BPO INDUSTRY
Source: NASSCOM
Brief history of Indian IT-BPO revenue
4 22-Feb-13
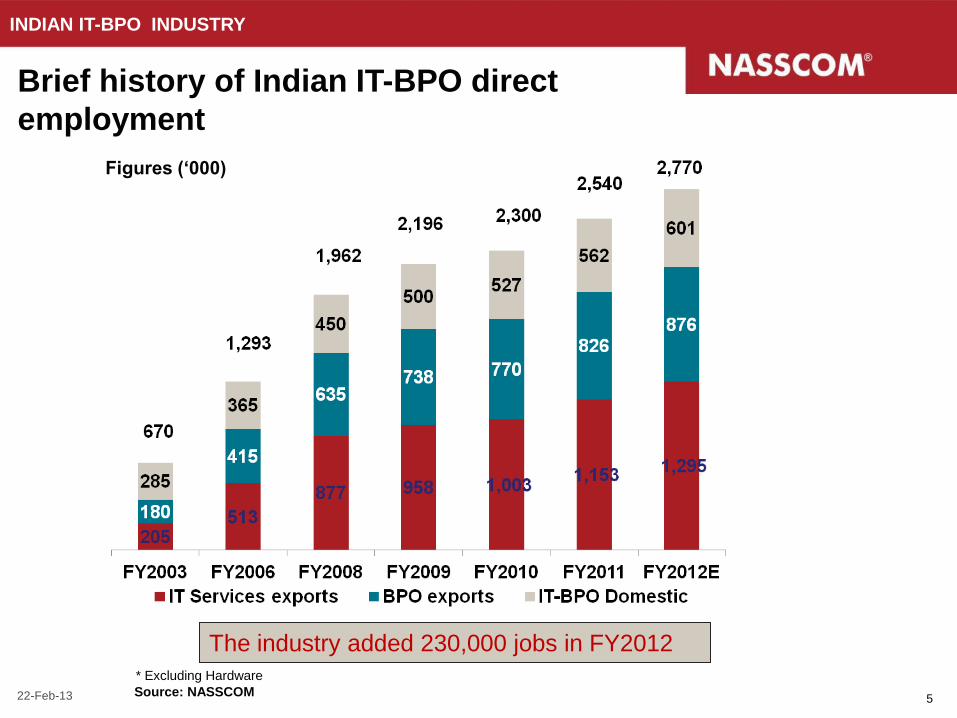
The industry added 230,000 jobs in FY2012
Brief history of Indian IT-BPO direct
employment
INDIAN IT-BPO INDUSTRY
Source: NASSCOM
* Excluding Hardware
Figures (‘000)
5 22-Feb-13

6
Trends in World Exports and Indian Exports of Goods and Services in current USD (Index=100 in 1990)

7
Growth Rate of Services Exports, VariousCountries

Share of Services Exports
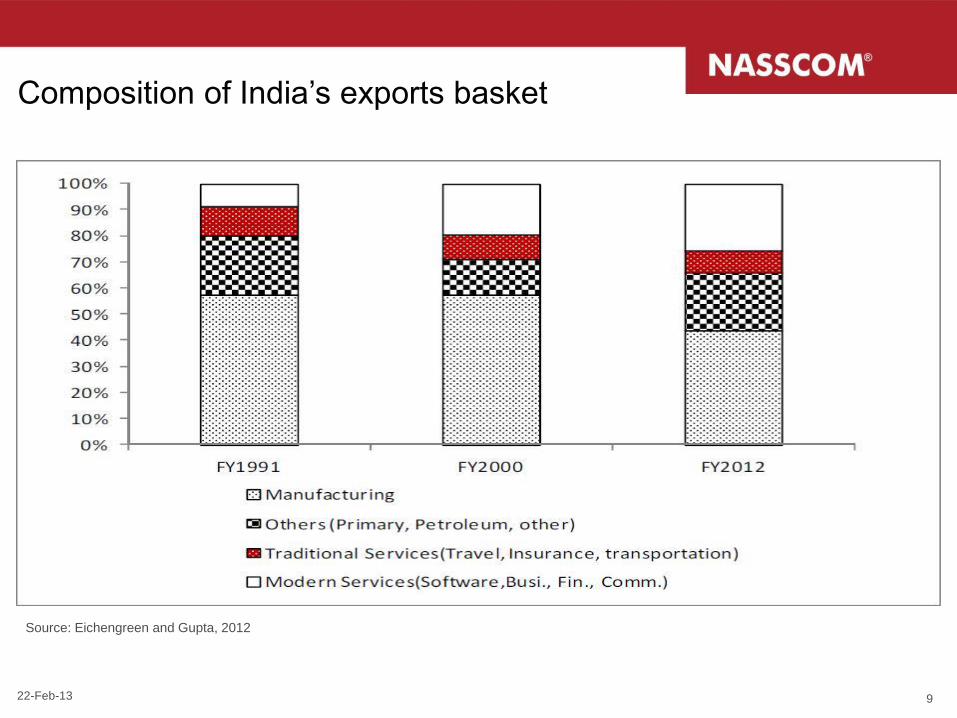
Composition of India’s exports basket
Source: Eichengreen and Gupta, 2012
9 22-Feb-13
10
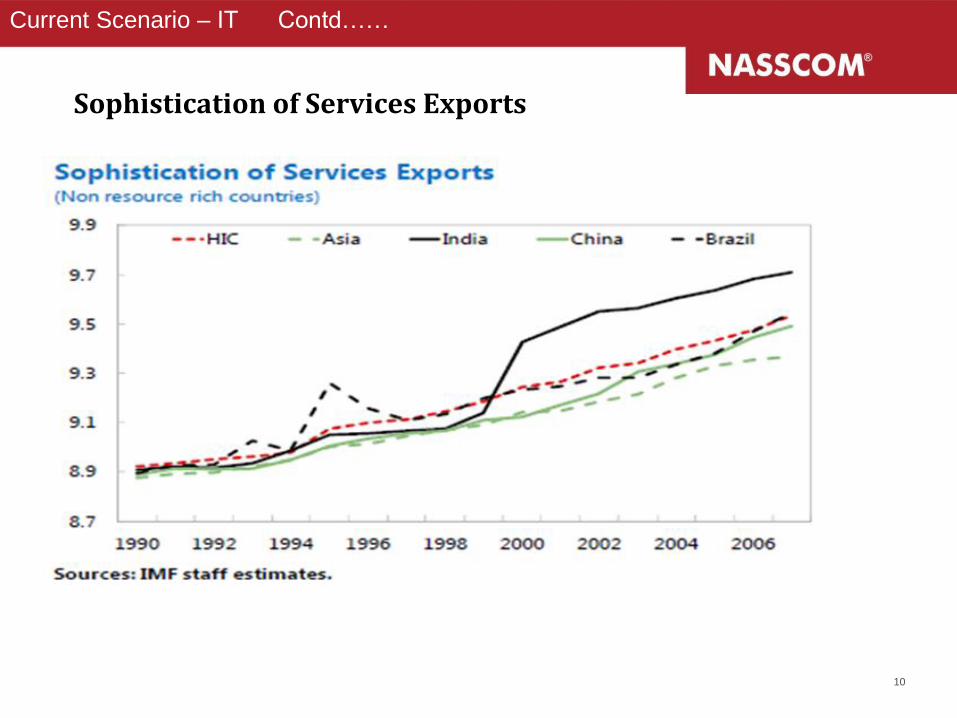
Current Scenario – IT Contd……
Sophistication of Services Exports

11
Trends in Service Exports of India Since 1990
Software+Misc Services (Bus, Fin,
etc.) 44%
Travel 32%
Insurance 2%
Transportation
22%
1990-91 Service Exports = $4,551 million
Misc Services (Bus, Fin, etc.)
22%
Travel 22%
Insurance 2%
Transportation 13%
Software Services
41%
2000-01 Service Exports = $16,268 million
Misc Services (Bus, Fin, etc.)
26%
Travel 12%
Insurance 2%
Transportation 12%
Software Services
48%
2010-11 Service Exports = $1,31972 million

Services Trade – Surprising Resilience
• Experience During Last Crisis (2008)
• Comparison with Manufactures
• Differences Across Service Sectors
• Transport vs Tourism vs Business Services
• Finance vs Insurance
• Supply Side – Low Vulnerability to Credit Squeeze
• Demand Side Features of Business Services
• No inventory or vintage effects
• Less Discretionary Decision-Making
• Long-Term relationships
12 22-Feb-13

Industry moving from “Enterprise service providers”
to “Enterprise solution creators”
Source: CLSA, NASSCOM
DIMENSIONS 1990 2000 2010 onwards
SERVICE DELIVERY
DEALS STRUCTURE
PRICING
RESOURCES
TIME TO DEPLOY
SERVICES
STRUCTURE STRUCTURE STRUCTURE
STRUCTURE STRUCTURE STRUCTURE
STRUCTURE STRUCTURE STRUCTURE
STRUCTURE STRUCTURE STRUCTURE
STRUCTURE STRUCTURE STRUCTURE
STRUCTURE STRUCTURE STRUCTURE
Custom,
People-driven
Input-based,
Fixed costs
Staff augmentation
Years Months Weeks or Days
Industrialised, capacity
and method-driven Capacity and IP-driven
Small deal wins, short
duration. End-to-end
Output-based, fixed
costs or gain share Pay per use
Fixed capacity Non-linear
TECHNOLOGY STRUCTURE STRUCTURE STRUCTURE Mainframe to Client
server
Y2K, dotcom
enablement
Cloud, virtualisation,
Mobile computing
Source: CLSA, NASSCOM
CUSTOMER CENTRIC
Enterprise services Enterprise solutions
Multiple vendors, large
size, long duration
Deals related to CAD/M
and maintainence
One client, one solution

Service providers’ value proposition maturing beyond
cost to delivering business outcome
Source: NASSCOM
Service Providers
<2004 2004-2007 2007-2009
•Asset heavy •Dedicated/captive model
•Time & material •Staff augmentation
•Asset-light •Shared services •Resource sharing •Test Labs •Emergence of Managed services
• Shared, Managed services
• SLA driven •Agile •Cloud, Platform •Test Labs, CoEs • Pay-per-use
Shift to Managed
services
2009-2013
Shift to “Pay Per
Use” model
• Shared, Managed services
• Business Tech Mgmt
•Monetisation of assets/platforms
•XaaS, Cloud, Mobility, Social
•Agile methodology
• Verticalised CoEs • Pay-per-use, Risk-reward
COST
• Labour arbitrage
QUALITY
• Process excellence
MATURITY
VA
LU
E
OUTCOME
• Verticalisation
• Innovation
• Transformation
DIFFERENTIATION
• Lower lifecycle
costs
• Faster time to
market
• Differentiation
Efficient Delivery Effective Outcomes
‘Verticalisation’–Business transformer
1. Organisational Design
Verticalised across business functions –
going beyond sales
2. Organic- Internal Capability
Investments in vertical specific tools and
talent
E.g. Hiring doctors/nurses for domain
intensive healthcare - medical coding etc.
3. Inorganic- Value Additions
Fill vertical specific gaps through
acquisitions or enter newer verticals
E.g. Acquisition of platforms such as Life
Admin / Claim adjudication (Insurance)
4. Alignment of KPIs, metrics
Vertical specific P&L accountability, goals
E.g. Horizontal capabilities such as
analytics getting aligned to verticals

15 22-Feb-13
Effort
based
pricing 3. Technology/
IP
Proprietary
software product
3rd party/
custom s/w
2. Process
expertise
Patented
process
flow
Standard-
ized approach/
process flow
1. Go-to-market
model
Direct sales –
Services
Direct + Indirect (Multi-
product, Multi-
business)
People
factory
2. Talent
deployment
model
Dedicated -
visible
3. Technology
deployment
model
Customer
owned
Multi tenant
– On
demand
1. People
expertise
Industry
recognized thought
leaders
Process/
project mgmt
experts
4. Data and
analytics
Advanced Analytics on
proprietary data
Customer data
management
4. Transaction/
Pricing model Outcome/risk
based pricing
Effort based
pricing
Proprietary
platform
Accelerators/
APIs
Dedicated -
invisible
Team
shared at
account
level
Direct sales – Services +
Solutions/ IP
Direct sales – Services +
Products
Single
tenant –
limited
control
Single
tenant –
full
control
Advanced domain
experts
Basic domain
experts Bench-
marks on
process
metrics
Reposi-
tory of
best
practices
Advanced analytics on
customer data
Basic analytics on
customer data Transaction/
Usage based
pricing
IP based
pricing
Define the business outcome
you want to deliver
Building successful “Alternate Business Models” – leading
to significant shifts in business models
Build the foundational capabilities required to deliver ABM
(1. Consultative selling, 2. Product/IP management, 3. Customer Relationship
management, 4. Alliance/ Partnership management, and 5. Risk management)
NEW SLIDE
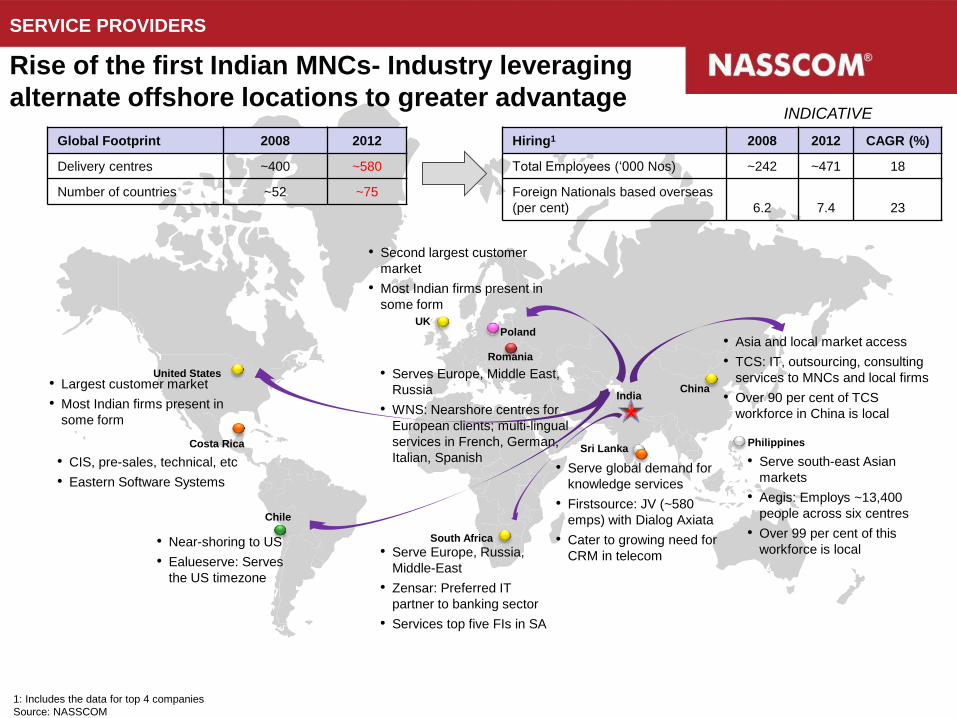
1: Includes the data for top 4 companies
Source: NASSCOM
China India
UK
Romania
Poland
South Africa
United States
Chile
• Serve global demand for
knowledge services
• Firstsource: JV (~580
emps) with Dialog Axiata
• Cater to growing need for
CRM in telecom
• Serves Europe, Middle East,
Russia
• WNS: Nearshore centres for
European clients; multi-lingual
services in French, German,
Italian, Spanish
• Near-shoring to US
• Ealueserve: Serves
the US timezone
Sri Lanka Philippines Costa Rica
• Serve Europe, Russia,
Middle-East
• Zensar: Preferred IT
partner to banking sector
• Services top five FIs in SA
INDICATIVE
SERVICE PROVIDERS
Rise of the first Indian MNCs- Industry leveraging
alternate offshore locations to greater advantage
Global Footprint 2008 2012
Delivery centres ~400 ~580
Number of countries ~52 ~75
Hiring1 2008 2012 CAGR (%)
Total Employees (‘000 Nos) ~242 ~471 18
Foreign Nationals based overseas
(per cent) 6.2 7.4 23
• Serve south-east Asian
markets
• Aegis: Employs ~13,400
people across six centres
• Over 99 per cent of this
workforce is local
• Asia and local market access
• TCS: IT, outsourcing, consulting
services to MNCs and local firms
• Over 90 per cent of TCS
workforce in China is local
• Largest customer market
• Most Indian firms present in
some form
• Second largest customer
market
• Most Indian firms present in
some form
• CIS, pre-sales, technical, etc
• Eastern Software Systems
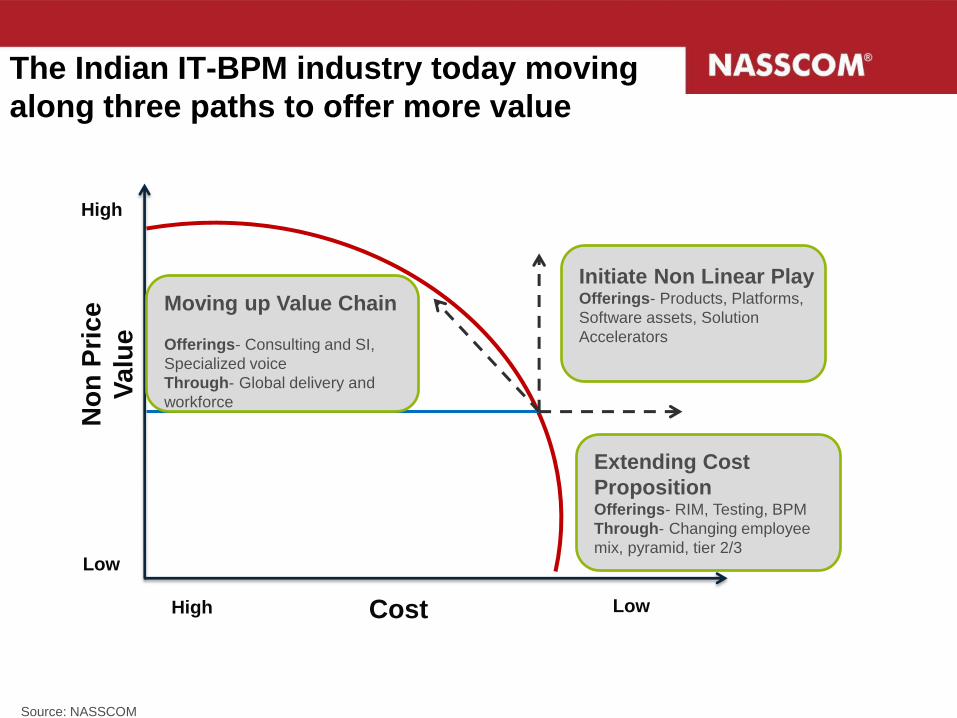
Cost Low
No
n P
ric
e
Va
lue
High
High
Low
Initiate Non Linear Play Offerings- Products, Platforms,
Software assets, Solution
Accelerators
Extending Cost
Proposition Offerings- RIM, Testing, BPM
Through- Changing employee
mix, pyramid, tier 2/3
Moving up Value Chain
Offerings- Consulting and SI,
Specialized voice
Through- Global delivery and
workforce
The Indian IT-BPM industry today moving
along three paths to offer more value
Source: NASSCOM

ER&D Industry - India as Innovation Hub
Evolution of Work Performed in E R&D Industry
• Global Offshorable Revenue of USD
100 Billion by 2020 – Huge untapped
potential
• Developing Products from First
Design Principles (Frugal
Engineering)
• New Business Models, Flexible
Resource Capacity, Co-Creation, Art-
to-Part
• Participation in Patents Creation –
Grown 30x in last 5 years
• Full Product Development
• High end offerings like prototyping,
tooling, manufacturing support,
program management, supplier
management
• Localized products for Emerging
Markets

ER&D exports to cross USD 10 billion; Key players driving product and process innovation
INDIAN IT-BPO INDUSTRY > EXPORTS
Source: NASSCOM
19
CAGR
12%
ER&D Exports by Industry,
FY2012E 100% = USD 10.2 billion
• ER&D exports at USD 10.2 billion; y-o-y growth
of 14 per cent
• ~15 per cent share in Indian IT-BPO exports
• 400+ players with >200,000 engineers
• ~90 per cent exports from North America and
Europe
• Established hub for Aerospace, Automotive and
Telecom
• Emerging as hub for energy and medical
devices
• 65 per cent exports from Telecom,
Semiconductors, Automotive

Focusing on R&D and Boosting Innovation
Growing R&D spend Strengthening role in
IP creation
Developing software
products
Attracting global
technology players
Average R&D
spend 0.5–1% of
revenues; 2.5-5% of
profits
Patents in the
Computer/Electronic
s segment increased
30X over 2005–09
Software products
revenues more than
tripled over FY06–09
• Number of offshore
development centers
(ODCs) in 2009 is 3x-
4x of ODCs in 2006
Breakdown of R&D costs
Spearheaded India’s thrust on innovation –
30X increase in patents
Innovation driving
additional GDP
contribution of ~2%
by 2020
Key initiatives driving innovation include setting up R&D centers, conducting trainings, events
and workshops around innovation, and collaborating with academic institutions
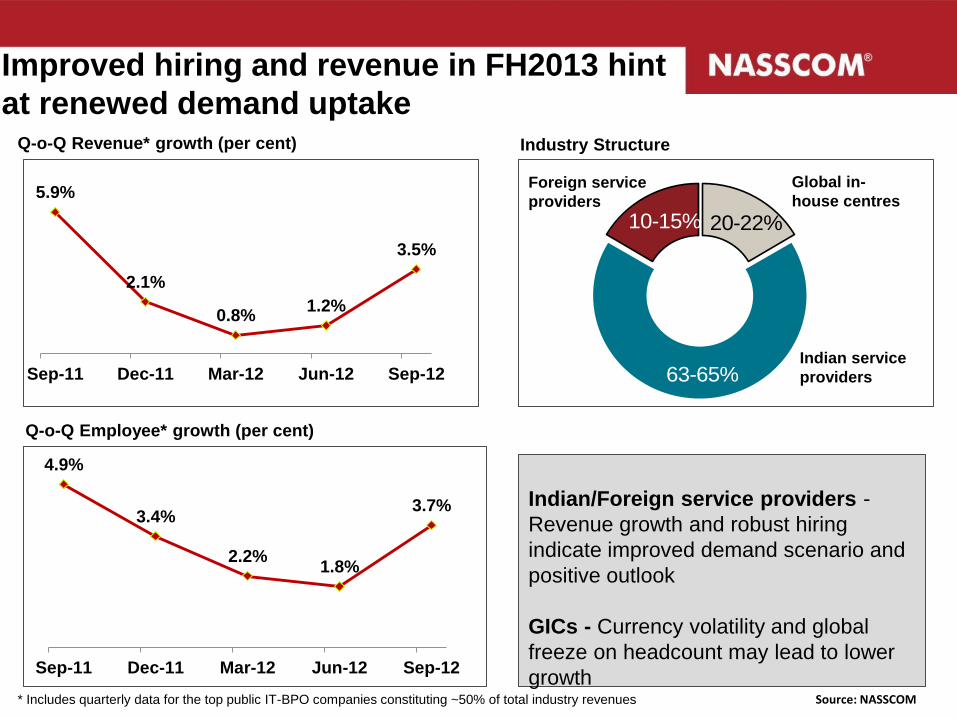
Improved hiring and revenue in FH2013 hint
at renewed demand uptake
5.9%
2.1%
0.8% 1.2%
3.5%
Sep-11 Dec-11 Mar-12 Jun-12 Sep-12
Q-o-Q Revenue* growth (per cent)
4.9%
3.4%
2.2% 1.8%
3.7%
Sep-11 Dec-11 Mar-12 Jun-12 Sep-12
Q-o-Q Employee* growth (per cent)
63-65%
20-22%10-15%
Global in-
house centres
Indian service
providers
Foreign service
providers
Industry Structure
Indian/Foreign service providers -
Revenue growth and robust hiring
indicate improved demand scenario and
positive outlook
GICs - Currency volatility and global
freeze on headcount may lead to lower
growth
* Includes quarterly data for the top public IT-BPO companies constituting ~50% of total industry revenues Source: NASSCOM

“SMAC” – Social Media, Mobility, Analytics and Cloud
reshaping the future of the Indian IT Industry
Impact is highly evident
• Create a new digital
operating model and
transformation to a
permeable enterprise
• Engagement with a
growing digital ecosystem
• Empower enterprises to
embrace emerging
technology trends and to
benefit from the value
expectations of customers
• Innovative thinking in
business and enterprise
architectures
SMAC, is becoming a business reality
Social, mobility, analytics and cloud are reshaping
the business, the consumers and all traditional
approaches, Indian Industry has seen till now
Movement towards the next orbit of innovation with
consumerization of IT
Opportunity to move to higher-margin business
by offering creative solutions
Help businesses grow dynamically instead of
increasingly cutting margins for typical IT contracts
Launching luxury product lines that comprise the
SMAC suite of technologies to go the next level
Huge potential for revenue generation
IDC Indian IT vendors expected to generate over
$225 billion in SMAC related revenue by 2020
Drivers/ factors contributing to the changing landscape of Technology
Transformation
Remodelling business processes
through harmonizing technology
advancement
Client- specific outcomes
A meaningful change in the business
requirements i.e., end-to-end solutions
New paradigm for business
Efficiency, Enhanced customer
experience, Reduced time to market,
Connectivity, IT Consumerization
Journey to the Cloud continues; enthusiasm for Big Data, Mobility and Social Analytics also remains strong
Mobile payments Smart cities Connected Health Pivot merchandising
mBanking mHealth Smart Buildings mGovernance Platform-as-a-Service
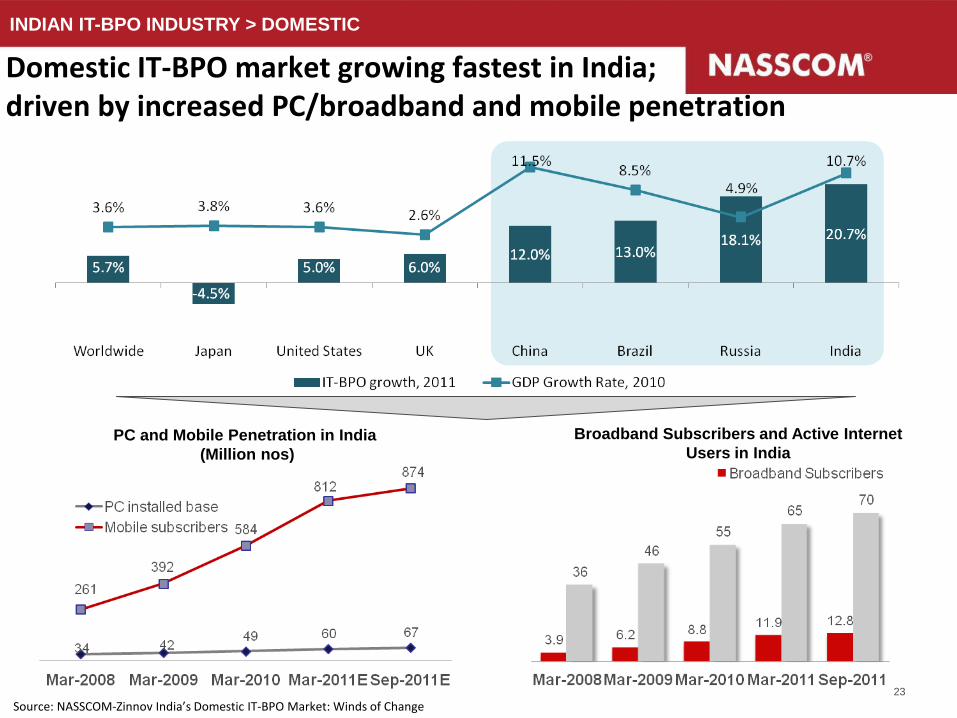
Domestic IT-BPO market growing fastest in India; driven by increased PC/broadband and mobile penetration
INDIAN IT-BPO INDUSTRY > DOMESTIC
23
Source: NASSCOM-Zinnov India’s Domestic IT-BPO Market: Winds of Change
PC and Mobile Penetration in India
(Million nos)
Broadband Subscribers and Active Internet
Users in India

Hypermobility…but only for some ??

25 22-Feb-13
Technology can transform India’s ability to
provide basic services
Basic services Potential technology and services’ solutions
Healthcare 50% of Indians do not have access to primary healthcare –
technology can provide it at half the cost
Financial
services
80% of Indian households are unbanked – technology can
enable access for 200 million families
Education
India faces a 3-fold shortage in teachers – technology can
address this through remote solutions (e.g., virtual
classrooms, recorded lectures by senior faculty, modular
multimedia content)
Public
services
India suffers from a leakage of 40-50% in public food
distribution – technology can ensure transparency
22-Feb-13 25

Inclusive ITeS Innovation Examples
• Mobile Financial Services: EKO
• Mobile Phones for Data and Text
• Rural Development: Ekgaon , Nano Ganesh
• Health Diagnostics (Avoidable Blindness): 3nethra
• Public Health (Maternal & Child Health): e-Mamata
• Travel Services: iXiGO
• Unique Identification System: Aadhar
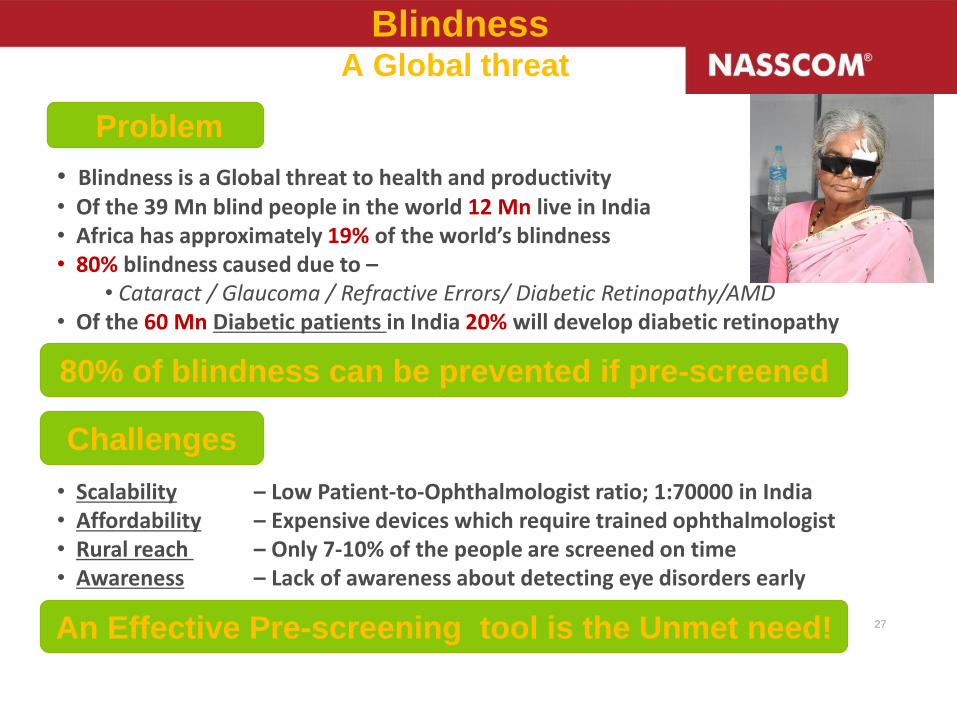
27
Blindness A Global threat
Problem
Challenges
• Blindness is a Global threat to health and productivity • Of the 39 Mn blind people in the world 12 Mn live in India • Africa has approximately 19% of the world’s blindness • 80% blindness caused due to –
• Cataract / Glaucoma / Refractive Errors/ Diabetic Retinopathy/AMD • Of the 60 Mn Diabetic patients in India 20% will develop diabetic retinopathy
• Scalability – Low Patient-to-Ophthalmologist ratio; 1:70000 in India • Affordability – Expensive devices which require trained ophthalmologist • Rural reach – Only 7-10% of the people are screened on time • Awareness – Lack of awareness about detecting eye disorders early
80% of blindness can be prevented if pre-screened
An Effective Pre-screening tool is the Unmet need!

28
Addressing the Unmet Need!
Scalability
• Take the Ophthalmology pre-screening closer to the patient • Create a new market for remote ophthalmology pre-screening – “Paradigm Change” • Enable diagnostic labs, diabetes centers, clinics etc to perform ophthalmology screening
Affordability • Indigenously developed in India • Robust device with minimum complexity • Low maintenance cost and zero consumables
Rural Reach
• Non-Mydriatic, Non-invasive & portable device • Robust system to be operated in rustic environments • Minimally skilled technician required to operate device
Awareness
• Create awareness about the importance of detecting ophthalmic diseases early

Forus 3nethra
A Pre-screening Ophthalmology Device
Cornea Imaging
Retina Imaging
3nethra is an affordable multi-functional portable ophthalmic imaging system
Refractometer

3nethra ForCare
Cloud based Tele-ophthalmology capability
Take Away’s for Policy & Strategy
• IT not just for “big boys” or rich yuppies...can play
transformational role in society, polity and economy
• Refocusing Strategic Priorities for Indian IT in Next Decade
...Domestic Markets and Developing/Emerging Countries
...Not just about Growth, also about Learning
• Affordability, Scalability, Reach and Education/Awareness
Key to Direction of Entrepreneurship & Innovation
• Innovation is More Than R&D, Even D&E of Products
...Service Dimensions and “Business Models” also Salient
• Government Critical to Shaping “Demand” or Ecosystem
• Advance Market Commitment (e.g. Laptops for Students)
• Platforms (e.g. Aadhar)
• Incentives and Regulation
THANK YOU
22-Feb-13
0
0.2
0.4
0.6
0.8
1
1.2
-
20,000
40,000
60,000
80,000
100,000
120,000
140,000
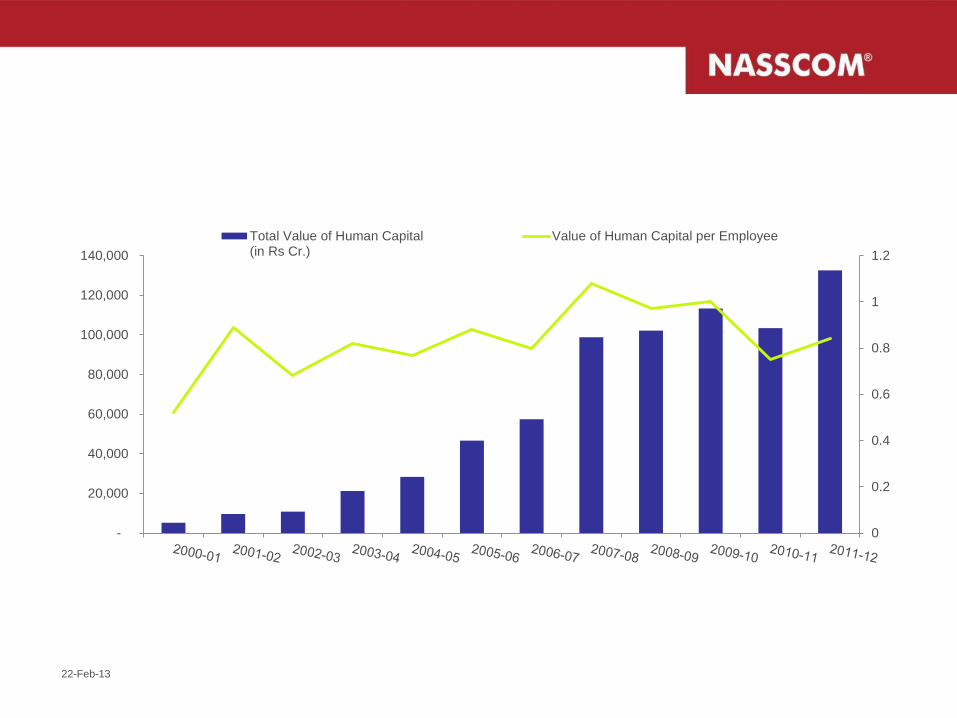
Total Value of Human Capital(in Rs Cr.)
Value of Human Capital per Employee
22-Feb-13
0
0.5
1
1.5
2
2.5
3
3.5
4
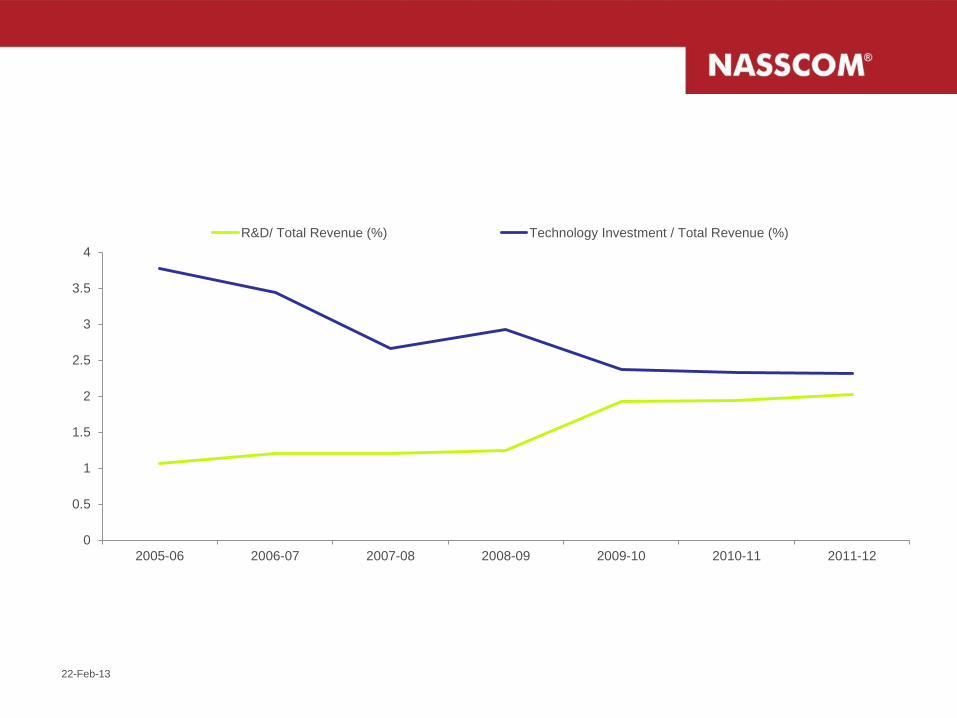
2005-06 2006-07 2007-08 2008-09 2009-10 2010-11 2011-12
R&D/ Total Revenue (%) Technology Investment / Total Revenue (%)

22-Feb-13
0%
5%
10%
15%
20%
25%
30%
35%
40%
45%
50%
-
10,000
20,000
30,000
40,000
50,000
60,000Brand Value (in Rs Cr.) Brand Value as a % of Market Cap


![Working Paper No. 187 - ICRIER | Indian Council for …icrier.org/pdf/Working_Paper_No[1]._187.pdfii Abstract ITES/BPO services is an important and growing component of India’s trade](https://static.documents.pub/doc/80x56/5b0b79727f8b9a61448cc900/working-paper-no-187-icrier-indian-council-for-1187pdfii-abstract-itesbpo.jpg)

