47
Indiabulls Real Estate Limited (CIN : L45101DL2006PLC148314) Earnings Update Audited Financial Results – Q4 FY 2015-16 and FY 2015-16 April 25, 2016
| Date post: | 13-Apr-2018 |
| Category: |
Documents |
| Upload: | truongtruc |
| View: | 217 times |
| Download: | 1 times |
Indiabulls Real Estate Limited (CIN L45101DL2006PLC148314)
Earnings Update
Audited Financial Results ndash Q4 FY 2015-16 and FY 2015-16
April 25 2016
2
Safe Harbour Statement
This document contains certain forward‐looking statements based on current expectations of Indiabulls management Actual results may vary significantly from the forward‐looking statements in this document due to various risks and uncertainties These risks and uncertainties include the effect of economic and political conditions in India and outside India volatility in interest rates and in Securities markets new regulations and government policies that might impact the business of Indiabulls the general state of the Indian economy and the managementrsquos ability to implement the companyrsquos strategy Indiabulls doesnrsquot undertake any obligation to update these forward‐looking statements This document does not constitute an offer or recommendation to buy or sell any securities of Indiabulls or any of its subsidiaries or associate companies This document also doesnrsquot constitute an offer or recommendation to buy or sell any financial products offered by Indiabulls Investor Contact Vijay Nehra investorrelationsindiabullscom +91 22 6189 1404 +91 9004161064
3
Contents
Pg No
1 Overview 4
2 Business Update 9
3 Detailed Financials 12
4 Operations Snapshot 20
5 Balance Sheet 44
4
Overview
5
Indiabulls Housing Finance
Indiabulls Real Estate
Indiabulls Ventures
Indiabulls Group (Combined Networth Rs 19814 Cr)
bull Indiarsquos second largest mortgage finance company in private sector
bull AAA rated company
bull National developer with focus on Mumbai NCR (Delhi) and London
bull 3rd largest real estate company by networth and assets
bull Long term credit rating of AA- highest amongst listed real estate developer peers
bull Offers retail non-discretionary wealth management platform catering to over 07 Mn clients
bull Highest Broker Quality grading of BQ1
bull Operates through separate listed companies (no Group Holding Company) bull No equity cross-holdings
Indiabulls Group Companies
IBREL Journey
2007
Acquired Jupiter Mill and Elphinstone Mill for Rs 772 Cr in Mumbai through open bidding process by NTC
Demerger from Indiabulls Financial Services Ltd Listing on BSE amp NSE
2010 - 11
Purchased the Blu land for Rs 2100 Cr through acquisition of 2 Mills in Worli Mumbai through open bidding process by NTC Credit rating of A+ for Long Term Debt and PR+ for Short Term Loan by CARE
2013-14
Purchase of PE stake for Rs 1172 Cr in some of companiesrsquo projects
2006
2009-10
Delivered the Iconic Commercial Towers of over 3m sft One Indiabulls Centre and Indiabulls Finance Centre
2012 - 13
Buy back of 5 Cr shares
Acquired the prime property 22 Hanover square in Central London for Rs 1630 Cr Raised $ 175m through International Bond International Rating of B+B1B+ by SampPMoodyrsquosFitch respectively Acquired prime land parcel of abt 72 acres in Thane through auction from Voltas for Rs 236 Cr
2014-15
2015-16 Rs 538 Cr Equity Infusion by the Promoter Buy back of international Bond of $ 12279m Rating upgraded to AA- by CARE highest amongst listed Indian real estate companies International rating of B+ (Stable) reaffirmed by SampP Moodyrsquos and Fitch
6 as on 25 April 2016
IBREL ndash One of Indiarsquos leading real estate player
7
Fully paid land bank of 1017 acres in key cities across India
Sufficient for proposed development over the next 7 years
Also possesses 2588 acres of SEZ land at Nashik Maharashtra
11 projects in India with total saleable area of 3051m sq ft
Presence in key Indian metros of Mumbai NCR and Chennai
Ongoing projects
2 new projects to be launched - total saleable area of 729m sq ft
506 m sq ft of saleable residential area amp 223m sq ft of saleable commercial area in NCR
Entered London through acquisition of 22 Hanover Square in Mayfair Central London a 87444 sq ft commercial property in Jul 2014
Planned projects Land bank
475 stake in Indiabulls Properties Investment Trust (ldquoIPITrdquo) a Business Trust listed on SGX
ndash Portfolio comprises over 3m sq ft of completed commercial office space and over 3m sqft of under construction residential space
ndash Accounted as an associate not consolidated with IBREL
IPIT
Knight Frank valuation report of 30th Aug 2014 values the companyrsquos assets base at Rs 20425 Cr Additionally the London acquisition of 22 Hanover Square valued Rs 1630 Cr at cost price refer slide no 24 refer slide no 25
One of the largest real estate players in India with asset base of Rs 22055 Cr and Networth of Rs 7899 Cr
A C B D
Different Buckets of Value
Key markets for IBREL Mumbai Metropolitan Region
Second largest urban agglomeration in India spread over 4355 sq km and a population of 208m
Considered financial capital of the country and state capital of Maharashtra
Availability of talent favorable business environment international air connectivity and quality office developments are the key demand
drivers
Recently completed infrastructure projects including cityrsquos first metro rail Eastern Freeway and SantacruzndashChembur Link Road
National Capital Region
Largest urban agglomeration in India spread over 34144 sq kms and a population of 460m
Political capital of India
Availability of a skilled workforce and a well-developed transportation and telecommunications infrastructure are the key demand drivers
Gurgaon one of the key satellite city of the NCR is an industrial and financial center of Haryana
Amongst the most pronounced ITITES outsourcing and off-shoring hubs in the world
London
London is the largest and most dynamic city in the UK with a 83m population
Economic recovery appetite from overseas investors mortgage availability Government support schemes and the low yields offered by the
other asset classes are the key drivers
London attracts foreign investors due to its lsquosafe havenrsquo status favorable exchange rates the robust and trusted legal system in the UK
Sonepat
Gurgaon
Delhi
Mumbai
Thane
Navi Mumbai
Panvel
Mayfair
London 8
9
Business Update
Business Update
10
Key Financial Highlights FY 2015-16
Q4 FY 15-16 Q3 FY 15-16 Q4 FY 14-15
Total Revenues (Rs Cr) 6846 6815 6307
EBITDA (Rs Cr) 1929 2226 1249
PBT (Rs Cr) 1079 1377 1047
PAT (Rs Cr) 662 900 954
EPS (Rs) 123 174 219
Quarter-on-Quarter (Q-o-Q) Comparison ndash Q4 FY 2015-16 vs Q3 FY 2015-16 and Q4 FY 2014-15
FY 15-16 FY 14-15 Growth
Total Revenues (Rs Cr) 27859 27366 18
EBITDA (Rs Cr) 8599 7081 214
PBT (Rs Cr) 4999 3510 424
PAT (Rs Cr) 3392 2715 249
EPS (Rs) 677 584
Quarter Update
11
Rs in Cr
Net Debt = Gross Debt ndash Cash and Cash Equivalents
Bank Debt Mar16 Dec15 Mar15
Gross Debt 6080 5818 6544
Net Debt 4617 4928 5480
Ratios Marrsquo16 Decrsquo15 Marrsquo15
Fixed Charge Coverage Ratio (FCCR) 267 251 277
Net DebtEquity 058 064 076
FCCR is the ratio of lsquoConsolidated EBITDArsquo for last four recent completed quarters to the Consolidated Interest Expense for the period =gt lsquoConsolidated EBITDArsquo is calculated by adding back depreciation and amortisation expenses finance costs and non-cash land and common cost to profit before tax and is a Non Indian GAAP measure
New Sales of Rs 626 Cr during the quarter
Net debt reduced by Rs 311 Cr in Q4FY16
Achieved Net debt of Rs 4617 Cr as on 31st Mar 2016 as against the target of Rs 4800 Cr
16 YOY reduction in Net debt during FY 15-16 Overall reduced Net debt by Rs 863 Cr
during FY16 down to Rs 4617 Cr on 31st Marrsquo16 from Rs 5480 Cr as on 31st Marrsquo15
12
Detailed Financials
Balance Sheet Abstract - Consolidated
13
Particulars FY16 FY15
Shareholders Fund 789937 720348
Non-Current Liabilities 509394 568841
Current Liabilities 412542 395309
Total Equity and Liabilities 1711873 1684498
Non-Current Assets 605843 687799
Current Assets 1106030 996699
Total Assets 1711873 1684498
Amount in Rs Crores
Cash Flow ndash Abstract (Consolidated)
14
Amount in Rs Crores
Particulars Q4FY16 Q3FY16 Q4FY15 FY16 FY15
Opening Cash and Cash Equivalents (incl Short- term Liquid Investments)
87482 68169 162871 100355 38488
Operating Cash Flows 24217 40311 (24461) 90138 (282981)
Investing Cash Flows 5291 2045 (6418) 17314 9073
Financing Cash Flows 23240 (23043) (31637) (67577) 335775
Closing Cash and Bank Balance (incl Short-term Liquid Investments)
140230 87482 100355 140230 100355
Liabilities ndash Abstract (Consolidated)
15
Amount in Rs Crores
Particulars FY16 FY15
Long term borrowings 491316 549763
Deferred tax liabilities - 115
Other Long term Liabilities 17573 18508
Long-term provisions 505 455
Total Non-Current Liabilities 509394 568841
Short-term borrowings 26300 40100
Trade payables 24376 20210
Other current liabilities 348999 327396
Short-term provisions 12867 7603
Total Current Liabilities 412542 395309
Assets ndash Abstract (Consolidated) Amount in Rs Crores
16
Particulars FY16 FY15
Fixed assets 10421 23893
Investment in Associate (IPIT) 350136 350688
Non-current investmentsadvances 231025 301858
Deferred tax assets 8185 5330
Other non-current assets 6076 6030
Total Non-Current Assets 605843 687799
Cash and bank 124317 66943
Current Investments 15913 33412
Trade receivables (including unbilled) 303132 201310
Inventories 541524 601411
Short-term loans and advances 118588 91702
Other current assets 2556 1921
Total Current Assets 1106030 996699
Profit amp Loss Account ndash Abstract (Consolidated)
17
Amount in Rs Crores
Particulars Q4FY16 Q3FY16 Q4FY15 FY16 FY15
Revenue from Operations 61769 65862 59112 261462 259078
Other Operating Revenues 5130 575 2305 6272 5034
Operating Revenues 66899 66437 61417 267734 264112
Non Operating Income 1563 1712 1654 10851 9548
Total Revenues 68462 68149 63071 278585 273660
EBITDA (Excluding Non Operating Income) 17575 20420 13098 74923 61124
Profit Before Tax 10948 13894 8206 50210 35237
Profit After Tax 6779 9130 7279 34134 27285
Diluted EPS (Rs) 123 174 219 676 583
Key Financial Parameters
18
Particulars FY16 FY15 FY14
EBITDA Margin (Including Non Operating Income Total Revenue) 3079 2582 3193
EBITDA Margin (Excluding Non Operating Income Total Operating Income) 2798 2196 2942
Profit After Tax Margin 1225 997 1125
Net DebtEquity 058 076 035
Net Surplus of Rs 19676 Cr expected by 2019 (refer slide 26)
Shareholding Pattern
19
Category 01-Apr-16 31-Dec-15 30-Sep-15 30-Jun-15 31-Mar-15
Promoter Holding 3921 3347 3347 2773 2773
Treasury Stock 842 921 921 1000 1000
Foreign Institutional Investors (FIIs) Foreign Shareholding 1808 2011 1920 3118 2647
Domestic Institutional Investors 179 202 158 233 127
Other public shareholders 3250 3519 3654 2876 3453
20
Operations Snapshot
Completed Projects
Indiabulls Finance Centre ndash Mumbai (156 lac sft)
One Indiabulls Centre ndash Mumbai (165 lac sft)
21
Completed Projects (Contd)
Indiabulls Centrum ndash Madurai (16 lac sft)
Indiabulls Centrum Park ndash Gurgaon Phase 1 (48 lac sft) 22
Sky 882 Lower Parel (4 lac sft)
Completed Projects (Contd)
Indiabulls Mint ndash Thane (06 lac sft)
Indiabulls Greens ndash Chennai Phase 1 (45 lac sft)
Vatika ndash Ahmedabad (16 lac sft)
Mega Mall ndash Vadodara (23 lac sft)
23
Snapshot ndash Ongoing Projects (A)
Project Location Type Launched Area (m sq ft)
Gross Development
Value (INR Cr)
Expected first handover
Month
IBREL Ongoing Projects Blu Worli Mumbai Residential (Luxury) 121 6432 Mar 17
Indiabulls Greens Panvel Mumbai Residential (Premium) 873 4459 Ready to start Handover
Indiabulls Golf City Savroli Mumbai Residential (Premium) 522 3168 Aug 16
Centrum Park Gurgaon NCR Residential (Mid Income) 216 915 Handover
started
Enigma Gurgaon NCR Residential (Premium) 176 1130 Oct 16
Indiabulls Greens Chennai Chennai Residential (Mid Income) 207 828 Nov 16
Indiabulls City Sonepat NCR Residential (Plot) 176 254 Handover started
One Indiabulls Gurgaon NCR Residential (Premium) 615 4922 Mar 19
One Indiabulls Vadodara Vadodara Commercial 023 83 Mar 17
Indiabulls One 09 Gurgaon Commercial 096 768 Mar 18
Silverlake Villas Alibaug Mumbai High end Villas (Luxury) 026 164 Mar 18
IBREL Projects Total 3051 23123 IPIT Ongoing Projects Sky Forest Lower Parel Mumbai Residential (Luxury) 150 3936 Dec 18
Sky Suites Lower Parel Mumbai Residential (Luxury) 140 3804 Dec 19
IPIT Projects Total 290 7740 =gtAbove includes only ongoing projects and does not include the potential GDV of projects that will be planned in future on the land bank in possession amp fully paid for
24
Snapshot ndash Planned Projects (B)
=gtAbove includes only projects currently planned and does not include the potential GDV of projects that will be planned in future on the land bank in possession amp fully paid for
Project Location Type Launched Area (m sq ft)
Gross Development
Value (INR Cr)
Expected first handover
month
Planned Projects
Indiabulls Mint Gurgaon (Sec 104) NCR Commercial - 031 310 Mar 19
Indiabulls Imperial Gurgaon (Sec 106) NCR Residential
Commercial (Premium) - 698 5933 Mar 18
22 Hanover Square London Residential Hotel (Luxury) - 010 5200 Mar 19
Total - Planned Projects 739 11443
25
Summary of Ongoing amp Planned Projects (A amp B)
Summary Snapshot Rs Cr Pending Collection from Sold Inventory (a) 4136
Pending Construction Cost (b) 8130
Value of Unsold Inventory (c) 23670
Net Surplus (a+c-b) 19676
Expected Net Surplus of Rs 19676 Cr by 2019
=gt Above includes only ongoing amp planned projects and does not include the potential GDV of projects that will be planned in future on the land bank in possession amp fully paid for
=gtThis does not include assets under IPIT ndash 2 commercial and 3 residential properties of cumulative area over of 3m sft of office space amp over 3m sft of residential area under construction
26
Portfolio Diversification
GDV Spread across Locations GDV Spread across Segments
Total Gross Development Value of Rs 34566 Cr
Mumbai Metropolitan
Region 41
National Capital Region
41
Central London 15
Others 2
Super Premium Luxury
34
Premium 60
Mid-Income 6
=gtAbove includes only ongoing amp planned projects and does not include the potential GDV of projects that will be planned in future on the land bank in possession amp fully paid for rArrThis does not include assets under IPIT ndash 2 commercial and 3 residential properties of cumulative area over of 3m sft of office space amp over 3m sft of residential area under construction 27
Blu Worli
Project location
WORLI CIRCLE
One Indiabulls
Worli
Location Worli Mumbai
Total area (Acres) 100
Estimated total saleable area (m sqft) 121
Estimated total units 345
Expected first handover month Mar-17
Key amenities
5 acre landscape garden 1 km jogging and walking track
championship size football field swimming pool and state-of-the-
art gymnasium
121 lac sqft
28
Indiabulls Greens Panvel
Project location
Location Panvel Navi Mumbai
Total area (Acres) 523
Estimated total saleable area (m sqft) 873
Estimated total units 6701
Expected first handover month Phase 1 Ready to start Handover
Amenities
Dedicated sports facilities shopping centers restaurants
banks pharmacies amp a post office Spa with Jacuzzi steam
sauna and massage room
Proposed International Airport
McDonalds Kalamboli Circle MGM Hospital
Khandeswar Railway Station
Klamboli Railway Station
Panvel Railway Station
Hotal Natraj
To Pune Palaspa Phata
Somathane Railway Station
To Goa
Datta Guru Snacks
To Rasayani
ONGC Colony
To JNPT
873 lac sqft
29
Indiabulls Golf City Savroli
Project location
30
Location Savroli Navi Mumbai
Total area (Acres) 1100
Estimated total saleable area (m sqft) 522
Estimated total units 4016
Expected first handover month Aug-16
Key amenities
An 18 hole golf course leisure swimming pool sports training
academies and amenities lavish entertainment and
shopping precinct advanced home automation and security
systems 522 lac sqft
LONAVALA KHALAPUR TOLL BOOTH
GREENS PANVEL
NAVI MUMBAI INTERNATIONAL AIRPORT GOLF CITY
TOWARDS PUNE
VIA MUMBAI-PUNE EXPRESSWAY
MUMBAI
Centrum Park Gurgaon
Project location
31
Location Gurgaon (Sector 103)
Total area (Acres) 221
Estimated total saleable area (m sqft) 216
Estimated total units 1037
Expected first handover month Phase 1 Handover Started
Amenities Clubhouse fully equipped
gymnasium yoga and aerobics lounge salon amp spa
216 lac sqft
Centrum Park
115
114
112
113
109 106
107
108
110 111 105 104 101
102
102A 103
110A
2 1 Palam Vihar
33 23
3
5
6
4
3A
9 7
9A
Amunation Depot
8 12
12A
11
14 17
16
39
22 21
20 18
19
To Delhi
To Delhi
To Delhi
To Delhi
Metro route from Dwarka Along 150 mtr wide road
24 25
28
27 25
25A
42
44 45
40 41
South City
39
46 47
49
66
32 30 IFFCO CHOWK
DLF PH-11
DLF PH-11
DLF PH-1
ATUL KATARI CHOWK Fountain Chowk
Proposed DWARKA MANESAR 150mtr Expressway
South City-II
Malibu Town
CHOWK
72 48
77
69 70A
70
74
75
72 A
73
35 34 33
37 36 10A
10
37C
37A 37B
37D
100
99
Honda Chowk
74 A 75
A
77
78
79
87
84
88
89
85
82
81
86
90
97
96 92
91
87
95
98
97
96
M-1
M-1A
METRO STATION
M-5
M-6 PROPOSED BIGGEST ISBT
M-15
M-14
M-13 M-9
M-8
M-3A
M-11 M-10
MANESAR
M-12
GURGAON
DLF PH-IV
SULTANPUR BIRD SANCTUARY
Enigma Gurgaon
Project location
Location Gurgaon (Sector 110)
Total area (Acres) 199
Estimated total area (m sqft) 176
Estimated total units 479
Expected first handover month Oct-16
Amenities Landscaped garden high
speed elevators and state-of-the-art gymnasium
176 lac sqft
32
Indiabulls Greens Chennai
Project location
Chennai Airport
Tidel Park American School
IT - Chennai Vijaynagar Bus
Terminal
Velachery RS MATS
Perungudi Lake
Chrompet
Pallavaram Tirusulam
Meenambakkam Pazavanthangal
Chrompet
Chitlapakkam Lake
Dr Boaz Memorial Hospital
Hastinapuram Lake Medavakkam High Road
Dr Kamakshi Memorial Hospital
CTS
National Institute of Ocean Technology
Balaji Dental College
STJohns Public School
Bharathi Vidhya Mandir
Infosys
Global Health City
Sathyabama University Saint Joseph College
Bay
of B
enga
l
Gateway School
Sri Pratyangira Devi Temple
Elcot Sez
Thorapakkam
Cognizant CTS TCS
Satyam
Tata Consultancy
Accenture Wipro
Satyam
Satyam
LEGEND Distances (Approx) St Johns Public School 300m Bharathi Vidyala Mandir 700m Gateway School 1km Global Hospital 1km Distance from Main Road 500m Distance from Medavakkam Junction 1km Distance from OMR Sholinganallur 35km Prithyangara Devi Temple 4km ECR Beach 45km
Location Chennai
Total area (Acres) 159
Estimated total saleable area (m sqft) 207
Estimated total units 1611
Expected first handover month Phase 1 handed over amp Phase 2 expected to start by Nov-16
Amenities Pool Jacuzzi landscaped
garden high speed elevators amp state-of-the-art gymnasium
207 lac sqft
33
Indiabulls City Sonepat
Project location
N
IB City
P-I Zone Delhi
P-II Zone Delhi
To Delhi
To Delhi
Proposed Rajiv Gandhi
Education City
Location Sonepat
Total area (Acres) 1065
Estimated total area (m sqft) 176
Estimated total units (Plots) 755
Expected first handover month Handover started
176 lac sqft
34
One Indiabulls Gurgaon
Project location
Location Gurgaon (Sector 104)
Total area (Acres) 340
Estimated total saleable area (m sqft) 615
Estimated total units 2000
Expected first handover month Mar-19
Amenities
Lap pool Jacuzzi landscaped garden high speed elevators
and state-of-the-art gymnasium
615 lac sqft
35
Indiabulls One 09 Gurgaon
Project location
96 lac sqft
Location Gurgaon (Sector 109)
Total area (Acres) 59
Estimated total saleable area (m sqft) 096
Estimated total units 352
Expected first handover month Mar-18
36
Silverlake Villas Alibaug
Project location 26 lac sqft
Location Alibaug
Total area (Acres) 73
Estimated total saleable area (m sqft) 026
Estimated total units 34
Expected first handover month Mar-18
37
Sky Forest Lower Parel
Project location 15 lac sqft
Location Lower Parel Mumbai
Total area (Acres) (mixed use development) 97
Estimated total saleable area (m sqft) 150
Estimated total units 442
Expected first handover month Dec-18
Key amenities
120000 sqft of landscaped podium and club
swimming pool and state-of-the-art gymnasium
mini-theatre
38
Sky Suites Lower Parel
Project location 14 lac sqft
Location Lower Parel Mumbai
Total area (Acres) (mixed use development) 78
Estimated total saleable area (m sqft) 140
Estimated total units 279
Expected first handover month Dec-19
Key amenities
100000 sqft of landscaped podium and club
swimming pool and state-of-the-art gymnasium
39
Planned launches ndash Indiabulls Mint Gurgaon
bull A commercial project located in Sector 104 Gurgaon Its has a direct access from Dwarka Manesar Expressway and very close the Domestic and the International Airports
bull Net development area of 212 acres
bull The total saleable area of the project is 031m sqft
bull Currently under planning and expected to be launched in FY17
bull The project has GDV of about Rs 310 Cr
One Indiabulls Gurgaon
South Delhi
Palam Vihar
Dwarka
To Delhi
IGI Airport
Project location
Project details
40 31 lac sqft
Planned launches ndash Indiabulls Imperial Gurgaon
bull Includes residential (luxury) and commercial project located in Sector 106 Gurgaon It has a direct access from 60m wide road and very close to Dwarka Manesar Expressway Domestic and the International Airport
bull Net development area of 241 acres and 111 acres for residential and commercial sections respectively
bull The residential project includes 1700 apartments divided into 2 3 4 BHK amp Penthouses configuration and commercial project includes 347 shops and 706 office spaces
bull Currently under planning and expected to be launched by FY17
bull The project has GDV of about Rs 5933 Cr
Project details
Project location
South Delhi
IGI Airport
Dwarka
Palam Vihar
Sec-42
Metro line Delhi border Proposed development
MG road Qutub Minar IIT
JNU
R a o T u l a r a m
M a r g
Nelson Mandela Road Emporio
Vasant Vihar Ryan International School Radisson
Hotel Shiv Murti
Rajokri
Sec-27 Sec-28
Mega Mall Hotel Bristol
Sushant Lok
Courtyard Marriott
Park Plaza Max Hospital
Artemis Hospital
Delhi Public School Sec-46 Sec-45 Sec-44
Cyber Park Sec-40 Huda City
Centre Stn
Hotel Crowne Plaza
IFFCO Chowk Stn
Hotel Westin Signature Tower
Rajiv Chowk Sec-33
Hero Honda Chowk
NH 8
NH 8
Sec-34
Haldiram Toll Plaza
To Jaipur
NH 8
DT City Centre Sikanderpur Metro Stn
Cyber City Hotel Leela Kempinski
Ambience Mall
NH 8 IFFCO Chowk
Sukhrali The Oberoi
Shankar Chowk Hotel Uppalrsquos Orchid NH 8
Aero City Hospitality Commercial amp Retail Zone
Delhi Cantt
NH 8 Delhi University South Campus
To Delhi
Dhaula Kuan
Centaur Hotel Kapashera Crossing
Terminal 3
Old Delhi Gurgaon Road
Columbia Asia Hospital
Sec-111 Sec-110 Sec-105 Sec-104 Sec-101 Sec-100
Dwarka Expressway
Sec-99 A Sec-99 Sec-88 B
Sec-88 A
Sec-88
Sec-84
Sec-83 Proposed ISBT
N
Mini Secretariat
Bata Chowk
Sec-102 Sec-102A Sec-103
Sec-106 Sec-112 Sec-113
Golf Course Diplomatic Enclave Sec-22
Sec-21
Sec-23 Sec-20
OPG World School
Sec-8 Sec-9
Sec-5 Sec-10
Sec-3
GD Goenka School
Sec-1
Sec-12
Sec-108 Sec-115
Delhirsquos Reserved Green Zone
Residential Area
Fortis Hospital Travel Time
Diplomatic Enclave Dwaraka IGI Airport NH-8 Dhaula Kuan
5 minutes 10 minutes 15 minutes 20 minutes
41
42
Indiabulls Foundation Corporate Social Responsibility
Free four medical clinics to provide primary and preventive health care to the underprivileged Jan Swasthya Kalyan Vahika vehicles 9 Mobile medical vans provide free primary healthcare services to nearly 250000 patients every year Cleft deformity surgery for 1200 children across 6 states in partnership with Smile Train an international childrenrsquos charity
Health
Womenrsquos Health
Free sanitary napkins to promote hygiene and sanitation amongst rural women About 30000 underprivileged and rural women have benefitted from this initiative
Free Paushtik Aahar (nutrition supplements) to 5000 underprivileged malnourished individuals every month and regular monitoring of their health weight and height Support to women self-help groups to make Paushtik Aahar (nutritional supplements) and provide sustainable employment options to the underprivileged
Nutrition
Computer Literacy Program
In order to improve IT literacy amongst underprivileged population contributed 1000 computers to tribal ashram schools shelter homes and night schools in Mumbai Thane Raigarh and Palghar districts of Maharashtra
43
Indiabulls Foundation Corporate Social Responsibility
Education and Development
Awarded scholarships to 365 meritorious amp deserving students from economically challenged background to pursue higher education after 12th standard
Rural Empowerment
Implemented water project called lsquoRahatrsquo at 3 Tribal Ashram Schools where there was acute scarcity of water Over 2500 children from these tribal schools will benefit from this initiative every year
Indiabulls Foundation E-learning
(IBFE)
Tie-up with MKCL (Maharashtra Knowledge Corporation Ltd) authorized computer centers to help impart basic IT literacy to rural youth
Equipped 31 ashram schools with sophisticated e-learning methods to enhance the quality of education in rural Maharashtra
Installed Renewable Energy Plants at 5 tribal ashram schools in Maharashtra These plants will provide free of cost round-the-clock seamless electricity to these schools for 25 years absolutely free of cost
Started Sport Excellence Program to support athletes and provide them with world class training facilities
Disaster Relief During the Chennai floods provided timely relief to 1500 The nutritional supplement is a ready to eat mixture providing well needed nourishment to the Chennai flood affected
44
Balance Sheet
Consolidated Balance Sheet
45
Statement of Assets and Liabilities (Consolidated) (Rs Crore)As at March 31
2016 (Audited)
As at March 31 2015
(Audited)Shareholders FundsShare Capital 9234 8500 Reserves and Surplus 745999 708529 Money received against share warrants 29212 -
784445 717029 Minority Interest 5493 3319 Non Current LiabilitiesTerm Loans NCDs from Banks 473013 530353 Against OCDs CCDs 18303 19410 Deferred Tax Liabilities - 115 Other Long term liabilities 17573 18508 Long-term provisions 505 455
509394 568841 Current LiabilitiesShort-term Borrowings 26300 40100 Trade Payables 24376 20210 Other current liabilities 348999 327395 Short-term provisions 12867 7603
412542 395308 Total 1711874 1684497
ASSETSFixed AssetsTangible assets 10361 11183 Intangible assets 057 039
Capital work in progress 003 12671 10421 23893
Non Current AssetsNon-current investments 547538 549470 Deferred Tax Assets 8185 5330 Long-term loans and advances 33623 103077 Other non-current assets 6076 6030
595422 663907 Current AssetsCurrent Investments 15913 33412 Inventories 541524 601409 Trade Receivables 47645 15940 Cash and bank balances 124317 66943 Short-term loans and advances 118588 91702 Other current assets 258044 187291
1106031 996697 Total 1711874 1684497
3
Contents
Pg No
1 Overview 4
2 Business Update 9
3 Detailed Financials 12
4 Operations Snapshot 20
5 Balance Sheet 44
4
Overview
5
Indiabulls Housing Finance
Indiabulls Real Estate
Indiabulls Ventures
Indiabulls Group (Combined Networth Rs 19814 Cr)
bull Indiarsquos second largest mortgage finance company in private sector
bull AAA rated company
bull National developer with focus on Mumbai NCR (Delhi) and London
bull 3rd largest real estate company by networth and assets
bull Long term credit rating of AA- highest amongst listed real estate developer peers
bull Offers retail non-discretionary wealth management platform catering to over 07 Mn clients
bull Highest Broker Quality grading of BQ1
bull Operates through separate listed companies (no Group Holding Company) bull No equity cross-holdings
Indiabulls Group Companies
IBREL Journey
2007
Acquired Jupiter Mill and Elphinstone Mill for Rs 772 Cr in Mumbai through open bidding process by NTC
Demerger from Indiabulls Financial Services Ltd Listing on BSE amp NSE
2010 - 11
Purchased the Blu land for Rs 2100 Cr through acquisition of 2 Mills in Worli Mumbai through open bidding process by NTC Credit rating of A+ for Long Term Debt and PR+ for Short Term Loan by CARE
2013-14
Purchase of PE stake for Rs 1172 Cr in some of companiesrsquo projects
2006
2009-10
Delivered the Iconic Commercial Towers of over 3m sft One Indiabulls Centre and Indiabulls Finance Centre
2012 - 13
Buy back of 5 Cr shares
Acquired the prime property 22 Hanover square in Central London for Rs 1630 Cr Raised $ 175m through International Bond International Rating of B+B1B+ by SampPMoodyrsquosFitch respectively Acquired prime land parcel of abt 72 acres in Thane through auction from Voltas for Rs 236 Cr
2014-15
2015-16 Rs 538 Cr Equity Infusion by the Promoter Buy back of international Bond of $ 12279m Rating upgraded to AA- by CARE highest amongst listed Indian real estate companies International rating of B+ (Stable) reaffirmed by SampP Moodyrsquos and Fitch
6 as on 25 April 2016
IBREL ndash One of Indiarsquos leading real estate player
7
Fully paid land bank of 1017 acres in key cities across India
Sufficient for proposed development over the next 7 years
Also possesses 2588 acres of SEZ land at Nashik Maharashtra
11 projects in India with total saleable area of 3051m sq ft
Presence in key Indian metros of Mumbai NCR and Chennai
Ongoing projects
2 new projects to be launched - total saleable area of 729m sq ft
506 m sq ft of saleable residential area amp 223m sq ft of saleable commercial area in NCR
Entered London through acquisition of 22 Hanover Square in Mayfair Central London a 87444 sq ft commercial property in Jul 2014
Planned projects Land bank
475 stake in Indiabulls Properties Investment Trust (ldquoIPITrdquo) a Business Trust listed on SGX
ndash Portfolio comprises over 3m sq ft of completed commercial office space and over 3m sqft of under construction residential space
ndash Accounted as an associate not consolidated with IBREL
IPIT
Knight Frank valuation report of 30th Aug 2014 values the companyrsquos assets base at Rs 20425 Cr Additionally the London acquisition of 22 Hanover Square valued Rs 1630 Cr at cost price refer slide no 24 refer slide no 25
One of the largest real estate players in India with asset base of Rs 22055 Cr and Networth of Rs 7899 Cr
A C B D
Different Buckets of Value
Key markets for IBREL Mumbai Metropolitan Region
Second largest urban agglomeration in India spread over 4355 sq km and a population of 208m
Considered financial capital of the country and state capital of Maharashtra
Availability of talent favorable business environment international air connectivity and quality office developments are the key demand
drivers
Recently completed infrastructure projects including cityrsquos first metro rail Eastern Freeway and SantacruzndashChembur Link Road
National Capital Region
Largest urban agglomeration in India spread over 34144 sq kms and a population of 460m
Political capital of India
Availability of a skilled workforce and a well-developed transportation and telecommunications infrastructure are the key demand drivers
Gurgaon one of the key satellite city of the NCR is an industrial and financial center of Haryana
Amongst the most pronounced ITITES outsourcing and off-shoring hubs in the world
London
London is the largest and most dynamic city in the UK with a 83m population
Economic recovery appetite from overseas investors mortgage availability Government support schemes and the low yields offered by the
other asset classes are the key drivers
London attracts foreign investors due to its lsquosafe havenrsquo status favorable exchange rates the robust and trusted legal system in the UK
Sonepat
Gurgaon
Delhi
Mumbai
Thane
Navi Mumbai
Panvel
Mayfair
London 8
9
Business Update
Business Update
10
Key Financial Highlights FY 2015-16
Q4 FY 15-16 Q3 FY 15-16 Q4 FY 14-15
Total Revenues (Rs Cr) 6846 6815 6307
EBITDA (Rs Cr) 1929 2226 1249
PBT (Rs Cr) 1079 1377 1047
PAT (Rs Cr) 662 900 954
EPS (Rs) 123 174 219
Quarter-on-Quarter (Q-o-Q) Comparison ndash Q4 FY 2015-16 vs Q3 FY 2015-16 and Q4 FY 2014-15
FY 15-16 FY 14-15 Growth
Total Revenues (Rs Cr) 27859 27366 18
EBITDA (Rs Cr) 8599 7081 214
PBT (Rs Cr) 4999 3510 424
PAT (Rs Cr) 3392 2715 249
EPS (Rs) 677 584
Quarter Update
11
Rs in Cr
Net Debt = Gross Debt ndash Cash and Cash Equivalents
Bank Debt Mar16 Dec15 Mar15
Gross Debt 6080 5818 6544
Net Debt 4617 4928 5480
Ratios Marrsquo16 Decrsquo15 Marrsquo15
Fixed Charge Coverage Ratio (FCCR) 267 251 277
Net DebtEquity 058 064 076
FCCR is the ratio of lsquoConsolidated EBITDArsquo for last four recent completed quarters to the Consolidated Interest Expense for the period =gt lsquoConsolidated EBITDArsquo is calculated by adding back depreciation and amortisation expenses finance costs and non-cash land and common cost to profit before tax and is a Non Indian GAAP measure
New Sales of Rs 626 Cr during the quarter
Net debt reduced by Rs 311 Cr in Q4FY16
Achieved Net debt of Rs 4617 Cr as on 31st Mar 2016 as against the target of Rs 4800 Cr
16 YOY reduction in Net debt during FY 15-16 Overall reduced Net debt by Rs 863 Cr
during FY16 down to Rs 4617 Cr on 31st Marrsquo16 from Rs 5480 Cr as on 31st Marrsquo15
12
Detailed Financials
Balance Sheet Abstract - Consolidated
13
Particulars FY16 FY15
Shareholders Fund 789937 720348
Non-Current Liabilities 509394 568841
Current Liabilities 412542 395309
Total Equity and Liabilities 1711873 1684498
Non-Current Assets 605843 687799
Current Assets 1106030 996699
Total Assets 1711873 1684498
Amount in Rs Crores
Cash Flow ndash Abstract (Consolidated)
14
Amount in Rs Crores
Particulars Q4FY16 Q3FY16 Q4FY15 FY16 FY15
Opening Cash and Cash Equivalents (incl Short- term Liquid Investments)
87482 68169 162871 100355 38488
Operating Cash Flows 24217 40311 (24461) 90138 (282981)
Investing Cash Flows 5291 2045 (6418) 17314 9073
Financing Cash Flows 23240 (23043) (31637) (67577) 335775
Closing Cash and Bank Balance (incl Short-term Liquid Investments)
140230 87482 100355 140230 100355
Liabilities ndash Abstract (Consolidated)
15
Amount in Rs Crores
Particulars FY16 FY15
Long term borrowings 491316 549763
Deferred tax liabilities - 115
Other Long term Liabilities 17573 18508
Long-term provisions 505 455
Total Non-Current Liabilities 509394 568841
Short-term borrowings 26300 40100
Trade payables 24376 20210
Other current liabilities 348999 327396
Short-term provisions 12867 7603
Total Current Liabilities 412542 395309
Assets ndash Abstract (Consolidated) Amount in Rs Crores
16
Particulars FY16 FY15
Fixed assets 10421 23893
Investment in Associate (IPIT) 350136 350688
Non-current investmentsadvances 231025 301858
Deferred tax assets 8185 5330
Other non-current assets 6076 6030
Total Non-Current Assets 605843 687799
Cash and bank 124317 66943
Current Investments 15913 33412
Trade receivables (including unbilled) 303132 201310
Inventories 541524 601411
Short-term loans and advances 118588 91702
Other current assets 2556 1921
Total Current Assets 1106030 996699
Profit amp Loss Account ndash Abstract (Consolidated)
17
Amount in Rs Crores
Particulars Q4FY16 Q3FY16 Q4FY15 FY16 FY15
Revenue from Operations 61769 65862 59112 261462 259078
Other Operating Revenues 5130 575 2305 6272 5034
Operating Revenues 66899 66437 61417 267734 264112
Non Operating Income 1563 1712 1654 10851 9548
Total Revenues 68462 68149 63071 278585 273660
EBITDA (Excluding Non Operating Income) 17575 20420 13098 74923 61124
Profit Before Tax 10948 13894 8206 50210 35237
Profit After Tax 6779 9130 7279 34134 27285
Diluted EPS (Rs) 123 174 219 676 583
Key Financial Parameters
18
Particulars FY16 FY15 FY14
EBITDA Margin (Including Non Operating Income Total Revenue) 3079 2582 3193
EBITDA Margin (Excluding Non Operating Income Total Operating Income) 2798 2196 2942
Profit After Tax Margin 1225 997 1125
Net DebtEquity 058 076 035
Net Surplus of Rs 19676 Cr expected by 2019 (refer slide 26)
Shareholding Pattern
19
Category 01-Apr-16 31-Dec-15 30-Sep-15 30-Jun-15 31-Mar-15
Promoter Holding 3921 3347 3347 2773 2773
Treasury Stock 842 921 921 1000 1000
Foreign Institutional Investors (FIIs) Foreign Shareholding 1808 2011 1920 3118 2647
Domestic Institutional Investors 179 202 158 233 127
Other public shareholders 3250 3519 3654 2876 3453
20
Operations Snapshot
Completed Projects
Indiabulls Finance Centre ndash Mumbai (156 lac sft)
One Indiabulls Centre ndash Mumbai (165 lac sft)
21
Completed Projects (Contd)
Indiabulls Centrum ndash Madurai (16 lac sft)
Indiabulls Centrum Park ndash Gurgaon Phase 1 (48 lac sft) 22
Sky 882 Lower Parel (4 lac sft)
Completed Projects (Contd)
Indiabulls Mint ndash Thane (06 lac sft)
Indiabulls Greens ndash Chennai Phase 1 (45 lac sft)
Vatika ndash Ahmedabad (16 lac sft)
Mega Mall ndash Vadodara (23 lac sft)
23
Snapshot ndash Ongoing Projects (A)
Project Location Type Launched Area (m sq ft)
Gross Development
Value (INR Cr)
Expected first handover
Month
IBREL Ongoing Projects Blu Worli Mumbai Residential (Luxury) 121 6432 Mar 17
Indiabulls Greens Panvel Mumbai Residential (Premium) 873 4459 Ready to start Handover
Indiabulls Golf City Savroli Mumbai Residential (Premium) 522 3168 Aug 16
Centrum Park Gurgaon NCR Residential (Mid Income) 216 915 Handover
started
Enigma Gurgaon NCR Residential (Premium) 176 1130 Oct 16
Indiabulls Greens Chennai Chennai Residential (Mid Income) 207 828 Nov 16
Indiabulls City Sonepat NCR Residential (Plot) 176 254 Handover started
One Indiabulls Gurgaon NCR Residential (Premium) 615 4922 Mar 19
One Indiabulls Vadodara Vadodara Commercial 023 83 Mar 17
Indiabulls One 09 Gurgaon Commercial 096 768 Mar 18
Silverlake Villas Alibaug Mumbai High end Villas (Luxury) 026 164 Mar 18
IBREL Projects Total 3051 23123 IPIT Ongoing Projects Sky Forest Lower Parel Mumbai Residential (Luxury) 150 3936 Dec 18
Sky Suites Lower Parel Mumbai Residential (Luxury) 140 3804 Dec 19
IPIT Projects Total 290 7740 =gtAbove includes only ongoing projects and does not include the potential GDV of projects that will be planned in future on the land bank in possession amp fully paid for
24
Snapshot ndash Planned Projects (B)
=gtAbove includes only projects currently planned and does not include the potential GDV of projects that will be planned in future on the land bank in possession amp fully paid for
Project Location Type Launched Area (m sq ft)
Gross Development
Value (INR Cr)
Expected first handover
month
Planned Projects
Indiabulls Mint Gurgaon (Sec 104) NCR Commercial - 031 310 Mar 19
Indiabulls Imperial Gurgaon (Sec 106) NCR Residential
Commercial (Premium) - 698 5933 Mar 18
22 Hanover Square London Residential Hotel (Luxury) - 010 5200 Mar 19
Total - Planned Projects 739 11443
25
Summary of Ongoing amp Planned Projects (A amp B)
Summary Snapshot Rs Cr Pending Collection from Sold Inventory (a) 4136
Pending Construction Cost (b) 8130
Value of Unsold Inventory (c) 23670
Net Surplus (a+c-b) 19676
Expected Net Surplus of Rs 19676 Cr by 2019
=gt Above includes only ongoing amp planned projects and does not include the potential GDV of projects that will be planned in future on the land bank in possession amp fully paid for
=gtThis does not include assets under IPIT ndash 2 commercial and 3 residential properties of cumulative area over of 3m sft of office space amp over 3m sft of residential area under construction
26
Portfolio Diversification
GDV Spread across Locations GDV Spread across Segments
Total Gross Development Value of Rs 34566 Cr
Mumbai Metropolitan
Region 41
National Capital Region
41
Central London 15
Others 2
Super Premium Luxury
34
Premium 60
Mid-Income 6
=gtAbove includes only ongoing amp planned projects and does not include the potential GDV of projects that will be planned in future on the land bank in possession amp fully paid for rArrThis does not include assets under IPIT ndash 2 commercial and 3 residential properties of cumulative area over of 3m sft of office space amp over 3m sft of residential area under construction 27
Blu Worli
Project location
WORLI CIRCLE
One Indiabulls
Worli
Location Worli Mumbai
Total area (Acres) 100
Estimated total saleable area (m sqft) 121
Estimated total units 345
Expected first handover month Mar-17
Key amenities
5 acre landscape garden 1 km jogging and walking track
championship size football field swimming pool and state-of-the-
art gymnasium
121 lac sqft
28
Indiabulls Greens Panvel
Project location
Location Panvel Navi Mumbai
Total area (Acres) 523
Estimated total saleable area (m sqft) 873
Estimated total units 6701
Expected first handover month Phase 1 Ready to start Handover
Amenities
Dedicated sports facilities shopping centers restaurants
banks pharmacies amp a post office Spa with Jacuzzi steam
sauna and massage room
Proposed International Airport
McDonalds Kalamboli Circle MGM Hospital
Khandeswar Railway Station
Klamboli Railway Station
Panvel Railway Station
Hotal Natraj
To Pune Palaspa Phata
Somathane Railway Station
To Goa
Datta Guru Snacks
To Rasayani
ONGC Colony
To JNPT
873 lac sqft
29
Indiabulls Golf City Savroli
Project location
30
Location Savroli Navi Mumbai
Total area (Acres) 1100
Estimated total saleable area (m sqft) 522
Estimated total units 4016
Expected first handover month Aug-16
Key amenities
An 18 hole golf course leisure swimming pool sports training
academies and amenities lavish entertainment and
shopping precinct advanced home automation and security
systems 522 lac sqft
LONAVALA KHALAPUR TOLL BOOTH
GREENS PANVEL
NAVI MUMBAI INTERNATIONAL AIRPORT GOLF CITY
TOWARDS PUNE
VIA MUMBAI-PUNE EXPRESSWAY
MUMBAI
Centrum Park Gurgaon
Project location
31
Location Gurgaon (Sector 103)
Total area (Acres) 221
Estimated total saleable area (m sqft) 216
Estimated total units 1037
Expected first handover month Phase 1 Handover Started
Amenities Clubhouse fully equipped
gymnasium yoga and aerobics lounge salon amp spa
216 lac sqft
Centrum Park
115
114
112
113
109 106
107
108
110 111 105 104 101
102
102A 103
110A
2 1 Palam Vihar
33 23
3
5
6
4
3A
9 7
9A
Amunation Depot
8 12
12A
11
14 17
16
39
22 21
20 18
19
To Delhi
To Delhi
To Delhi
To Delhi
Metro route from Dwarka Along 150 mtr wide road
24 25
28
27 25
25A
42
44 45
40 41
South City
39
46 47
49
66
32 30 IFFCO CHOWK
DLF PH-11
DLF PH-11
DLF PH-1
ATUL KATARI CHOWK Fountain Chowk
Proposed DWARKA MANESAR 150mtr Expressway
South City-II
Malibu Town
CHOWK
72 48
77
69 70A
70
74
75
72 A
73
35 34 33
37 36 10A
10
37C
37A 37B
37D
100
99
Honda Chowk
74 A 75
A
77
78
79
87
84
88
89
85
82
81
86
90
97
96 92
91
87
95
98
97
96
M-1
M-1A
METRO STATION
M-5
M-6 PROPOSED BIGGEST ISBT
M-15
M-14
M-13 M-9
M-8
M-3A
M-11 M-10
MANESAR
M-12
GURGAON
DLF PH-IV
SULTANPUR BIRD SANCTUARY
Enigma Gurgaon
Project location
Location Gurgaon (Sector 110)
Total area (Acres) 199
Estimated total area (m sqft) 176
Estimated total units 479
Expected first handover month Oct-16
Amenities Landscaped garden high
speed elevators and state-of-the-art gymnasium
176 lac sqft
32
Indiabulls Greens Chennai
Project location
Chennai Airport
Tidel Park American School
IT - Chennai Vijaynagar Bus
Terminal
Velachery RS MATS
Perungudi Lake
Chrompet
Pallavaram Tirusulam
Meenambakkam Pazavanthangal
Chrompet
Chitlapakkam Lake
Dr Boaz Memorial Hospital
Hastinapuram Lake Medavakkam High Road
Dr Kamakshi Memorial Hospital
CTS
National Institute of Ocean Technology
Balaji Dental College
STJohns Public School
Bharathi Vidhya Mandir
Infosys
Global Health City
Sathyabama University Saint Joseph College
Bay
of B
enga
l
Gateway School
Sri Pratyangira Devi Temple
Elcot Sez
Thorapakkam
Cognizant CTS TCS
Satyam
Tata Consultancy
Accenture Wipro
Satyam
Satyam
LEGEND Distances (Approx) St Johns Public School 300m Bharathi Vidyala Mandir 700m Gateway School 1km Global Hospital 1km Distance from Main Road 500m Distance from Medavakkam Junction 1km Distance from OMR Sholinganallur 35km Prithyangara Devi Temple 4km ECR Beach 45km
Location Chennai
Total area (Acres) 159
Estimated total saleable area (m sqft) 207
Estimated total units 1611
Expected first handover month Phase 1 handed over amp Phase 2 expected to start by Nov-16
Amenities Pool Jacuzzi landscaped
garden high speed elevators amp state-of-the-art gymnasium
207 lac sqft
33
Indiabulls City Sonepat
Project location
N
IB City
P-I Zone Delhi
P-II Zone Delhi
To Delhi
To Delhi
Proposed Rajiv Gandhi
Education City
Location Sonepat
Total area (Acres) 1065
Estimated total area (m sqft) 176
Estimated total units (Plots) 755
Expected first handover month Handover started
176 lac sqft
34
One Indiabulls Gurgaon
Project location
Location Gurgaon (Sector 104)
Total area (Acres) 340
Estimated total saleable area (m sqft) 615
Estimated total units 2000
Expected first handover month Mar-19
Amenities
Lap pool Jacuzzi landscaped garden high speed elevators
and state-of-the-art gymnasium
615 lac sqft
35
Indiabulls One 09 Gurgaon
Project location
96 lac sqft
Location Gurgaon (Sector 109)
Total area (Acres) 59
Estimated total saleable area (m sqft) 096
Estimated total units 352
Expected first handover month Mar-18
36
Silverlake Villas Alibaug
Project location 26 lac sqft
Location Alibaug
Total area (Acres) 73
Estimated total saleable area (m sqft) 026
Estimated total units 34
Expected first handover month Mar-18
37
Sky Forest Lower Parel
Project location 15 lac sqft
Location Lower Parel Mumbai
Total area (Acres) (mixed use development) 97
Estimated total saleable area (m sqft) 150
Estimated total units 442
Expected first handover month Dec-18
Key amenities
120000 sqft of landscaped podium and club
swimming pool and state-of-the-art gymnasium
mini-theatre
38
Sky Suites Lower Parel
Project location 14 lac sqft
Location Lower Parel Mumbai
Total area (Acres) (mixed use development) 78
Estimated total saleable area (m sqft) 140
Estimated total units 279
Expected first handover month Dec-19
Key amenities
100000 sqft of landscaped podium and club
swimming pool and state-of-the-art gymnasium
39
Planned launches ndash Indiabulls Mint Gurgaon
bull A commercial project located in Sector 104 Gurgaon Its has a direct access from Dwarka Manesar Expressway and very close the Domestic and the International Airports
bull Net development area of 212 acres
bull The total saleable area of the project is 031m sqft
bull Currently under planning and expected to be launched in FY17
bull The project has GDV of about Rs 310 Cr
One Indiabulls Gurgaon
South Delhi
Palam Vihar
Dwarka
To Delhi
IGI Airport
Project location
Project details
40 31 lac sqft
Planned launches ndash Indiabulls Imperial Gurgaon
bull Includes residential (luxury) and commercial project located in Sector 106 Gurgaon It has a direct access from 60m wide road and very close to Dwarka Manesar Expressway Domestic and the International Airport
bull Net development area of 241 acres and 111 acres for residential and commercial sections respectively
bull The residential project includes 1700 apartments divided into 2 3 4 BHK amp Penthouses configuration and commercial project includes 347 shops and 706 office spaces
bull Currently under planning and expected to be launched by FY17
bull The project has GDV of about Rs 5933 Cr
Project details
Project location
South Delhi
IGI Airport
Dwarka
Palam Vihar
Sec-42
Metro line Delhi border Proposed development
MG road Qutub Minar IIT
JNU
R a o T u l a r a m
M a r g
Nelson Mandela Road Emporio
Vasant Vihar Ryan International School Radisson
Hotel Shiv Murti
Rajokri
Sec-27 Sec-28
Mega Mall Hotel Bristol
Sushant Lok
Courtyard Marriott
Park Plaza Max Hospital
Artemis Hospital
Delhi Public School Sec-46 Sec-45 Sec-44
Cyber Park Sec-40 Huda City
Centre Stn
Hotel Crowne Plaza
IFFCO Chowk Stn
Hotel Westin Signature Tower
Rajiv Chowk Sec-33
Hero Honda Chowk
NH 8
NH 8
Sec-34
Haldiram Toll Plaza
To Jaipur
NH 8
DT City Centre Sikanderpur Metro Stn
Cyber City Hotel Leela Kempinski
Ambience Mall
NH 8 IFFCO Chowk
Sukhrali The Oberoi
Shankar Chowk Hotel Uppalrsquos Orchid NH 8
Aero City Hospitality Commercial amp Retail Zone
Delhi Cantt
NH 8 Delhi University South Campus
To Delhi
Dhaula Kuan
Centaur Hotel Kapashera Crossing
Terminal 3
Old Delhi Gurgaon Road
Columbia Asia Hospital
Sec-111 Sec-110 Sec-105 Sec-104 Sec-101 Sec-100
Dwarka Expressway
Sec-99 A Sec-99 Sec-88 B
Sec-88 A
Sec-88
Sec-84
Sec-83 Proposed ISBT
N
Mini Secretariat
Bata Chowk
Sec-102 Sec-102A Sec-103
Sec-106 Sec-112 Sec-113
Golf Course Diplomatic Enclave Sec-22
Sec-21
Sec-23 Sec-20
OPG World School
Sec-8 Sec-9
Sec-5 Sec-10
Sec-3
GD Goenka School
Sec-1
Sec-12
Sec-108 Sec-115
Delhirsquos Reserved Green Zone
Residential Area
Fortis Hospital Travel Time
Diplomatic Enclave Dwaraka IGI Airport NH-8 Dhaula Kuan
5 minutes 10 minutes 15 minutes 20 minutes
41
42
Indiabulls Foundation Corporate Social Responsibility
Free four medical clinics to provide primary and preventive health care to the underprivileged Jan Swasthya Kalyan Vahika vehicles 9 Mobile medical vans provide free primary healthcare services to nearly 250000 patients every year Cleft deformity surgery for 1200 children across 6 states in partnership with Smile Train an international childrenrsquos charity
Health
Womenrsquos Health
Free sanitary napkins to promote hygiene and sanitation amongst rural women About 30000 underprivileged and rural women have benefitted from this initiative
Free Paushtik Aahar (nutrition supplements) to 5000 underprivileged malnourished individuals every month and regular monitoring of their health weight and height Support to women self-help groups to make Paushtik Aahar (nutritional supplements) and provide sustainable employment options to the underprivileged
Nutrition
Computer Literacy Program
In order to improve IT literacy amongst underprivileged population contributed 1000 computers to tribal ashram schools shelter homes and night schools in Mumbai Thane Raigarh and Palghar districts of Maharashtra
43
Indiabulls Foundation Corporate Social Responsibility
Education and Development
Awarded scholarships to 365 meritorious amp deserving students from economically challenged background to pursue higher education after 12th standard
Rural Empowerment
Implemented water project called lsquoRahatrsquo at 3 Tribal Ashram Schools where there was acute scarcity of water Over 2500 children from these tribal schools will benefit from this initiative every year
Indiabulls Foundation E-learning
(IBFE)
Tie-up with MKCL (Maharashtra Knowledge Corporation Ltd) authorized computer centers to help impart basic IT literacy to rural youth
Equipped 31 ashram schools with sophisticated e-learning methods to enhance the quality of education in rural Maharashtra
Installed Renewable Energy Plants at 5 tribal ashram schools in Maharashtra These plants will provide free of cost round-the-clock seamless electricity to these schools for 25 years absolutely free of cost
Started Sport Excellence Program to support athletes and provide them with world class training facilities
Disaster Relief During the Chennai floods provided timely relief to 1500 The nutritional supplement is a ready to eat mixture providing well needed nourishment to the Chennai flood affected
44
Balance Sheet
Consolidated Balance Sheet
45
Statement of Assets and Liabilities (Consolidated) (Rs Crore)As at March 31
2016 (Audited)
As at March 31 2015
(Audited)Shareholders FundsShare Capital 9234 8500 Reserves and Surplus 745999 708529 Money received against share warrants 29212 -
784445 717029 Minority Interest 5493 3319 Non Current LiabilitiesTerm Loans NCDs from Banks 473013 530353 Against OCDs CCDs 18303 19410 Deferred Tax Liabilities - 115 Other Long term liabilities 17573 18508 Long-term provisions 505 455
509394 568841 Current LiabilitiesShort-term Borrowings 26300 40100 Trade Payables 24376 20210 Other current liabilities 348999 327395 Short-term provisions 12867 7603
412542 395308 Total 1711874 1684497
ASSETSFixed AssetsTangible assets 10361 11183 Intangible assets 057 039
Capital work in progress 003 12671 10421 23893
Non Current AssetsNon-current investments 547538 549470 Deferred Tax Assets 8185 5330 Long-term loans and advances 33623 103077 Other non-current assets 6076 6030
595422 663907 Current AssetsCurrent Investments 15913 33412 Inventories 541524 601409 Trade Receivables 47645 15940 Cash and bank balances 124317 66943 Short-term loans and advances 118588 91702 Other current assets 258044 187291
1106031 996697 Total 1711874 1684497

4
Overview
5
Indiabulls Housing Finance
Indiabulls Real Estate
Indiabulls Ventures
Indiabulls Group (Combined Networth Rs 19814 Cr)
bull Indiarsquos second largest mortgage finance company in private sector
bull AAA rated company
bull National developer with focus on Mumbai NCR (Delhi) and London
bull 3rd largest real estate company by networth and assets
bull Long term credit rating of AA- highest amongst listed real estate developer peers
bull Offers retail non-discretionary wealth management platform catering to over 07 Mn clients
bull Highest Broker Quality grading of BQ1
bull Operates through separate listed companies (no Group Holding Company) bull No equity cross-holdings
Indiabulls Group Companies
IBREL Journey
2007
Acquired Jupiter Mill and Elphinstone Mill for Rs 772 Cr in Mumbai through open bidding process by NTC
Demerger from Indiabulls Financial Services Ltd Listing on BSE amp NSE
2010 - 11
Purchased the Blu land for Rs 2100 Cr through acquisition of 2 Mills in Worli Mumbai through open bidding process by NTC Credit rating of A+ for Long Term Debt and PR+ for Short Term Loan by CARE
2013-14
Purchase of PE stake for Rs 1172 Cr in some of companiesrsquo projects
2006
2009-10
Delivered the Iconic Commercial Towers of over 3m sft One Indiabulls Centre and Indiabulls Finance Centre
2012 - 13
Buy back of 5 Cr shares
Acquired the prime property 22 Hanover square in Central London for Rs 1630 Cr Raised $ 175m through International Bond International Rating of B+B1B+ by SampPMoodyrsquosFitch respectively Acquired prime land parcel of abt 72 acres in Thane through auction from Voltas for Rs 236 Cr
2014-15
2015-16 Rs 538 Cr Equity Infusion by the Promoter Buy back of international Bond of $ 12279m Rating upgraded to AA- by CARE highest amongst listed Indian real estate companies International rating of B+ (Stable) reaffirmed by SampP Moodyrsquos and Fitch
6 as on 25 April 2016
IBREL ndash One of Indiarsquos leading real estate player
7
Fully paid land bank of 1017 acres in key cities across India
Sufficient for proposed development over the next 7 years
Also possesses 2588 acres of SEZ land at Nashik Maharashtra
11 projects in India with total saleable area of 3051m sq ft
Presence in key Indian metros of Mumbai NCR and Chennai
Ongoing projects
2 new projects to be launched - total saleable area of 729m sq ft
506 m sq ft of saleable residential area amp 223m sq ft of saleable commercial area in NCR
Entered London through acquisition of 22 Hanover Square in Mayfair Central London a 87444 sq ft commercial property in Jul 2014
Planned projects Land bank
475 stake in Indiabulls Properties Investment Trust (ldquoIPITrdquo) a Business Trust listed on SGX
ndash Portfolio comprises over 3m sq ft of completed commercial office space and over 3m sqft of under construction residential space
ndash Accounted as an associate not consolidated with IBREL
IPIT
Knight Frank valuation report of 30th Aug 2014 values the companyrsquos assets base at Rs 20425 Cr Additionally the London acquisition of 22 Hanover Square valued Rs 1630 Cr at cost price refer slide no 24 refer slide no 25
One of the largest real estate players in India with asset base of Rs 22055 Cr and Networth of Rs 7899 Cr
A C B D
Different Buckets of Value
Key markets for IBREL Mumbai Metropolitan Region
Second largest urban agglomeration in India spread over 4355 sq km and a population of 208m
Considered financial capital of the country and state capital of Maharashtra
Availability of talent favorable business environment international air connectivity and quality office developments are the key demand
drivers
Recently completed infrastructure projects including cityrsquos first metro rail Eastern Freeway and SantacruzndashChembur Link Road
National Capital Region
Largest urban agglomeration in India spread over 34144 sq kms and a population of 460m
Political capital of India
Availability of a skilled workforce and a well-developed transportation and telecommunications infrastructure are the key demand drivers
Gurgaon one of the key satellite city of the NCR is an industrial and financial center of Haryana
Amongst the most pronounced ITITES outsourcing and off-shoring hubs in the world
London
London is the largest and most dynamic city in the UK with a 83m population
Economic recovery appetite from overseas investors mortgage availability Government support schemes and the low yields offered by the
other asset classes are the key drivers
London attracts foreign investors due to its lsquosafe havenrsquo status favorable exchange rates the robust and trusted legal system in the UK
Sonepat
Gurgaon
Delhi
Mumbai
Thane
Navi Mumbai
Panvel
Mayfair
London 8
9
Business Update
Business Update
10
Key Financial Highlights FY 2015-16
Q4 FY 15-16 Q3 FY 15-16 Q4 FY 14-15
Total Revenues (Rs Cr) 6846 6815 6307
EBITDA (Rs Cr) 1929 2226 1249
PBT (Rs Cr) 1079 1377 1047
PAT (Rs Cr) 662 900 954
EPS (Rs) 123 174 219
Quarter-on-Quarter (Q-o-Q) Comparison ndash Q4 FY 2015-16 vs Q3 FY 2015-16 and Q4 FY 2014-15
FY 15-16 FY 14-15 Growth
Total Revenues (Rs Cr) 27859 27366 18
EBITDA (Rs Cr) 8599 7081 214
PBT (Rs Cr) 4999 3510 424
PAT (Rs Cr) 3392 2715 249
EPS (Rs) 677 584
Quarter Update
11
Rs in Cr
Net Debt = Gross Debt ndash Cash and Cash Equivalents
Bank Debt Mar16 Dec15 Mar15
Gross Debt 6080 5818 6544
Net Debt 4617 4928 5480
Ratios Marrsquo16 Decrsquo15 Marrsquo15
Fixed Charge Coverage Ratio (FCCR) 267 251 277
Net DebtEquity 058 064 076
FCCR is the ratio of lsquoConsolidated EBITDArsquo for last four recent completed quarters to the Consolidated Interest Expense for the period =gt lsquoConsolidated EBITDArsquo is calculated by adding back depreciation and amortisation expenses finance costs and non-cash land and common cost to profit before tax and is a Non Indian GAAP measure
New Sales of Rs 626 Cr during the quarter
Net debt reduced by Rs 311 Cr in Q4FY16
Achieved Net debt of Rs 4617 Cr as on 31st Mar 2016 as against the target of Rs 4800 Cr
16 YOY reduction in Net debt during FY 15-16 Overall reduced Net debt by Rs 863 Cr
during FY16 down to Rs 4617 Cr on 31st Marrsquo16 from Rs 5480 Cr as on 31st Marrsquo15
12
Detailed Financials
Balance Sheet Abstract - Consolidated
13
Particulars FY16 FY15
Shareholders Fund 789937 720348
Non-Current Liabilities 509394 568841
Current Liabilities 412542 395309
Total Equity and Liabilities 1711873 1684498
Non-Current Assets 605843 687799
Current Assets 1106030 996699
Total Assets 1711873 1684498
Amount in Rs Crores
Cash Flow ndash Abstract (Consolidated)
14
Amount in Rs Crores
Particulars Q4FY16 Q3FY16 Q4FY15 FY16 FY15
Opening Cash and Cash Equivalents (incl Short- term Liquid Investments)
87482 68169 162871 100355 38488
Operating Cash Flows 24217 40311 (24461) 90138 (282981)
Investing Cash Flows 5291 2045 (6418) 17314 9073
Financing Cash Flows 23240 (23043) (31637) (67577) 335775
Closing Cash and Bank Balance (incl Short-term Liquid Investments)
140230 87482 100355 140230 100355
Liabilities ndash Abstract (Consolidated)
15
Amount in Rs Crores
Particulars FY16 FY15
Long term borrowings 491316 549763
Deferred tax liabilities - 115
Other Long term Liabilities 17573 18508
Long-term provisions 505 455
Total Non-Current Liabilities 509394 568841
Short-term borrowings 26300 40100
Trade payables 24376 20210
Other current liabilities 348999 327396
Short-term provisions 12867 7603
Total Current Liabilities 412542 395309
Assets ndash Abstract (Consolidated) Amount in Rs Crores
16
Particulars FY16 FY15
Fixed assets 10421 23893
Investment in Associate (IPIT) 350136 350688
Non-current investmentsadvances 231025 301858
Deferred tax assets 8185 5330
Other non-current assets 6076 6030
Total Non-Current Assets 605843 687799
Cash and bank 124317 66943
Current Investments 15913 33412
Trade receivables (including unbilled) 303132 201310
Inventories 541524 601411
Short-term loans and advances 118588 91702
Other current assets 2556 1921
Total Current Assets 1106030 996699
Profit amp Loss Account ndash Abstract (Consolidated)
17
Amount in Rs Crores
Particulars Q4FY16 Q3FY16 Q4FY15 FY16 FY15
Revenue from Operations 61769 65862 59112 261462 259078
Other Operating Revenues 5130 575 2305 6272 5034
Operating Revenues 66899 66437 61417 267734 264112
Non Operating Income 1563 1712 1654 10851 9548
Total Revenues 68462 68149 63071 278585 273660
EBITDA (Excluding Non Operating Income) 17575 20420 13098 74923 61124
Profit Before Tax 10948 13894 8206 50210 35237
Profit After Tax 6779 9130 7279 34134 27285
Diluted EPS (Rs) 123 174 219 676 583
Key Financial Parameters
18
Particulars FY16 FY15 FY14
EBITDA Margin (Including Non Operating Income Total Revenue) 3079 2582 3193
EBITDA Margin (Excluding Non Operating Income Total Operating Income) 2798 2196 2942
Profit After Tax Margin 1225 997 1125
Net DebtEquity 058 076 035
Net Surplus of Rs 19676 Cr expected by 2019 (refer slide 26)
Shareholding Pattern
19
Category 01-Apr-16 31-Dec-15 30-Sep-15 30-Jun-15 31-Mar-15
Promoter Holding 3921 3347 3347 2773 2773
Treasury Stock 842 921 921 1000 1000
Foreign Institutional Investors (FIIs) Foreign Shareholding 1808 2011 1920 3118 2647
Domestic Institutional Investors 179 202 158 233 127
Other public shareholders 3250 3519 3654 2876 3453
20
Operations Snapshot
Completed Projects
Indiabulls Finance Centre ndash Mumbai (156 lac sft)
One Indiabulls Centre ndash Mumbai (165 lac sft)
21
Completed Projects (Contd)
Indiabulls Centrum ndash Madurai (16 lac sft)
Indiabulls Centrum Park ndash Gurgaon Phase 1 (48 lac sft) 22
Sky 882 Lower Parel (4 lac sft)
Completed Projects (Contd)
Indiabulls Mint ndash Thane (06 lac sft)
Indiabulls Greens ndash Chennai Phase 1 (45 lac sft)
Vatika ndash Ahmedabad (16 lac sft)
Mega Mall ndash Vadodara (23 lac sft)
23
Snapshot ndash Ongoing Projects (A)
Project Location Type Launched Area (m sq ft)
Gross Development
Value (INR Cr)
Expected first handover
Month
IBREL Ongoing Projects Blu Worli Mumbai Residential (Luxury) 121 6432 Mar 17
Indiabulls Greens Panvel Mumbai Residential (Premium) 873 4459 Ready to start Handover
Indiabulls Golf City Savroli Mumbai Residential (Premium) 522 3168 Aug 16
Centrum Park Gurgaon NCR Residential (Mid Income) 216 915 Handover
started
Enigma Gurgaon NCR Residential (Premium) 176 1130 Oct 16
Indiabulls Greens Chennai Chennai Residential (Mid Income) 207 828 Nov 16
Indiabulls City Sonepat NCR Residential (Plot) 176 254 Handover started
One Indiabulls Gurgaon NCR Residential (Premium) 615 4922 Mar 19
One Indiabulls Vadodara Vadodara Commercial 023 83 Mar 17
Indiabulls One 09 Gurgaon Commercial 096 768 Mar 18
Silverlake Villas Alibaug Mumbai High end Villas (Luxury) 026 164 Mar 18
IBREL Projects Total 3051 23123 IPIT Ongoing Projects Sky Forest Lower Parel Mumbai Residential (Luxury) 150 3936 Dec 18
Sky Suites Lower Parel Mumbai Residential (Luxury) 140 3804 Dec 19
IPIT Projects Total 290 7740 =gtAbove includes only ongoing projects and does not include the potential GDV of projects that will be planned in future on the land bank in possession amp fully paid for
24
Snapshot ndash Planned Projects (B)
=gtAbove includes only projects currently planned and does not include the potential GDV of projects that will be planned in future on the land bank in possession amp fully paid for
Project Location Type Launched Area (m sq ft)
Gross Development
Value (INR Cr)
Expected first handover
month
Planned Projects
Indiabulls Mint Gurgaon (Sec 104) NCR Commercial - 031 310 Mar 19
Indiabulls Imperial Gurgaon (Sec 106) NCR Residential
Commercial (Premium) - 698 5933 Mar 18
22 Hanover Square London Residential Hotel (Luxury) - 010 5200 Mar 19
Total - Planned Projects 739 11443
25
Summary of Ongoing amp Planned Projects (A amp B)
Summary Snapshot Rs Cr Pending Collection from Sold Inventory (a) 4136
Pending Construction Cost (b) 8130
Value of Unsold Inventory (c) 23670
Net Surplus (a+c-b) 19676
Expected Net Surplus of Rs 19676 Cr by 2019
=gt Above includes only ongoing amp planned projects and does not include the potential GDV of projects that will be planned in future on the land bank in possession amp fully paid for
=gtThis does not include assets under IPIT ndash 2 commercial and 3 residential properties of cumulative area over of 3m sft of office space amp over 3m sft of residential area under construction
26
Portfolio Diversification
GDV Spread across Locations GDV Spread across Segments
Total Gross Development Value of Rs 34566 Cr
Mumbai Metropolitan
Region 41
National Capital Region
41
Central London 15
Others 2
Super Premium Luxury
34
Premium 60
Mid-Income 6
=gtAbove includes only ongoing amp planned projects and does not include the potential GDV of projects that will be planned in future on the land bank in possession amp fully paid for rArrThis does not include assets under IPIT ndash 2 commercial and 3 residential properties of cumulative area over of 3m sft of office space amp over 3m sft of residential area under construction 27
Blu Worli
Project location
WORLI CIRCLE
One Indiabulls
Worli
Location Worli Mumbai
Total area (Acres) 100
Estimated total saleable area (m sqft) 121
Estimated total units 345
Expected first handover month Mar-17
Key amenities
5 acre landscape garden 1 km jogging and walking track
championship size football field swimming pool and state-of-the-
art gymnasium
121 lac sqft
28
Indiabulls Greens Panvel
Project location
Location Panvel Navi Mumbai
Total area (Acres) 523
Estimated total saleable area (m sqft) 873
Estimated total units 6701
Expected first handover month Phase 1 Ready to start Handover
Amenities
Dedicated sports facilities shopping centers restaurants
banks pharmacies amp a post office Spa with Jacuzzi steam
sauna and massage room
Proposed International Airport
McDonalds Kalamboli Circle MGM Hospital
Khandeswar Railway Station
Klamboli Railway Station
Panvel Railway Station
Hotal Natraj
To Pune Palaspa Phata
Somathane Railway Station
To Goa
Datta Guru Snacks
To Rasayani
ONGC Colony
To JNPT
873 lac sqft
29
Indiabulls Golf City Savroli
Project location
30
Location Savroli Navi Mumbai
Total area (Acres) 1100
Estimated total saleable area (m sqft) 522
Estimated total units 4016
Expected first handover month Aug-16
Key amenities
An 18 hole golf course leisure swimming pool sports training
academies and amenities lavish entertainment and
shopping precinct advanced home automation and security
systems 522 lac sqft
LONAVALA KHALAPUR TOLL BOOTH
GREENS PANVEL
NAVI MUMBAI INTERNATIONAL AIRPORT GOLF CITY
TOWARDS PUNE
VIA MUMBAI-PUNE EXPRESSWAY
MUMBAI
Centrum Park Gurgaon
Project location
31
Location Gurgaon (Sector 103)
Total area (Acres) 221
Estimated total saleable area (m sqft) 216
Estimated total units 1037
Expected first handover month Phase 1 Handover Started
Amenities Clubhouse fully equipped
gymnasium yoga and aerobics lounge salon amp spa
216 lac sqft
Centrum Park
115
114
112
113
109 106
107
108
110 111 105 104 101
102
102A 103
110A
2 1 Palam Vihar
33 23
3
5
6
4
3A
9 7
9A
Amunation Depot
8 12
12A
11
14 17
16
39
22 21
20 18
19
To Delhi
To Delhi
To Delhi
To Delhi
Metro route from Dwarka Along 150 mtr wide road
24 25
28
27 25
25A
42
44 45
40 41
South City
39
46 47
49
66
32 30 IFFCO CHOWK
DLF PH-11
DLF PH-11
DLF PH-1
ATUL KATARI CHOWK Fountain Chowk
Proposed DWARKA MANESAR 150mtr Expressway
South City-II
Malibu Town
CHOWK
72 48
77
69 70A
70
74
75
72 A
73
35 34 33
37 36 10A
10
37C
37A 37B
37D
100
99
Honda Chowk
74 A 75
A
77
78
79
87
84
88
89
85
82
81
86
90
97
96 92
91
87
95
98
97
96
M-1
M-1A
METRO STATION
M-5
M-6 PROPOSED BIGGEST ISBT
M-15
M-14
M-13 M-9
M-8
M-3A
M-11 M-10
MANESAR
M-12
GURGAON
DLF PH-IV
SULTANPUR BIRD SANCTUARY
Enigma Gurgaon
Project location
Location Gurgaon (Sector 110)
Total area (Acres) 199
Estimated total area (m sqft) 176
Estimated total units 479
Expected first handover month Oct-16
Amenities Landscaped garden high
speed elevators and state-of-the-art gymnasium
176 lac sqft
32
Indiabulls Greens Chennai
Project location
Chennai Airport
Tidel Park American School
IT - Chennai Vijaynagar Bus
Terminal
Velachery RS MATS
Perungudi Lake
Chrompet
Pallavaram Tirusulam
Meenambakkam Pazavanthangal
Chrompet
Chitlapakkam Lake
Dr Boaz Memorial Hospital
Hastinapuram Lake Medavakkam High Road
Dr Kamakshi Memorial Hospital
CTS
National Institute of Ocean Technology
Balaji Dental College
STJohns Public School
Bharathi Vidhya Mandir
Infosys
Global Health City
Sathyabama University Saint Joseph College
Bay
of B
enga
l
Gateway School
Sri Pratyangira Devi Temple
Elcot Sez
Thorapakkam
Cognizant CTS TCS
Satyam
Tata Consultancy
Accenture Wipro
Satyam
Satyam
LEGEND Distances (Approx) St Johns Public School 300m Bharathi Vidyala Mandir 700m Gateway School 1km Global Hospital 1km Distance from Main Road 500m Distance from Medavakkam Junction 1km Distance from OMR Sholinganallur 35km Prithyangara Devi Temple 4km ECR Beach 45km
Location Chennai
Total area (Acres) 159
Estimated total saleable area (m sqft) 207
Estimated total units 1611
Expected first handover month Phase 1 handed over amp Phase 2 expected to start by Nov-16
Amenities Pool Jacuzzi landscaped
garden high speed elevators amp state-of-the-art gymnasium
207 lac sqft
33
Indiabulls City Sonepat
Project location
N
IB City
P-I Zone Delhi
P-II Zone Delhi
To Delhi
To Delhi
Proposed Rajiv Gandhi
Education City
Location Sonepat
Total area (Acres) 1065
Estimated total area (m sqft) 176
Estimated total units (Plots) 755
Expected first handover month Handover started
176 lac sqft
34
One Indiabulls Gurgaon
Project location
Location Gurgaon (Sector 104)
Total area (Acres) 340
Estimated total saleable area (m sqft) 615
Estimated total units 2000
Expected first handover month Mar-19
Amenities
Lap pool Jacuzzi landscaped garden high speed elevators
and state-of-the-art gymnasium
615 lac sqft
35
Indiabulls One 09 Gurgaon
Project location
96 lac sqft
Location Gurgaon (Sector 109)
Total area (Acres) 59
Estimated total saleable area (m sqft) 096
Estimated total units 352
Expected first handover month Mar-18
36
Silverlake Villas Alibaug
Project location 26 lac sqft
Location Alibaug
Total area (Acres) 73
Estimated total saleable area (m sqft) 026
Estimated total units 34
Expected first handover month Mar-18
37
Sky Forest Lower Parel
Project location 15 lac sqft
Location Lower Parel Mumbai
Total area (Acres) (mixed use development) 97
Estimated total saleable area (m sqft) 150
Estimated total units 442
Expected first handover month Dec-18
Key amenities
120000 sqft of landscaped podium and club
swimming pool and state-of-the-art gymnasium
mini-theatre
38
Sky Suites Lower Parel
Project location 14 lac sqft
Location Lower Parel Mumbai
Total area (Acres) (mixed use development) 78
Estimated total saleable area (m sqft) 140
Estimated total units 279
Expected first handover month Dec-19
Key amenities
100000 sqft of landscaped podium and club
swimming pool and state-of-the-art gymnasium
39
Planned launches ndash Indiabulls Mint Gurgaon
bull A commercial project located in Sector 104 Gurgaon Its has a direct access from Dwarka Manesar Expressway and very close the Domestic and the International Airports
bull Net development area of 212 acres
bull The total saleable area of the project is 031m sqft
bull Currently under planning and expected to be launched in FY17
bull The project has GDV of about Rs 310 Cr
One Indiabulls Gurgaon
South Delhi
Palam Vihar
Dwarka
To Delhi
IGI Airport
Project location
Project details
40 31 lac sqft
Planned launches ndash Indiabulls Imperial Gurgaon
bull Includes residential (luxury) and commercial project located in Sector 106 Gurgaon It has a direct access from 60m wide road and very close to Dwarka Manesar Expressway Domestic and the International Airport
bull Net development area of 241 acres and 111 acres for residential and commercial sections respectively
bull The residential project includes 1700 apartments divided into 2 3 4 BHK amp Penthouses configuration and commercial project includes 347 shops and 706 office spaces
bull Currently under planning and expected to be launched by FY17
bull The project has GDV of about Rs 5933 Cr
Project details
Project location
South Delhi
IGI Airport
Dwarka
Palam Vihar
Sec-42
Metro line Delhi border Proposed development
MG road Qutub Minar IIT
JNU
R a o T u l a r a m
M a r g
Nelson Mandela Road Emporio
Vasant Vihar Ryan International School Radisson
Hotel Shiv Murti
Rajokri
Sec-27 Sec-28
Mega Mall Hotel Bristol
Sushant Lok
Courtyard Marriott
Park Plaza Max Hospital
Artemis Hospital
Delhi Public School Sec-46 Sec-45 Sec-44
Cyber Park Sec-40 Huda City
Centre Stn
Hotel Crowne Plaza
IFFCO Chowk Stn
Hotel Westin Signature Tower
Rajiv Chowk Sec-33
Hero Honda Chowk
NH 8
NH 8
Sec-34
Haldiram Toll Plaza
To Jaipur
NH 8
DT City Centre Sikanderpur Metro Stn
Cyber City Hotel Leela Kempinski
Ambience Mall
NH 8 IFFCO Chowk
Sukhrali The Oberoi
Shankar Chowk Hotel Uppalrsquos Orchid NH 8
Aero City Hospitality Commercial amp Retail Zone
Delhi Cantt
NH 8 Delhi University South Campus
To Delhi
Dhaula Kuan
Centaur Hotel Kapashera Crossing
Terminal 3
Old Delhi Gurgaon Road
Columbia Asia Hospital
Sec-111 Sec-110 Sec-105 Sec-104 Sec-101 Sec-100
Dwarka Expressway
Sec-99 A Sec-99 Sec-88 B
Sec-88 A
Sec-88
Sec-84
Sec-83 Proposed ISBT
N
Mini Secretariat
Bata Chowk
Sec-102 Sec-102A Sec-103
Sec-106 Sec-112 Sec-113
Golf Course Diplomatic Enclave Sec-22
Sec-21
Sec-23 Sec-20
OPG World School
Sec-8 Sec-9
Sec-5 Sec-10
Sec-3
GD Goenka School
Sec-1
Sec-12
Sec-108 Sec-115
Delhirsquos Reserved Green Zone
Residential Area
Fortis Hospital Travel Time
Diplomatic Enclave Dwaraka IGI Airport NH-8 Dhaula Kuan
5 minutes 10 minutes 15 minutes 20 minutes
41
42
Indiabulls Foundation Corporate Social Responsibility
Free four medical clinics to provide primary and preventive health care to the underprivileged Jan Swasthya Kalyan Vahika vehicles 9 Mobile medical vans provide free primary healthcare services to nearly 250000 patients every year Cleft deformity surgery for 1200 children across 6 states in partnership with Smile Train an international childrenrsquos charity
Health
Womenrsquos Health
Free sanitary napkins to promote hygiene and sanitation amongst rural women About 30000 underprivileged and rural women have benefitted from this initiative
Free Paushtik Aahar (nutrition supplements) to 5000 underprivileged malnourished individuals every month and regular monitoring of their health weight and height Support to women self-help groups to make Paushtik Aahar (nutritional supplements) and provide sustainable employment options to the underprivileged
Nutrition
Computer Literacy Program
In order to improve IT literacy amongst underprivileged population contributed 1000 computers to tribal ashram schools shelter homes and night schools in Mumbai Thane Raigarh and Palghar districts of Maharashtra
43
Indiabulls Foundation Corporate Social Responsibility
Education and Development
Awarded scholarships to 365 meritorious amp deserving students from economically challenged background to pursue higher education after 12th standard
Rural Empowerment
Implemented water project called lsquoRahatrsquo at 3 Tribal Ashram Schools where there was acute scarcity of water Over 2500 children from these tribal schools will benefit from this initiative every year
Indiabulls Foundation E-learning
(IBFE)
Tie-up with MKCL (Maharashtra Knowledge Corporation Ltd) authorized computer centers to help impart basic IT literacy to rural youth
Equipped 31 ashram schools with sophisticated e-learning methods to enhance the quality of education in rural Maharashtra
Installed Renewable Energy Plants at 5 tribal ashram schools in Maharashtra These plants will provide free of cost round-the-clock seamless electricity to these schools for 25 years absolutely free of cost
Started Sport Excellence Program to support athletes and provide them with world class training facilities
Disaster Relief During the Chennai floods provided timely relief to 1500 The nutritional supplement is a ready to eat mixture providing well needed nourishment to the Chennai flood affected
44
Balance Sheet
Consolidated Balance Sheet
45
Statement of Assets and Liabilities (Consolidated) (Rs Crore)As at March 31
2016 (Audited)
As at March 31 2015
(Audited)Shareholders FundsShare Capital 9234 8500 Reserves and Surplus 745999 708529 Money received against share warrants 29212 -
784445 717029 Minority Interest 5493 3319 Non Current LiabilitiesTerm Loans NCDs from Banks 473013 530353 Against OCDs CCDs 18303 19410 Deferred Tax Liabilities - 115 Other Long term liabilities 17573 18508 Long-term provisions 505 455
509394 568841 Current LiabilitiesShort-term Borrowings 26300 40100 Trade Payables 24376 20210 Other current liabilities 348999 327395 Short-term provisions 12867 7603
412542 395308 Total 1711874 1684497
ASSETSFixed AssetsTangible assets 10361 11183 Intangible assets 057 039
Capital work in progress 003 12671 10421 23893
Non Current AssetsNon-current investments 547538 549470 Deferred Tax Assets 8185 5330 Long-term loans and advances 33623 103077 Other non-current assets 6076 6030
595422 663907 Current AssetsCurrent Investments 15913 33412 Inventories 541524 601409 Trade Receivables 47645 15940 Cash and bank balances 124317 66943 Short-term loans and advances 118588 91702 Other current assets 258044 187291
1106031 996697 Total 1711874 1684497
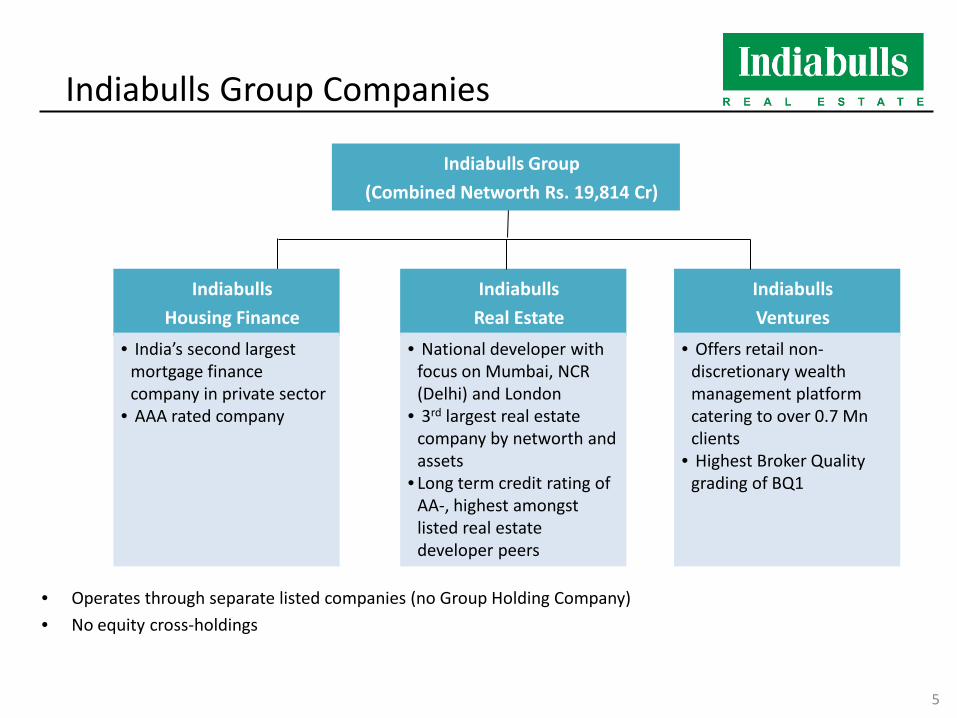
5
Indiabulls Housing Finance
Indiabulls Real Estate
Indiabulls Ventures
Indiabulls Group (Combined Networth Rs 19814 Cr)
bull Indiarsquos second largest mortgage finance company in private sector
bull AAA rated company
bull National developer with focus on Mumbai NCR (Delhi) and London
bull 3rd largest real estate company by networth and assets
bull Long term credit rating of AA- highest amongst listed real estate developer peers
bull Offers retail non-discretionary wealth management platform catering to over 07 Mn clients
bull Highest Broker Quality grading of BQ1
bull Operates through separate listed companies (no Group Holding Company) bull No equity cross-holdings
Indiabulls Group Companies
IBREL Journey
2007
Acquired Jupiter Mill and Elphinstone Mill for Rs 772 Cr in Mumbai through open bidding process by NTC
Demerger from Indiabulls Financial Services Ltd Listing on BSE amp NSE
2010 - 11
Purchased the Blu land for Rs 2100 Cr through acquisition of 2 Mills in Worli Mumbai through open bidding process by NTC Credit rating of A+ for Long Term Debt and PR+ for Short Term Loan by CARE
2013-14
Purchase of PE stake for Rs 1172 Cr in some of companiesrsquo projects
2006
2009-10
Delivered the Iconic Commercial Towers of over 3m sft One Indiabulls Centre and Indiabulls Finance Centre
2012 - 13
Buy back of 5 Cr shares
Acquired the prime property 22 Hanover square in Central London for Rs 1630 Cr Raised $ 175m through International Bond International Rating of B+B1B+ by SampPMoodyrsquosFitch respectively Acquired prime land parcel of abt 72 acres in Thane through auction from Voltas for Rs 236 Cr
2014-15
2015-16 Rs 538 Cr Equity Infusion by the Promoter Buy back of international Bond of $ 12279m Rating upgraded to AA- by CARE highest amongst listed Indian real estate companies International rating of B+ (Stable) reaffirmed by SampP Moodyrsquos and Fitch
6 as on 25 April 2016
IBREL ndash One of Indiarsquos leading real estate player
7
Fully paid land bank of 1017 acres in key cities across India
Sufficient for proposed development over the next 7 years
Also possesses 2588 acres of SEZ land at Nashik Maharashtra
11 projects in India with total saleable area of 3051m sq ft
Presence in key Indian metros of Mumbai NCR and Chennai
Ongoing projects
2 new projects to be launched - total saleable area of 729m sq ft
506 m sq ft of saleable residential area amp 223m sq ft of saleable commercial area in NCR
Entered London through acquisition of 22 Hanover Square in Mayfair Central London a 87444 sq ft commercial property in Jul 2014
Planned projects Land bank
475 stake in Indiabulls Properties Investment Trust (ldquoIPITrdquo) a Business Trust listed on SGX
ndash Portfolio comprises over 3m sq ft of completed commercial office space and over 3m sqft of under construction residential space
ndash Accounted as an associate not consolidated with IBREL
IPIT
Knight Frank valuation report of 30th Aug 2014 values the companyrsquos assets base at Rs 20425 Cr Additionally the London acquisition of 22 Hanover Square valued Rs 1630 Cr at cost price refer slide no 24 refer slide no 25
One of the largest real estate players in India with asset base of Rs 22055 Cr and Networth of Rs 7899 Cr
A C B D
Different Buckets of Value
Key markets for IBREL Mumbai Metropolitan Region
Second largest urban agglomeration in India spread over 4355 sq km and a population of 208m
Considered financial capital of the country and state capital of Maharashtra
Availability of talent favorable business environment international air connectivity and quality office developments are the key demand
drivers
Recently completed infrastructure projects including cityrsquos first metro rail Eastern Freeway and SantacruzndashChembur Link Road
National Capital Region
Largest urban agglomeration in India spread over 34144 sq kms and a population of 460m
Political capital of India
Availability of a skilled workforce and a well-developed transportation and telecommunications infrastructure are the key demand drivers
Gurgaon one of the key satellite city of the NCR is an industrial and financial center of Haryana
Amongst the most pronounced ITITES outsourcing and off-shoring hubs in the world
London
London is the largest and most dynamic city in the UK with a 83m population
Economic recovery appetite from overseas investors mortgage availability Government support schemes and the low yields offered by the
other asset classes are the key drivers
London attracts foreign investors due to its lsquosafe havenrsquo status favorable exchange rates the robust and trusted legal system in the UK
Sonepat
Gurgaon
Delhi
Mumbai
Thane
Navi Mumbai
Panvel
Mayfair
London 8
9
Business Update
Business Update
10
Key Financial Highlights FY 2015-16
Q4 FY 15-16 Q3 FY 15-16 Q4 FY 14-15
Total Revenues (Rs Cr) 6846 6815 6307
EBITDA (Rs Cr) 1929 2226 1249
PBT (Rs Cr) 1079 1377 1047
PAT (Rs Cr) 662 900 954
EPS (Rs) 123 174 219
Quarter-on-Quarter (Q-o-Q) Comparison ndash Q4 FY 2015-16 vs Q3 FY 2015-16 and Q4 FY 2014-15
FY 15-16 FY 14-15 Growth
Total Revenues (Rs Cr) 27859 27366 18
EBITDA (Rs Cr) 8599 7081 214
PBT (Rs Cr) 4999 3510 424
PAT (Rs Cr) 3392 2715 249
EPS (Rs) 677 584
Quarter Update
11
Rs in Cr
Net Debt = Gross Debt ndash Cash and Cash Equivalents
Bank Debt Mar16 Dec15 Mar15
Gross Debt 6080 5818 6544
Net Debt 4617 4928 5480
Ratios Marrsquo16 Decrsquo15 Marrsquo15
Fixed Charge Coverage Ratio (FCCR) 267 251 277
Net DebtEquity 058 064 076
FCCR is the ratio of lsquoConsolidated EBITDArsquo for last four recent completed quarters to the Consolidated Interest Expense for the period =gt lsquoConsolidated EBITDArsquo is calculated by adding back depreciation and amortisation expenses finance costs and non-cash land and common cost to profit before tax and is a Non Indian GAAP measure
New Sales of Rs 626 Cr during the quarter
Net debt reduced by Rs 311 Cr in Q4FY16
Achieved Net debt of Rs 4617 Cr as on 31st Mar 2016 as against the target of Rs 4800 Cr
16 YOY reduction in Net debt during FY 15-16 Overall reduced Net debt by Rs 863 Cr
during FY16 down to Rs 4617 Cr on 31st Marrsquo16 from Rs 5480 Cr as on 31st Marrsquo15
12
Detailed Financials
Balance Sheet Abstract - Consolidated
13
Particulars FY16 FY15
Shareholders Fund 789937 720348
Non-Current Liabilities 509394 568841
Current Liabilities 412542 395309
Total Equity and Liabilities 1711873 1684498
Non-Current Assets 605843 687799
Current Assets 1106030 996699
Total Assets 1711873 1684498
Amount in Rs Crores
Cash Flow ndash Abstract (Consolidated)
14
Amount in Rs Crores
Particulars Q4FY16 Q3FY16 Q4FY15 FY16 FY15
Opening Cash and Cash Equivalents (incl Short- term Liquid Investments)
87482 68169 162871 100355 38488
Operating Cash Flows 24217 40311 (24461) 90138 (282981)
Investing Cash Flows 5291 2045 (6418) 17314 9073
Financing Cash Flows 23240 (23043) (31637) (67577) 335775
Closing Cash and Bank Balance (incl Short-term Liquid Investments)
140230 87482 100355 140230 100355
Liabilities ndash Abstract (Consolidated)
15
Amount in Rs Crores
Particulars FY16 FY15
Long term borrowings 491316 549763
Deferred tax liabilities - 115
Other Long term Liabilities 17573 18508
Long-term provisions 505 455
Total Non-Current Liabilities 509394 568841
Short-term borrowings 26300 40100
Trade payables 24376 20210
Other current liabilities 348999 327396
Short-term provisions 12867 7603
Total Current Liabilities 412542 395309
Assets ndash Abstract (Consolidated) Amount in Rs Crores
16
Particulars FY16 FY15
Fixed assets 10421 23893
Investment in Associate (IPIT) 350136 350688
Non-current investmentsadvances 231025 301858
Deferred tax assets 8185 5330
Other non-current assets 6076 6030
Total Non-Current Assets 605843 687799
Cash and bank 124317 66943
Current Investments 15913 33412
Trade receivables (including unbilled) 303132 201310
Inventories 541524 601411
Short-term loans and advances 118588 91702
Other current assets 2556 1921
Total Current Assets 1106030 996699
Profit amp Loss Account ndash Abstract (Consolidated)
17
Amount in Rs Crores
Particulars Q4FY16 Q3FY16 Q4FY15 FY16 FY15
Revenue from Operations 61769 65862 59112 261462 259078
Other Operating Revenues 5130 575 2305 6272 5034
Operating Revenues 66899 66437 61417 267734 264112
Non Operating Income 1563 1712 1654 10851 9548
Total Revenues 68462 68149 63071 278585 273660
EBITDA (Excluding Non Operating Income) 17575 20420 13098 74923 61124
Profit Before Tax 10948 13894 8206 50210 35237
Profit After Tax 6779 9130 7279 34134 27285
Diluted EPS (Rs) 123 174 219 676 583
Key Financial Parameters
18
Particulars FY16 FY15 FY14
EBITDA Margin (Including Non Operating Income Total Revenue) 3079 2582 3193
EBITDA Margin (Excluding Non Operating Income Total Operating Income) 2798 2196 2942
Profit After Tax Margin 1225 997 1125
Net DebtEquity 058 076 035
Net Surplus of Rs 19676 Cr expected by 2019 (refer slide 26)
Shareholding Pattern
19
Category 01-Apr-16 31-Dec-15 30-Sep-15 30-Jun-15 31-Mar-15
Promoter Holding 3921 3347 3347 2773 2773
Treasury Stock 842 921 921 1000 1000
Foreign Institutional Investors (FIIs) Foreign Shareholding 1808 2011 1920 3118 2647
Domestic Institutional Investors 179 202 158 233 127
Other public shareholders 3250 3519 3654 2876 3453
20
Operations Snapshot
Completed Projects
Indiabulls Finance Centre ndash Mumbai (156 lac sft)
One Indiabulls Centre ndash Mumbai (165 lac sft)
21
Completed Projects (Contd)
Indiabulls Centrum ndash Madurai (16 lac sft)
Indiabulls Centrum Park ndash Gurgaon Phase 1 (48 lac sft) 22
Sky 882 Lower Parel (4 lac sft)
Completed Projects (Contd)
Indiabulls Mint ndash Thane (06 lac sft)
Indiabulls Greens ndash Chennai Phase 1 (45 lac sft)
Vatika ndash Ahmedabad (16 lac sft)
Mega Mall ndash Vadodara (23 lac sft)
23
Snapshot ndash Ongoing Projects (A)
Project Location Type Launched Area (m sq ft)
Gross Development
Value (INR Cr)
Expected first handover
Month
IBREL Ongoing Projects Blu Worli Mumbai Residential (Luxury) 121 6432 Mar 17
Indiabulls Greens Panvel Mumbai Residential (Premium) 873 4459 Ready to start Handover
Indiabulls Golf City Savroli Mumbai Residential (Premium) 522 3168 Aug 16
Centrum Park Gurgaon NCR Residential (Mid Income) 216 915 Handover
started
Enigma Gurgaon NCR Residential (Premium) 176 1130 Oct 16
Indiabulls Greens Chennai Chennai Residential (Mid Income) 207 828 Nov 16
Indiabulls City Sonepat NCR Residential (Plot) 176 254 Handover started
One Indiabulls Gurgaon NCR Residential (Premium) 615 4922 Mar 19
One Indiabulls Vadodara Vadodara Commercial 023 83 Mar 17
Indiabulls One 09 Gurgaon Commercial 096 768 Mar 18
Silverlake Villas Alibaug Mumbai High end Villas (Luxury) 026 164 Mar 18
IBREL Projects Total 3051 23123 IPIT Ongoing Projects Sky Forest Lower Parel Mumbai Residential (Luxury) 150 3936 Dec 18
Sky Suites Lower Parel Mumbai Residential (Luxury) 140 3804 Dec 19
IPIT Projects Total 290 7740 =gtAbove includes only ongoing projects and does not include the potential GDV of projects that will be planned in future on the land bank in possession amp fully paid for
24
Snapshot ndash Planned Projects (B)
=gtAbove includes only projects currently planned and does not include the potential GDV of projects that will be planned in future on the land bank in possession amp fully paid for
Project Location Type Launched Area (m sq ft)
Gross Development
Value (INR Cr)
Expected first handover
month
Planned Projects
Indiabulls Mint Gurgaon (Sec 104) NCR Commercial - 031 310 Mar 19
Indiabulls Imperial Gurgaon (Sec 106) NCR Residential
Commercial (Premium) - 698 5933 Mar 18
22 Hanover Square London Residential Hotel (Luxury) - 010 5200 Mar 19
Total - Planned Projects 739 11443
25
Summary of Ongoing amp Planned Projects (A amp B)
Summary Snapshot Rs Cr Pending Collection from Sold Inventory (a) 4136
Pending Construction Cost (b) 8130
Value of Unsold Inventory (c) 23670
Net Surplus (a+c-b) 19676
Expected Net Surplus of Rs 19676 Cr by 2019
=gt Above includes only ongoing amp planned projects and does not include the potential GDV of projects that will be planned in future on the land bank in possession amp fully paid for
=gtThis does not include assets under IPIT ndash 2 commercial and 3 residential properties of cumulative area over of 3m sft of office space amp over 3m sft of residential area under construction
26
Portfolio Diversification
GDV Spread across Locations GDV Spread across Segments
Total Gross Development Value of Rs 34566 Cr
Mumbai Metropolitan
Region 41
National Capital Region
41
Central London 15
Others 2
Super Premium Luxury
34
Premium 60
Mid-Income 6
=gtAbove includes only ongoing amp planned projects and does not include the potential GDV of projects that will be planned in future on the land bank in possession amp fully paid for rArrThis does not include assets under IPIT ndash 2 commercial and 3 residential properties of cumulative area over of 3m sft of office space amp over 3m sft of residential area under construction 27
Blu Worli
Project location
WORLI CIRCLE
One Indiabulls
Worli
Location Worli Mumbai
Total area (Acres) 100
Estimated total saleable area (m sqft) 121
Estimated total units 345
Expected first handover month Mar-17
Key amenities
5 acre landscape garden 1 km jogging and walking track
championship size football field swimming pool and state-of-the-
art gymnasium
121 lac sqft
28
Indiabulls Greens Panvel
Project location
Location Panvel Navi Mumbai
Total area (Acres) 523
Estimated total saleable area (m sqft) 873
Estimated total units 6701
Expected first handover month Phase 1 Ready to start Handover
Amenities
Dedicated sports facilities shopping centers restaurants
banks pharmacies amp a post office Spa with Jacuzzi steam
sauna and massage room
Proposed International Airport
McDonalds Kalamboli Circle MGM Hospital
Khandeswar Railway Station
Klamboli Railway Station
Panvel Railway Station
Hotal Natraj
To Pune Palaspa Phata
Somathane Railway Station
To Goa
Datta Guru Snacks
To Rasayani
ONGC Colony
To JNPT
873 lac sqft
29
Indiabulls Golf City Savroli
Project location
30
Location Savroli Navi Mumbai
Total area (Acres) 1100
Estimated total saleable area (m sqft) 522
Estimated total units 4016
Expected first handover month Aug-16
Key amenities
An 18 hole golf course leisure swimming pool sports training
academies and amenities lavish entertainment and
shopping precinct advanced home automation and security
systems 522 lac sqft
LONAVALA KHALAPUR TOLL BOOTH
GREENS PANVEL
NAVI MUMBAI INTERNATIONAL AIRPORT GOLF CITY
TOWARDS PUNE
VIA MUMBAI-PUNE EXPRESSWAY
MUMBAI
Centrum Park Gurgaon
Project location
31
Location Gurgaon (Sector 103)
Total area (Acres) 221
Estimated total saleable area (m sqft) 216
Estimated total units 1037
Expected first handover month Phase 1 Handover Started
Amenities Clubhouse fully equipped
gymnasium yoga and aerobics lounge salon amp spa
216 lac sqft
Centrum Park
115
114
112
113
109 106
107
108
110 111 105 104 101
102
102A 103
110A
2 1 Palam Vihar
33 23
3
5
6
4
3A
9 7
9A
Amunation Depot
8 12
12A
11
14 17
16
39
22 21
20 18
19
To Delhi
To Delhi
To Delhi
To Delhi
Metro route from Dwarka Along 150 mtr wide road
24 25
28
27 25
25A
42
44 45
40 41
South City
39
46 47
49
66
32 30 IFFCO CHOWK
DLF PH-11
DLF PH-11
DLF PH-1
ATUL KATARI CHOWK Fountain Chowk
Proposed DWARKA MANESAR 150mtr Expressway
South City-II
Malibu Town
CHOWK
72 48
77
69 70A
70
74
75
72 A
73
35 34 33
37 36 10A
10
37C
37A 37B
37D
100
99
Honda Chowk
74 A 75
A
77
78
79
87
84
88
89
85
82
81
86
90
97
96 92
91
87
95
98
97
96
M-1
M-1A
METRO STATION
M-5
M-6 PROPOSED BIGGEST ISBT
M-15
M-14
M-13 M-9
M-8
M-3A
M-11 M-10
MANESAR
M-12
GURGAON
DLF PH-IV
SULTANPUR BIRD SANCTUARY
Enigma Gurgaon
Project location
Location Gurgaon (Sector 110)
Total area (Acres) 199
Estimated total area (m sqft) 176
Estimated total units 479
Expected first handover month Oct-16
Amenities Landscaped garden high
speed elevators and state-of-the-art gymnasium
176 lac sqft
32
Indiabulls Greens Chennai
Project location
Chennai Airport
Tidel Park American School
IT - Chennai Vijaynagar Bus
Terminal
Velachery RS MATS
Perungudi Lake
Chrompet
Pallavaram Tirusulam
Meenambakkam Pazavanthangal
Chrompet
Chitlapakkam Lake
Dr Boaz Memorial Hospital
Hastinapuram Lake Medavakkam High Road
Dr Kamakshi Memorial Hospital
CTS
National Institute of Ocean Technology
Balaji Dental College
STJohns Public School
Bharathi Vidhya Mandir
Infosys
Global Health City
Sathyabama University Saint Joseph College
Bay
of B
enga
l
Gateway School
Sri Pratyangira Devi Temple
Elcot Sez
Thorapakkam
Cognizant CTS TCS
Satyam
Tata Consultancy
Accenture Wipro
Satyam
Satyam
LEGEND Distances (Approx) St Johns Public School 300m Bharathi Vidyala Mandir 700m Gateway School 1km Global Hospital 1km Distance from Main Road 500m Distance from Medavakkam Junction 1km Distance from OMR Sholinganallur 35km Prithyangara Devi Temple 4km ECR Beach 45km
Location Chennai
Total area (Acres) 159
Estimated total saleable area (m sqft) 207
Estimated total units 1611
Expected first handover month Phase 1 handed over amp Phase 2 expected to start by Nov-16
Amenities Pool Jacuzzi landscaped
garden high speed elevators amp state-of-the-art gymnasium
207 lac sqft
33
Indiabulls City Sonepat
Project location
N
IB City
P-I Zone Delhi
P-II Zone Delhi
To Delhi
To Delhi
Proposed Rajiv Gandhi
Education City
Location Sonepat
Total area (Acres) 1065
Estimated total area (m sqft) 176
Estimated total units (Plots) 755
Expected first handover month Handover started
176 lac sqft
34
One Indiabulls Gurgaon
Project location
Location Gurgaon (Sector 104)
Total area (Acres) 340
Estimated total saleable area (m sqft) 615
Estimated total units 2000
Expected first handover month Mar-19
Amenities
Lap pool Jacuzzi landscaped garden high speed elevators
and state-of-the-art gymnasium
615 lac sqft
35
Indiabulls One 09 Gurgaon
Project location
96 lac sqft
Location Gurgaon (Sector 109)
Total area (Acres) 59
Estimated total saleable area (m sqft) 096
Estimated total units 352
Expected first handover month Mar-18
36
Silverlake Villas Alibaug
Project location 26 lac sqft
Location Alibaug
Total area (Acres) 73
Estimated total saleable area (m sqft) 026
Estimated total units 34
Expected first handover month Mar-18
37
Sky Forest Lower Parel
Project location 15 lac sqft
Location Lower Parel Mumbai
Total area (Acres) (mixed use development) 97
Estimated total saleable area (m sqft) 150
Estimated total units 442
Expected first handover month Dec-18
Key amenities
120000 sqft of landscaped podium and club
swimming pool and state-of-the-art gymnasium
mini-theatre
38
Sky Suites Lower Parel
Project location 14 lac sqft
Location Lower Parel Mumbai
Total area (Acres) (mixed use development) 78
Estimated total saleable area (m sqft) 140
Estimated total units 279
Expected first handover month Dec-19
Key amenities
100000 sqft of landscaped podium and club
swimming pool and state-of-the-art gymnasium
39
Planned launches ndash Indiabulls Mint Gurgaon
bull A commercial project located in Sector 104 Gurgaon Its has a direct access from Dwarka Manesar Expressway and very close the Domestic and the International Airports
bull Net development area of 212 acres
bull The total saleable area of the project is 031m sqft
bull Currently under planning and expected to be launched in FY17
bull The project has GDV of about Rs 310 Cr
One Indiabulls Gurgaon
South Delhi
Palam Vihar
Dwarka
To Delhi
IGI Airport
Project location
Project details
40 31 lac sqft
Planned launches ndash Indiabulls Imperial Gurgaon
bull Includes residential (luxury) and commercial project located in Sector 106 Gurgaon It has a direct access from 60m wide road and very close to Dwarka Manesar Expressway Domestic and the International Airport
bull Net development area of 241 acres and 111 acres for residential and commercial sections respectively
bull The residential project includes 1700 apartments divided into 2 3 4 BHK amp Penthouses configuration and commercial project includes 347 shops and 706 office spaces
bull Currently under planning and expected to be launched by FY17
bull The project has GDV of about Rs 5933 Cr
Project details
Project location
South Delhi
IGI Airport
Dwarka
Palam Vihar
Sec-42
Metro line Delhi border Proposed development
MG road Qutub Minar IIT
JNU
R a o T u l a r a m
M a r g
Nelson Mandela Road Emporio
Vasant Vihar Ryan International School Radisson
Hotel Shiv Murti
Rajokri
Sec-27 Sec-28
Mega Mall Hotel Bristol
Sushant Lok
Courtyard Marriott
Park Plaza Max Hospital
Artemis Hospital
Delhi Public School Sec-46 Sec-45 Sec-44
Cyber Park Sec-40 Huda City
Centre Stn
Hotel Crowne Plaza
IFFCO Chowk Stn
Hotel Westin Signature Tower
Rajiv Chowk Sec-33
Hero Honda Chowk
NH 8
NH 8
Sec-34
Haldiram Toll Plaza
To Jaipur
NH 8
DT City Centre Sikanderpur Metro Stn
Cyber City Hotel Leela Kempinski
Ambience Mall
NH 8 IFFCO Chowk
Sukhrali The Oberoi
Shankar Chowk Hotel Uppalrsquos Orchid NH 8
Aero City Hospitality Commercial amp Retail Zone
Delhi Cantt
NH 8 Delhi University South Campus
To Delhi
Dhaula Kuan
Centaur Hotel Kapashera Crossing
Terminal 3
Old Delhi Gurgaon Road
Columbia Asia Hospital
Sec-111 Sec-110 Sec-105 Sec-104 Sec-101 Sec-100
Dwarka Expressway
Sec-99 A Sec-99 Sec-88 B
Sec-88 A
Sec-88
Sec-84
Sec-83 Proposed ISBT
N
Mini Secretariat
Bata Chowk
Sec-102 Sec-102A Sec-103
Sec-106 Sec-112 Sec-113
Golf Course Diplomatic Enclave Sec-22
Sec-21
Sec-23 Sec-20
OPG World School
Sec-8 Sec-9
Sec-5 Sec-10
Sec-3
GD Goenka School
Sec-1
Sec-12
Sec-108 Sec-115
Delhirsquos Reserved Green Zone
Residential Area
Fortis Hospital Travel Time
Diplomatic Enclave Dwaraka IGI Airport NH-8 Dhaula Kuan
5 minutes 10 minutes 15 minutes 20 minutes
41
42
Indiabulls Foundation Corporate Social Responsibility
Free four medical clinics to provide primary and preventive health care to the underprivileged Jan Swasthya Kalyan Vahika vehicles 9 Mobile medical vans provide free primary healthcare services to nearly 250000 patients every year Cleft deformity surgery for 1200 children across 6 states in partnership with Smile Train an international childrenrsquos charity
Health
Womenrsquos Health
Free sanitary napkins to promote hygiene and sanitation amongst rural women About 30000 underprivileged and rural women have benefitted from this initiative
Free Paushtik Aahar (nutrition supplements) to 5000 underprivileged malnourished individuals every month and regular monitoring of their health weight and height Support to women self-help groups to make Paushtik Aahar (nutritional supplements) and provide sustainable employment options to the underprivileged
Nutrition
Computer Literacy Program
In order to improve IT literacy amongst underprivileged population contributed 1000 computers to tribal ashram schools shelter homes and night schools in Mumbai Thane Raigarh and Palghar districts of Maharashtra
43
Indiabulls Foundation Corporate Social Responsibility
Education and Development
Awarded scholarships to 365 meritorious amp deserving students from economically challenged background to pursue higher education after 12th standard
Rural Empowerment
Implemented water project called lsquoRahatrsquo at 3 Tribal Ashram Schools where there was acute scarcity of water Over 2500 children from these tribal schools will benefit from this initiative every year
Indiabulls Foundation E-learning
(IBFE)
Tie-up with MKCL (Maharashtra Knowledge Corporation Ltd) authorized computer centers to help impart basic IT literacy to rural youth
Equipped 31 ashram schools with sophisticated e-learning methods to enhance the quality of education in rural Maharashtra
Installed Renewable Energy Plants at 5 tribal ashram schools in Maharashtra These plants will provide free of cost round-the-clock seamless electricity to these schools for 25 years absolutely free of cost
Started Sport Excellence Program to support athletes and provide them with world class training facilities
Disaster Relief During the Chennai floods provided timely relief to 1500 The nutritional supplement is a ready to eat mixture providing well needed nourishment to the Chennai flood affected
44
Balance Sheet
Consolidated Balance Sheet
45
Statement of Assets and Liabilities (Consolidated) (Rs Crore)As at March 31
2016 (Audited)
As at March 31 2015
(Audited)Shareholders FundsShare Capital 9234 8500 Reserves and Surplus 745999 708529 Money received against share warrants 29212 -
784445 717029 Minority Interest 5493 3319 Non Current LiabilitiesTerm Loans NCDs from Banks 473013 530353 Against OCDs CCDs 18303 19410 Deferred Tax Liabilities - 115 Other Long term liabilities 17573 18508 Long-term provisions 505 455
509394 568841 Current LiabilitiesShort-term Borrowings 26300 40100 Trade Payables 24376 20210 Other current liabilities 348999 327395 Short-term provisions 12867 7603
412542 395308 Total 1711874 1684497
ASSETSFixed AssetsTangible assets 10361 11183 Intangible assets 057 039
Capital work in progress 003 12671 10421 23893
Non Current AssetsNon-current investments 547538 549470 Deferred Tax Assets 8185 5330 Long-term loans and advances 33623 103077 Other non-current assets 6076 6030
595422 663907 Current AssetsCurrent Investments 15913 33412 Inventories 541524 601409 Trade Receivables 47645 15940 Cash and bank balances 124317 66943 Short-term loans and advances 118588 91702 Other current assets 258044 187291
1106031 996697 Total 1711874 1684497
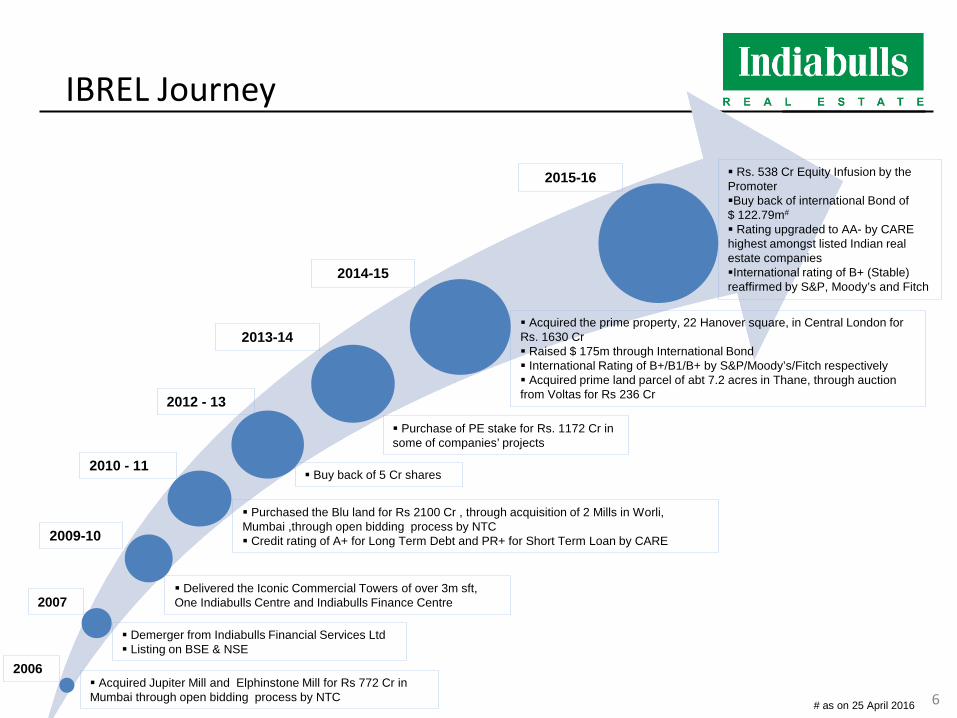
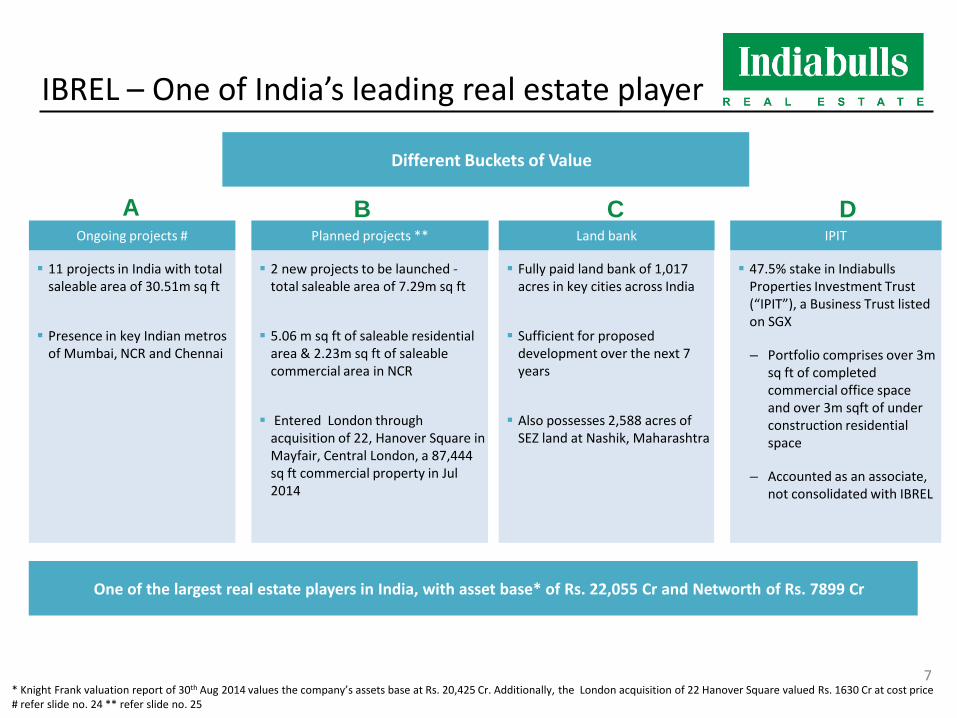
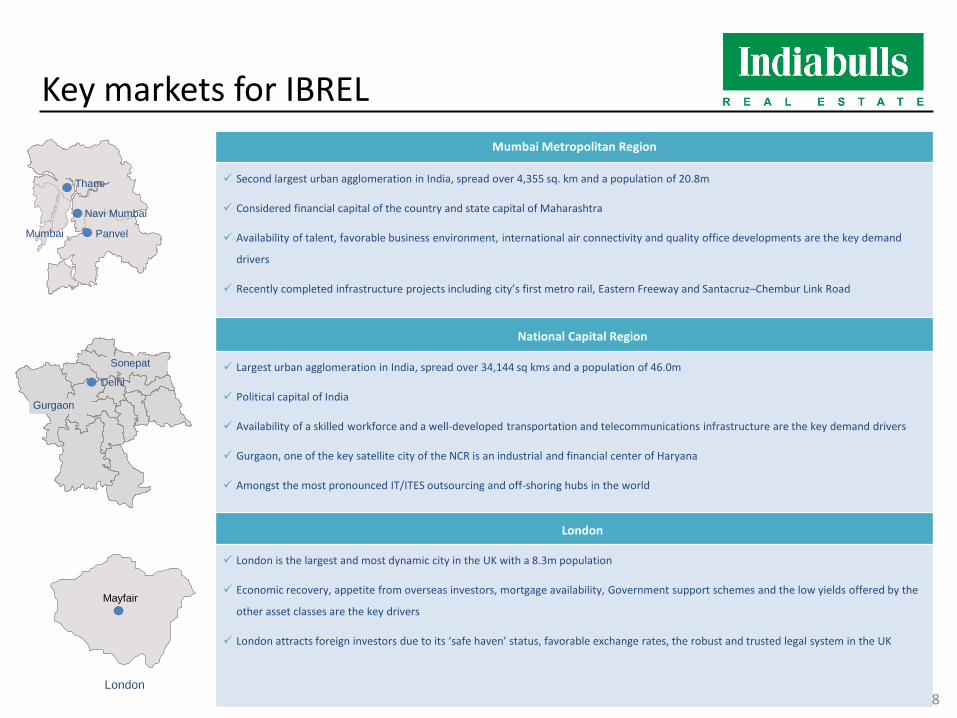
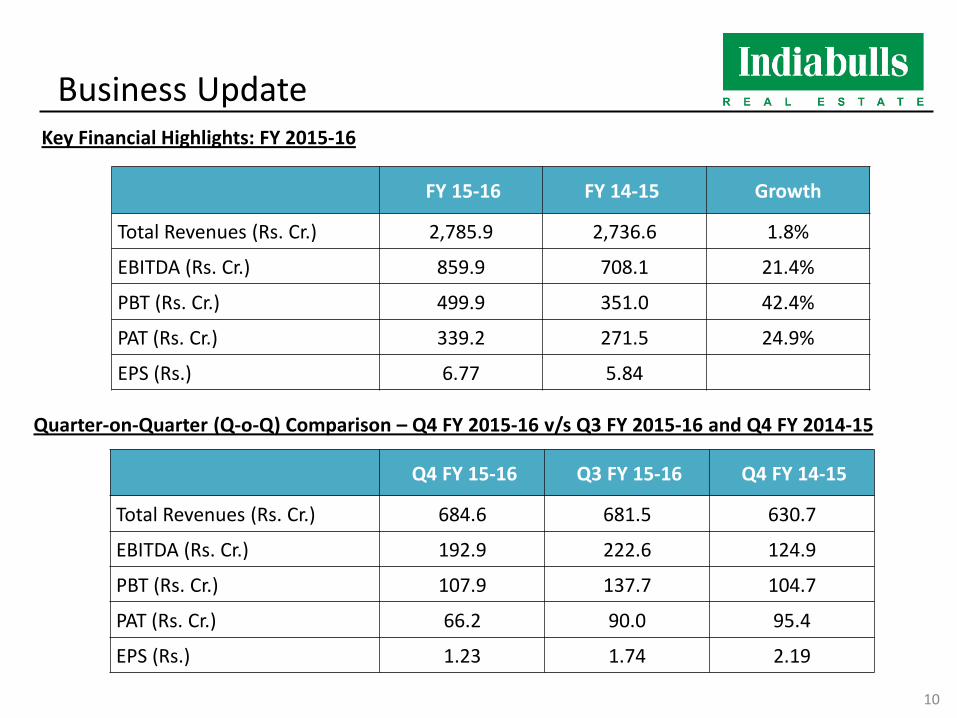
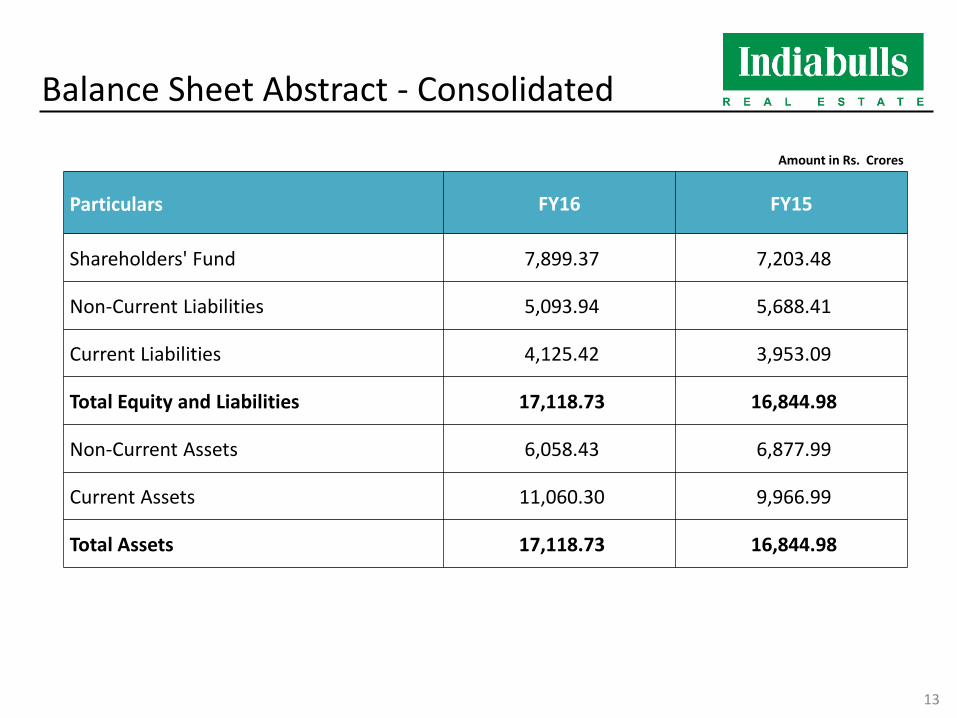
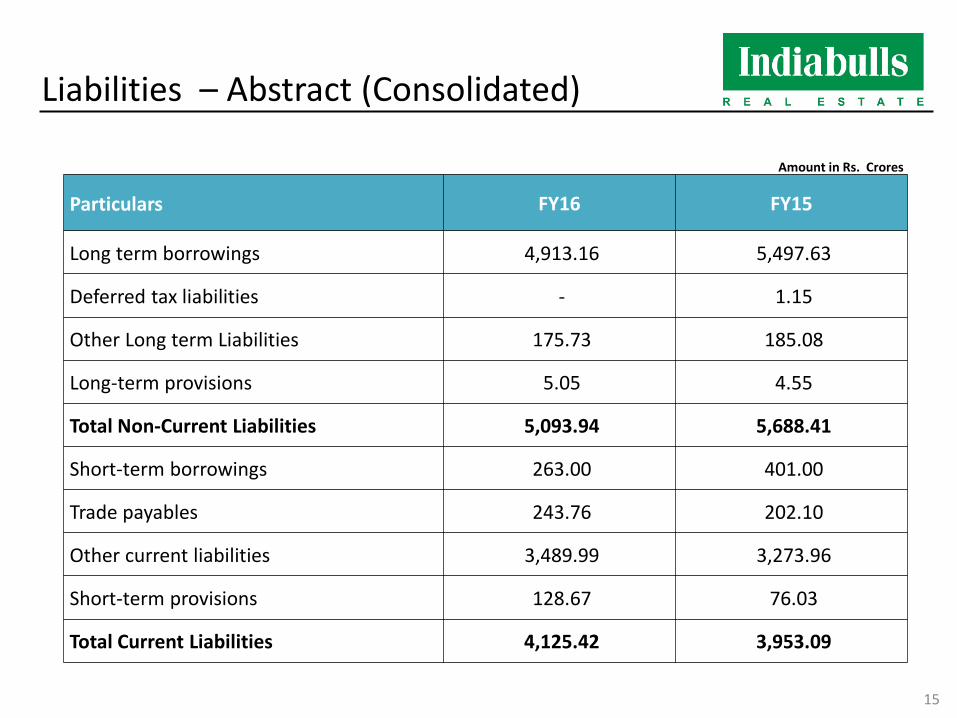
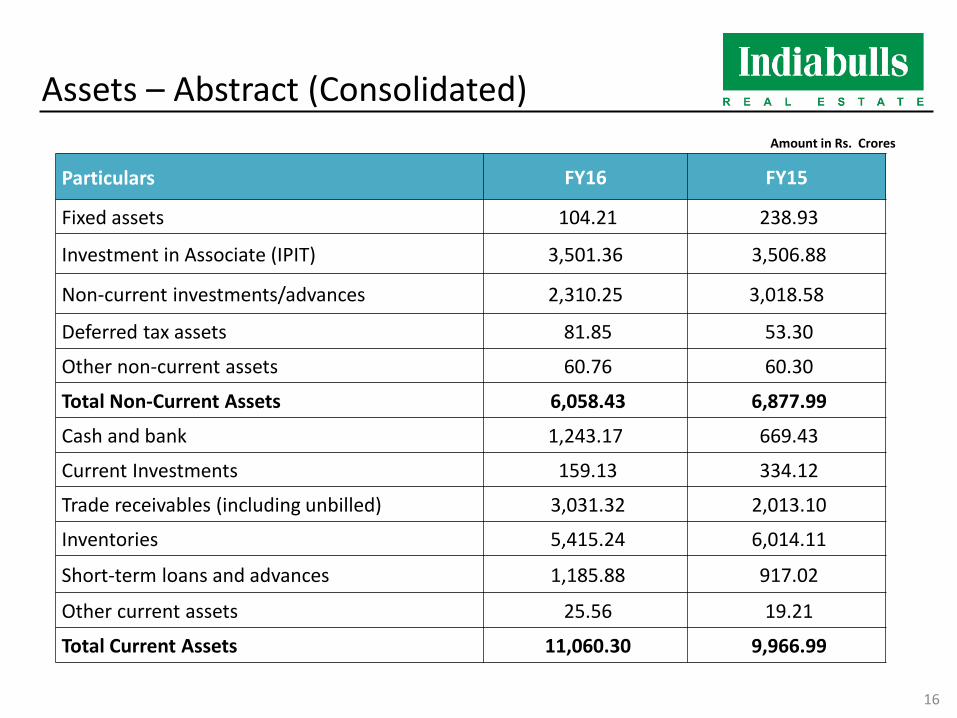
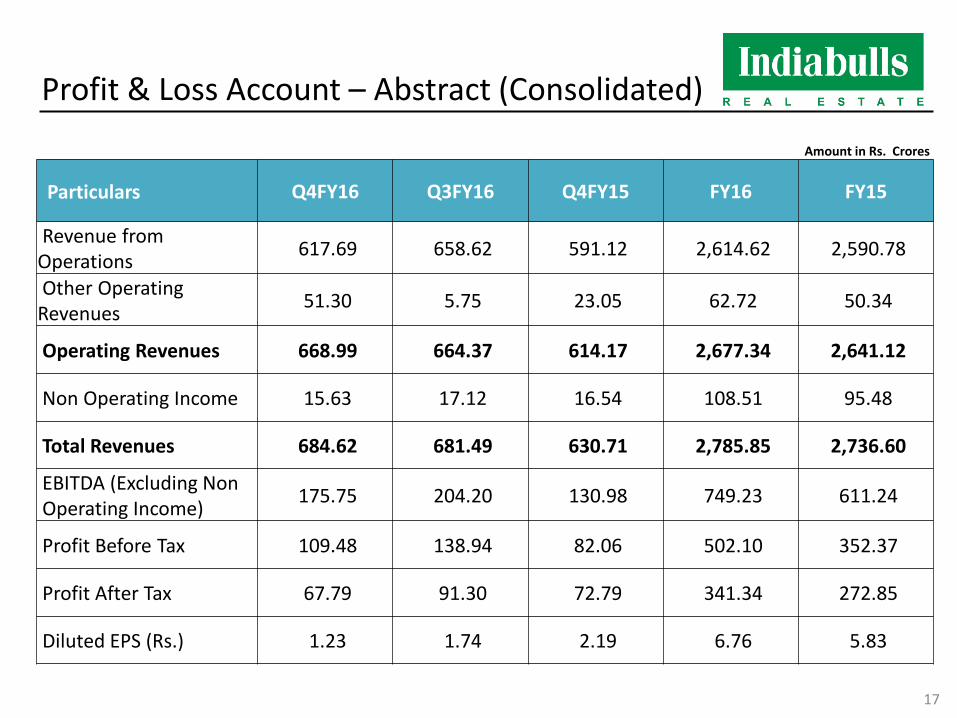
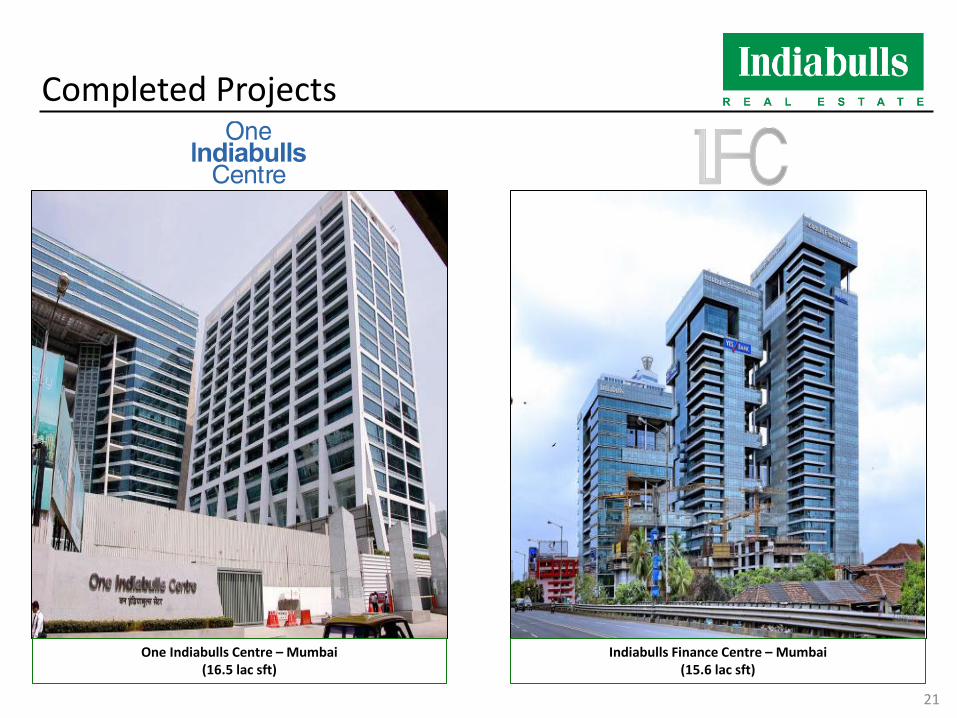

Completed Projects (Contd)
Indiabulls Centrum ndash Madurai (16 lac sft)
Indiabulls Centrum Park ndash Gurgaon Phase 1 (48 lac sft) 22
Sky 882 Lower Parel (4 lac sft)
Completed Projects (Contd)
Indiabulls Mint ndash Thane (06 lac sft)
Indiabulls Greens ndash Chennai Phase 1 (45 lac sft)
Vatika ndash Ahmedabad (16 lac sft)
Mega Mall ndash Vadodara (23 lac sft)
23
Snapshot ndash Ongoing Projects (A)
Project Location Type Launched Area (m sq ft)
Gross Development
Value (INR Cr)
Expected first handover
Month
IBREL Ongoing Projects Blu Worli Mumbai Residential (Luxury) 121 6432 Mar 17
Indiabulls Greens Panvel Mumbai Residential (Premium) 873 4459 Ready to start Handover
Indiabulls Golf City Savroli Mumbai Residential (Premium) 522 3168 Aug 16
Centrum Park Gurgaon NCR Residential (Mid Income) 216 915 Handover
started
Enigma Gurgaon NCR Residential (Premium) 176 1130 Oct 16
Indiabulls Greens Chennai Chennai Residential (Mid Income) 207 828 Nov 16
Indiabulls City Sonepat NCR Residential (Plot) 176 254 Handover started
One Indiabulls Gurgaon NCR Residential (Premium) 615 4922 Mar 19
One Indiabulls Vadodara Vadodara Commercial 023 83 Mar 17
Indiabulls One 09 Gurgaon Commercial 096 768 Mar 18
Silverlake Villas Alibaug Mumbai High end Villas (Luxury) 026 164 Mar 18
IBREL Projects Total 3051 23123 IPIT Ongoing Projects Sky Forest Lower Parel Mumbai Residential (Luxury) 150 3936 Dec 18
Sky Suites Lower Parel Mumbai Residential (Luxury) 140 3804 Dec 19
IPIT Projects Total 290 7740 =gtAbove includes only ongoing projects and does not include the potential GDV of projects that will be planned in future on the land bank in possession amp fully paid for
24
Snapshot ndash Planned Projects (B)
=gtAbove includes only projects currently planned and does not include the potential GDV of projects that will be planned in future on the land bank in possession amp fully paid for
Project Location Type Launched Area (m sq ft)
Gross Development
Value (INR Cr)
Expected first handover
month
Planned Projects
Indiabulls Mint Gurgaon (Sec 104) NCR Commercial - 031 310 Mar 19
Indiabulls Imperial Gurgaon (Sec 106) NCR Residential
Commercial (Premium) - 698 5933 Mar 18
22 Hanover Square London Residential Hotel (Luxury) - 010 5200 Mar 19
Total - Planned Projects 739 11443
25
Summary of Ongoing amp Planned Projects (A amp B)
Summary Snapshot Rs Cr Pending Collection from Sold Inventory (a) 4136
Pending Construction Cost (b) 8130
Value of Unsold Inventory (c) 23670
Net Surplus (a+c-b) 19676
Expected Net Surplus of Rs 19676 Cr by 2019
=gt Above includes only ongoing amp planned projects and does not include the potential GDV of projects that will be planned in future on the land bank in possession amp fully paid for
=gtThis does not include assets under IPIT ndash 2 commercial and 3 residential properties of cumulative area over of 3m sft of office space amp over 3m sft of residential area under construction
26
Portfolio Diversification
GDV Spread across Locations GDV Spread across Segments
Total Gross Development Value of Rs 34566 Cr
Mumbai Metropolitan
Region 41
National Capital Region
41
Central London 15
Others 2
Super Premium Luxury
34
Premium 60
Mid-Income 6
=gtAbove includes only ongoing amp planned projects and does not include the potential GDV of projects that will be planned in future on the land bank in possession amp fully paid for rArrThis does not include assets under IPIT ndash 2 commercial and 3 residential properties of cumulative area over of 3m sft of office space amp over 3m sft of residential area under construction 27
Blu Worli
Project location
WORLI CIRCLE
One Indiabulls
Worli
Location Worli Mumbai
Total area (Acres) 100
Estimated total saleable area (m sqft) 121
Estimated total units 345
Expected first handover month Mar-17
Key amenities
5 acre landscape garden 1 km jogging and walking track
championship size football field swimming pool and state-of-the-
art gymnasium
121 lac sqft
28
Indiabulls Greens Panvel
Project location
Location Panvel Navi Mumbai
Total area (Acres) 523
Estimated total saleable area (m sqft) 873
Estimated total units 6701
Expected first handover month Phase 1 Ready to start Handover
Amenities
Dedicated sports facilities shopping centers restaurants
banks pharmacies amp a post office Spa with Jacuzzi steam
sauna and massage room
Proposed International Airport
McDonalds Kalamboli Circle MGM Hospital
Khandeswar Railway Station
Klamboli Railway Station
Panvel Railway Station
Hotal Natraj
To Pune Palaspa Phata
Somathane Railway Station
To Goa
Datta Guru Snacks
To Rasayani
ONGC Colony
To JNPT
873 lac sqft
29
Indiabulls Golf City Savroli
Project location
30
Location Savroli Navi Mumbai
Total area (Acres) 1100
Estimated total saleable area (m sqft) 522
Estimated total units 4016
Expected first handover month Aug-16
Key amenities
An 18 hole golf course leisure swimming pool sports training
academies and amenities lavish entertainment and
shopping precinct advanced home automation and security
systems 522 lac sqft
LONAVALA KHALAPUR TOLL BOOTH
GREENS PANVEL
NAVI MUMBAI INTERNATIONAL AIRPORT GOLF CITY
TOWARDS PUNE
VIA MUMBAI-PUNE EXPRESSWAY
MUMBAI
Centrum Park Gurgaon
Project location
31
Location Gurgaon (Sector 103)
Total area (Acres) 221
Estimated total saleable area (m sqft) 216
Estimated total units 1037
Expected first handover month Phase 1 Handover Started
Amenities Clubhouse fully equipped
gymnasium yoga and aerobics lounge salon amp spa
216 lac sqft
Centrum Park
115
114
112
113
109 106
107
108
110 111 105 104 101
102
102A 103
110A
2 1 Palam Vihar
33 23
3
5
6
4
3A
9 7
9A
Amunation Depot
8 12
12A
11
14 17
16
39
22 21
20 18
19
To Delhi
To Delhi
To Delhi
To Delhi
Metro route from Dwarka Along 150 mtr wide road
24 25
28
27 25
25A
42
44 45
40 41
South City
39
46 47
49
66
32 30 IFFCO CHOWK
DLF PH-11
DLF PH-11
DLF PH-1
ATUL KATARI CHOWK Fountain Chowk
Proposed DWARKA MANESAR 150mtr Expressway
South City-II
Malibu Town
CHOWK
72 48
77
69 70A
70
74
75
72 A
73
35 34 33
37 36 10A
10
37C
37A 37B
37D
100
99
Honda Chowk
74 A 75
A
77
78
79
87
84
88
89
85
82
81
86
90
97
96 92
91
87
95
98
97
96
M-1
M-1A
METRO STATION
M-5
M-6 PROPOSED BIGGEST ISBT
M-15
M-14
M-13 M-9
M-8
M-3A
M-11 M-10
MANESAR
M-12
GURGAON
DLF PH-IV
SULTANPUR BIRD SANCTUARY
Enigma Gurgaon
Project location
Location Gurgaon (Sector 110)
Total area (Acres) 199
Estimated total area (m sqft) 176
Estimated total units 479
Expected first handover month Oct-16
Amenities Landscaped garden high
speed elevators and state-of-the-art gymnasium
176 lac sqft
32
Indiabulls Greens Chennai
Project location
Chennai Airport
Tidel Park American School
IT - Chennai Vijaynagar Bus
Terminal
Velachery RS MATS
Perungudi Lake
Chrompet
Pallavaram Tirusulam
Meenambakkam Pazavanthangal
Chrompet
Chitlapakkam Lake
Dr Boaz Memorial Hospital
Hastinapuram Lake Medavakkam High Road
Dr Kamakshi Memorial Hospital
CTS
National Institute of Ocean Technology
Balaji Dental College
STJohns Public School
Bharathi Vidhya Mandir
Infosys
Global Health City
Sathyabama University Saint Joseph College
Bay
of B
enga
l
Gateway School
Sri Pratyangira Devi Temple
Elcot Sez
Thorapakkam
Cognizant CTS TCS
Satyam
Tata Consultancy
Accenture Wipro
Satyam
Satyam
LEGEND Distances (Approx) St Johns Public School 300m Bharathi Vidyala Mandir 700m Gateway School 1km Global Hospital 1km Distance from Main Road 500m Distance from Medavakkam Junction 1km Distance from OMR Sholinganallur 35km Prithyangara Devi Temple 4km ECR Beach 45km
Location Chennai
Total area (Acres) 159
Estimated total saleable area (m sqft) 207
Estimated total units 1611
Expected first handover month Phase 1 handed over amp Phase 2 expected to start by Nov-16
Amenities Pool Jacuzzi landscaped
garden high speed elevators amp state-of-the-art gymnasium
207 lac sqft
33
Indiabulls City Sonepat
Project location
N
IB City
P-I Zone Delhi
P-II Zone Delhi
To Delhi
To Delhi
Proposed Rajiv Gandhi
Education City
Location Sonepat
Total area (Acres) 1065
Estimated total area (m sqft) 176
Estimated total units (Plots) 755
Expected first handover month Handover started
176 lac sqft
34
One Indiabulls Gurgaon
Project location
Location Gurgaon (Sector 104)
Total area (Acres) 340
Estimated total saleable area (m sqft) 615
Estimated total units 2000
Expected first handover month Mar-19
Amenities
Lap pool Jacuzzi landscaped garden high speed elevators
and state-of-the-art gymnasium
615 lac sqft
35
Indiabulls One 09 Gurgaon
Project location
96 lac sqft
Location Gurgaon (Sector 109)
Total area (Acres) 59
Estimated total saleable area (m sqft) 096
Estimated total units 352
Expected first handover month Mar-18
36
Silverlake Villas Alibaug
Project location 26 lac sqft
Location Alibaug
Total area (Acres) 73
Estimated total saleable area (m sqft) 026
Estimated total units 34
Expected first handover month Mar-18
37
Sky Forest Lower Parel
Project location 15 lac sqft
Location Lower Parel Mumbai
Total area (Acres) (mixed use development) 97
Estimated total saleable area (m sqft) 150
Estimated total units 442
Expected first handover month Dec-18
Key amenities
120000 sqft of landscaped podium and club
swimming pool and state-of-the-art gymnasium
mini-theatre
38
Sky Suites Lower Parel
Project location 14 lac sqft
Location Lower Parel Mumbai
Total area (Acres) (mixed use development) 78
Estimated total saleable area (m sqft) 140
Estimated total units 279
Expected first handover month Dec-19
Key amenities
100000 sqft of landscaped podium and club
swimming pool and state-of-the-art gymnasium
39
Planned launches ndash Indiabulls Mint Gurgaon
bull A commercial project located in Sector 104 Gurgaon Its has a direct access from Dwarka Manesar Expressway and very close the Domestic and the International Airports
bull Net development area of 212 acres
bull The total saleable area of the project is 031m sqft
bull Currently under planning and expected to be launched in FY17
bull The project has GDV of about Rs 310 Cr
One Indiabulls Gurgaon
South Delhi
Palam Vihar
Dwarka
To Delhi
IGI Airport
Project location
Project details
40 31 lac sqft
Planned launches ndash Indiabulls Imperial Gurgaon
bull Includes residential (luxury) and commercial project located in Sector 106 Gurgaon It has a direct access from 60m wide road and very close to Dwarka Manesar Expressway Domestic and the International Airport
bull Net development area of 241 acres and 111 acres for residential and commercial sections respectively
bull The residential project includes 1700 apartments divided into 2 3 4 BHK amp Penthouses configuration and commercial project includes 347 shops and 706 office spaces
bull Currently under planning and expected to be launched by FY17
bull The project has GDV of about Rs 5933 Cr
Project details
Project location
South Delhi
IGI Airport
Dwarka
Palam Vihar
Sec-42
Metro line Delhi border Proposed development
MG road Qutub Minar IIT
JNU
R a o T u l a r a m
M a r g
Nelson Mandela Road Emporio
Vasant Vihar Ryan International School Radisson
Hotel Shiv Murti
Rajokri
Sec-27 Sec-28
Mega Mall Hotel Bristol
Sushant Lok
Courtyard Marriott
Park Plaza Max Hospital
Artemis Hospital
Delhi Public School Sec-46 Sec-45 Sec-44
Cyber Park Sec-40 Huda City
Centre Stn
Hotel Crowne Plaza
IFFCO Chowk Stn
Hotel Westin Signature Tower
Rajiv Chowk Sec-33
Hero Honda Chowk
NH 8
NH 8
Sec-34
Haldiram Toll Plaza
To Jaipur
NH 8
DT City Centre Sikanderpur Metro Stn
Cyber City Hotel Leela Kempinski
Ambience Mall
NH 8 IFFCO Chowk
Sukhrali The Oberoi
Shankar Chowk Hotel Uppalrsquos Orchid NH 8
Aero City Hospitality Commercial amp Retail Zone
Delhi Cantt
NH 8 Delhi University South Campus
To Delhi
Dhaula Kuan
Centaur Hotel Kapashera Crossing
Terminal 3
Old Delhi Gurgaon Road
Columbia Asia Hospital
Sec-111 Sec-110 Sec-105 Sec-104 Sec-101 Sec-100
Dwarka Expressway
Sec-99 A Sec-99 Sec-88 B
Sec-88 A
Sec-88
Sec-84
Sec-83 Proposed ISBT
N
Mini Secretariat
Bata Chowk
Sec-102 Sec-102A Sec-103
Sec-106 Sec-112 Sec-113
Golf Course Diplomatic Enclave Sec-22
Sec-21
Sec-23 Sec-20
OPG World School
Sec-8 Sec-9
Sec-5 Sec-10
Sec-3
GD Goenka School
Sec-1
Sec-12
Sec-108 Sec-115
Delhirsquos Reserved Green Zone
Residential Area
Fortis Hospital Travel Time
Diplomatic Enclave Dwaraka IGI Airport NH-8 Dhaula Kuan
5 minutes 10 minutes 15 minutes 20 minutes
41
42
Indiabulls Foundation Corporate Social Responsibility
Free four medical clinics to provide primary and preventive health care to the underprivileged Jan Swasthya Kalyan Vahika vehicles 9 Mobile medical vans provide free primary healthcare services to nearly 250000 patients every year Cleft deformity surgery for 1200 children across 6 states in partnership with Smile Train an international childrenrsquos charity
Health
Womenrsquos Health
Free sanitary napkins to promote hygiene and sanitation amongst rural women About 30000 underprivileged and rural women have benefitted from this initiative
Free Paushtik Aahar (nutrition supplements) to 5000 underprivileged malnourished individuals every month and regular monitoring of their health weight and height Support to women self-help groups to make Paushtik Aahar (nutritional supplements) and provide sustainable employment options to the underprivileged
Nutrition
Computer Literacy Program
In order to improve IT literacy amongst underprivileged population contributed 1000 computers to tribal ashram schools shelter homes and night schools in Mumbai Thane Raigarh and Palghar districts of Maharashtra
43
Indiabulls Foundation Corporate Social Responsibility
Education and Development
Awarded scholarships to 365 meritorious amp deserving students from economically challenged background to pursue higher education after 12th standard
Rural Empowerment
Implemented water project called lsquoRahatrsquo at 3 Tribal Ashram Schools where there was acute scarcity of water Over 2500 children from these tribal schools will benefit from this initiative every year
Indiabulls Foundation E-learning
(IBFE)
Tie-up with MKCL (Maharashtra Knowledge Corporation Ltd) authorized computer centers to help impart basic IT literacy to rural youth
Equipped 31 ashram schools with sophisticated e-learning methods to enhance the quality of education in rural Maharashtra
Installed Renewable Energy Plants at 5 tribal ashram schools in Maharashtra These plants will provide free of cost round-the-clock seamless electricity to these schools for 25 years absolutely free of cost
Started Sport Excellence Program to support athletes and provide them with world class training facilities
Disaster Relief During the Chennai floods provided timely relief to 1500 The nutritional supplement is a ready to eat mixture providing well needed nourishment to the Chennai flood affected
44
Balance Sheet
Consolidated Balance Sheet
45
Statement of Assets and Liabilities (Consolidated) (Rs Crore)As at March 31
2016 (Audited)
As at March 31 2015
(Audited)Shareholders FundsShare Capital 9234 8500 Reserves and Surplus 745999 708529 Money received against share warrants 29212 -
784445 717029 Minority Interest 5493 3319 Non Current LiabilitiesTerm Loans NCDs from Banks 473013 530353 Against OCDs CCDs 18303 19410 Deferred Tax Liabilities - 115 Other Long term liabilities 17573 18508 Long-term provisions 505 455
509394 568841 Current LiabilitiesShort-term Borrowings 26300 40100 Trade Payables 24376 20210 Other current liabilities 348999 327395 Short-term provisions 12867 7603
412542 395308 Total 1711874 1684497
ASSETSFixed AssetsTangible assets 10361 11183 Intangible assets 057 039
Capital work in progress 003 12671 10421 23893
Non Current AssetsNon-current investments 547538 549470 Deferred Tax Assets 8185 5330 Long-term loans and advances 33623 103077 Other non-current assets 6076 6030
595422 663907 Current AssetsCurrent Investments 15913 33412 Inventories 541524 601409 Trade Receivables 47645 15940 Cash and bank balances 124317 66943 Short-term loans and advances 118588 91702 Other current assets 258044 187291
1106031 996697 Total 1711874 1684497
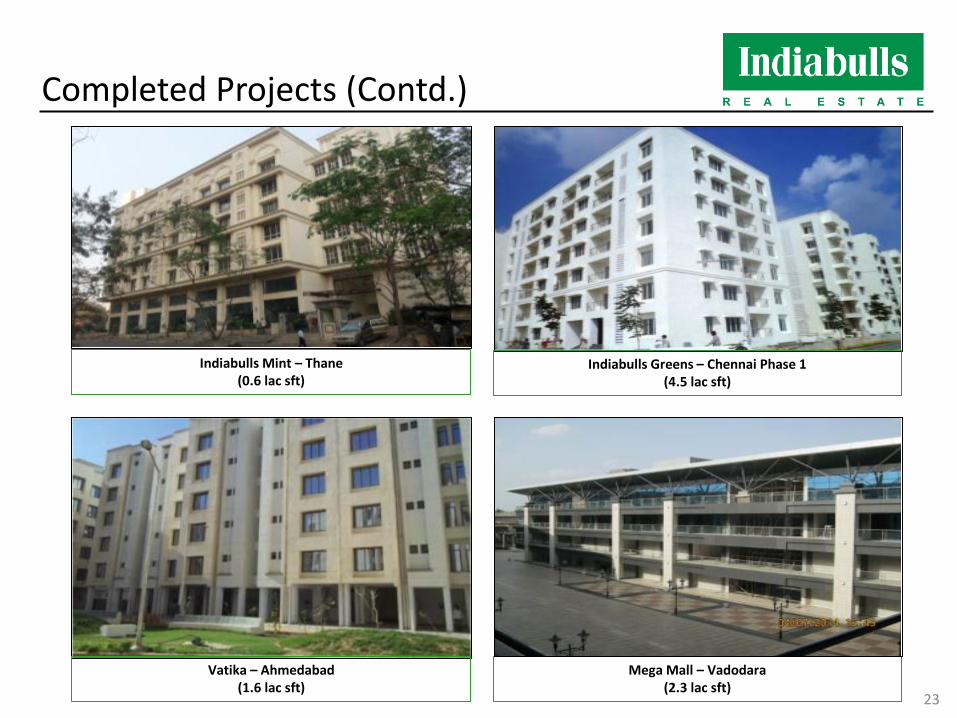
Completed Projects (Contd)
Indiabulls Mint ndash Thane (06 lac sft)
Indiabulls Greens ndash Chennai Phase 1 (45 lac sft)
Vatika ndash Ahmedabad (16 lac sft)
Mega Mall ndash Vadodara (23 lac sft)
23
Snapshot ndash Ongoing Projects (A)
Project Location Type Launched Area (m sq ft)
Gross Development
Value (INR Cr)
Expected first handover
Month
IBREL Ongoing Projects Blu Worli Mumbai Residential (Luxury) 121 6432 Mar 17
Indiabulls Greens Panvel Mumbai Residential (Premium) 873 4459 Ready to start Handover
Indiabulls Golf City Savroli Mumbai Residential (Premium) 522 3168 Aug 16
Centrum Park Gurgaon NCR Residential (Mid Income) 216 915 Handover
started
Enigma Gurgaon NCR Residential (Premium) 176 1130 Oct 16
Indiabulls Greens Chennai Chennai Residential (Mid Income) 207 828 Nov 16
Indiabulls City Sonepat NCR Residential (Plot) 176 254 Handover started
One Indiabulls Gurgaon NCR Residential (Premium) 615 4922 Mar 19
One Indiabulls Vadodara Vadodara Commercial 023 83 Mar 17
Indiabulls One 09 Gurgaon Commercial 096 768 Mar 18
Silverlake Villas Alibaug Mumbai High end Villas (Luxury) 026 164 Mar 18
IBREL Projects Total 3051 23123 IPIT Ongoing Projects Sky Forest Lower Parel Mumbai Residential (Luxury) 150 3936 Dec 18
Sky Suites Lower Parel Mumbai Residential (Luxury) 140 3804 Dec 19
IPIT Projects Total 290 7740 =gtAbove includes only ongoing projects and does not include the potential GDV of projects that will be planned in future on the land bank in possession amp fully paid for
24
Snapshot ndash Planned Projects (B)
=gtAbove includes only projects currently planned and does not include the potential GDV of projects that will be planned in future on the land bank in possession amp fully paid for
Project Location Type Launched Area (m sq ft)
Gross Development
Value (INR Cr)
Expected first handover
month
Planned Projects
Indiabulls Mint Gurgaon (Sec 104) NCR Commercial - 031 310 Mar 19
Indiabulls Imperial Gurgaon (Sec 106) NCR Residential
Commercial (Premium) - 698 5933 Mar 18
22 Hanover Square London Residential Hotel (Luxury) - 010 5200 Mar 19
Total - Planned Projects 739 11443
25
Summary of Ongoing amp Planned Projects (A amp B)
Summary Snapshot Rs Cr Pending Collection from Sold Inventory (a) 4136
Pending Construction Cost (b) 8130
Value of Unsold Inventory (c) 23670
Net Surplus (a+c-b) 19676
Expected Net Surplus of Rs 19676 Cr by 2019
=gt Above includes only ongoing amp planned projects and does not include the potential GDV of projects that will be planned in future on the land bank in possession amp fully paid for
=gtThis does not include assets under IPIT ndash 2 commercial and 3 residential properties of cumulative area over of 3m sft of office space amp over 3m sft of residential area under construction
26
Portfolio Diversification
GDV Spread across Locations GDV Spread across Segments
Total Gross Development Value of Rs 34566 Cr
Mumbai Metropolitan
Region 41
National Capital Region
41
Central London 15
Others 2
Super Premium Luxury
34
Premium 60
Mid-Income 6
=gtAbove includes only ongoing amp planned projects and does not include the potential GDV of projects that will be planned in future on the land bank in possession amp fully paid for rArrThis does not include assets under IPIT ndash 2 commercial and 3 residential properties of cumulative area over of 3m sft of office space amp over 3m sft of residential area under construction 27
Blu Worli
Project location
WORLI CIRCLE
One Indiabulls
Worli
Location Worli Mumbai
Total area (Acres) 100
Estimated total saleable area (m sqft) 121
Estimated total units 345
Expected first handover month Mar-17
Key amenities
5 acre landscape garden 1 km jogging and walking track
championship size football field swimming pool and state-of-the-
art gymnasium
121 lac sqft
28
Indiabulls Greens Panvel
Project location
Location Panvel Navi Mumbai
Total area (Acres) 523
Estimated total saleable area (m sqft) 873
Estimated total units 6701
Expected first handover month Phase 1 Ready to start Handover
Amenities
Dedicated sports facilities shopping centers restaurants
banks pharmacies amp a post office Spa with Jacuzzi steam
sauna and massage room
Proposed International Airport
McDonalds Kalamboli Circle MGM Hospital
Khandeswar Railway Station
Klamboli Railway Station
Panvel Railway Station
Hotal Natraj
To Pune Palaspa Phata
Somathane Railway Station
To Goa
Datta Guru Snacks
To Rasayani
ONGC Colony
To JNPT
873 lac sqft
29
Indiabulls Golf City Savroli
Project location
30
Location Savroli Navi Mumbai
Total area (Acres) 1100
Estimated total saleable area (m sqft) 522
Estimated total units 4016
Expected first handover month Aug-16
Key amenities
An 18 hole golf course leisure swimming pool sports training
academies and amenities lavish entertainment and
shopping precinct advanced home automation and security
systems 522 lac sqft
LONAVALA KHALAPUR TOLL BOOTH
GREENS PANVEL
NAVI MUMBAI INTERNATIONAL AIRPORT GOLF CITY
TOWARDS PUNE
VIA MUMBAI-PUNE EXPRESSWAY
MUMBAI
Centrum Park Gurgaon
Project location
31
Location Gurgaon (Sector 103)
Total area (Acres) 221
Estimated total saleable area (m sqft) 216
Estimated total units 1037
Expected first handover month Phase 1 Handover Started
Amenities Clubhouse fully equipped
gymnasium yoga and aerobics lounge salon amp spa
216 lac sqft
Centrum Park
115
114
112
113
109 106
107
108
110 111 105 104 101
102
102A 103
110A
2 1 Palam Vihar
33 23
3
5
6
4
3A
9 7
9A
Amunation Depot
8 12
12A
11
14 17
16
39
22 21
20 18
19
To Delhi
To Delhi
To Delhi
To Delhi
Metro route from Dwarka Along 150 mtr wide road
24 25
28
27 25
25A
42
44 45
40 41
South City
39
46 47
49
66
32 30 IFFCO CHOWK
DLF PH-11
DLF PH-11
DLF PH-1
ATUL KATARI CHOWK Fountain Chowk
Proposed DWARKA MANESAR 150mtr Expressway
South City-II
Malibu Town
CHOWK
72 48
77
69 70A
70
74
75
72 A
73
35 34 33
37 36 10A
10
37C
37A 37B
37D
100
99
Honda Chowk
74 A 75
A
77
78
79
87
84
88
89
85
82
81
86
90
97
96 92
91
87
95
98
97
96
M-1
M-1A
METRO STATION
M-5
M-6 PROPOSED BIGGEST ISBT
M-15
M-14
M-13 M-9
M-8
M-3A
M-11 M-10
MANESAR
M-12
GURGAON
DLF PH-IV
SULTANPUR BIRD SANCTUARY
Enigma Gurgaon
Project location
Location Gurgaon (Sector 110)
Total area (Acres) 199
Estimated total area (m sqft) 176
Estimated total units 479
Expected first handover month Oct-16
Amenities Landscaped garden high
speed elevators and state-of-the-art gymnasium
176 lac sqft
32
Indiabulls Greens Chennai
Project location
Chennai Airport
Tidel Park American School
IT - Chennai Vijaynagar Bus
Terminal
Velachery RS MATS
Perungudi Lake
Chrompet
Pallavaram Tirusulam
Meenambakkam Pazavanthangal
Chrompet
Chitlapakkam Lake
Dr Boaz Memorial Hospital
Hastinapuram Lake Medavakkam High Road
Dr Kamakshi Memorial Hospital
CTS
National Institute of Ocean Technology
Balaji Dental College
STJohns Public School
Bharathi Vidhya Mandir
Infosys
Global Health City
Sathyabama University Saint Joseph College
Bay
of B
enga
l
Gateway School
Sri Pratyangira Devi Temple
Elcot Sez
Thorapakkam
Cognizant CTS TCS
Satyam
Tata Consultancy
Accenture Wipro
Satyam
Satyam
LEGEND Distances (Approx) St Johns Public School 300m Bharathi Vidyala Mandir 700m Gateway School 1km Global Hospital 1km Distance from Main Road 500m Distance from Medavakkam Junction 1km Distance from OMR Sholinganallur 35km Prithyangara Devi Temple 4km ECR Beach 45km
Location Chennai
Total area (Acres) 159
Estimated total saleable area (m sqft) 207
Estimated total units 1611
Expected first handover month Phase 1 handed over amp Phase 2 expected to start by Nov-16
Amenities Pool Jacuzzi landscaped
garden high speed elevators amp state-of-the-art gymnasium
207 lac sqft
33
Indiabulls City Sonepat
Project location
N
IB City
P-I Zone Delhi
P-II Zone Delhi
To Delhi
To Delhi
Proposed Rajiv Gandhi
Education City
Location Sonepat
Total area (Acres) 1065
Estimated total area (m sqft) 176
Estimated total units (Plots) 755
Expected first handover month Handover started
176 lac sqft
34
One Indiabulls Gurgaon
Project location
Location Gurgaon (Sector 104)
Total area (Acres) 340
Estimated total saleable area (m sqft) 615
Estimated total units 2000
Expected first handover month Mar-19
Amenities
Lap pool Jacuzzi landscaped garden high speed elevators
and state-of-the-art gymnasium
615 lac sqft
35
Indiabulls One 09 Gurgaon
Project location
96 lac sqft
Location Gurgaon (Sector 109)
Total area (Acres) 59
Estimated total saleable area (m sqft) 096
Estimated total units 352
Expected first handover month Mar-18
36
Silverlake Villas Alibaug
Project location 26 lac sqft
Location Alibaug
Total area (Acres) 73
Estimated total saleable area (m sqft) 026
Estimated total units 34
Expected first handover month Mar-18
37
Sky Forest Lower Parel
Project location 15 lac sqft
Location Lower Parel Mumbai
Total area (Acres) (mixed use development) 97
Estimated total saleable area (m sqft) 150
Estimated total units 442
Expected first handover month Dec-18
Key amenities
120000 sqft of landscaped podium and club
swimming pool and state-of-the-art gymnasium
mini-theatre
38
Sky Suites Lower Parel
Project location 14 lac sqft
Location Lower Parel Mumbai
Total area (Acres) (mixed use development) 78
Estimated total saleable area (m sqft) 140
Estimated total units 279
Expected first handover month Dec-19
Key amenities
100000 sqft of landscaped podium and club
swimming pool and state-of-the-art gymnasium
39
Planned launches ndash Indiabulls Mint Gurgaon
bull A commercial project located in Sector 104 Gurgaon Its has a direct access from Dwarka Manesar Expressway and very close the Domestic and the International Airports
bull Net development area of 212 acres
bull The total saleable area of the project is 031m sqft
bull Currently under planning and expected to be launched in FY17
bull The project has GDV of about Rs 310 Cr
One Indiabulls Gurgaon
South Delhi
Palam Vihar
Dwarka
To Delhi
IGI Airport
Project location
Project details
40 31 lac sqft
Planned launches ndash Indiabulls Imperial Gurgaon
bull Includes residential (luxury) and commercial project located in Sector 106 Gurgaon It has a direct access from 60m wide road and very close to Dwarka Manesar Expressway Domestic and the International Airport
bull Net development area of 241 acres and 111 acres for residential and commercial sections respectively
bull The residential project includes 1700 apartments divided into 2 3 4 BHK amp Penthouses configuration and commercial project includes 347 shops and 706 office spaces
bull Currently under planning and expected to be launched by FY17
bull The project has GDV of about Rs 5933 Cr
Project details
Project location
South Delhi
IGI Airport
Dwarka
Palam Vihar
Sec-42
Metro line Delhi border Proposed development
MG road Qutub Minar IIT
JNU
R a o T u l a r a m
M a r g
Nelson Mandela Road Emporio
Vasant Vihar Ryan International School Radisson
Hotel Shiv Murti
Rajokri
Sec-27 Sec-28
Mega Mall Hotel Bristol
Sushant Lok
Courtyard Marriott
Park Plaza Max Hospital
Artemis Hospital
Delhi Public School Sec-46 Sec-45 Sec-44
Cyber Park Sec-40 Huda City
Centre Stn
Hotel Crowne Plaza
IFFCO Chowk Stn
Hotel Westin Signature Tower
Rajiv Chowk Sec-33
Hero Honda Chowk
NH 8
NH 8
Sec-34
Haldiram Toll Plaza
To Jaipur
NH 8
DT City Centre Sikanderpur Metro Stn
Cyber City Hotel Leela Kempinski
Ambience Mall
NH 8 IFFCO Chowk
Sukhrali The Oberoi
Shankar Chowk Hotel Uppalrsquos Orchid NH 8
Aero City Hospitality Commercial amp Retail Zone
Delhi Cantt
NH 8 Delhi University South Campus
To Delhi
Dhaula Kuan
Centaur Hotel Kapashera Crossing
Terminal 3
Old Delhi Gurgaon Road
Columbia Asia Hospital
Sec-111 Sec-110 Sec-105 Sec-104 Sec-101 Sec-100
Dwarka Expressway
Sec-99 A Sec-99 Sec-88 B
Sec-88 A
Sec-88
Sec-84
Sec-83 Proposed ISBT
N
Mini Secretariat
Bata Chowk
Sec-102 Sec-102A Sec-103
Sec-106 Sec-112 Sec-113
Golf Course Diplomatic Enclave Sec-22
Sec-21
Sec-23 Sec-20
OPG World School
Sec-8 Sec-9
Sec-5 Sec-10
Sec-3
GD Goenka School
Sec-1
Sec-12
Sec-108 Sec-115
Delhirsquos Reserved Green Zone
Residential Area
Fortis Hospital Travel Time
Diplomatic Enclave Dwaraka IGI Airport NH-8 Dhaula Kuan
5 minutes 10 minutes 15 minutes 20 minutes
41
42
Indiabulls Foundation Corporate Social Responsibility
Free four medical clinics to provide primary and preventive health care to the underprivileged Jan Swasthya Kalyan Vahika vehicles 9 Mobile medical vans provide free primary healthcare services to nearly 250000 patients every year Cleft deformity surgery for 1200 children across 6 states in partnership with Smile Train an international childrenrsquos charity
Health
Womenrsquos Health
Free sanitary napkins to promote hygiene and sanitation amongst rural women About 30000 underprivileged and rural women have benefitted from this initiative
Free Paushtik Aahar (nutrition supplements) to 5000 underprivileged malnourished individuals every month and regular monitoring of their health weight and height Support to women self-help groups to make Paushtik Aahar (nutritional supplements) and provide sustainable employment options to the underprivileged
Nutrition
Computer Literacy Program
In order to improve IT literacy amongst underprivileged population contributed 1000 computers to tribal ashram schools shelter homes and night schools in Mumbai Thane Raigarh and Palghar districts of Maharashtra
43
Indiabulls Foundation Corporate Social Responsibility
Education and Development
Awarded scholarships to 365 meritorious amp deserving students from economically challenged background to pursue higher education after 12th standard
Rural Empowerment
Implemented water project called lsquoRahatrsquo at 3 Tribal Ashram Schools where there was acute scarcity of water Over 2500 children from these tribal schools will benefit from this initiative every year
Indiabulls Foundation E-learning
(IBFE)
Tie-up with MKCL (Maharashtra Knowledge Corporation Ltd) authorized computer centers to help impart basic IT literacy to rural youth
Equipped 31 ashram schools with sophisticated e-learning methods to enhance the quality of education in rural Maharashtra
Installed Renewable Energy Plants at 5 tribal ashram schools in Maharashtra These plants will provide free of cost round-the-clock seamless electricity to these schools for 25 years absolutely free of cost
Started Sport Excellence Program to support athletes and provide them with world class training facilities
Disaster Relief During the Chennai floods provided timely relief to 1500 The nutritional supplement is a ready to eat mixture providing well needed nourishment to the Chennai flood affected
44
Balance Sheet
Consolidated Balance Sheet
45
Statement of Assets and Liabilities (Consolidated) (Rs Crore)As at March 31
2016 (Audited)
As at March 31 2015
(Audited)Shareholders FundsShare Capital 9234 8500 Reserves and Surplus 745999 708529 Money received against share warrants 29212 -
784445 717029 Minority Interest 5493 3319 Non Current LiabilitiesTerm Loans NCDs from Banks 473013 530353 Against OCDs CCDs 18303 19410 Deferred Tax Liabilities - 115 Other Long term liabilities 17573 18508 Long-term provisions 505 455
509394 568841 Current LiabilitiesShort-term Borrowings 26300 40100 Trade Payables 24376 20210 Other current liabilities 348999 327395 Short-term provisions 12867 7603
412542 395308 Total 1711874 1684497
ASSETSFixed AssetsTangible assets 10361 11183 Intangible assets 057 039
Capital work in progress 003 12671 10421 23893
Non Current AssetsNon-current investments 547538 549470 Deferred Tax Assets 8185 5330 Long-term loans and advances 33623 103077 Other non-current assets 6076 6030
595422 663907 Current AssetsCurrent Investments 15913 33412 Inventories 541524 601409 Trade Receivables 47645 15940 Cash and bank balances 124317 66943 Short-term loans and advances 118588 91702 Other current assets 258044 187291
1106031 996697 Total 1711874 1684497
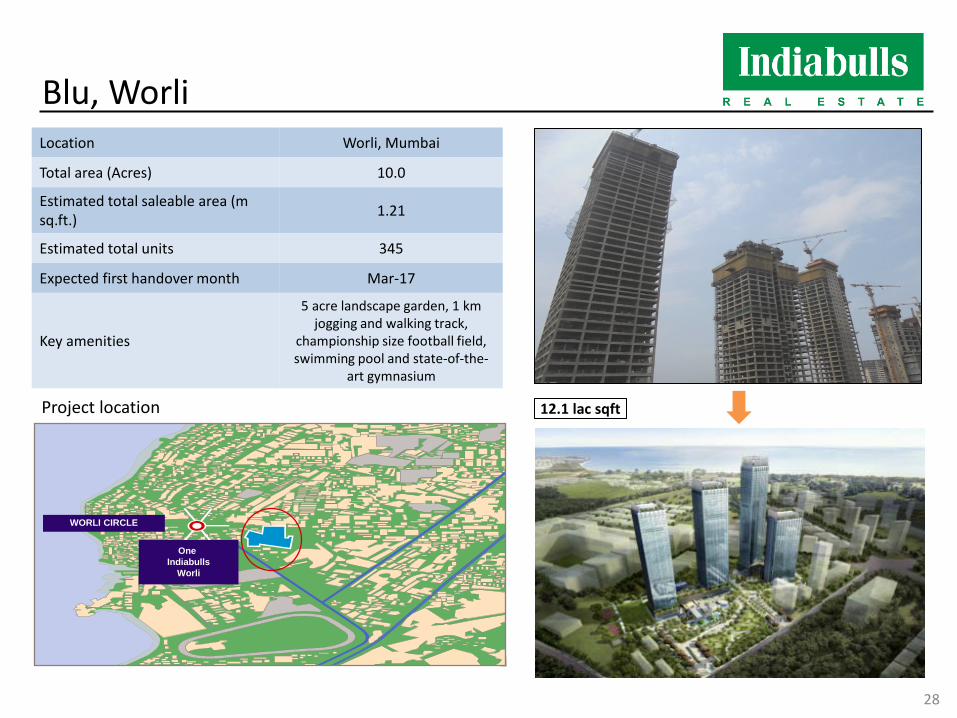
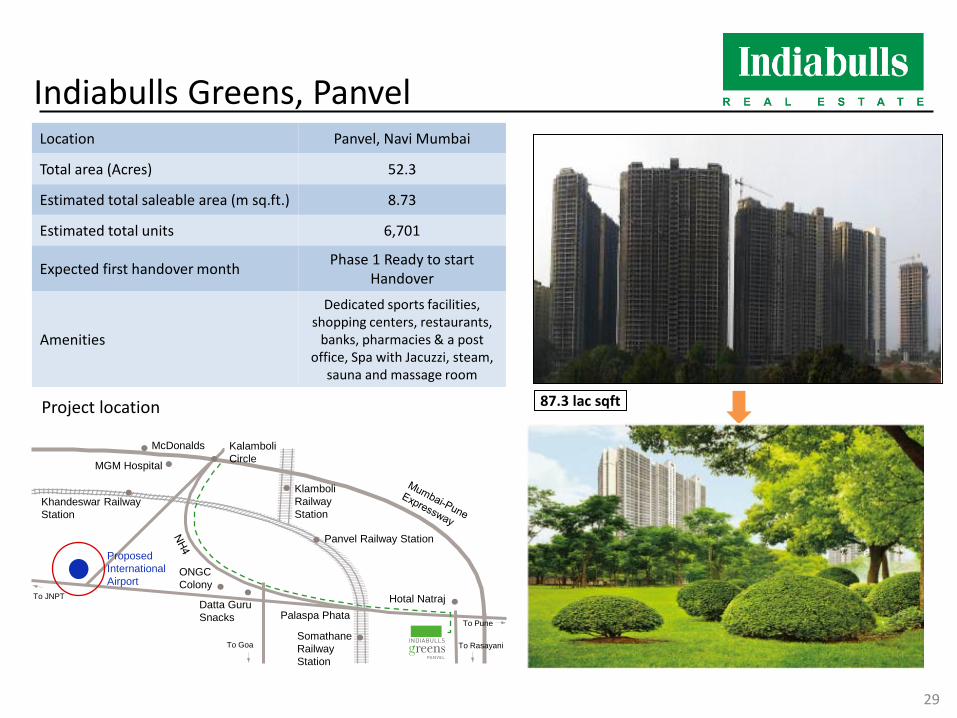
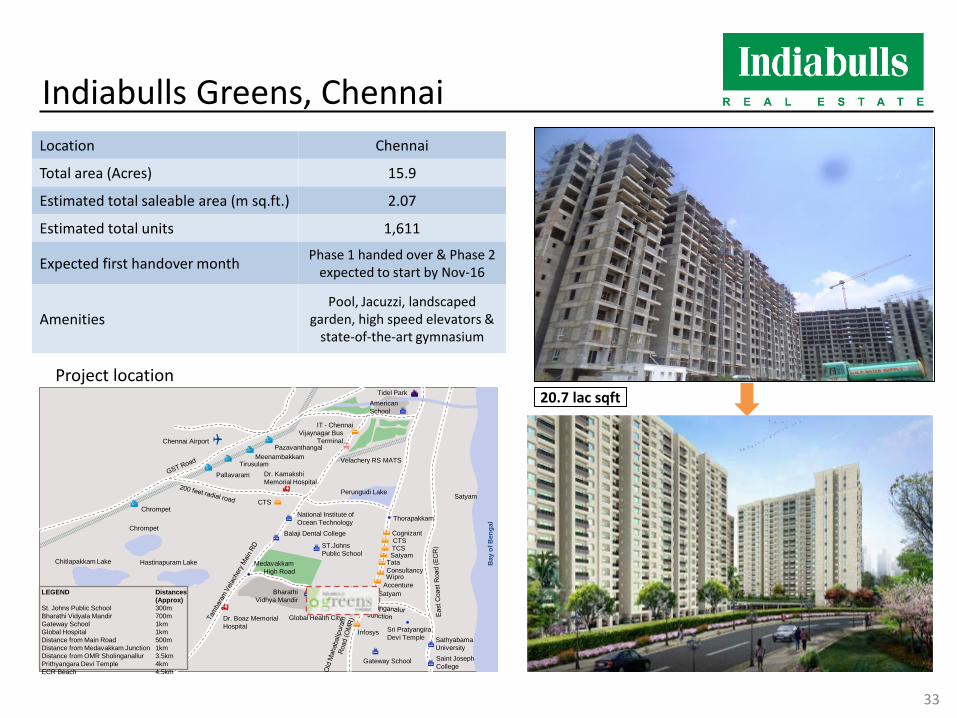
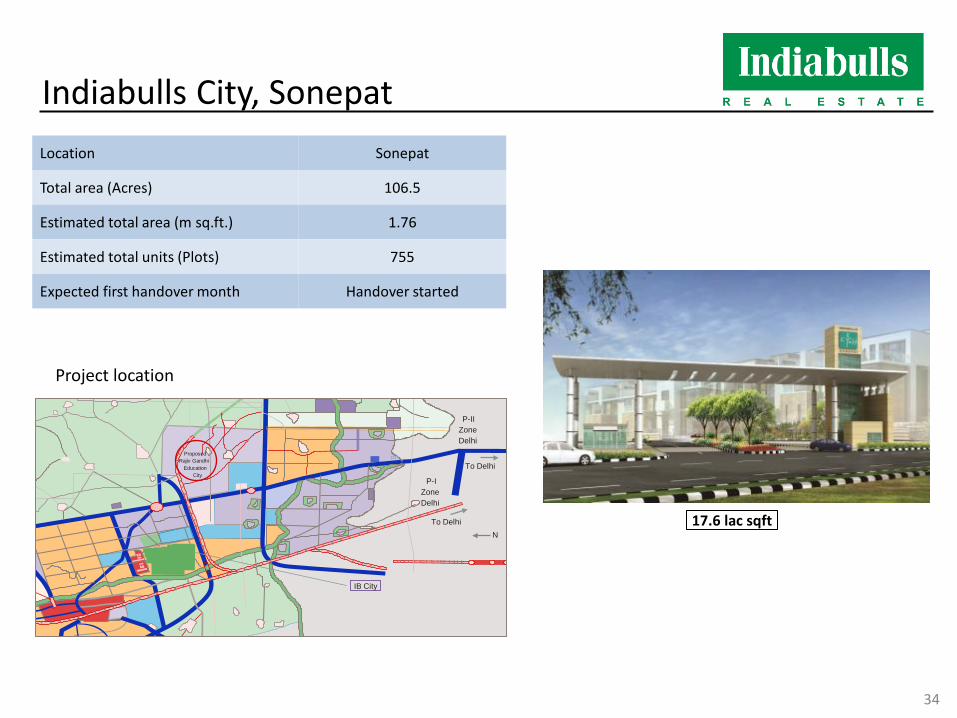
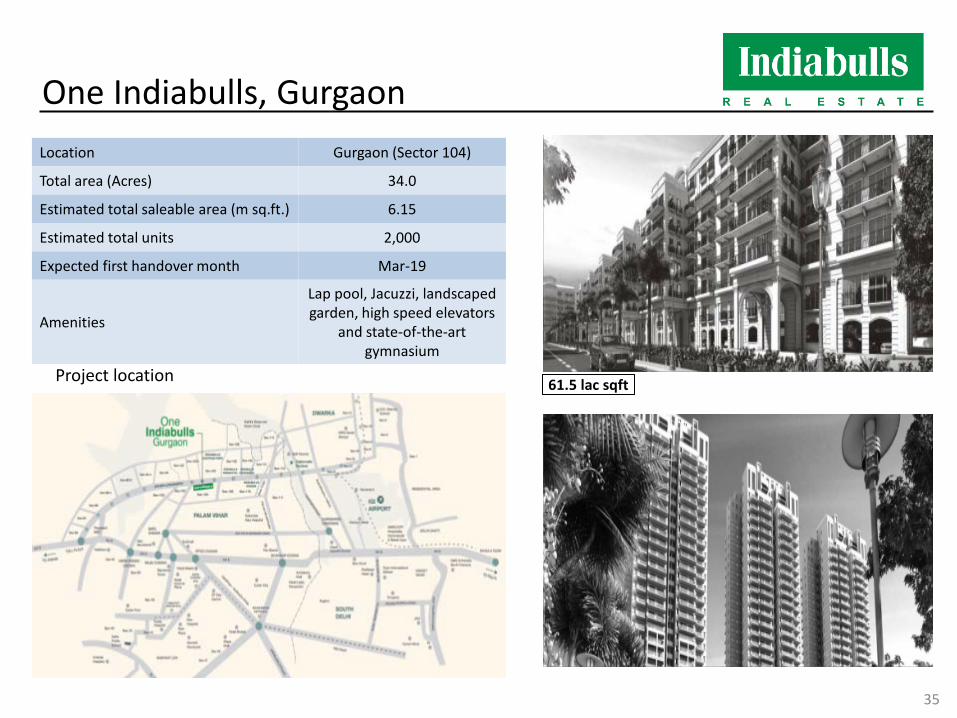
One Indiabulls Gurgaon
Project location
Location Gurgaon (Sector 104)
Total area (Acres) 340
Estimated total saleable area (m sqft) 615
Estimated total units 2000
Expected first handover month Mar-19
Amenities
Lap pool Jacuzzi landscaped garden high speed elevators
and state-of-the-art gymnasium
615 lac sqft
35
Indiabulls One 09 Gurgaon
Project location
96 lac sqft
Location Gurgaon (Sector 109)
Total area (Acres) 59
Estimated total saleable area (m sqft) 096
Estimated total units 352
Expected first handover month Mar-18
36
Silverlake Villas Alibaug
Project location 26 lac sqft
Location Alibaug
Total area (Acres) 73
Estimated total saleable area (m sqft) 026
Estimated total units 34
Expected first handover month Mar-18
37
Sky Forest Lower Parel
Project location 15 lac sqft
Location Lower Parel Mumbai
Total area (Acres) (mixed use development) 97
Estimated total saleable area (m sqft) 150
Estimated total units 442
Expected first handover month Dec-18
Key amenities
120000 sqft of landscaped podium and club
swimming pool and state-of-the-art gymnasium
mini-theatre
38
Sky Suites Lower Parel
Project location 14 lac sqft
Location Lower Parel Mumbai
Total area (Acres) (mixed use development) 78
Estimated total saleable area (m sqft) 140
Estimated total units 279
Expected first handover month Dec-19
Key amenities
100000 sqft of landscaped podium and club
swimming pool and state-of-the-art gymnasium
39
Planned launches ndash Indiabulls Mint Gurgaon
bull A commercial project located in Sector 104 Gurgaon Its has a direct access from Dwarka Manesar Expressway and very close the Domestic and the International Airports
bull Net development area of 212 acres
bull The total saleable area of the project is 031m sqft
bull Currently under planning and expected to be launched in FY17
bull The project has GDV of about Rs 310 Cr
One Indiabulls Gurgaon
South Delhi
Palam Vihar
Dwarka
To Delhi
IGI Airport
Project location
Project details
40 31 lac sqft
Planned launches ndash Indiabulls Imperial Gurgaon
bull Includes residential (luxury) and commercial project located in Sector 106 Gurgaon It has a direct access from 60m wide road and very close to Dwarka Manesar Expressway Domestic and the International Airport
bull Net development area of 241 acres and 111 acres for residential and commercial sections respectively
bull The residential project includes 1700 apartments divided into 2 3 4 BHK amp Penthouses configuration and commercial project includes 347 shops and 706 office spaces
bull Currently under planning and expected to be launched by FY17
bull The project has GDV of about Rs 5933 Cr
Project details
Project location
South Delhi
IGI Airport
Dwarka
Palam Vihar
Sec-42
Metro line Delhi border Proposed development
MG road Qutub Minar IIT
JNU
R a o T u l a r a m
M a r g
Nelson Mandela Road Emporio
Vasant Vihar Ryan International School Radisson
Hotel Shiv Murti
Rajokri
Sec-27 Sec-28
Mega Mall Hotel Bristol
Sushant Lok
Courtyard Marriott
Park Plaza Max Hospital
Artemis Hospital
Delhi Public School Sec-46 Sec-45 Sec-44
Cyber Park Sec-40 Huda City
Centre Stn
Hotel Crowne Plaza
IFFCO Chowk Stn
Hotel Westin Signature Tower
Rajiv Chowk Sec-33
Hero Honda Chowk
NH 8
NH 8
Sec-34
Haldiram Toll Plaza
To Jaipur
NH 8
DT City Centre Sikanderpur Metro Stn
Cyber City Hotel Leela Kempinski
Ambience Mall
NH 8 IFFCO Chowk
Sukhrali The Oberoi
Shankar Chowk Hotel Uppalrsquos Orchid NH 8
Aero City Hospitality Commercial amp Retail Zone
Delhi Cantt
NH 8 Delhi University South Campus
To Delhi
Dhaula Kuan
Centaur Hotel Kapashera Crossing
Terminal 3
Old Delhi Gurgaon Road
Columbia Asia Hospital
Sec-111 Sec-110 Sec-105 Sec-104 Sec-101 Sec-100
Dwarka Expressway
Sec-99 A Sec-99 Sec-88 B
Sec-88 A
Sec-88
Sec-84
Sec-83 Proposed ISBT
N
Mini Secretariat
Bata Chowk
Sec-102 Sec-102A Sec-103
Sec-106 Sec-112 Sec-113
Golf Course Diplomatic Enclave Sec-22
Sec-21
Sec-23 Sec-20
OPG World School
Sec-8 Sec-9
Sec-5 Sec-10
Sec-3
GD Goenka School
Sec-1
Sec-12
Sec-108 Sec-115
Delhirsquos Reserved Green Zone
Residential Area
Fortis Hospital Travel Time
Diplomatic Enclave Dwaraka IGI Airport NH-8 Dhaula Kuan
5 minutes 10 minutes 15 minutes 20 minutes
41
42
Indiabulls Foundation Corporate Social Responsibility
Free four medical clinics to provide primary and preventive health care to the underprivileged Jan Swasthya Kalyan Vahika vehicles 9 Mobile medical vans provide free primary healthcare services to nearly 250000 patients every year Cleft deformity surgery for 1200 children across 6 states in partnership with Smile Train an international childrenrsquos charity
Health
Womenrsquos Health
Free sanitary napkins to promote hygiene and sanitation amongst rural women About 30000 underprivileged and rural women have benefitted from this initiative
Free Paushtik Aahar (nutrition supplements) to 5000 underprivileged malnourished individuals every month and regular monitoring of their health weight and height Support to women self-help groups to make Paushtik Aahar (nutritional supplements) and provide sustainable employment options to the underprivileged
Nutrition
Computer Literacy Program
In order to improve IT literacy amongst underprivileged population contributed 1000 computers to tribal ashram schools shelter homes and night schools in Mumbai Thane Raigarh and Palghar districts of Maharashtra
43
Indiabulls Foundation Corporate Social Responsibility
Education and Development
Awarded scholarships to 365 meritorious amp deserving students from economically challenged background to pursue higher education after 12th standard
Rural Empowerment
Implemented water project called lsquoRahatrsquo at 3 Tribal Ashram Schools where there was acute scarcity of water Over 2500 children from these tribal schools will benefit from this initiative every year
Indiabulls Foundation E-learning
(IBFE)
Tie-up with MKCL (Maharashtra Knowledge Corporation Ltd) authorized computer centers to help impart basic IT literacy to rural youth
Equipped 31 ashram schools with sophisticated e-learning methods to enhance the quality of education in rural Maharashtra
Installed Renewable Energy Plants at 5 tribal ashram schools in Maharashtra These plants will provide free of cost round-the-clock seamless electricity to these schools for 25 years absolutely free of cost
Started Sport Excellence Program to support athletes and provide them with world class training facilities
Disaster Relief During the Chennai floods provided timely relief to 1500 The nutritional supplement is a ready to eat mixture providing well needed nourishment to the Chennai flood affected
44
Balance Sheet
Consolidated Balance Sheet
45
Statement of Assets and Liabilities (Consolidated) (Rs Crore)As at March 31
2016 (Audited)
As at March 31 2015
(Audited)Shareholders FundsShare Capital 9234 8500 Reserves and Surplus 745999 708529 Money received against share warrants 29212 -
784445 717029 Minority Interest 5493 3319 Non Current LiabilitiesTerm Loans NCDs from Banks 473013 530353 Against OCDs CCDs 18303 19410 Deferred Tax Liabilities - 115 Other Long term liabilities 17573 18508 Long-term provisions 505 455
509394 568841 Current LiabilitiesShort-term Borrowings 26300 40100 Trade Payables 24376 20210 Other current liabilities 348999 327395 Short-term provisions 12867 7603
412542 395308 Total 1711874 1684497
ASSETSFixed AssetsTangible assets 10361 11183 Intangible assets 057 039
Capital work in progress 003 12671 10421 23893
Non Current AssetsNon-current investments 547538 549470 Deferred Tax Assets 8185 5330 Long-term loans and advances 33623 103077 Other non-current assets 6076 6030
595422 663907 Current AssetsCurrent Investments 15913 33412 Inventories 541524 601409 Trade Receivables 47645 15940 Cash and bank balances 124317 66943 Short-term loans and advances 118588 91702 Other current assets 258044 187291
1106031 996697 Total 1711874 1684497
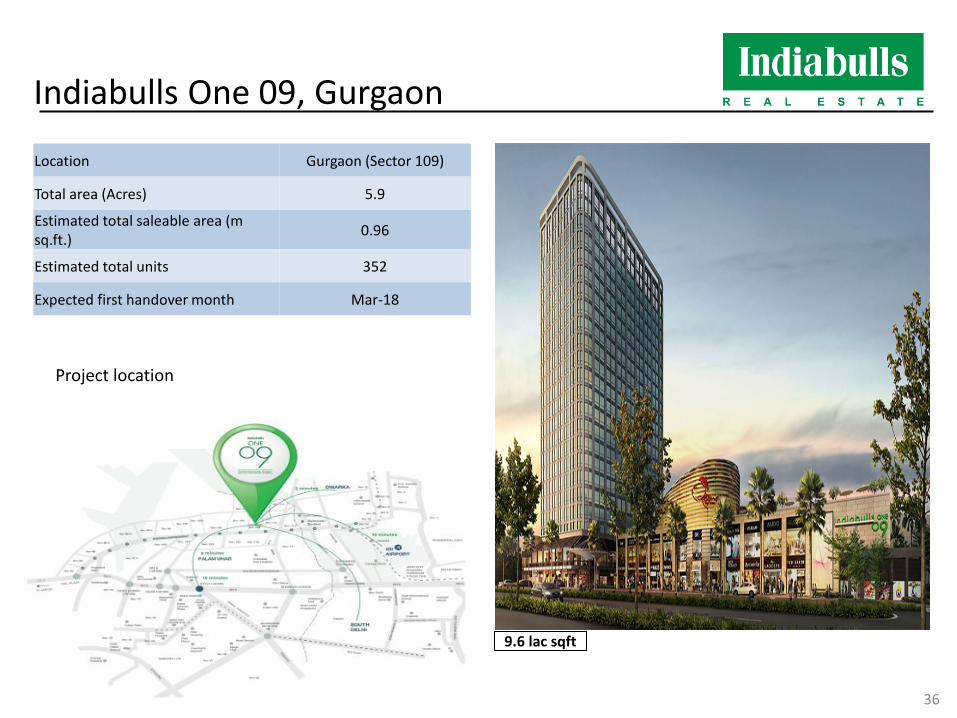
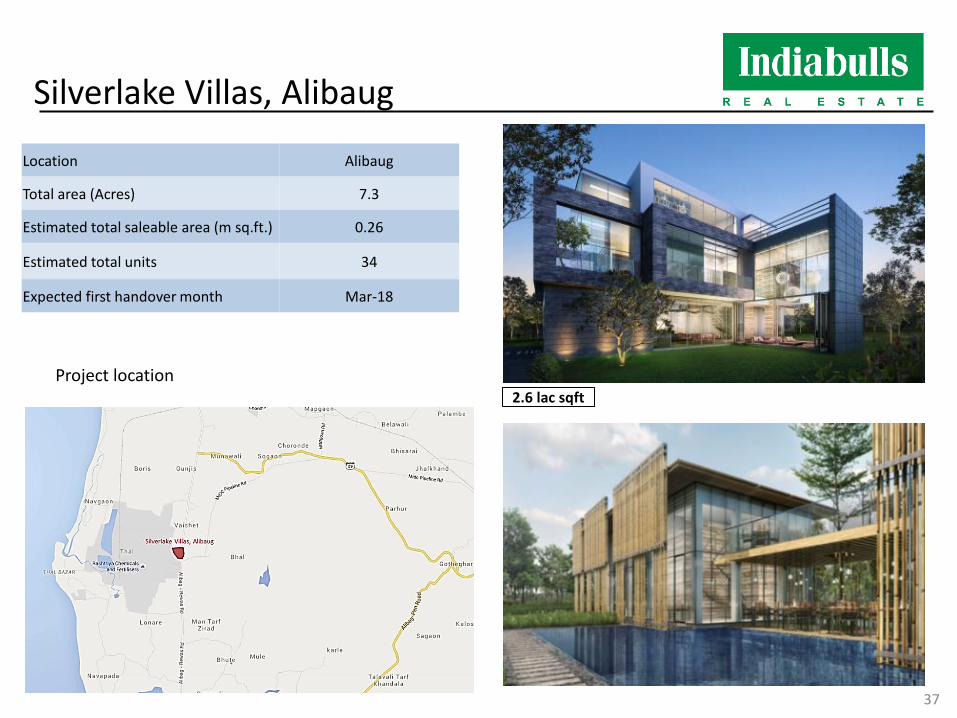
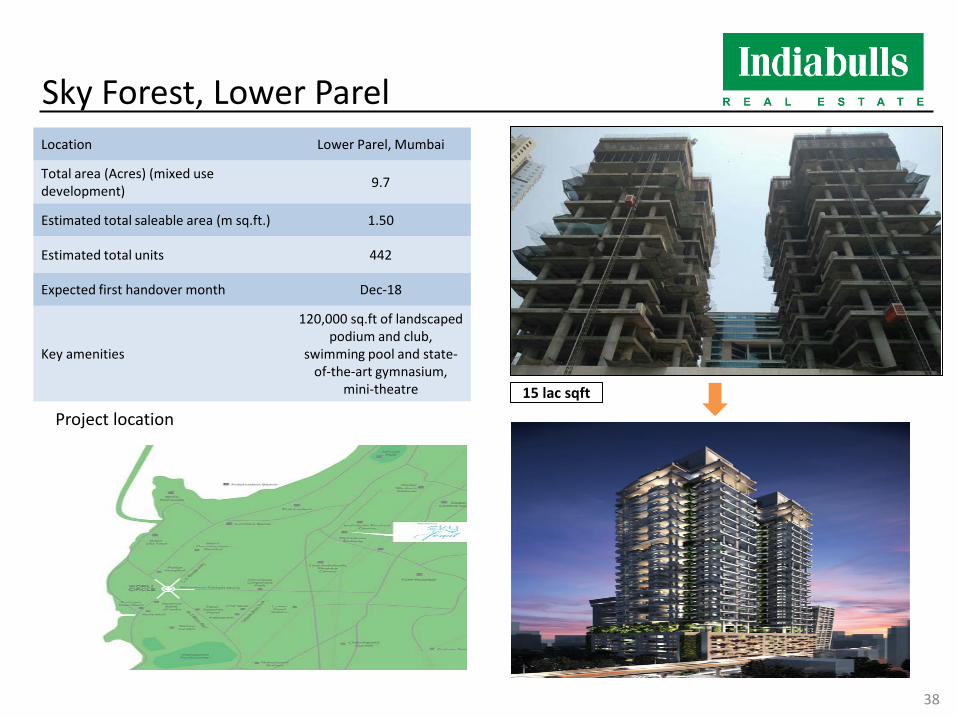
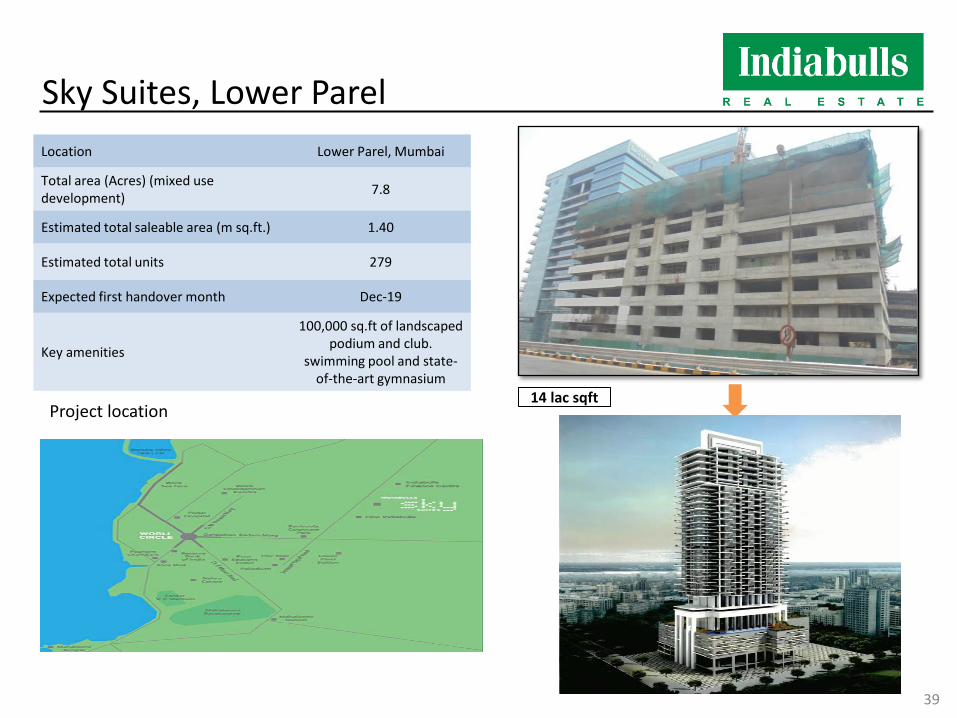
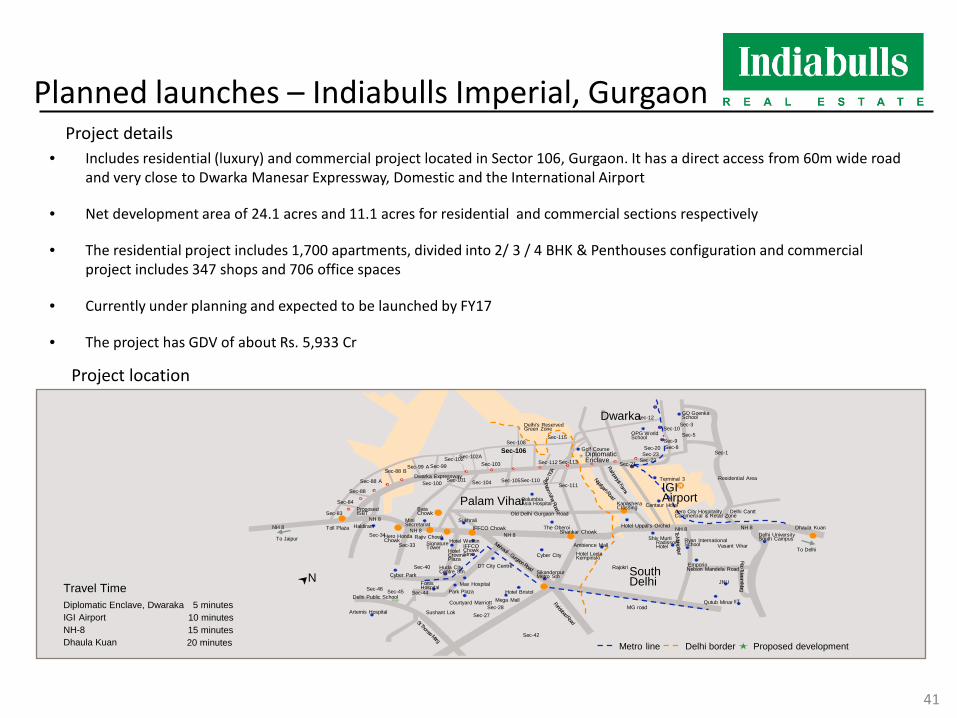
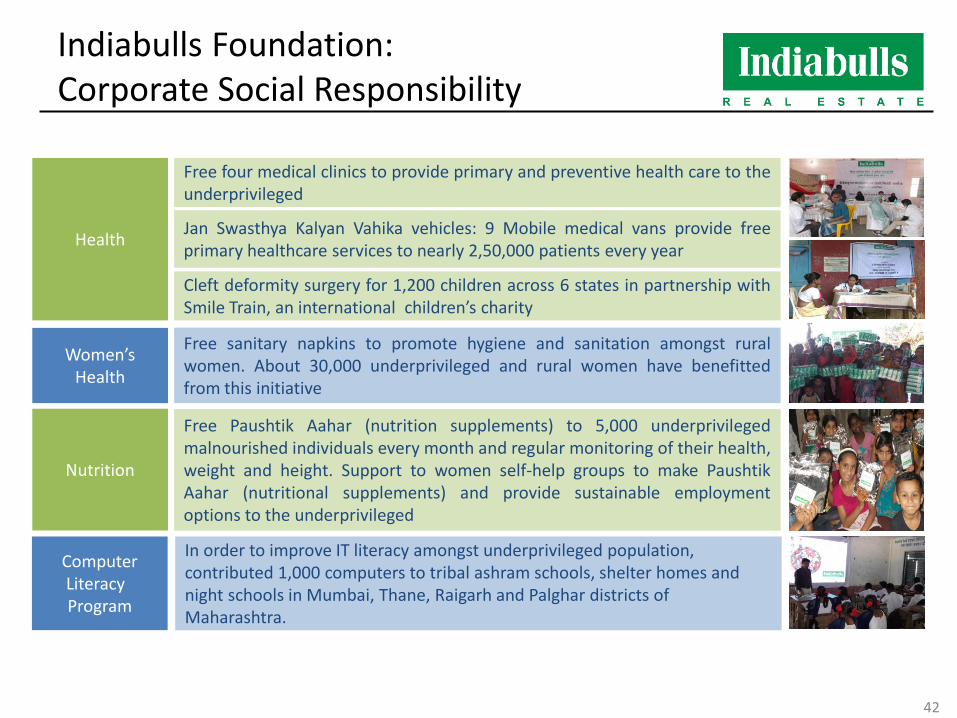
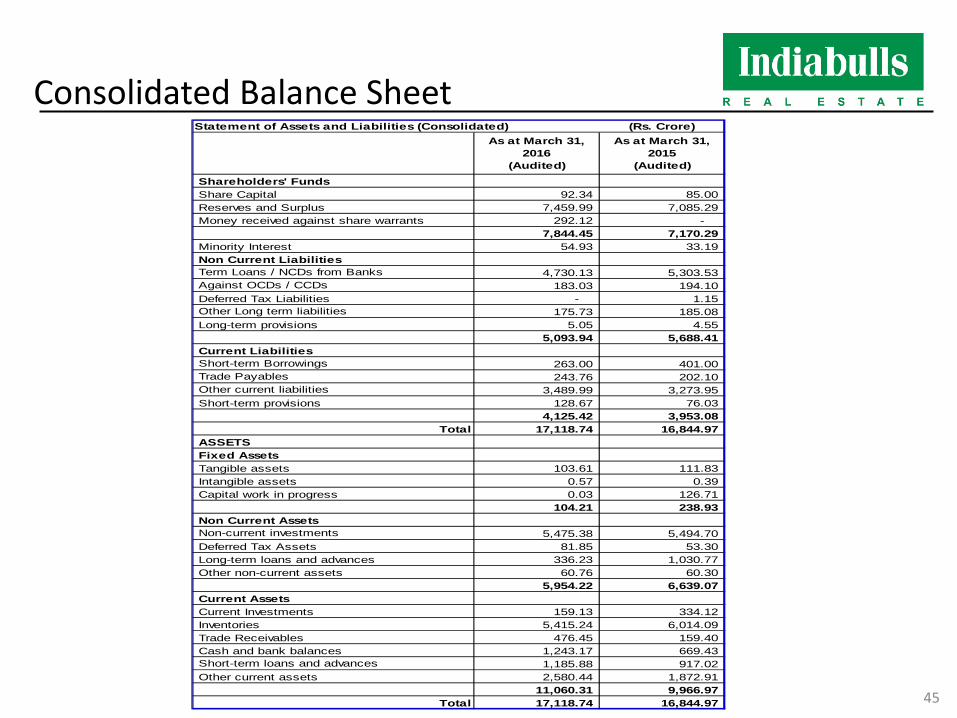
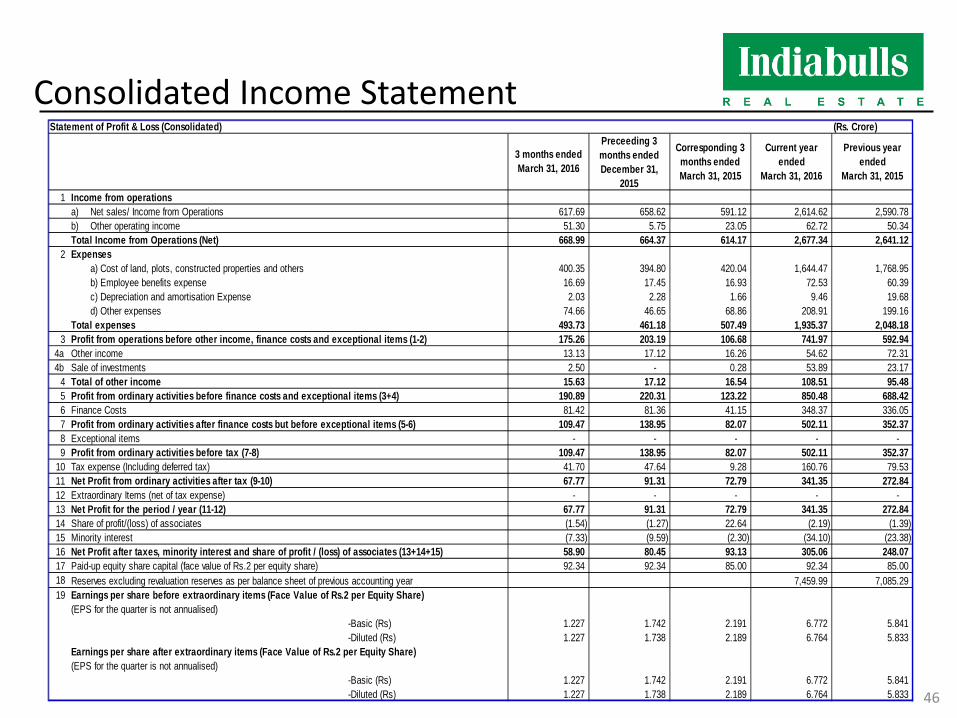
Consolidated Income Statement
46
Statement of Profit amp Loss (Consolidated) (Rs Crore)
1 a) Net sales Income from Operations 61769 65862 59112 261462 259078 b) Other operating income 5130 575 2305 6272 5034 Total Income from Operations (Net) 66899 66437 61417 267734 264112
2 a) Cost of land plots constructed properties and others 40035 39480 42004 164447 176895 b) Employee benefits expense 1669 1745 1693 7253 6039 c) Depreciation and amortisation Expense 203 228 166 946 1968 d) Other expenses 7466 4665 6886 20891 19916
49373 46118 50749 193537 204818 3 Profit from operations before other income finance costs and exceptional items (1-2) 17526 20319 10668 74197 59294
4a Other income 1313 1712 1626 5462 7231 4b Sale of investments 250 - 028 5389 2317
4 Total of other income 1563 1712 1654 10851 9548 5 Profit from ordinary activities before finance costs and exceptional items (3+4) 19089 22031 12322 85048 68842 6 8142 8136 4115 34837 33605 7 Profit from ordinary activities after finance costs but before exceptional items (5-6) 10947 13895 8207 50211 35237 8 Exceptional items - - - - - 9 10947 13895 8207 50211 35237
10 4170 4764 928 16076 7953 11 6777 9131 7279 34135 27284 12 Extraordinary Items (net of tax expense) - - - - - 13 Net Profit for the period year (11-12) 6777 9131 7279 34135 27284 14 (154) (127) 2264 (219) (139) 15 (733) (959) (230) (3410) (2338) 16 Net Profit after taxes minority interest and share of profit (loss) of associates (13+14+15) 5890 8045 9313 30506 24807 17 9234 9234 8500 9234 8500 18 745999 708529 19
(EPS for the quarter is not annualised) -Basic (Rs) 1227 1742 2191 6772 5841 -Diluted (Rs) 1227 1738 2189 6764 5833
Earnings per share after extraordinary items (Face Value of Rs2 per Equity Share) (EPS for the quarter is not annualised)
-Basic (Rs) 1227 1742 2191 6772 5841 -Diluted (Rs) 1227 1738 2189 6764 5833
3 months ended March 31 2016
Preceeding 3 months endedDecember 31
2015
Corresponding 3 months ended March 31 2015
Previous year ended
March 31 2015
Current year ended
March 31 2016
Tax expense (Including deferred tax)
Income from operations
Expenses
Total expenses
Finance Costs
Profit from ordinary activities before tax (7-8)
Earnings per share before extraordinary items (Face Value of Rs2 per Equity Share)
Net Profit from ordinary activities after tax (9-10)
Share of profit(loss) of associatesMinority interest
Paid-up equity share capital (face value of Rs2 per equity share) Reserves excluding revaluation reserves as per balance sheet of previous accounting year

Thank you
47


