16
Indian Economy Opportunities Unlimited
| Date post: | 23-Dec-2015 |
| Category: |
Documents |
| Upload: | daisy-patrick |
| View: | 273 times |
| Download: | 0 times |
Indian EconomyOpportunities Unlimited
Indian EconomyOpportunities Unlimited
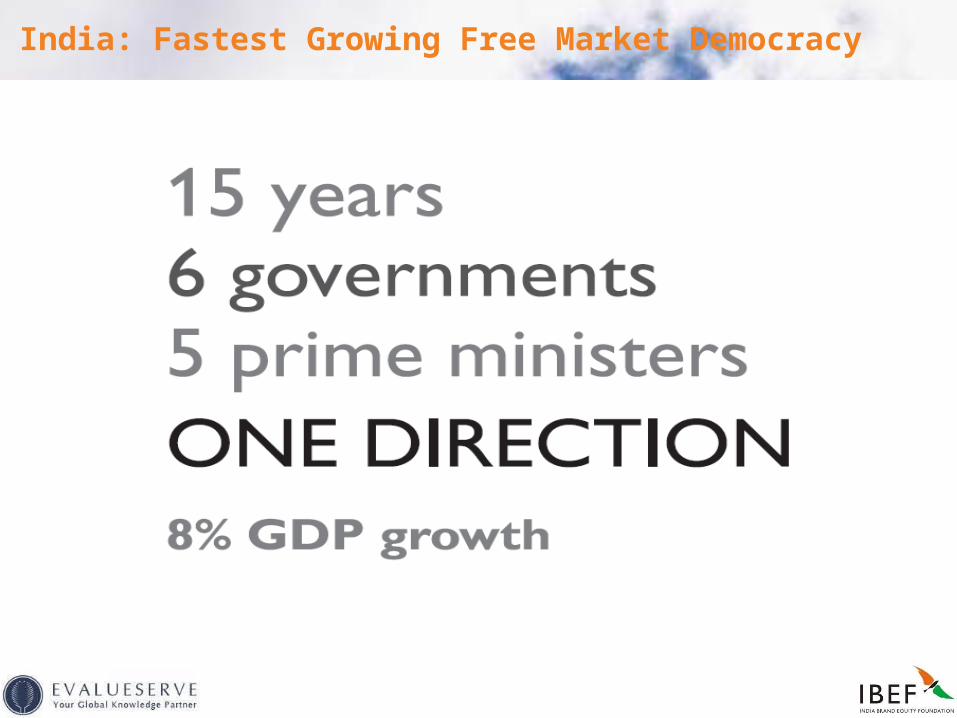
2India: Fastest Growing Free Market Democracy
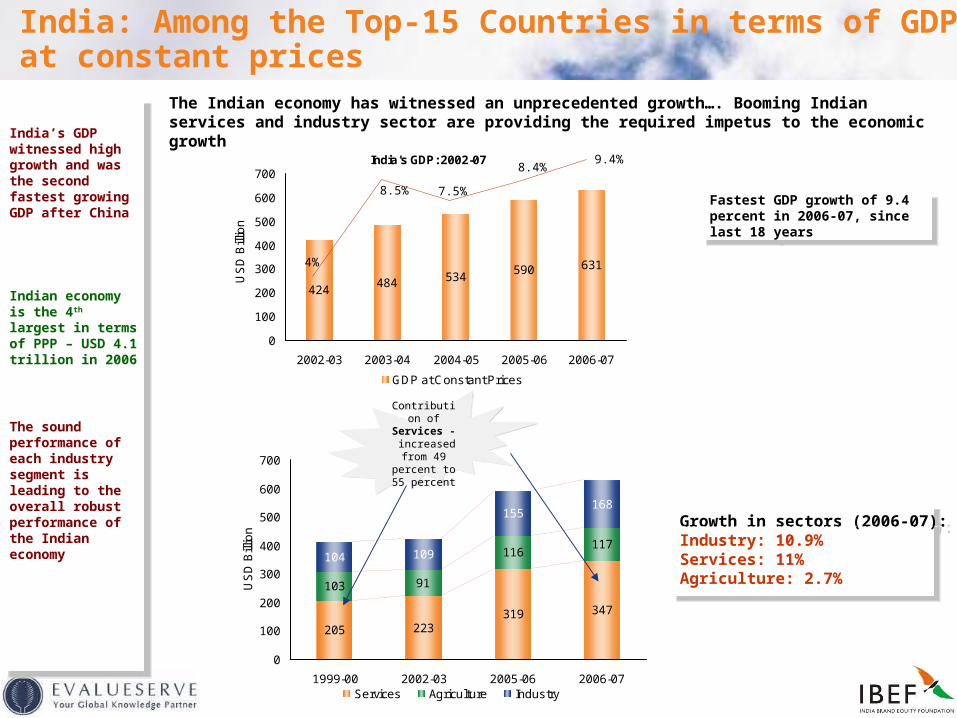
3India: Among the Top-15 Countries in terms of GDP at constant prices
205 223319 347
103 91
116117
104 109
155168
0
100
200
300
400
500
600
700
1999-00 2002-03 2005-06 2006-07
US
D B
illio
n
Services Agriculture Industry
The Indian economy has witnessed an unprecedented growth…. Booming Indian services and industry sector are providing the required impetus to the economic growth
The sound performance of each industry segment is leading to the overall robust performance of the Indian economy
Indian economy is the 4th largest in terms of PPP – USD 4.1 trillion in 2006
India’s GDP witnessed high growth and was the second fastest growing GDP after China
Growth in sectors (2006-07):Industry: 10.9%Services: 11%Agriculture: 2.7%
Growth in sectors (2006-07):Industry: 10.9%Services: 11%Agriculture: 2.7%
Fastest GDP growth of 9.4 percent in 2006-07, since last 18 years
Fastest GDP growth of 9.4 percent in 2006-07, since last 18 years
Contribution of Services -
increased from 49
percent to 55 percent
Contribution of Services -
increased from 49
percent to 55 percent
India's GDP: 2002-07
424484 534
590 631
0
100
200
300
400
500
600
700
2002-03 2003-04 2004-05 2005-06 2006-07
US
D B
illio
n
GDP at Constant Prices
4%
8.5% 7.5%
8.4%9.4%
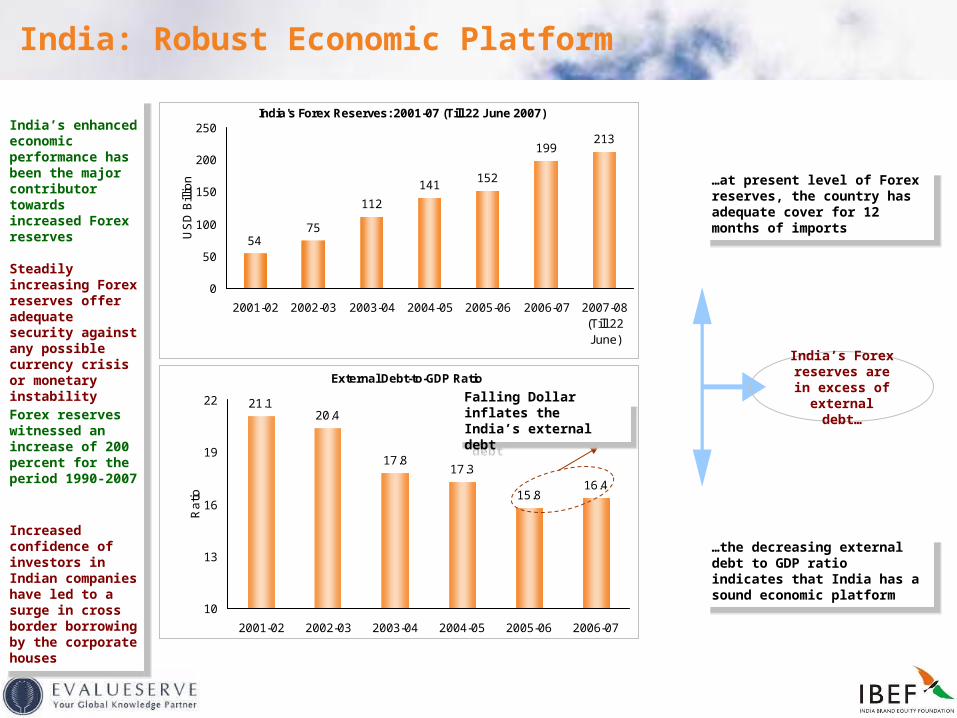
4India: Robust Economic Platform
India's Forex Reserves: 2001-07 (Till 22 June 2007)
5475
112
141152
199213
0
50
100
150
200
250
2001-02 2002-03 2003-04 2004-05 2005-06 2006-07 2007-08(Till 22June)
US
D B
illio
n
External Debt-to-GDP Ratio
21.120.4
17.817.3
15.816.4
10
13
16
19
22
2001-02 2002-03 2003-04 2004-05 2005-06 2006-07
Ra
tio
India’s enhanced economic performance has been the major contributor towards increased Forex reserves
Steadily increasing Forex reserves offer adequate security against any possible currency crisis or monetary instability
Falling Dollar inflates the India’s external debt
Falling Dollar inflates the India’s external debt
Increased confidence of investors in Indian companies have led to a surge in cross border borrowing by the corporate houses
Forex reserves witnessed an increase of 200 percent for the period 1990-2007
…at present level of Forex reserves, the country has adequate cover for 12 months of imports
…at present level of Forex reserves, the country has adequate cover for 12 months of imports
India’s Forex reserves are in
excess of external debt…
…the decreasing external debt to GDP ratio indicates that India has a sound economic platform
…the decreasing external debt to GDP ratio indicates that India has a sound economic platform
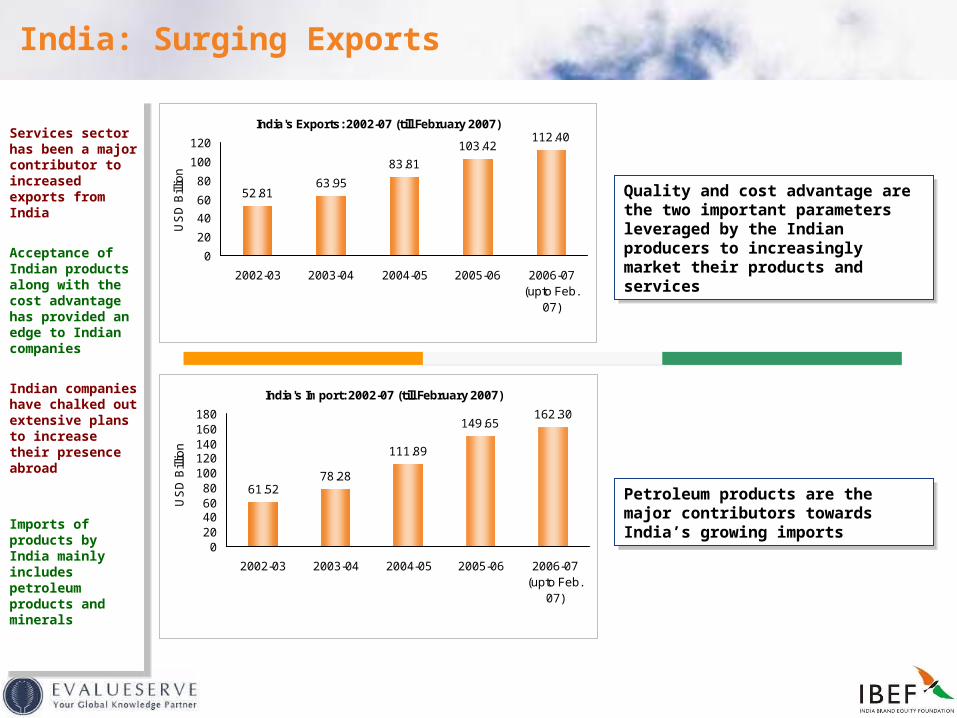
5India: Surging Exports
India's Import: 2002-07 (till February 2007)
61.5278.28
111.89
149.65162.30
020406080
100120140160180
2002-03 2003-04 2004-05 2005-06 2006-07(upto Feb.
07)
US
D B
illio
n
India's Exports: 2002-07 (till February 2007)
52.8163.95
83.81
103.42112.40
0
20
40
60
80
100
120
2002-03 2003-04 2004-05 2005-06 2006-07(upto Feb.
07)
US
D B
illio
n
Petroleum products are the major contributors towards India’s growing imports
Petroleum products are the major contributors towards India’s growing imports
Quality and cost advantage are the two important parameters leveraged by the Indian producers to increasingly market their products and services
Quality and cost advantage are the two important parameters leveraged by the Indian producers to increasingly market their products and services
Services sector has been a major contributor to increased exports from India
Imports of products by India mainly includes petroleum products and minerals
Indian companies have chalked out extensive plans to increase their presence abroad
Acceptance of Indian products along with the cost advantage has provided an edge to Indian companies
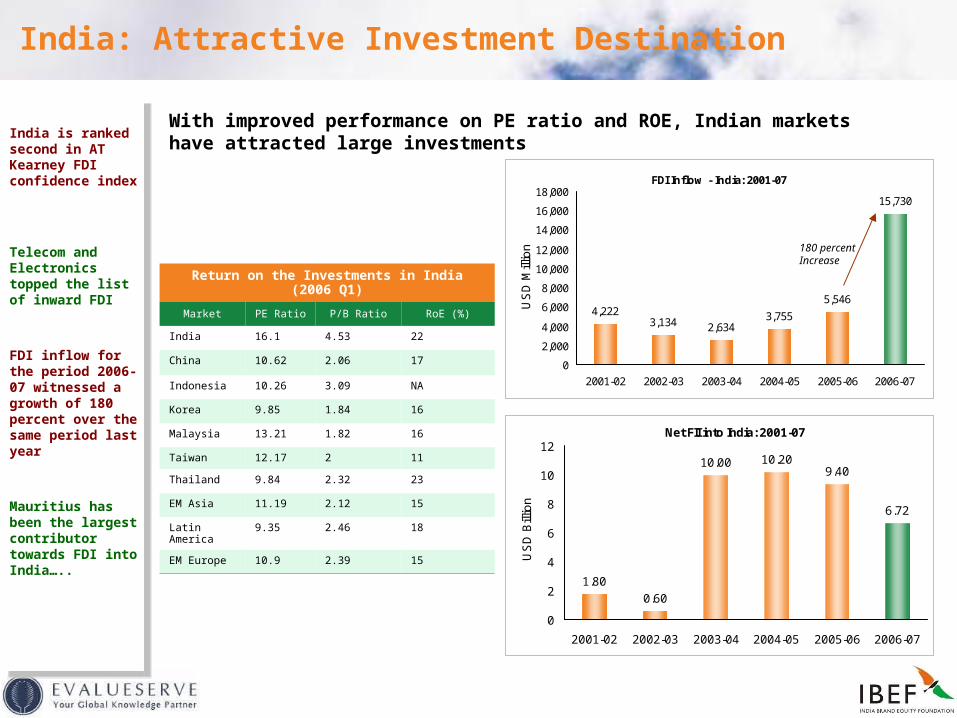
6India: Attractive Investment Destination
Net FII into India: 2001-07
1.80
0.60
10.00 10.209.40
6.72
0
2
4
6
8
10
12
2001-02 2002-03 2003-04 2004-05 2005-06 2006-07
US
D B
illio
n
India is ranked second in AT Kearney FDI confidence index
Telecom and Electronics topped the list of inward FDI
FDI inflow for the period 2006-07 witnessed a growth of 180 percent over the same period last year
Mauritius has been the largest contributor towards FDI into India…..
Return on the Investments in India (2006 Q1)
Market PE Ratio P/B Ratio RoE (%)
India 16.1 4.53 22
China 10.62 2.06 17
Indonesia 10.26 3.09 NA
Korea 9.85 1.84 16
Malaysia 13.21 1.82 16
Taiwan 12.17 2 11
Thailand 9.84 2.32 23
EM Asia 11.19 2.12 15
Latin America 9.35 2.46 18
EM Europe 10.9 2.39 15
With improved performance on PE ratio and ROE, Indian markets have attracted large investments
FDI Inflow - India: 2001-07
4,2223,134 2,634
3,755
5,546
15,730
0
2,000
4,000
6,000
8,000
10,000
12,000
14,000
16,000
18,000
2001-02 2002-03 2003-04 2004-05 2005-06 2006-07
US
D M
illio
n 180 percent Increase
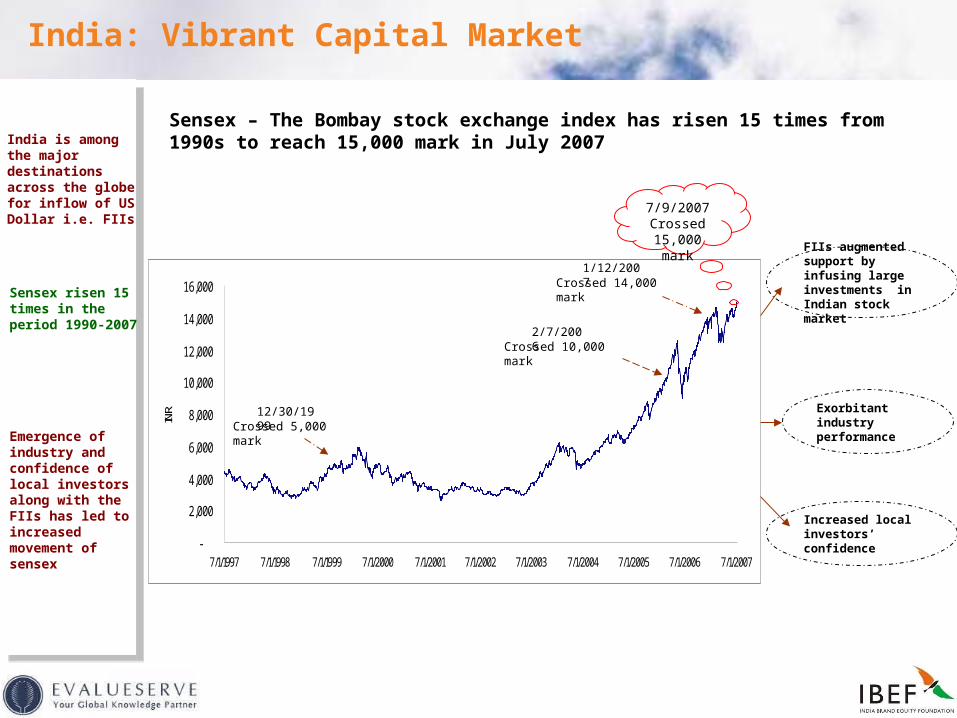
7India: Vibrant Capital Market
India is among the major destinations across the globe for inflow of US Dollar i.e. FIIs
Sensex risen 15 times in the period 1990-2007
Sensex – The Bombay stock exchange index has risen 15 times from 1990s to reach 15,000 mark in July 2007
FIIs augmented support by infusing large investments in Indian stock market
Exorbitant industry performance
Increased local investors’ confidence
Emergence of industry and confidence of local investors along with the FIIs has led to increased movement of sensex
-
2,000
4,000
6,000
8,000
10,000
12,000
14,000
16,000
7/1/1997 7/1/1998 7/1/1999 7/1/2000 7/1/2001 7/1/2002 7/1/2003 7/1/2004 7/1/2005 7/1/2006 7/1/2007
INR
7/9/2007Crossed 15,000 mark
Crossed 14,000 mark
Crossed 10,000 mark
Crossed 5,000 mark12/30/1999
2/7/2006
1/12/2007
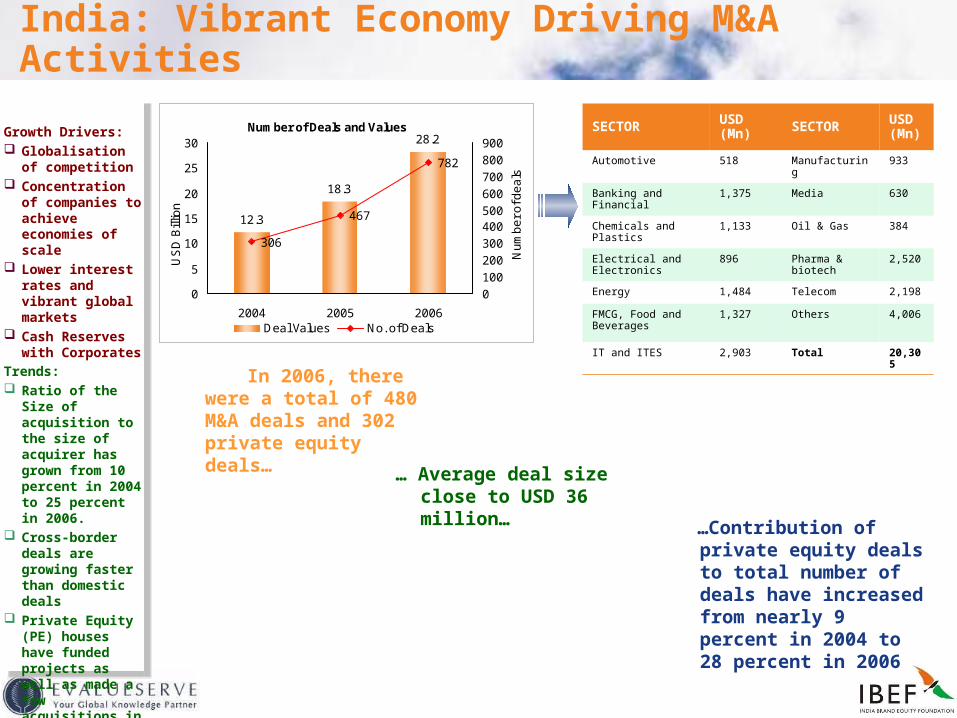
8India: Vibrant Economy Driving M&A Activities
SECTOR USD (Mn) SECTOR USD
(Mn)
Automotive 518 Manufacturing 933
Banking and Financial 1,375 Media 630
Chemicals and Plastics
1,133 Oil & Gas 384
Electrical and Electronics
896 Pharma & biotech
2,520
Energy 1,484 Telecom 2,198
FMCG, Food and Beverages
1,327 Others 4,006
IT and ITES 2,903 Total 20,305
Growth Drivers: Globalisation of
competition Concentration of
companies to achieve economies of scale
Lower interest rates and vibrant global markets
Cash Reserves with Corporates
Number of Deals and Values
12.3
18.3
28.2
306
467
782
0
5
10
15
20
25
30
2004 2005 2006
US
D B
illio
n
0
100
200
300
400500
600
700
800
900
Nu
mb
er
of d
ea
ls
Deal Values No. of Deals
…Contribution of private equity deals to total number of deals have increased from nearly 9 percent in 2004 to 28 percent in 2006
In 2006, there were a total of 480 M&A deals and 302 private equity deals…
… Average deal size close to USD 36 million…
Trends: Ratio of the Size of
acquisition to the size of acquirer has grown from 10 percent in 2004 to 25 percent in 2006.
Cross-border deals are growing faster than domestic deals
Private Equity (PE) houses have funded projects as well as made a few acquisitions in India
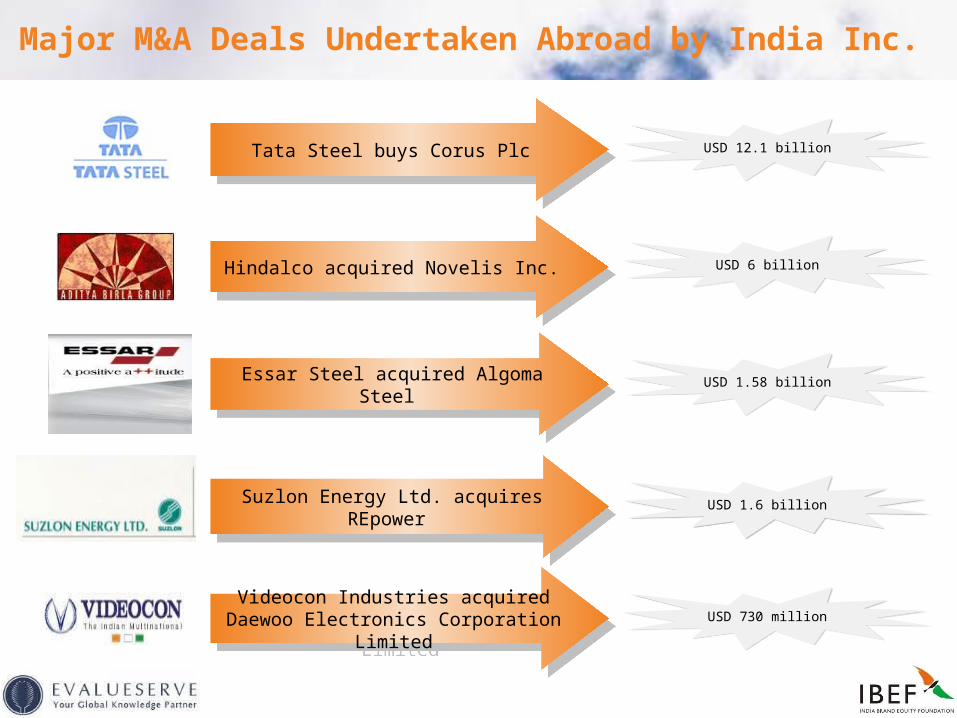
9Major M&A Deals Undertaken Abroad by India Inc.
USD 12.1 billion USD 12.1 billion Tata Steel buys Corus PlcTata Steel buys Corus Plc
USD 6 billion USD 6 billion Hindalco acquired Novelis Inc.Hindalco acquired Novelis Inc.
USD 1.58 billion USD 1.58 billion Essar Steel acquired Algoma Steel Essar Steel acquired Algoma Steel
USD 730 million USD 730 million Videocon Industries acquired Daewoo Electronics Corporation Limited
Videocon Industries acquired Daewoo Electronics Corporation Limited
USD 1.6 billion USD 1.6 billion Suzlon Energy Ltd. acquires REpower Suzlon Energy Ltd. acquires REpower
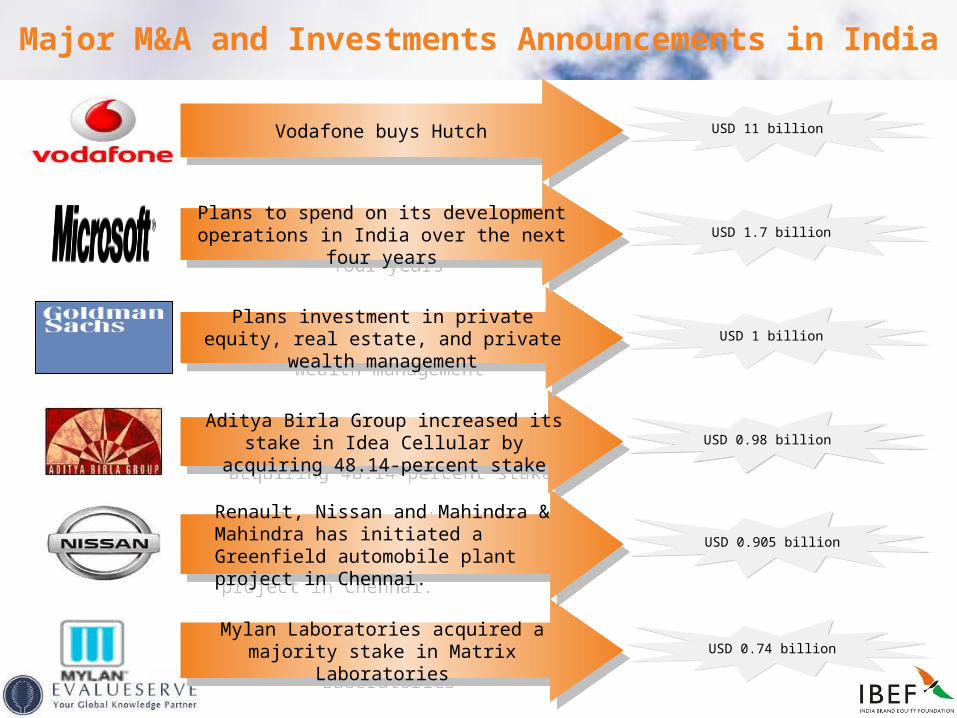
10Major M&A and Investments Announcements in India
USD 11 billion USD 11 billion Vodafone buys HutchVodafone buys Hutch
USD 0.98 billion USD 0.98 billion Aditya Birla Group increased its stake in Idea Cellular by acquiring 48.14-percent stake
Aditya Birla Group increased its stake in Idea Cellular by acquiring 48.14-percent stake
USD 1 billionUSD 1 billionPlans investment in private equity, real estate, and private wealth management
Plans investment in private equity, real estate, and private wealth management
USD 1.7 billionUSD 1.7 billionPlans to spend on its development operations in India over the next four years
Plans to spend on its development operations in India over the next four years
USD 0.905 billionUSD 0.905 billionRenault, Nissan and Mahindra & Mahindra has initiated a Greenfield automobile plant project in Chennai.
Renault, Nissan and Mahindra & Mahindra has initiated a Greenfield automobile plant project in Chennai.
Mylan Laboratories acquired a majority stake in Matrix Laboratories
Mylan Laboratories acquired a majority stake in Matrix Laboratories
USD 0.74 billionUSD 0.74 billion
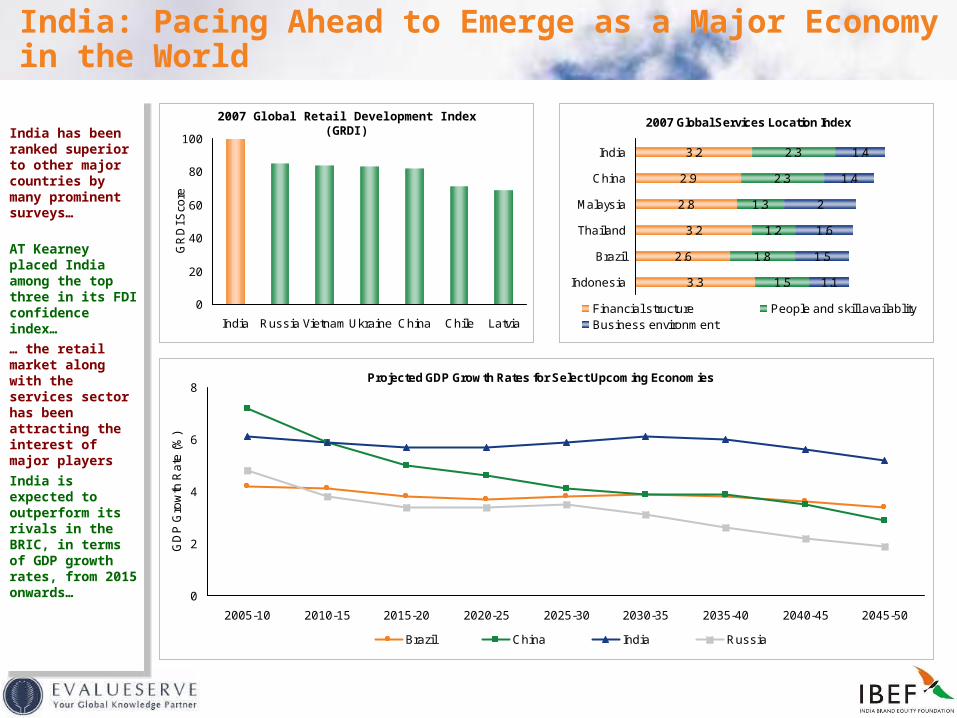
11India: Pacing Ahead to Emerge as a Major Economy in the World
Projected GDP Growth Rates for Select Upcoming Economies
0
2
4
6
8
2005-10 2010-15 2015-20 2020-25 2025-30 2030-35 2035-40 2040-45 2045-50
GD
P G
row
th R
ate
(%
)
Brazil China India Russia
0
20
40
60
80
100
India Russia Vietnam Ukraine China Chile Latvia
GR
DI S
core
2007 Global Retail Development Index (GRDI) 2007 Global Services Location Index
3.3
2.6
3.2
2.8
2.9
3.2
1.5
1.8
1.2
1.3
2.3
2.3
1.1
1.5
1.6
2
1.4
1.4
Indonesia
Brazil
Thailand
Malaysia
China
India
Financial structure People and skill availablityBusiness environment
India has been ranked superior to other major countries by many prominent surveys…
AT Kearney placed India among the top three in its FDI confidence index…
… the retail market along with the services sector has been attracting the interest of major players
India is expected to outperform its rivals in the BRIC, in terms of GDP growth rates, from 2015 onwards…
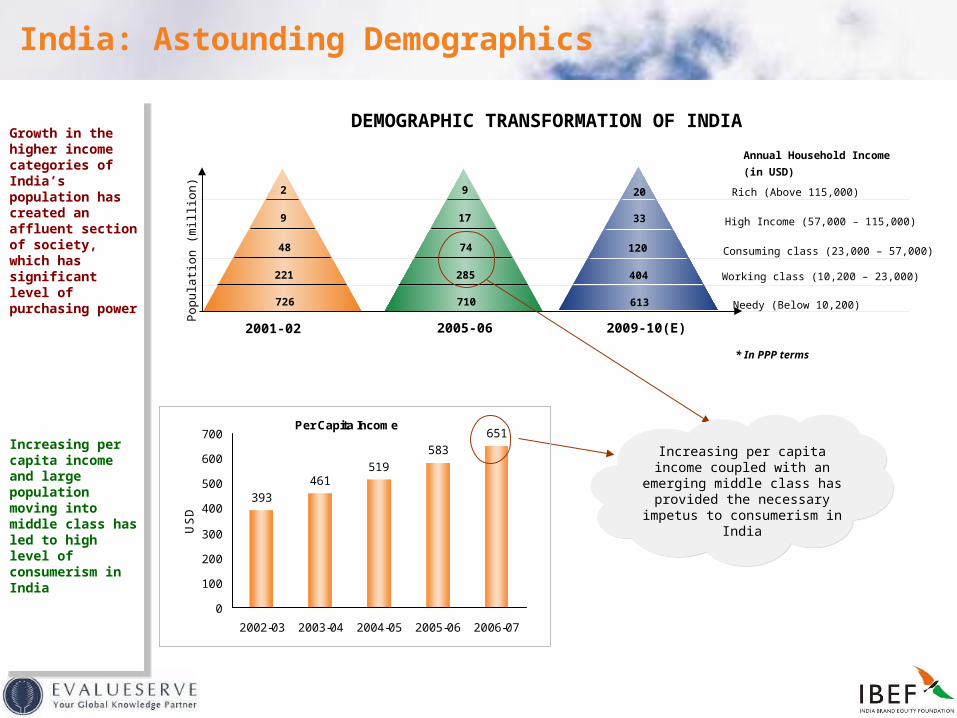
12India: Astounding Demographics
Per Capita Income
393
461519
583
651
0
100
200
300
400
500
600
700
2002-03 2003-04 2004-05 2005-06 2006-07
US
D2
9
48
221
726
9
17
74
285
710
20
33
120
404
613
2001-02 2005-06 2009-10(E)
Rich (Above 115,000)
High Income (57,000 – 115,000)
Consuming class (23,000 – 57,000)
Working class (10,200 – 23,000)
Needy (Below 10,200)
Annual Household Income
(in USD)
* In PPP terms
Pop
ula
tion
(mill
ion
)
Increasing per capita income coupled with an emerging middle class has provided the necessary impetus to consumerism in India
Growth in the higher income categories of India’s population has created an affluent section of society, which has significant level of purchasing power
Increasing per capita income and large population moving into middle class has led to high level of consumerism in India
DEMOGRAPHIC TRANSFORMATION OF INDIA
13
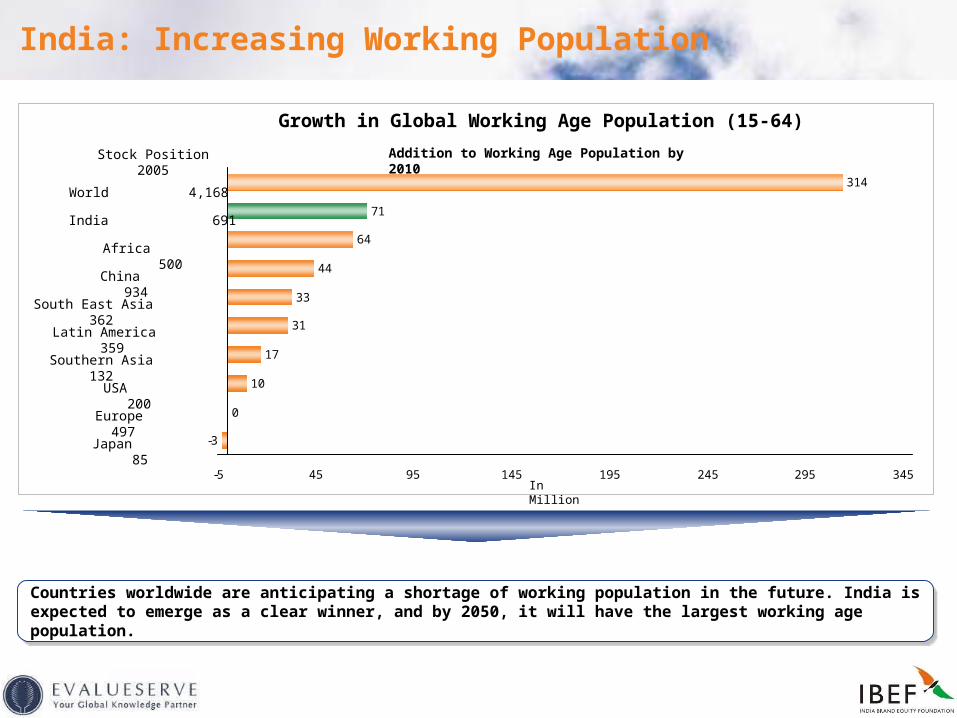
Countries worldwide are anticipating a shortage of working population in the future. India is expected to emerge as a clear winner, and by 2050, it will have the largest working age population.
Countries worldwide are anticipating a shortage of working population in the future. India is expected to emerge as a clear winner, and by 2050, it will have the largest working age population.
India: Increasing Working Population
-3
0
10
17
31
33
44
64
71
314
-5 45 95 145 195 245 295 345
Stock Position 2005
South East Asia 362
Southern Asia 132
India 691
Africa 500
China 934
Latin America 359
USA 200
Europe 497
Japan 85
World 4,168
In Million
Addition to Working Age Population by 2010
Growth in Global Working Age Population (15-64)
14
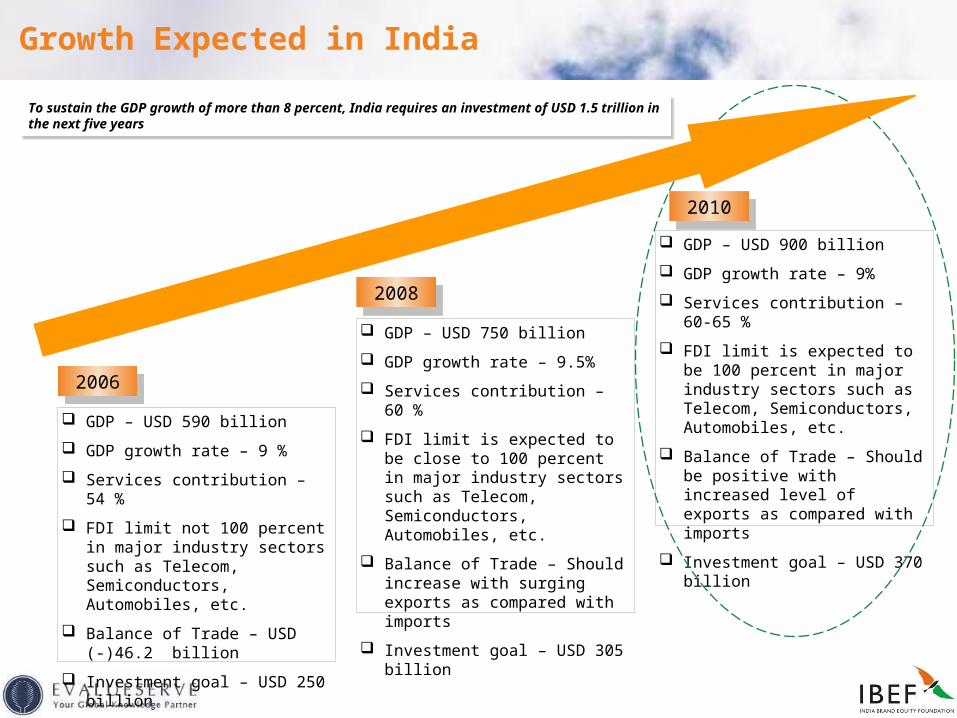
GDP – USD 590 billion
GDP growth rate – 9 %
Services contribution – 54 %
FDI limit not 100 percent in major industry sectors such as Telecom, Semiconductors, Automobiles, etc.
Balance of Trade – USD (-)46.2 billion
Investment goal – USD 250 billion
20062006
GDP – USD 750 billion
GDP growth rate – 9.5%
Services contribution – 60 %
FDI limit is expected to be close to 100 percent in major industry sectors such as Telecom, Semiconductors, Automobiles, etc.
Balance of Trade – Should increase with surging exports as compared with imports
Investment goal – USD 305 billion
20082008
GDP – USD 900 billion
GDP growth rate – 9%
Services contribution – 60-65 %
FDI limit is expected to be 100 percent in major industry sectors such as Telecom, Semiconductors, Automobiles, etc.
Balance of Trade – Should be positive with increased level of exports as compared with imports
Investment goal – USD 370 billion
20102010
Growth Expected in India
To sustain the GDP growth of more than 8 percent, India requires an investment of USD 1.5 trillion in the next five years
To sustain the GDP growth of more than 8 percent, India requires an investment of USD 1.5 trillion in the next five years
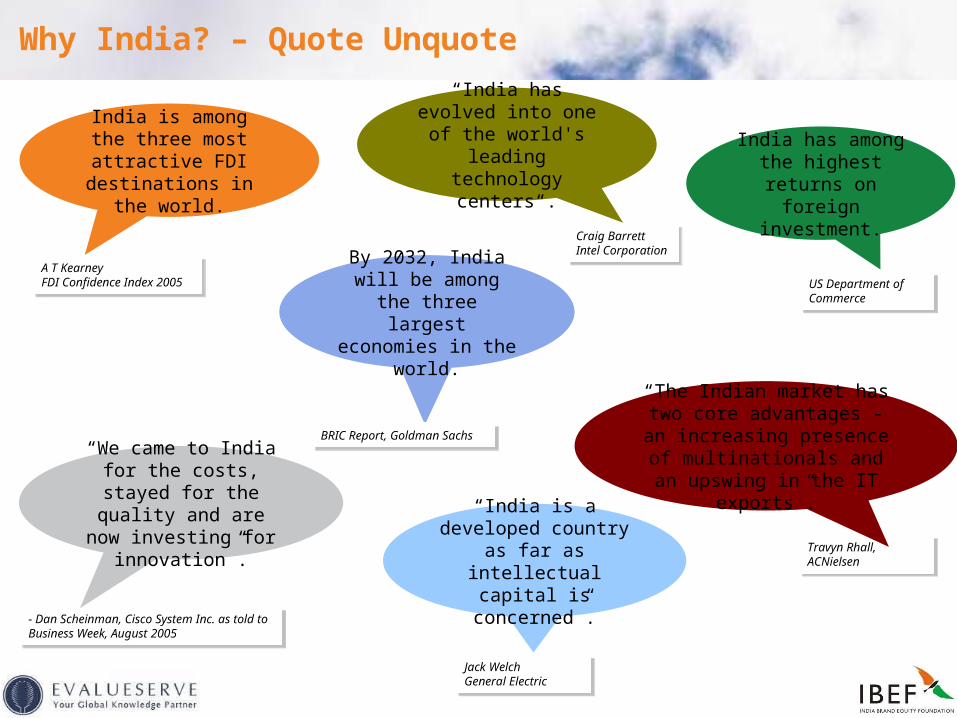
15
India has among the highest returns on foreign investment.
- Dan Scheinman, Cisco System Inc. as told to Business Week, August 2005
- Dan Scheinman, Cisco System Inc. as told to Business Week, August 2005
“We came to India for the costs, stayed for the
quality and are now investing for innovation”.
A T KearneyFDI Confidence Index 2005
A T KearneyFDI Confidence Index 2005
India is among the three most attractive
FDI destinations in the world.
Jack WelchGeneral Electric
Jack WelchGeneral Electric
“India is a developed country as far as
intellectual capital is concerned”.
US Department of Commerce
US Department of Commerce
By 2032, India will be among the three
largest economies in the world.
BRIC Report, Goldman SachsBRIC Report, Goldman Sachs
Why India? – Quote Unquote
Travyn Rhall,ACNielsen
Travyn Rhall,ACNielsen
“The Indian market has two core advantages - an
increasing presence of multinationals and an upswing
in the IT exports”.
Craig BarrettIntel Corporation
Craig BarrettIntel Corporation
“India has evolved into one of the world's leading technology
centers“.
16
DISCLAIMER This presentation has been prepared jointly by the India Brand Equity Foundation (“IBEF”) and Evalueserve.com Pvt. Ltd., EVALUESERVE (“Authors”). All rights reserved. All copyright in this presentation and related works is owned by IBEF and the Authors. The same may not be reproduced, wholly or in part in any material form (including photocopying or storing it in any medium by electronic means and whether or not transiently or incidentally to some other use of this presentation), modified or in any manner communicated to any third party except with the written approval of IBEF. This presentation is for information purposes only. While due care has been taken during the compilation of this presentation to ensure that the information is accurate to the best of the Author’s and IBEF’s knowledge and belief, the content is not to be construed in any manner whatsoever as a substitute for professional advice. The Author and IBEF neither recommend or endorse any specific products or services that may have been mentioned in this presentation and nor do they assume any liability or responsibility for the outcome of decisions taken as a result of any reliance placed in this presentation. Neither the Author nor IBEF shall be liable for any direct or indirect damages that may arise due to any act or omission on the part of the user due to any reliance placed or guidance taken from any portion of this presentation.


