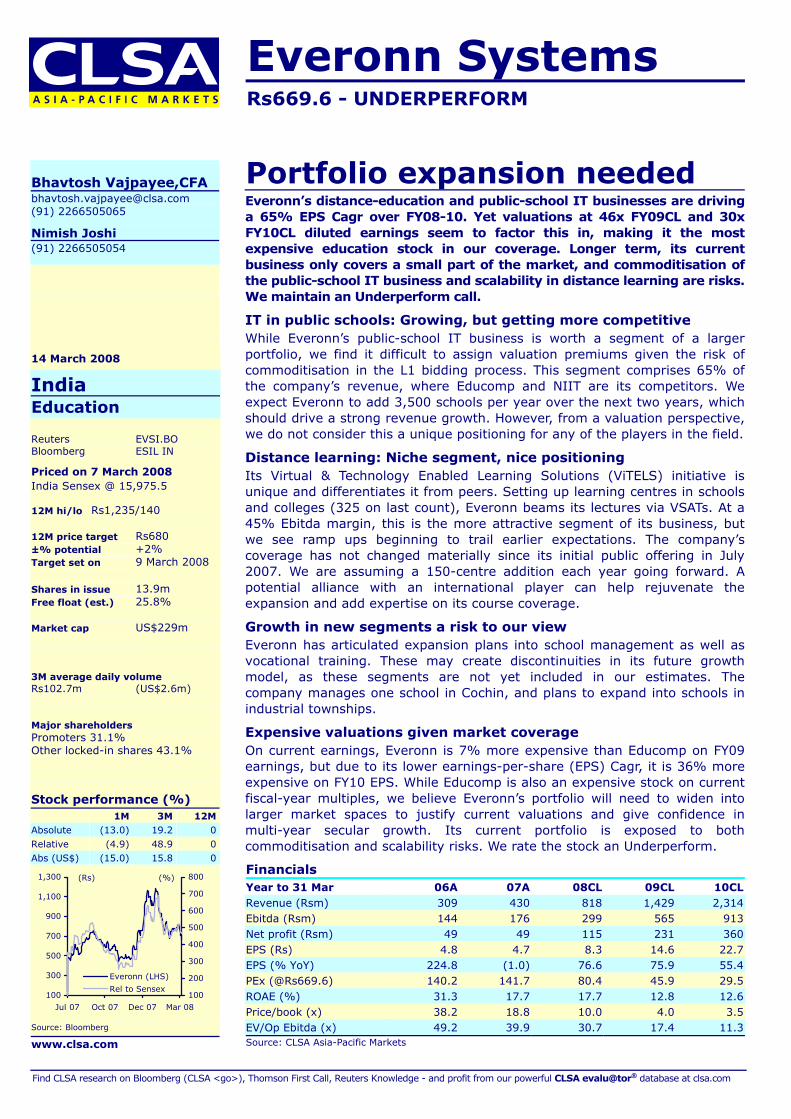
Takeoff Organised private initiatives are gaining momentum in India’s lucrative education market. Despite regulatory ambiguity in some areas, exciting prospects lie ahead for firms that have already boarded the bus. We put annual private expenditure at US$40bn and project a 16% five-year Cagr. Educomp and Aptech are BUYs. Revival prospects and cheaper valuations support our Outperform call on NIIT, while we rate Everonn an Underperform as it is expensive and lacks a solid portfolio of services.
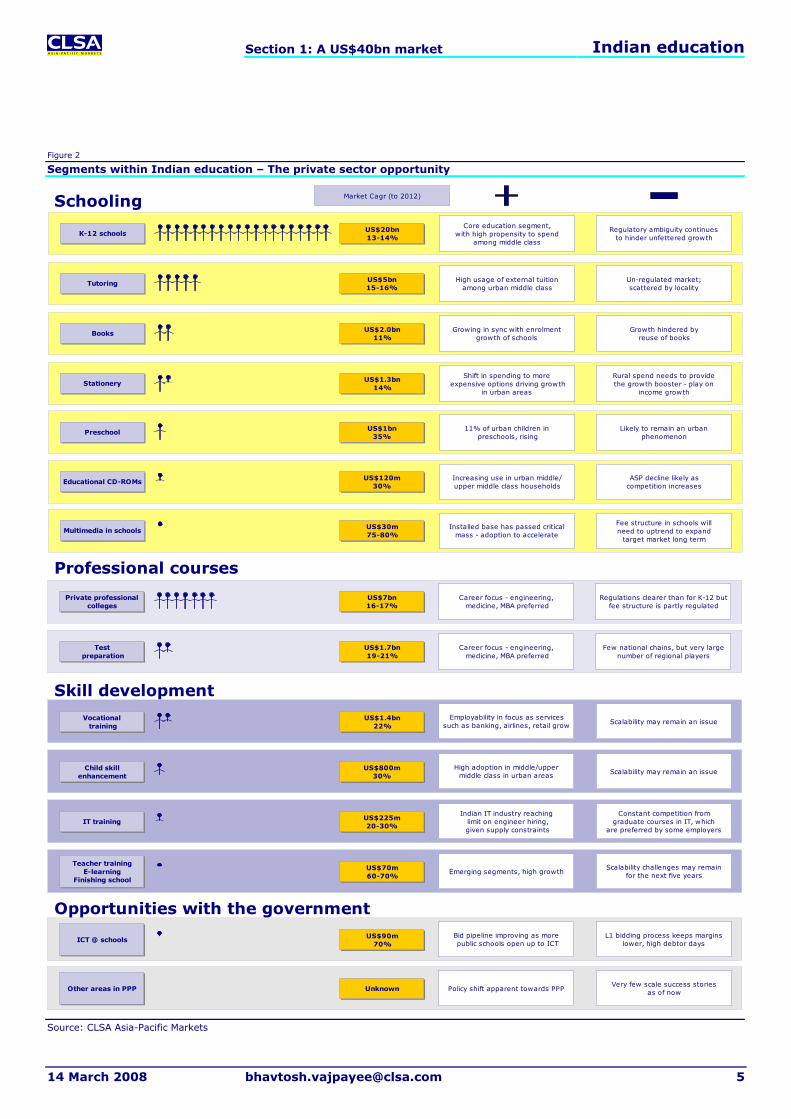
We estimate the Kindergarten to Grade 12 (K-12) segment at US$20bn, private professional colleges at US$7bn and tutoring at US$5bn. These are the largest segments of the total private education market that we estimate to be worth some US$40bn. Other meaningful and fast-growing areas include vocational training at US$1.4bn, test preparation at US$1.7bn and preschools at US$1bn. Our proprietary work indicates a growing shift towards private schooling. India’s 75,000 private schools account for 7% of total institutions, but enrol 40% of the country’s 219 million students – even as some 142 million children are not in the school system.
The combined market capitalisation of listed education companies in India is only about US$2.6bn, on 2008 revenue of US$450m. We see consolidation ahead, as national chains emerge. Test prep and tutoring appear most segmented, being spread thinly between small regional players; while areas such as e-learning, teacher training and online tutoring are nascent. K-12 and private professional colleges are the most scalable segments on offer.
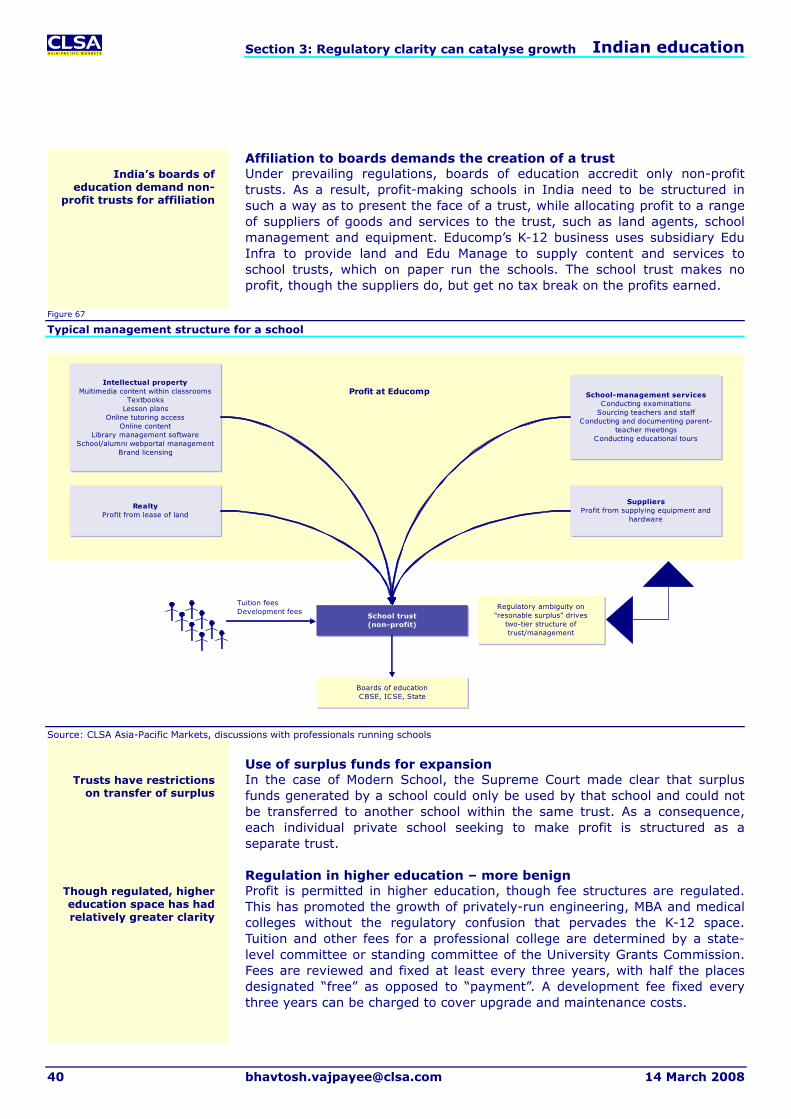
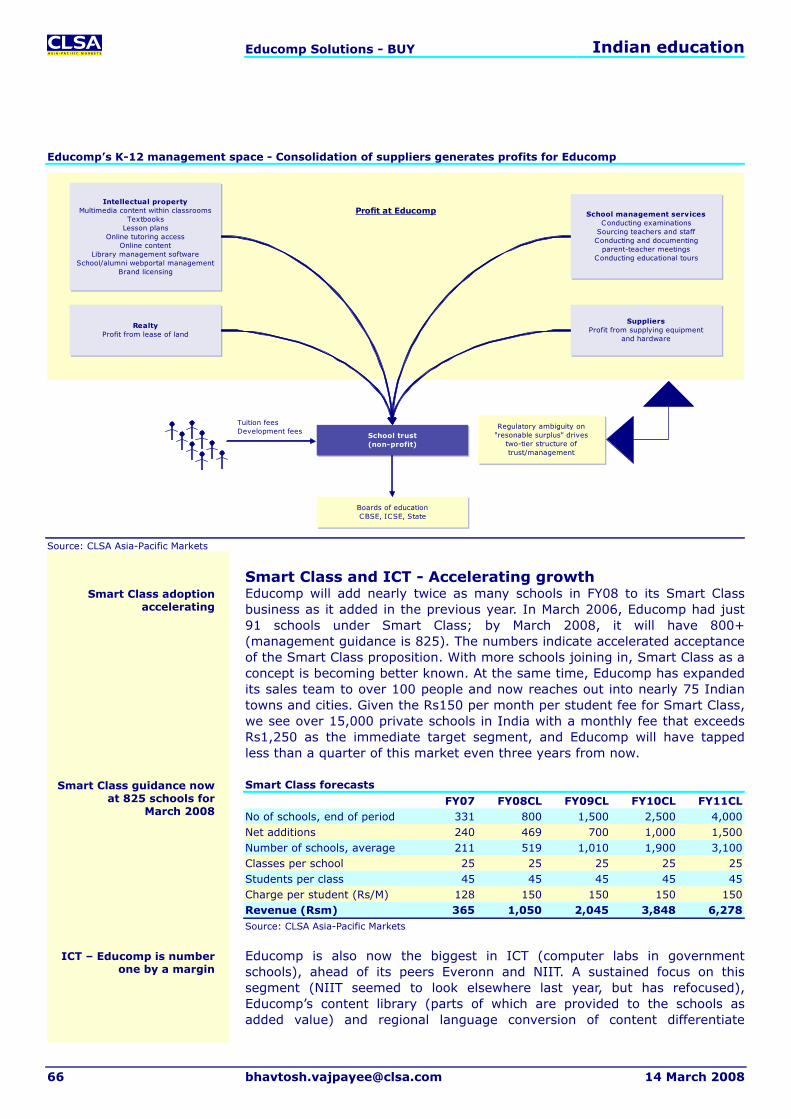
The liberalisation debate will intensify as India’s policy planners struggle with a failed public-education system amid continued resistance to the commercialisation of education. Court judgements have talked of a “reasonable surplus” for schools and higher-education establishments, without clarifying the scale of profits that constitute the surplus. In the absence of centralised or regionally consistent regulation, profit is likely to come from the provision of services such as land leases, intellectual property and school management. Nonetheless, recent policy statements indicate a more liberal and welcoming environment ahead for private participation.
We rate Educomp and Aptech BUYs; NIIT an Outperformer, while Everonn should Underperform. Educomp stands out with sector-leading 90-100% EPS growth coupled with long-term portfolio mapping across attractive segments. Aptech’s focus in China and India, and scale in new retail initiatives gives it an EPS Cagr in excess of 50% without the need for high capex. It also enjoys attractive valuations. NIIT, despite its rampup in vocational training, appears hemmed in by its exposure to the slow-growing US corporate-training market, which contributes 56% of revenue. However, inexpensive valuations and improving financials support an Outperform rating. Everonn is most expensive but lacks the breadth of portfolio to back up its valuation multiples.
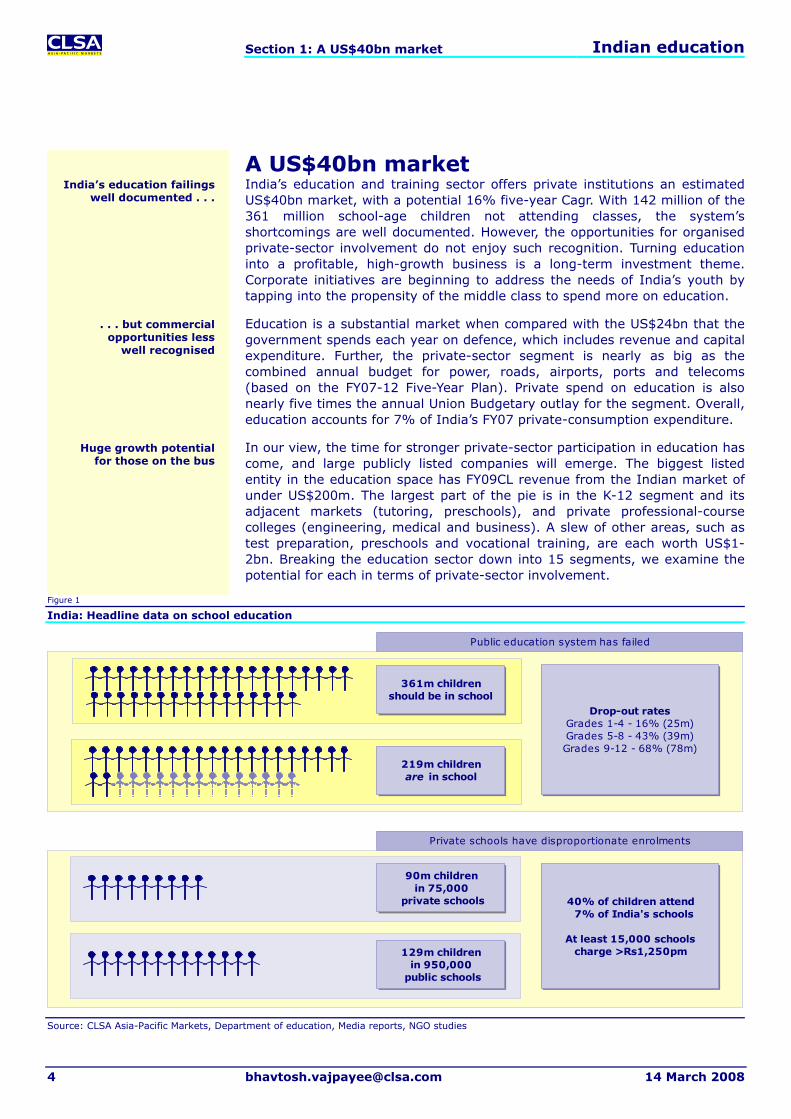
A US$40bn market India’s education and training sector offers private institutions an estimated US$40bn market, with a potential 16% five-year Cagr. With 142 million of the 361 million school-age children not attending classes, the system’s shortcomings are well documented. However, the opportunities for organised private-sector involvement do not enjoy such recognition. Turning education into a profitable, high-growth business is a long-term investment theme. Corporate initiatives are beginning to address the needs of India’s youth by tapping into the propensity of the middle class to spend more on education.
Education is a substantial market when compared with the US$24bn that the government spends each year on defence, which includes revenue and capital expenditure. Further, the private-sector segment is nearly as big as the combined annual budget for power, roads, airports, ports and telecoms (based on the FY07-12 Five-Year Plan). Private spend on education is also nearly five times the annual Union Budgetary outlay for the segment. Overall, education accounts for 7% of India’s FY07 private-consumption expenditure.
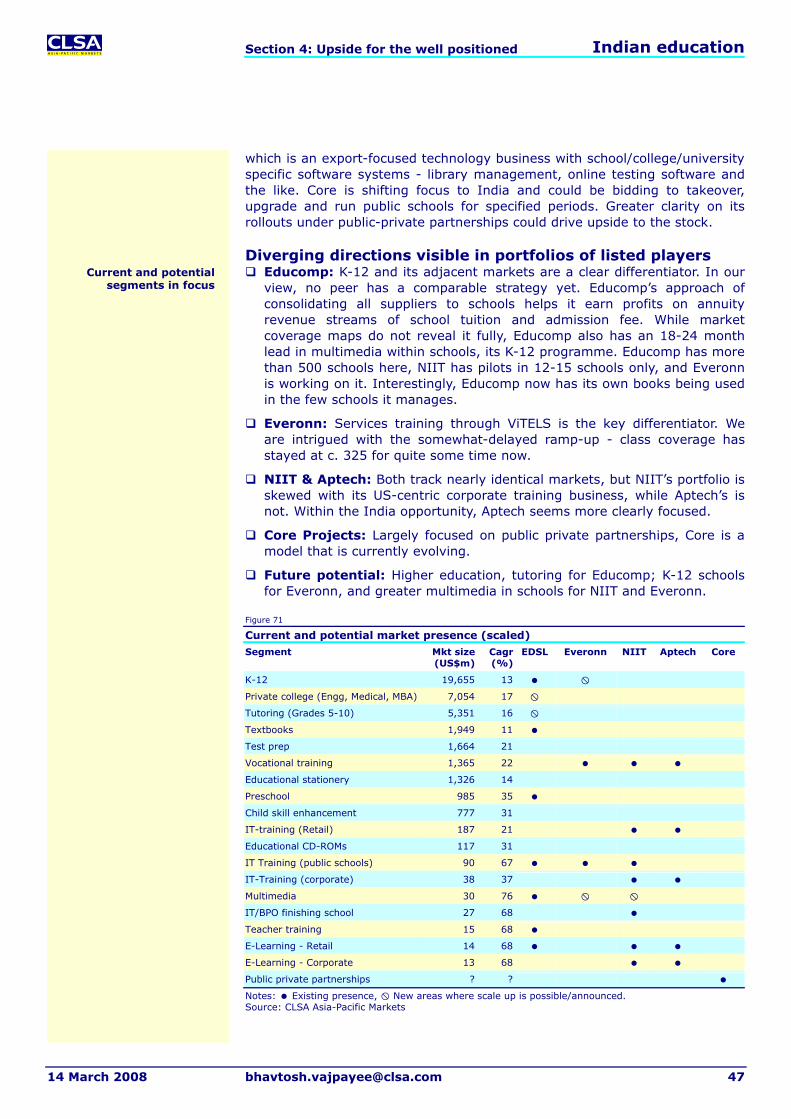
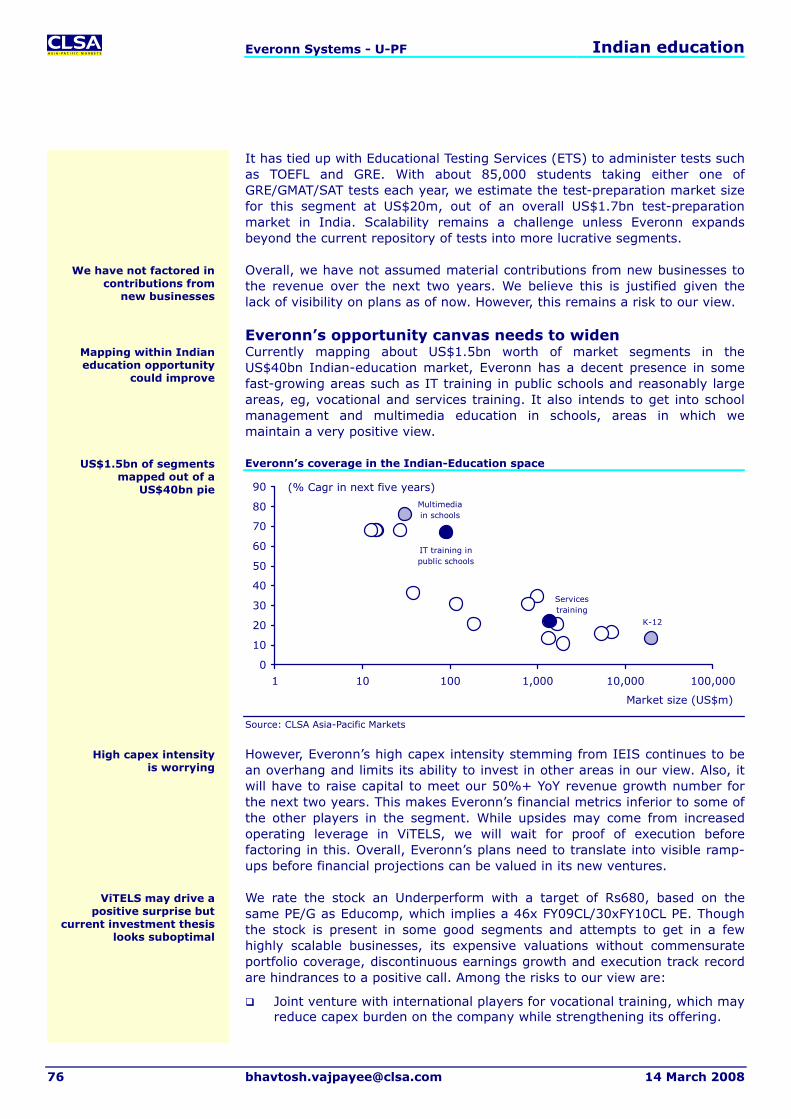
In our view, the time for stronger private-sector participation in education has come, and large publicly listed companies will emerge. The biggest listed entity in the education space has FY09CL revenue from the Indian market of under US$200m. The largest part of the pie is in the K-12 segment and its adjacent markets (tutoring, preschools), and private professional-course colleges (engineering, medical and business). A slew of other areas, such as test preparation, preschools and vocational training, are each worth US$1-2bn. Breaking the education sector down into 15 segments, we examine the potential for each in terms of private-sector involvement.
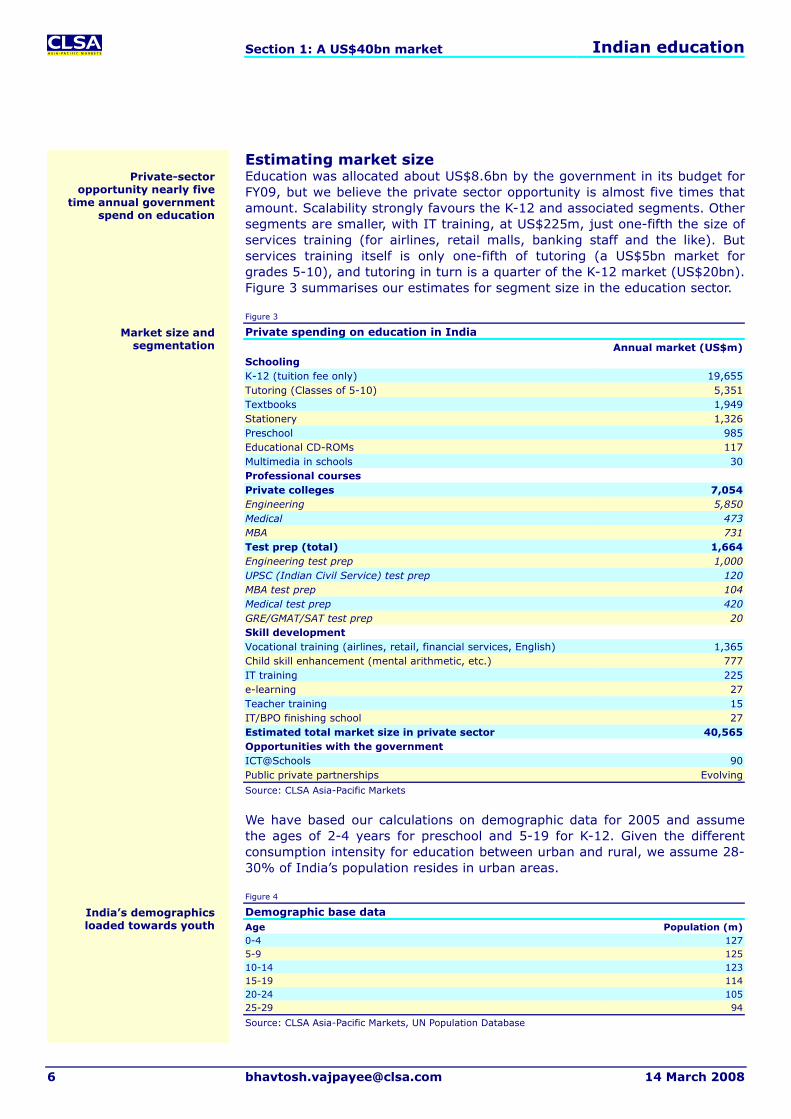
Estimating market size Education was allocated about US$8.6bn by the government in its budget for FY09, but we believe the private sector opportunity is almost five times that amount. Scalability strongly favours the K-12 and associated segments. Other segments are smaller, with IT training, at US$225m, just one-fifth the size of services training (for airlines, retail malls, banking staff and the like). But services training itself is only one-fifth of tutoring (a US$5bn market for grades 5-10), and tutoring in turn is a quarter of the K-12 market (US$20bn). Figure 3 summarises our estimates for segment size in the education sector.
Figure 3
Private spending on education in India Annual market (US$m)Schooling K-12 (tuition fee only) 19,655Tutoring (Classes of 5-10) 5,351Textbooks 1,949Stationery 1,326Preschool 985Educational CD-ROMs 117Multimedia in schools 30Professional courses Private colleges 7,054Engineering 5,850Medical 473MBA 731Test prep (total) 1,664Engineering test prep 1,000UPSC (Indian Civil Service) test prep 120MBA test prep 104Medical test prep 420GRE/GMAT/SAT test prep 20Skill development Vocational training (airlines, retail, financial services, English) 1,365Child skill enhancement (mental arithmetic, etc.) 777IT training 225e-learning 27Teacher training 15IT/BPO finishing school 27Estimated total market size in private sector 40,565Opportunities with the government ICT@Schools 90Public private partnerships Evolving
Source: CLSA Asia-Pacific Markets
We have based our calculations on demographic data for 2005 and assume the ages of 2-4 years for preschool and 5-19 for K-12. Given the different consumption intensity for education between urban and rural, we assume 28-30% of India’s population resides in urban areas.
Figure 4
Demographic base data Age Population (m)0-4 1275-9 12510-14 12315-19 11420-24 10525-29 94
Source: CLSA Asia-Pacific Markets, UN Population Database
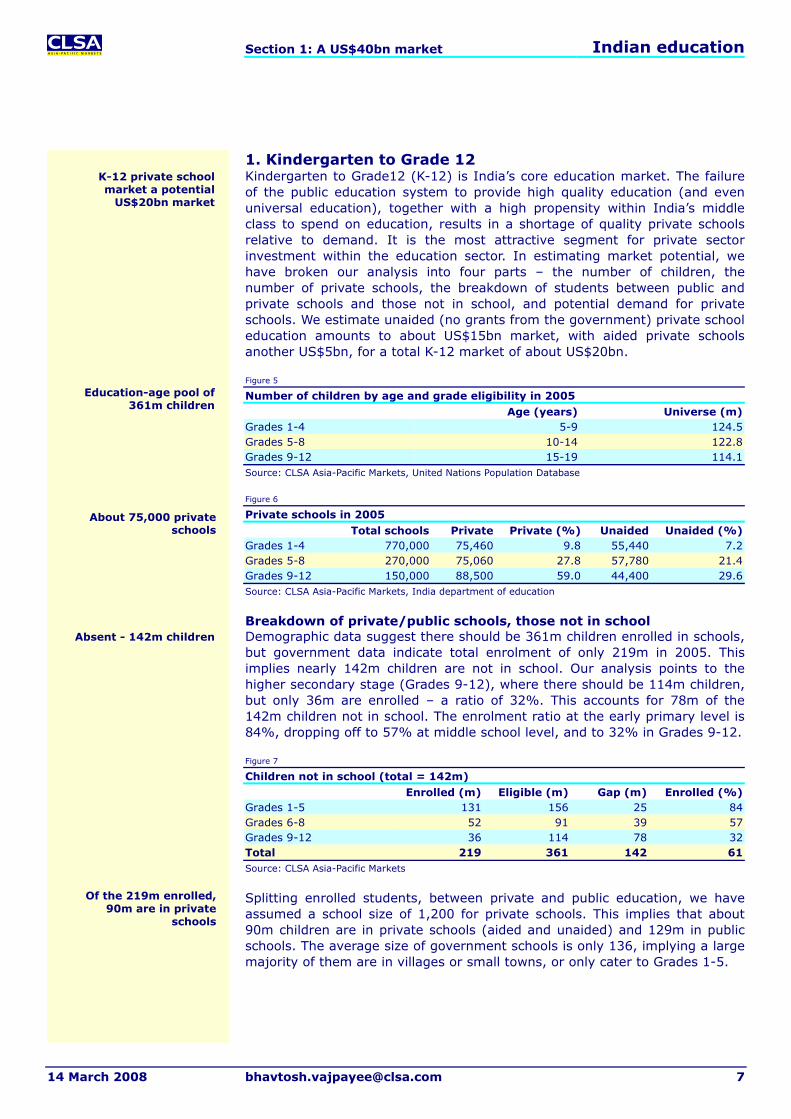
1. Kindergarten to Grade 12 Kindergarten to Grade12 (K-12) is India’s core education market. The failure of the public education system to provide high quality education (and even universal education), together with a high propensity within India’s middle class to spend on education, results in a shortage of quality private schools relative to demand. It is the most attractive segment for private sector investment within the education sector. In estimating market potential, we have broken our analysis into four parts – the number of children, the number of private schools, the breakdown of students between public and private schools and those not in school, and potential demand for private schools. We estimate unaided (no grants from the government) private school education amounts to about US$15bn market, with aided private schools another US$5bn, for a total K-12 market of about US$20bn.
Figure 5
Number of children by age and grade eligibility in 2005 Age (years) Universe (m)Grades 1-4 5-9 124.5Grades 5-8 10-14 122.8Grades 9-12 15-19 114.1Source: CLSA Asia-Pacific Markets, United Nations Population Database
Figure 6
Private schools in 2005
Total schools Private Private (%) Unaided Unaided (%)Grades 1-4 770,000 75,460 9.8 55,440 7.2Grades 5-8 270,000 75,060 27.8 57,780 21.4Grades 9-12 150,000 88,500 59.0 44,400 29.6Source: CLSA Asia-Pacific Markets, India department of education
Breakdown of private/public schools, those not in school Demographic data suggest there should be 361m children enrolled in schools, but government data indicate total enrolment of only 219m in 2005. This implies nearly 142m children are not in school. Our analysis points to the higher secondary stage (Grades 9-12), where there should be 114m children, but only 36m are enrolled – a ratio of 32%. This accounts for 78m of the 142m children not in school. The enrolment ratio at the early primary level is 84%, dropping off to 57% at middle school level, and to 32% in Grades 9-12.
Figure 7
Children not in school (total = 142m) Enrolled (m) Eligible (m) Gap (m) Enrolled (%)Grades 1-5 131 156 25 84Grades 6-8 52 91 39 57Grades 9-12 36 114 78 32Total 219 361 142 61Source: CLSA Asia-Pacific Markets
Splitting enrolled students, between private and public education, we have assumed a school size of 1,200 for private schools. This implies that about 90m children are in private schools (aided and unaided) and 129m in public schools. The average size of government schools is only 136, implying a large majority of them are in villages or small towns, or only cater to Grades 1-5.
Private- and public-school enrolment Private schools 75,060Per-school capacity (assumed) 1,200Children in private schools (m) 90Total enrolment (m) 219Not in school (m) 142Children in public schools (m) 129Public schools 950,980Implied per school capacity, public schools 136
Source: CLSA Asia-Pacific Markets
Figure 9
Public schools - Vast majority in rural areas Assumed breakdown Public schools Enrolment/school Total children (m)Village schools 800,000 25 20Smaller schools 75,000 500 38Mainstream public schools 75,980 940 71Total public schools 950,980 136 129
Source: CLSA Asia-Pacific Markets, India department of education
Figure 10
Check: 2.0-2.5 sections per class grade Per school enrolment Per class Sections per classPrivate schools 1,200 40 2.5Mainstream public schools 940 40 2.0
Source: CLSA Asia-Pacific Markets, Discussion with professionals in the education industry
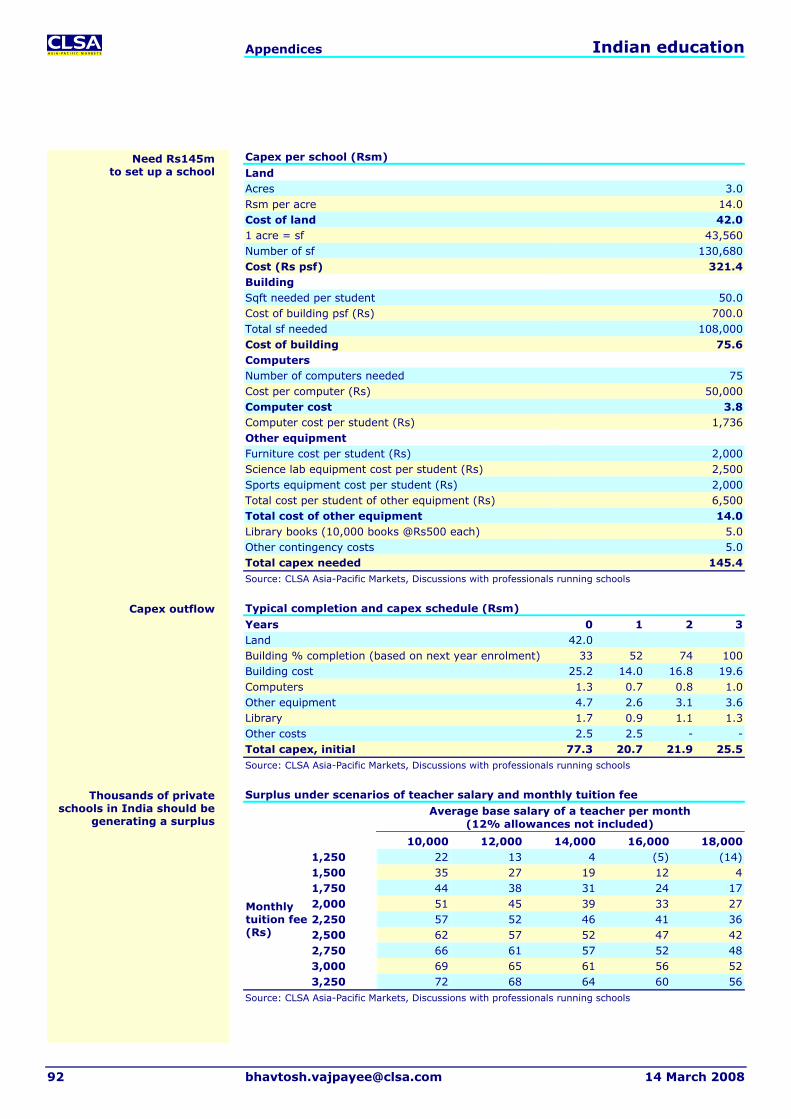
Market size estimation for private schools Armed with data on the number of private schools (75,060) and enrolments (1,200 students on average), we approximate the market size at US$20bn. This does not include one-time admission fees charged by a large number of institutions, and we have assumed three categories of private schools:
Unaided premium = 15,000 schools, monthly fee of Rs1,250
Unaided standard = 29,400 schools, monthly fee Rs750
Aided = 30,660 schools, monthly fee of Rs450
Figure 11
K-12 - Estimate of market size Total private schools in India 75,060Unaided premium segment, number of schools 15,000Annual average fee (Rs) 15,000Annual income (Rsm) 270,000Annual income (US$m) 6,750Unaided standard private schools 29,400Annual average fee (Rs) 9,000Annual income (Rsm) 317,520Annual income (US$m) 7,938Aided private schools 30,660Annual average fee (Rs) 5,400Annual income (Rsm) 198,677Annual income (US$m) 4,967Total private K-12 market (US$m) 19,655
Source: CLSA Asia-Pacific Markets, Discussion with professionals in the education industry
Figure 12
K-12 private-schools market - A comparison India UK USNumber of schools 75,060 1,276 28,384Students enrolled 90,000,000 509,093 5,998,200Average annual tuition fees (US$) 218 12,000 12,500Size of private school market (US$m) 19,655 6,109 74,978
Source: CLSA Asia-Pacific Markets, isc.co.uk, US department of education
Large number of public schools village-based
Fees at 15,000 schools Rs1,250 or more a month
Potential US$20bn market
India private K-12 market is meaningfully large than that in developed markets
2. Tutoring Augmented teaching outside the classroom is a big business in India. Though a largely urban phenomenon, the numbers add up to a market worth an estimated US$5.3bn. It is the biggest segment associated with K-12 and the third biggest segment in education overall. We estimate at least 20m children take some form of tuition outside the classroom. This compares with 90m children enrolled into India’s private schools, and a total school enrolment of 219m. Notably, the need and usage of external tuitions is even greater for students in public schools, where the quality of “in school” education is often below the standards of private schools. In our view, about 15% of urban children in Grades 5-8 and about 40% of urban children in Grades 9-12 use tuition facilities outside school.
India’s propensity to spend on education In late 2007, as part of our Mr & Mrs Asia series, we surveyed 1,616 households across 16 state capitals in an attempt to define India’s true middle class. Spending on education was the biggest single
monthly outlay after food and groceries, underscoring the extent of the focus on learning among not just the country’s elite but its middle class too.
Figure 15
Education is a major middle class expenditure
8.98.3
7.74.34.34.2
3.73.23.13.0
2.82.32.22.2
1.51.31.3
0.70.6
10.0
24.5
0 5 10 15 20 25
Food & groceryEducation
EntertainmentMobile phones
Fuel & transportationStationery
Personal careCommunication
HealthcareFootwear
Toys & giftsApparels
Loan repaymentCable & internetHousehold help
HomecareRent & utilities
JewelleryVacations
FurnishingOthers
(%)
Source: CLSA Asia-Pacific Markets
After school - 20m use tutoring
Mr & Mrs India survey shows the importance people place on education
3. Textbooks India’s education sector consumes nearly US$2bn worth of textbooks a year, of which US$1.6bn is in the K-12 segment and US$300m in higher education. We have assumed that 5-10% of rural and 50-60% of urban children buy new books, with the remainder reusing older text books. In the higher-education segment, we have assumed 30% new book usage.
Figure 16
Population estimation for buying new books – Urban children and higher studies
Enrolled(m)
Urban children (m)
New book buyers (%)
User base(m)
Grades 1-4 105 31 50 16Grades 5-8 78 23 60 14Grades 9-12 36 11 60 6Higher education 10 10 30 3Source: CLSA Asia-Pacific Markets, India Department of Education
Figure 17
Population estimation for buying new books – Rural children
Enrolled(m)
Ruralchildren (m)
New book buyers (%)
User base(m)
Grades 1-4 105 73 5 4Grades 5-8 78 55 10 5Grades 9-12 36 25 10 3Source: CLSA Asia-Pacific Markets, India department of education
Source: CLSA Asia-Pacific Markets, Discussions with professionals running schools
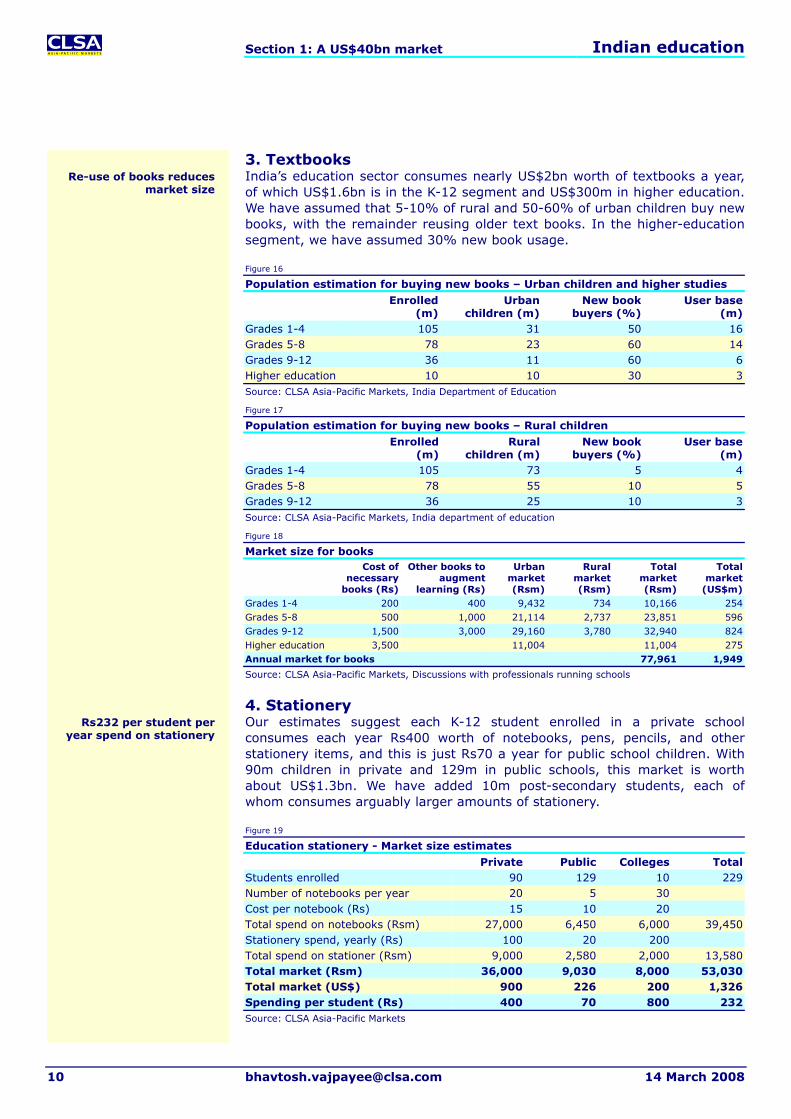
4. Stationery Our estimates suggest each K-12 student enrolled in a private school consumes each year Rs400 worth of notebooks, pens, pencils, and other stationery items, and this is just Rs70 a year for public school children. With 90m children in private and 129m in public schools, this market is worth about US$1.3bn. We have added 10m post-secondary students, each of whom consumes arguably larger amounts of stationery.
Figure 19
Education stationery - Market size estimates
Private Public Colleges TotalStudents enrolled 90 129 10 229Number of notebooks per year 20 5 30Cost per notebook (Rs) 15 10 20Total spend on notebooks (Rsm) 27,000 6,450 6,000 39,450Stationery spend, yearly (Rs) 100 20 200Total spend on stationer (Rsm) 9,000 2,580 2,000 13,580Total market (Rsm) 36,000 9,030 8,000 53,030Total market (US$) 900 226 200 1,326Spending per student (Rs) 400 70 800 232Source: CLSA Asia-Pacific Markets
5. Preschool Non-profit organisations estimate ~11.5% of urban children aged two-to-four years are in preschool education, which implies that of a total urban target base of 19m children, 2.0-2.5m are enrolled. The market is extremely fragmented, with the largest chain comprising just 550 schools, less than 4% of the total market potential for 15,000 preschools in India. Select urban preschools charge as much as Rs5,000 a month. We have assumed a more usual fee of Rs1,500 per month to arrive at our market estimate of US$985m.
Figure 20
Urban preschools – Estimate of market size
Target age 2-4 yearsEstimated number of children (m) 19Enrolment (%) 11.5Effective base (m) 2.2Number of children per school 150Potential number of schools 14,594Largest chain 550Share held by largest chain (%) 3.8Assumed fee per month (Rs) 1,500Potential annual revenue (Rsm) 39,402Potential annual revenue (US$m) 985Source: CLSA Asia-Pacific Markets, UN Population Database
Figure 21
Increased penetration will drive the preschool market in India
US IndiaNumber of children ages 2-4 (m) 8.4 63.5Number of children in pre-school (000) 1,206 2,200Penetration (%) 14.4 3.4Source: CLSA Asia-Pacific Markets, UN Population Database, US Department of Education
6. Educational CD-ROMs Use of educational CD-ROMs is increasing within middle to upper-middle class urban households. Assuming 5% of urban households buy 10 CD-ROMs a year, the market size is nearly US$120m. Intensive use is evident in the 2-9 years age group, with wider use emerging in the secondary and higher secondary curriculum, notably maths and science for Grades 9 and 10. There is a potential for a substantial expansion in this market over time.
Figure 22
Educational CD-ROMs – Estimate of market size
Retailing over the counter Cost per CD ROM (Rs) 249Target age group Urban, ages 2-9Universe (m) 56.4Children per household 1.5Number of households (m) 37.6Households buying CD-ROMs (%) 5Effective target (m households) 1.9Annual CD-ROMs buying per household 10Market (Rsm) 4,680Market (US$m) 117Source: CLSA Asia-Pacific Markets
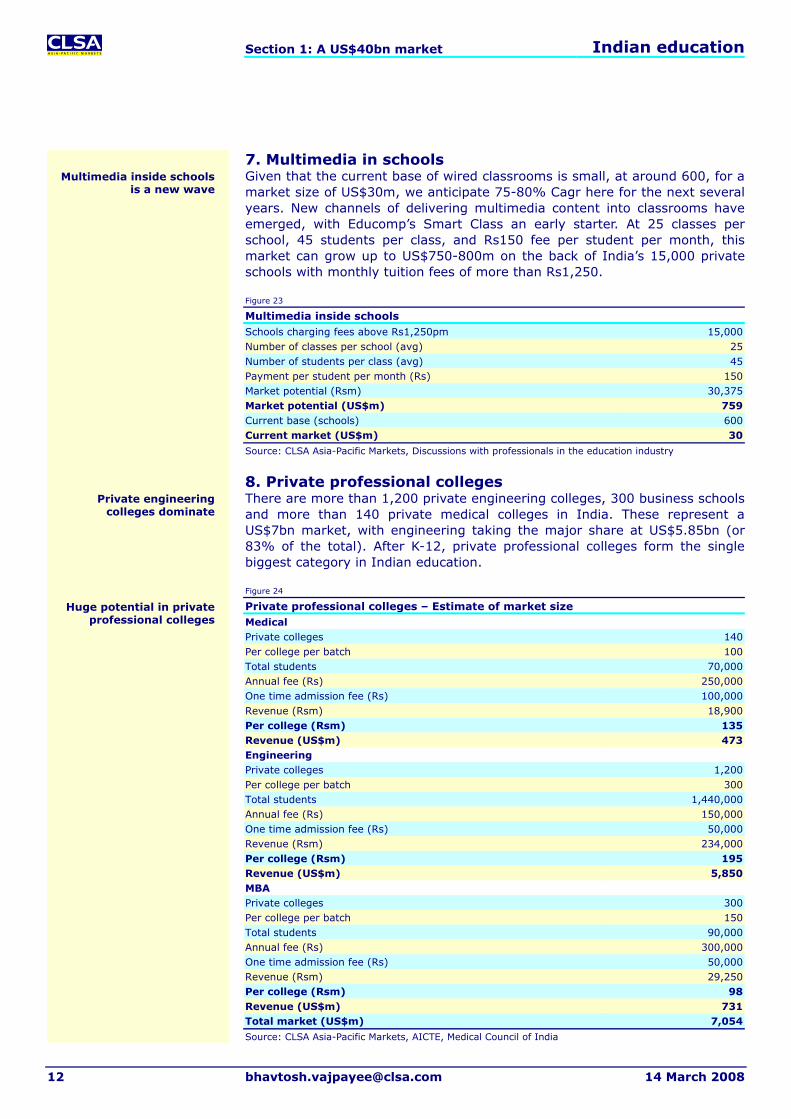
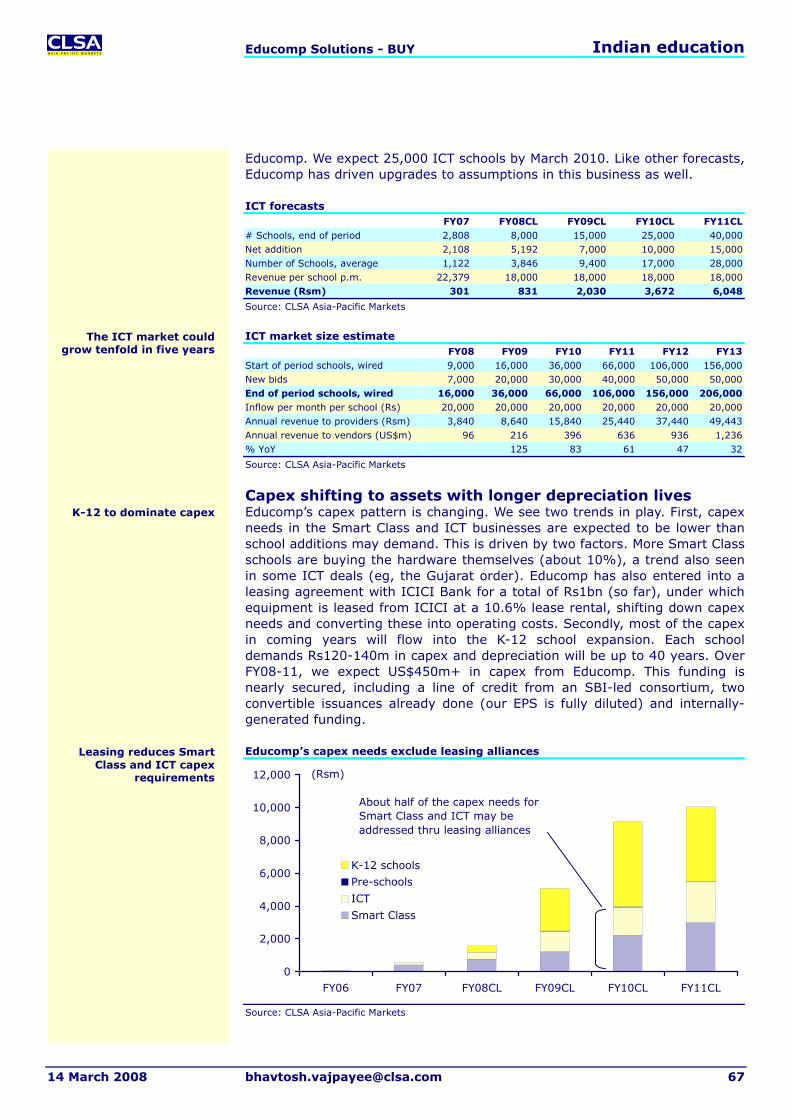
7. Multimedia in schools Given that the current base of wired classrooms is small, at around 600, for a market size of US$30m, we anticipate 75-80% Cagr here for the next several years. New channels of delivering multimedia content into classrooms have emerged, with Educomp’s Smart Class an early starter. At 25 classes per school, 45 students per class, and Rs150 fee per student per month, this market can grow up to US$750-800m on the back of India’s 15,000 private schools with monthly tuition fees of more than Rs1,250.
Figure 23
Multimedia inside schools Schools charging fees above Rs1,250pm 15,000Number of classes per school (avg) 25Number of students per class (avg) 45Payment per student per month (Rs) 150Market potential (Rsm) 30,375Market potential (US$m) 759Current base (schools) 600Current market (US$m) 30
Source: CLSA Asia-Pacific Markets, Discussions with professionals in the education industry
8. Private professional colleges There are more than 1,200 private engineering colleges, 300 business schools and more than 140 private medical colleges in India. These represent a US$7bn market, with engineering taking the major share at US$5.85bn (or 83% of the total). After K-12, private professional colleges form the single biggest category in Indian education.
Figure 24
Private professional colleges – Estimate of market size Medical Private colleges 140Per college per batch 100Total students 70,000Annual fee (Rs) 250,000One time admission fee (Rs) 100,000Revenue (Rsm) 18,900Per college (Rsm) 135Revenue (US$m) 473Engineering Private colleges 1,200Per college per batch 300Total students 1,440,000Annual fee (Rs) 150,000One time admission fee (Rs) 50,000Revenue (Rsm) 234,000Per college (Rsm) 195Revenue (US$m) 5,850MBA Private colleges 300Per college per batch 150Total students 90,000Annual fee (Rs) 300,000One time admission fee (Rs) 50,000Revenue (Rsm) 29,250Per college (Rsm) 98Revenue (US$m) 731Total market (US$m) 7,054
Source: CLSA Asia-Pacific Markets, AICTE, Medical Council of India
Source: CLSA Asia-Pacific Markets, Discussions with professionals running private professional colleges
The number of colleges continues to increase, with the biggest stream of applications coming into engineering. There are more than 1,600 approved engineering colleges, with 1,200 of them private. It should be noted that more than 400 applications have been filed with the government to set up new engineering colleges in FY08, with more than 100 so far approved.
Colleges charge an annual fee and a one-time admission fee per student. The annual fee varies from Rs150,000 for an engineering college to Rs300,000 for an MBA. Admission fees vary, but range from Rs50,000 to Rs100,000. Some colleges are reportedly charging admission fees of more than Rs500,000. Course duration varies, from five years for a medical degree, to four years for engineering and two years for an MBA.
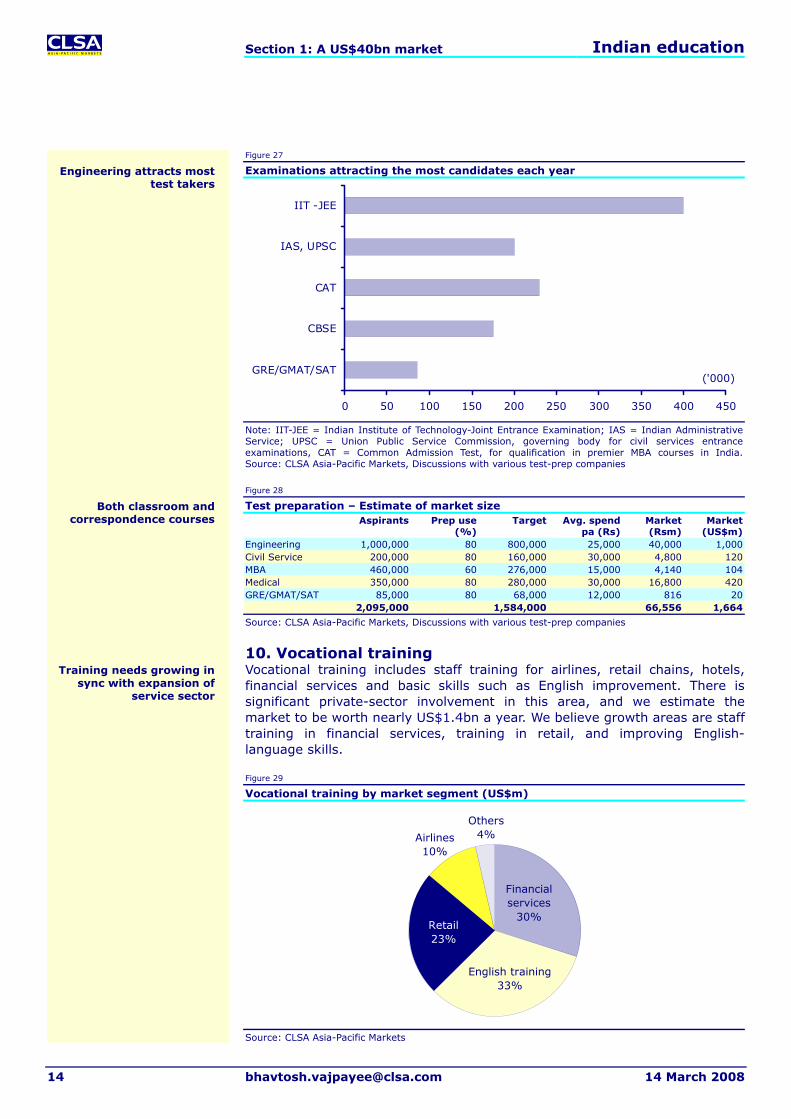
9. Test preparation Nearly 400,000 students took the IIT-Joint Entrance Examination (for the four-year engineering course offered by the Indian Institutes of Technology, IITs) last year, and another 230,000 took the IIM-Common Admission Test for MBAs (two year MBA programme at the Indian Institutes of Management, IIMs). India’s test preparation market, or test prep, is the most visible poster child of private participation in education. The attractiveness of a selected few careers – engineering, medicine, civil services and business management – has ensured disproportionate spending by India’s middle class on test prep. We estimate this market to be worth more than US$1.7bn, based on an approximate annual 2.1m students taking one of the professional entrance tests. About 1.6m of these, or 75%, pay for some form of test preparation.
Some the key assumptions driving our market estimation for test prep include the following:
While 400,000 students took the IIT entrance examination, 1m students took one of the many engineering entrance examinations nationwide (including examinations for regional engineering colleges). A typical engineering aspirant makes use of test prep in Grades 11 and 12, paying Rs25,000 per year.
We have used multipliers of 2x for estimating the total number taking examinations for medical degrees and MBAs. The CBSE and IIM entrance examinations represent the premium category. Including regional medical colleges and the top-20 business schools, the actual number is greater.
Medical test prep is assumed to be a two-year undertaking, with Civil Services, MBA and GRE/GMAT requiring one year.
Our calculations indicate engineering is the dominant section of the market, at nearly US$1bn, followed by medical. Civil Services, MBA and others are smaller components of the market.
Examinations attracting the most candidates each year
0 50 100 150 200 250 300 350 400 450
IIT -JEE
IAS, UPSC
CAT
CBSE
GRE/GMAT/SAT('000)
Note: IIT-JEE = Indian Institute of Technology-Joint Entrance Examination; IAS = Indian Administrative Service; UPSC = Union Public Service Commission, governing body for civil services entrance examinations, CAT = Common Admission Test, for qualification in premier MBA courses in India. Source: CLSA Asia-Pacific Markets, Discussions with various test-prep companies
Source: CLSA Asia-Pacific Markets, Discussions with various test-prep companies
10. Vocational training Vocational training includes staff training for airlines, retail chains, hotels, financial services and basic skills such as English improvement. There is significant private-sector involvement in this area, and we estimate the market to be worth nearly US$1.4bn a year. We believe growth areas are staff training in financial services, training in retail, and improving English-language skills.
Source: CLSA Asia-Pacific Markets, United Nations Population database
11. Child skill enhancement Urban parents are spending more on augmenting basic math and language skills of their children from an early age. Skill enhancement services such as mental mathematics, memory and speed reading are catching on in India, especially among the more affluent sections of society. UC Mas has 900 centres in India that teach mental mathematics and memory skills, and Aloha has another 600 centres. SIP Academy, started in 2002, has grown to 450 centres, and other players are expanding as well (Smart Brain has 110 centres). The target segment for this market is children in Grades 1-8. Most mental mathematics courses have 10 modules, with a fee of Rs1,400 per module. We have assumed an average of four modules, and the market size totals to a respectable near US$800m. In our view, out of the 90m children in India’s private schools, about 6m form the target segment for such courses, or about 6.7% of the total private school enrolment.
Figure 33
Child skill enhancement – Estimate of market size Students
Source: CLSA Asia-Pacific Markets, United Nations Population database
12. IT training and e-learning India generates more than 450,000 engineering graduates every year, but poor quality of education and lack of updated skill sets implies that just 50-55% can enter a job immediately after graduation. The lack of adequate quality supply has driven the need for IT training, one of the oldest market segments in education in India. However, while our focus is on estimating the market size for the domestic (within India) segment, we note that a larger part of IT training and e-learning comprises exports. China is a big market, for example.
Growth in the IT training market is hampered by the advent of university-based Bachelor and Master degrees in information technology. India’s IT companies have a marked recruitment preference for graduates from universities over those emerging from privately offered IT courses offered by NIIT and Aptech. Some recruiters insist that they hire only from institutes registered with the All India Council for Technical Education (AICTE), which private IT trainers are not. That said, the buoyancy of the Indian IT job market has lifted growth rates in IT training as well, and growth rates above 20% YoY have been seen in the last three years.
Figure 34
IT training and e-learning Total training market (Rsm) 26,260Total market (US$m) 657Retail (%) 36Domestic within retail (%) 85IT training market incl e-learning – retail (US$m) 201IT training – Corporate Corporate (%)t 64Domestic, within corporate (%) 12IT training market incl e-learning – corporate (US$m) 50Total domestic market 251Domestic market, retail + corporate+ e-learning (%) 38E-learning (within IT training) Overall e-learning % of total market 19Assumed: E-learning in retail (%) 7E-learning in corporate (%) 25E-Learning – Retail (US$m) 14E-Learning – Corporate (US$m) 13Total e-learning market (US$m) 27
Source: CLSA Asia-Pacific Markets, Dataquest
Dataquest estimates the annual retail market here at US$201m, with corporate IT training worth US$50m. Interestingly, while 85% of Indian IT training revenue comes from the domestic market, only 12% of the reported corporate IT training revenue is from India. Overall, Dataquest estimates that IT training and e-learning revenue for Indian companies was US$657m in FY07, but only 38% of this came from India. Our interest is the smaller domestic Indian market.
Figure 35 breaks out the domestic and export segments of the IT training and e-learning market.
Figure 35
IT training and e-learning – Estimate of market size
IT training, e-learning revenue for Indian companies (FY07)
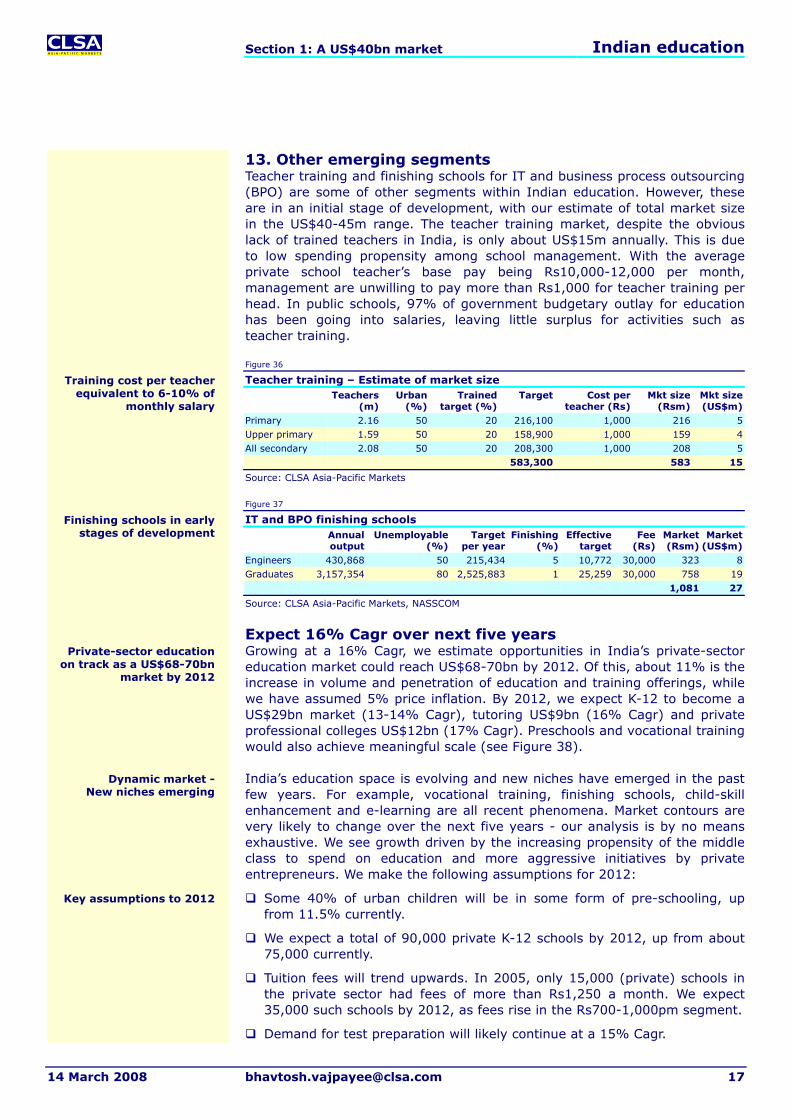
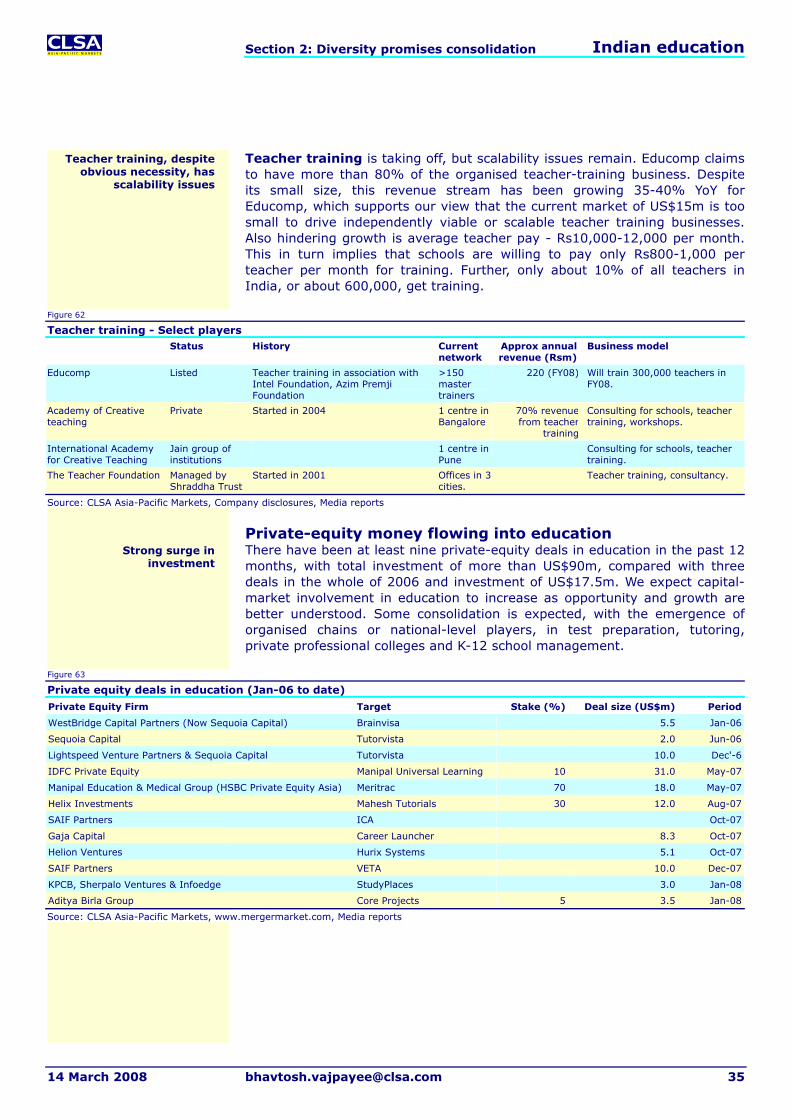
13. Other emerging segments Teacher training and finishing schools for IT and business process outsourcing (BPO) are some of other segments within Indian education. However, these are in an initial stage of development, with our estimate of total market size in the US$40-45m range. The teacher training market, despite the obvious lack of trained teachers in India, is only about US$15m annually. This is due to low spending propensity among school management. With the average private school teacher’s base pay being Rs10,000-12,000 per month, management are unwilling to pay more than Rs1,000 for teacher training per head. In public schools, 97% of government budgetary outlay for education has been going into salaries, leaving little surplus for activities such as teacher training.
Expect 16% Cagr over next five years Growing at a 16% Cagr, we estimate opportunities in India’s private-sector education market could reach US$68-70bn by 2012. Of this, about 11% is the increase in volume and penetration of education and training offerings, while we have assumed 5% price inflation. By 2012, we expect K-12 to become a US$29bn market (13-14% Cagr), tutoring US$9bn (16% Cagr) and private professional colleges US$12bn (17% Cagr). Preschools and vocational training would also achieve meaningful scale (see Figure 38).
India’s education space is evolving and new niches have emerged in the past few years. For example, vocational training, finishing schools, child-skill enhancement and e-learning are all recent phenomena. Market contours are very likely to change over the next five years - our analysis is by no means exhaustive. We see growth driven by the increasing propensity of the middle class to spend on education and more aggressive initiatives by private entrepreneurs. We make the following assumptions for 2012:
Some 40% of urban children will be in some form of pre-schooling, up from 11.5% currently.
We expect a total of 90,000 private K-12 schools by 2012, up from about 75,000 currently.
Tuition fees will trend upwards. In 2005, only 15,000 (private) schools in the private sector had fees of more than Rs1,250 a month. We expect 35,000 such schools by 2012, as fees rise in the Rs700-1,000pm segment.
Demand for test preparation will likely continue at a 15% Cagr.
We expect 800 more private engineering colleges to open by 2012, 60 medical colleges and 300 MBA colleges. However, recent government statements indicate 400+ new engineering college applications and 100+ approvals to date for the current fiscal year. There is upside risk to our assumptions given this trend of new applications.
For tutoring, we have assumed 25% of children in Grades 5-8 and 66% in Grades 9-12 will use some form of out-of-the-school tutoring by 2012, up from 15% and 40% respectively as of now.
Growth in textbooks is likely to be driven by increasing numbers of schools, enrolment and use of new books. We assume 10-15% of rural children will buy new books in 2012, from 5-10% currently.
Growth in education stationery is dependent on rising usage, as well as enrolments. The former is a function of income growth. We assume usage of 25 notebooks per year for private school students in 2012, up from the current 20, and seven for public school students, up from five.
For vocational training, we have reduced the annual growth of the recruiter businesses to about 20% annually, though from a large base. In 2012, we expect 1.2m youths to be candidates for some form of skill/vocational training, from 0.5-0.6m currently.
Opportunities in public-private partnerships New initiatives are rising across the gamut of public/private partnerships (or PPP), with ICT (Information & Communications Technology) at schools an early success story. Policy planners are beginning to emphasise PPP (see comments from the National Knowledge Commission in Section 3 of the report), and we think this could create revenue-generating models for the private sector. We see numerous opportunities, including:
Relocate or build new schools, colleges, universities or job centres and provide facilities management for the new buildings/campuses. Projects might involve land swaps or enable the private sector provider to generate a third party revenue stream from the extant infrastructure.
Build facilities for education institutions with the potential for third-party income generation, such as sports or academic/conference facilities.
Refurbish existing assets and/or provide facilities management.
Provide information systems that ensure the continued availability of hardware and software over a period of time, or allocate to the private sector some administrative functions. There may be opportunities for third-party income generation by selling excess capacity.
Institutions have varying requirements and the private sector may be able to offer innovative solutions that offer quality services and value for money.
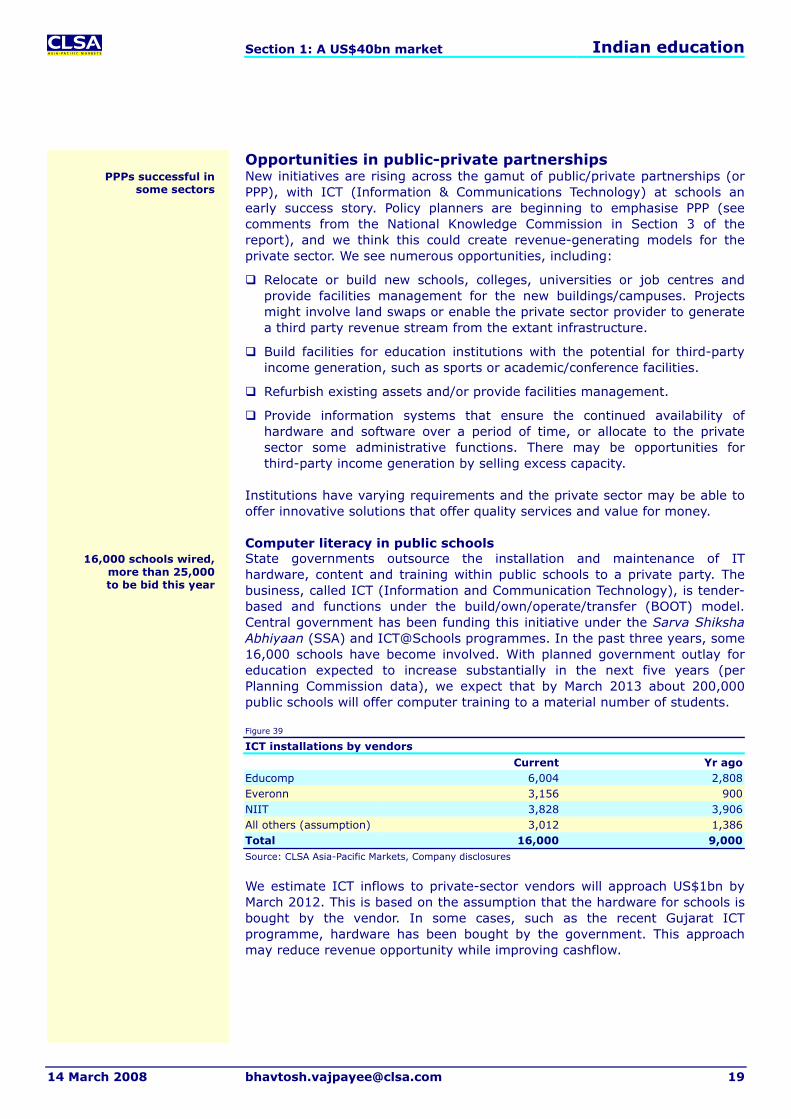
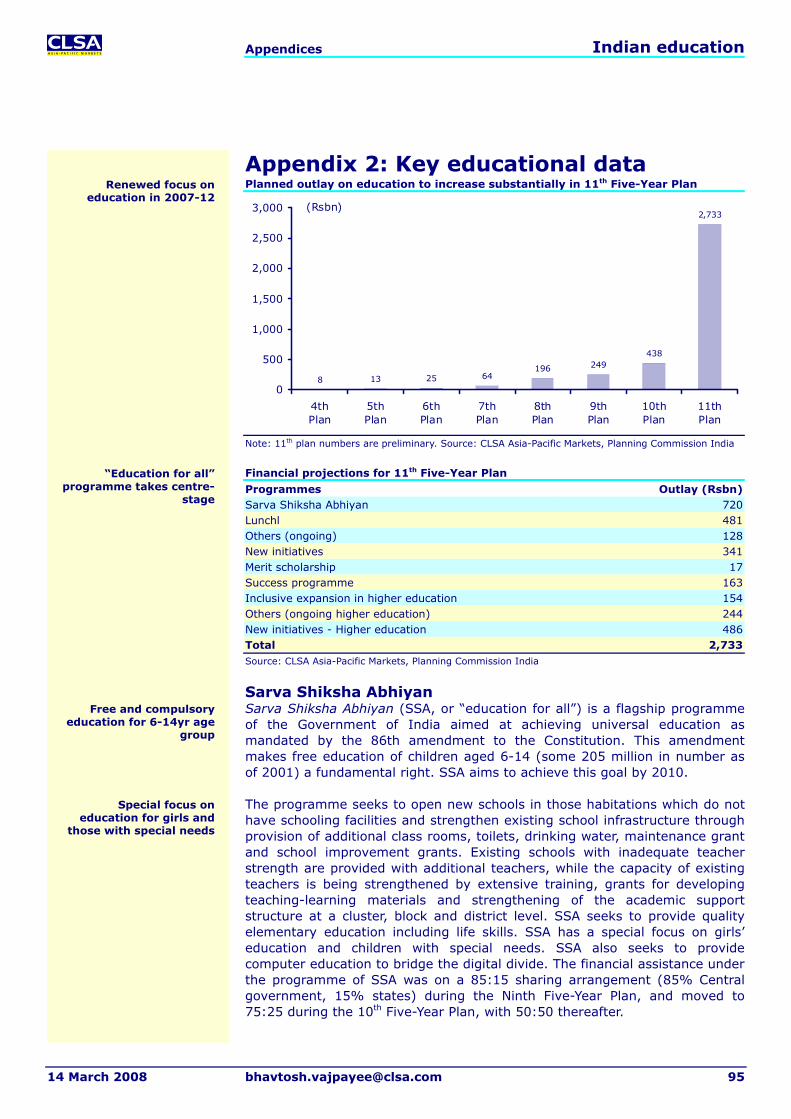
Computer literacy in public schools State governments outsource the installation and maintenance of IT hardware, content and training within public schools to a private party. The business, called ICT (Information and Communication Technology), is tender-based and functions under the build/own/operate/transfer (BOOT) model. Central government has been funding this initiative under the Sarva Shiksha Abhiyaan (SSA) and ICT@Schools programmes. In the past three years, some 16,000 schools have become involved. With planned government outlay for education expected to increase substantially in the next five years (per Planning Commission data), we expect that by March 2013 about 200,000 public schools will offer computer training to a material number of students.
Figure 39
ICT installations by vendors
Current Yr agoEducomp 6,004 2,808Everonn 3,156 900NIIT 3,828 3,906All others (assumption) 3,012 1,386Total 16,000 9,000Source: CLSA Asia-Pacific Markets, Company disclosures
We estimate ICT inflows to private-sector vendors will approach US$1bn by March 2012. This is based on the assumption that the hardware for schools is bought by the vendor. In some cases, such as the recent Gujarat ICT programme, hardware has been bought by the government. This approach may reduce revenue opportunity while improving cashflow.
PPPs successful in some sectors
16,000 schools wired, more than 25,000 to be bid this year
ICT – Estimate of market size FY08 FY09 FY10 FY11 FY12 FY13Start of period schools, wired 9,000 16,000 36,000 66,000 106,000 156,000New bids 7,000 20,000 30,000 40,000 50,000 50,000End of period schools, wired 16,000 36,000 66,000 106,000 156,000 206,000Inflow per month per school (Rs) 20,000 20,000 20,000 20,000 20,000 20,000Annual revenue to providers (Rsm) 3,840 8,640 15,840 25,440 37,440 49,443Annual revenue providers (US$m) 96 216 396 636 936 1,236Chg YoY (%) 125 83 61 47 32
Source: CLSA Asia-Pacific Markets
Upgrade of industrial training institutes India’s finance ministry has proposed financial support for the upgrade of 1,396 industrial training institutes (ITIs) to so-called centres for excellence in specific trades and skills through PPP. State governments will continue to regulate admissions and fees, with private management receiving academic and financial autonomy. The role of the central government is to provide seed capital. The government aims to upgrade 300 ITIs a year, with Rs7.5bn allocated for this purpose. Interest has come from the likes of Hero Honda, ITC, Larsen & Toubro, Ashok Leyland, Bharat Heavy Electrical, Coca Cola, HCL, Wipro, Kirloskar and Tata. Some of the upgrade programmes for ITIs are also being funded through World Bank grants.
School transformation and quality improvement IL&FS Education and Technology Services (IETS), in public-private partnership with the Pimpri-Chinchwad Municipal Corp and Science and Technology Park will be upgrading and transforming 156 schools, run by the Pimpri-Chinchwad Municipal Corp. The transformation project includes providing integrated solutions for enhancement of the quality of school education by upgrading IT infrastructure. This includes setting up of web-enabled MIS systems that will improve administrative functions and enhance classroom processes through the use of ICT tools. The major input comprises Marathi computer-aided learning materials to supplement the syllabus.
Under Sarva Shiksha Abhiyaan, the Jharkhand government has rolled out a computer education and computer-aided education programme to access satellite-delivered education at the local level. The programme is being jointly implemented by the Jharkhand Education Project Council, the Jharkhand Agency for Promotion of Information Technology and Core Projects, which has developed a total solution that tracks funds allocated by the central government for different aspects of the programme, including financial, civil work. In addition to this, the solution helps administrators track the individual progress of each student and the performance of teachers. The project covers 22 districts and 440 schools.
There are about 950,000 schools in India run by governments/local bodies. The infrastructure in a majority of these schools is in a very poor state and needs urgent upgrades. Despite the proposed increase in outlay for education, the government has limited scope to ensure proper use of these funds. We believe PPP is the way forward for upgrade of public schools. We expect more initiatives in coming years.
Case study: Private participation in vocational training Tata Steel has signed MOUs with the Jharkhand government to upgrade polytechnics and ITIs. Before this bid, Tata Steel has a track record for supporting vocational training institutes. Shavak Nanavati Technical Institute (formerly known as Jamshedpur Technical Institute), is located in Jamshedpur. Set up in 1921, this institute is operated by Tata Steel. It offers courses in
metallurgy, advanced electrical and mechanical engineering, telecommunication, accounting, first aid, safety, computerisation of accounts and practical training. Its flagship program is a three-year residential program for students who have passed Grade 10. Students receive free accommodation and a monthly stipend. On graduation, they can apply to Tata Steel for a job.
Case study: Charter schools in US an example of PPP Charter schools are publicly funded elementary or secondary schools freed from some statutes that apply to public schools. They operate as for-profit or non-profit entities and operational control resides in private managements despite the public funding that supports these schools. Charter schools are prevalent in US, with 40 states having charter-school laws. First set-up in US in 1991, currently there are
3,940 charter schools in the US with total enrolment of 1.15m students. Edison Schools is a leader in management, with at least 127 schools under its umbrella through alliances with local education authorities in the US and UK, serving almost 80,000 students. Mosaica Education has at least 76 charter schools in seven states and the District of Columbia, serving more than 14,000 students.
Case study: PPP in Canada In 1997, the Canadian province of Nova Scotia turned to PPP for its new schools and by the end of 1998 there were 41 completed or approved schools, with a further 12 awaiting approval. The aim was to quickly boost public services with minimal impact on Nova Scotia's limited budgetary resources.
Nova Scotia's Ministry of Finance requests bids from qualified developers to provide one or several schools built to its specifications and on a turn-key basis in a designated district. The developer is required to provide a fully equipped school - desks, telephones, blackboards and computers.
Prospective qualified bidders compete on price, with the cost of the project converted into a 20-year lease with annual rent payments equal to 85% of the capitalised cost. During periods when the public school system is not using the facility, the developer can rent its space to other approved and compatible organisations and businesses.
Off-hours use: Such off-hours use could include renting the facility to for- and not-for-profit
educational organisations, such as trade schools and refresher educational programs, day care, community colleges and universities, civic groups, religious organisations, local governments, political groups, and similar entities for which classroom-, meeting-, and auditorium-type space is essential.
Organisations and businesses whose purpose and activities are not compatible with a building used primarily by children are prohibited from leasing space, and such prohibitions are defined clearly in the contract.
By using the building more intensively than would be the case if its occupancy were limited to public school functions, the developer/owner would obtain more revenues and earn more profit. These extra revenues are "passed on," in effect, to the public school system in the form of below-cost rent.
Because developers must compete actively with other providers of space for off-hours revenue, they have an incentive to ensure that construction is done to high-quality standards and design.
India’s education sector set for a new future Salaries consume 97% of central-government spending on education. The inability of public schools in providing elementary education, and the five decade focus on elitist higher education, has resulted in severe anomalies within India’s education output. There is a section of students graduating with the best skills globally, while a large swath of population is still out of school. The private sector is set to play a larger role in bridging this gap in schooling, skill sets, training, infrastructure and capacity. Our analysis shows that both market size and market growth are good enough to attract new initiatives.
In the next section, we look at the extant players in each category, their current scale and plans. Section 3 discusses the regulatory issues surrounding Indian education, with regulatory ambiguity on profit making and state by state differences in policy having been a hindrance to the expansion of education infrastructure in India. Appendix 1 provides a wide range of data on Indian education, demographics, government spending and estimates.
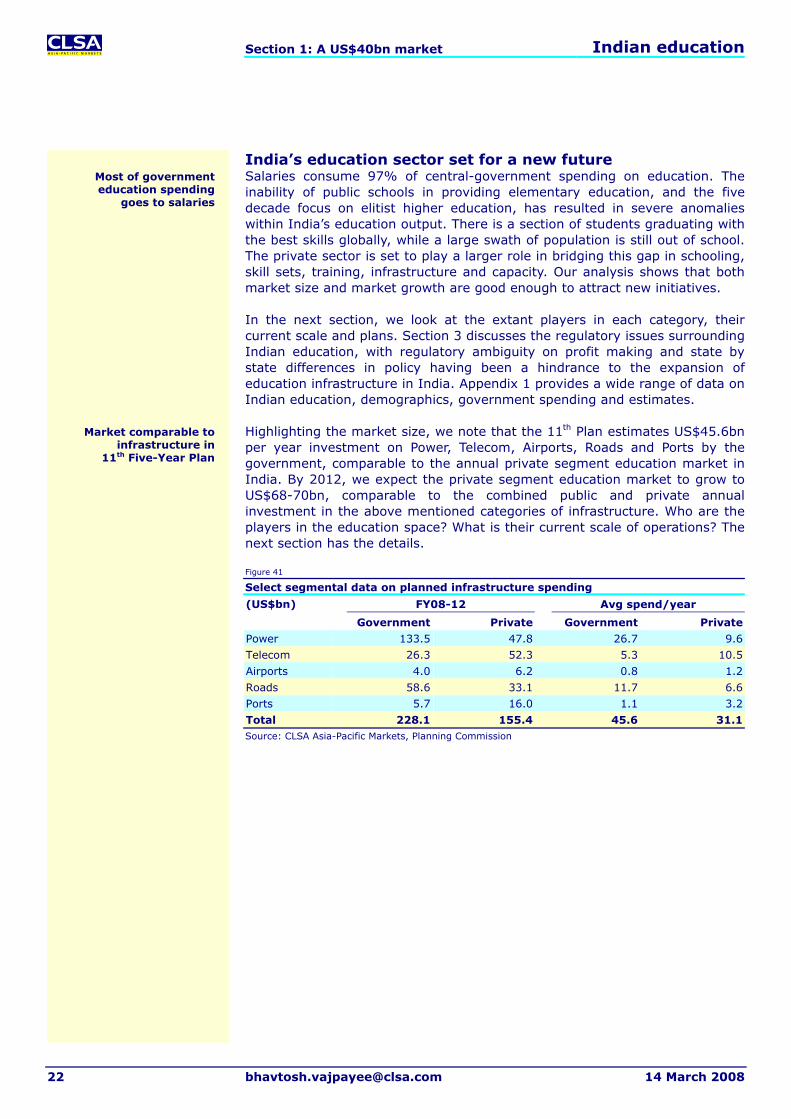
Highlighting the market size, we note that the 11th Plan estimates US$45.6bn per year investment on Power, Telecom, Airports, Roads and Ports by the government, comparable to the annual private segment education market in India. By 2012, we expect the private segment education market to grow to US$68-70bn, comparable to the combined public and private annual investment in the above mentioned categories of infrastructure. Who are the players in the education space? What is their current scale of operations? The next section has the details.
Figure 41
Select segmental data on planned infrastructure spending
FY08-12 Avg spend/year (US$bn)
Government Private Government Private
Power 133.5 47.8 26.7 9.6
Telecom 26.3 52.3 5.3 10.5
Airports 4.0 6.2 0.8 1.2
Roads 58.6 33.1 11.7 6.6
Ports 5.7 16.0 1.1 3.2
Total 228.1 155.4 45.6 31.1Source: CLSA Asia-Pacific Markets, Planning Commission
Most of government education spending
goes to salaries
Market comparable to infrastructure in
11th Five-Year Plan
Section 2: Diversity promises consolidation Indian education
Diversity promises consolidation Our study of business models in India’s education sector reveals a cluster of players in relatively small though fast-growing market segments. It further identifies nascent, organised efforts in the large K-12 market and its environs. Private-sector initiative remains diffused with few businesses having a national presence or even reasonable scale (eg >US$50m in revenue). This is dichotomous compared to the market opportunity and growth, in our view, and therefore we see changes ahead. The rise of organised private initiative in education is a structural investment theme over the next five years.
There are only a handful of publicly listed companies - Aptech, Core Projects, Educomp, Everonn and NIIT - and the publicly listed education and training space has a market capitalisation of US$2.6bn on FY08 revenue of about US$450m. This is too low given the market opportunity, in our view. Elsewhere, textbook and school-stationery players such as Navneet, Macmillan, Sundaram MultiPap and Camlin have a combined market capitalisation of US$400m.
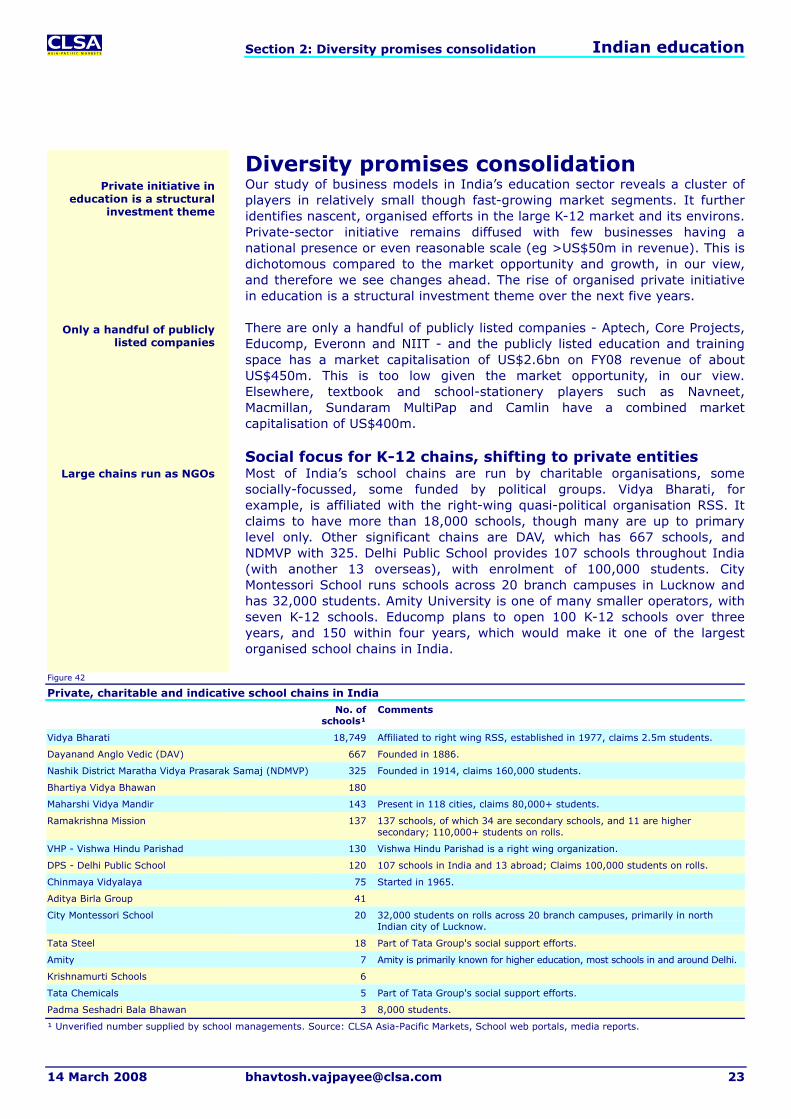
Social focus for K-12 chains, shifting to private entities Most of India’s school chains are run by charitable organisations, some socially-focussed, some funded by political groups. Vidya Bharati, for example, is affiliated with the right-wing quasi-political organisation RSS. It claims to have more than 18,000 schools, though many are up to primary level only. Other significant chains are DAV, which has 667 schools, and NDMVP with 325. Delhi Public School provides 107 schools throughout India (with another 13 overseas), with enrolment of 100,000 students. City Montessori School runs schools across 20 branch campuses in Lucknow and has 32,000 students. Amity University is one of many smaller operators, with seven K-12 schools. Educomp plans to open 100 K-12 schools over three years, and 150 within four years, which would make it one of the largest organised school chains in India.
Figure 42
Private, charitable and indicative school chains in India
No. of schools¹
Comments
Vidya Bharati 18,749 Affiliated to right wing RSS, established in 1977, claims 2.5m students.
Dayanand Anglo Vedic (DAV) 667 Founded in 1886.
Nashik District Maratha Vidya Prasarak Samaj (NDMVP) 325 Founded in 1914, claims 160,000 students.
International examples Global Education Management Systems Based in the UAE, Global Education Management Systems is one of the world’s largest “for-profit” providers of K-12 education. The group employs 5,800 education professionals and staff. It has an enrolment of nearly 70,000 students from 124 countries and manages 33 schools in the Middle East, seven in India, 13 in the UK and one in South Africa.
Nobel Learning Communities A US-based company with a national network of 158 private schools, it has preschools, elementary schools, middle schools and speciality high schools in 14 US jurisdictions serving 25,000 students. Nobel offers an array of supplementary educational services, including before- and after-school programmes, the Camp Zone summer programme, learning support programmes and science camps.
Educational books and CD-ROMs The market for textbooks – worth nearly US$2bn - is well developed, with Navneet and Macmillan being publicly listed as well. Market growth depends on increased enrolment numbers and greater intensity of use, which means lower “re-use” of books and more books per student. We estimate market growth at some 11%YoY. Educational CD-ROMs is an apparently highly-fragmented market, with many small players competing in what is a growing space.
Figure 43
Educational content - Select players Status History Approx. annual
revenue (Rsm)Business model
Navneet Publications Public Started in 1959. Started exporting stationery in 1993.
3,268 Educational & children’s books publishing. Paper and non-paper stationery products.
Macmillan India Public Incorporated in 1970 2,097 Publishes school & college books, reference books and atlases. Manages educational portals. Provides typesetting and originating services.
Labour India Publications Private Started in 1983 na Educational CDs, e-learning, educational magazines and books. Runs a chain of three schools branded Gurukulam schools.
Algorithms India Private Started in 2002 5 Education and Syllabus CDs. Animated rhymes and stories for younger children.
Technology School Private Started in 1999 5 Educational CDs. S Chand & Co. Private Started in 1930s na Educational books & CD-ROMs.
Source: CLSA Asia-Pacific Markets, Company disclosures
International examples Pearson Education Pearson Education, part of the Pearson group (LON:PSON), is a global leader in educational publishing and testing with revenue of ₤2.9bn and operating profit of ₤405m in FY06. It provides online learning and custom publishing for higher education, professional testing and publishing.
McGraw-Hill McGraw-Hill (NYSE:MHP) offers traditional educational materials, online learning and multimedia tools. It is active in e-books, online tutoring, customised websites and subscription services.
School stationery The educational stationery market has established players, some of them in the public domain - Navneet, Camlin and Sundaram Multipap. At 14% growth on a US$1.3bn base, this market is also dependent on increased spending intensity for its growth - greater usage of notebooks and stationery per child, consumption shift to higher-priced items. Overall, income growth and faster growth of higher-spending private schools should drive this market.
Usage intensity to drive growth
Content market shifting towards online options
Section 2: Diversity promises consolidation Indian education
Educational stationery –Select players Status History Approx. annual
revenue (Rsm)Business model
Camlin Public Started in 1931. Became a public company in 1987.
2,073 Manufacturer and exporter of stationery products.
Hindustan Pencils Private Started in 1958 na Manufacturer and exporter of stationery products. Markets under the Apsara and Natraj brands.
Navneet Publications Public Started in 1959. Started exporting stationery products in 1993.
3,268 Educational and children’s books publishing. Paper stationery and non-paper stationery products.
Sundaram Multi Pap Public Started in 1995. 824 Manufactures paper products for schools and office use. G.M.Pens International Private Started in 1986. na Manufactures and distributes a range of writing instruments
and accessories. Distributes the Reynolds brand in India. Rotomac Pens Private Started in 1992. na Manufactures and distributes a range of writing instruments
and accessories. Source: CLSA Asia-Pacific Markets, Company disclosures
Preschools - Five meaningful players Assuming preschool sizes of 150 children each, India should have nearly 15,000 facilities. The largest chain, KidZee, has 550 schools for 3.8% of the market. Shemrock Agency has 81 schools, mostly in north India, while Apple Kids has 60, mostly in the south. Educomp, which has so far focused on organic expansion, is considering acquiring a preschool chain, possibly in 2008-09. Other notable players are EuroKids and Kangaroo Kids.
Figure 45
Preschool - Select players Status History Current
networkApprox annual revenue (US$)
Business model
KidZee Part of the Zee Group
Started in 2003 550 na Runs Kidzcare, a day care facility and Kidzee High, a CBSE school. Launched KidZee -ICICI Bank cobranded card. Annual fees vary from Rs6,000-36,000.
EuroKids Private 1997: Dutch publishing company Egmont forms India JV to publish children’s books. JV launches a brand for preschools, EuroKids.
2000: Egmont buys out JV partner in India.
2004: Indian management buys out EuroKids from Egmont.
337
(Target of 1,000 preschools in
four years)
US$12.5m Charges 25-30% royalty fee on all education fees and upfront franchisee fee of Rs60,000 pa.
Average annual fees of Rs18,000-20,000.
Shemrock Agency Private Started in 1989. 81 na Primarily north India.
Apple Kids Private 60 na Primarily south India.
Kangaroo Kids Private Started in 1993. 27 preschools, total 57 centres
including day care and child
activity centres
na Also runs schools, toddlers clubs and imparts teacher training. Annual fees of Rs28,000-30,000. Charges royalty from franchisees.
Source: CLSA Asia-Pacific Markets
International examples ABC Learning Centres ABC Learning Centres is an Australian company and one of the largest providers of early education and care services to children of 6 months to 12 years. ABC operates 2,238 childcare centres. It entered the US market through the acquisition of Learning Care Group in January 2006, giving it 1,150
centres. ABC entered the UK with the acquisition of Busy Bees in December 2006, gaining a network of 47 centres. The company has 1,084 outlets in Australia and 104 in New Zealand. In FY07, ABC reported net sales of A$1.7bn, with net profit of A$143m.
Largest chain has less than 4% of market
Section 2: Diversity promises consolidation Indian education
Multimedia in schools New channels of selling “content” have emerged. Educomp’s pioneering Smart Class concept – the idea of multimedia driven education inside the classroom- has caught on with more than 500 schools having adopted the model. Edurite and IL&FS Education & Technology Services (IETS) also own scalable educational content. We expect the multimedia content channel to enjoy an 80-100% Cagr over the next few years. By March 2011, for example, Educomp should have 4,000 schools signed up for Smart Class, compared to 500 as of the latest quarter (December 2007).
Figure 46
Multimedia in schools Status History Approx. annual
revenue (Rsm)Business model
IL&FS Education & Technology Services
IL&FS Started in 1997 na Learning content & training modules for educational institutions and government.
Educomp Public Started in 1994 1,246 Uses proprietary content for computer aided learning within class rooms under its “Smart Class” product. Also licenses out content for ASEAN markets. Has its own books in schools managed under the Edu Manage umbrella.
NIIT Public Started in 1981 na 13-14 schools are using multimedia content under pilot programmes.
Everonn Public Started in 1997 Na Acquired multimedia content from Aban in 2007. Claims to own 6,000+ animations and a 26 people product development team
Edurite Owned by Tutorvista
Started in 2000. Acquired by Tutorvista in 2007.
na Multimedia e-learning content for school syllabus.
Source: CLSA Asia-Pacific Markets, Company disclosures
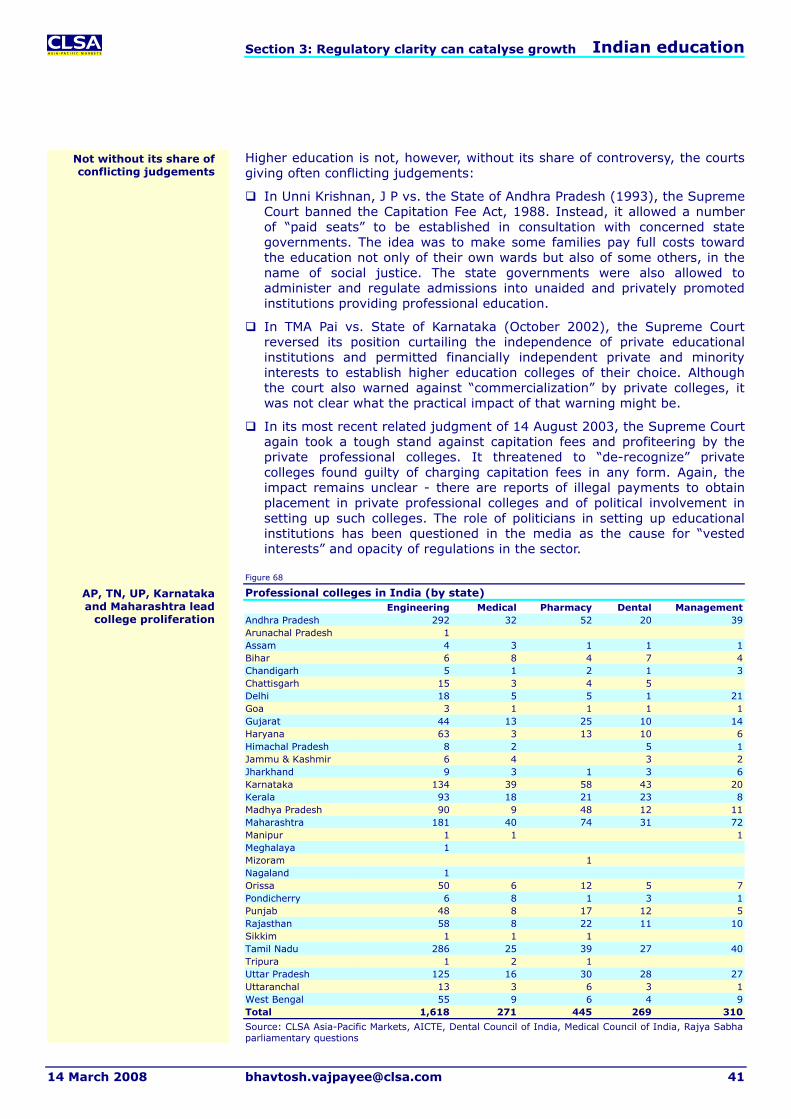
Professional colleges - Organisation opportunities India had, as of July 2007, 1,617 recognised engineering colleges, of which some 1,200 were private. The total number of colleges is expanding at a rate of about 100 per year, with 106 approved in FY08 out of 403 applications. Five states dominate the market - 63% of engineering colleges are concentrated in Andhra Pradesh, Tamil Nadu, Maharashtra, Karnataka and Uttar Pradesh. India has more than 300 private colleges offering MBAs and 140 private medical colleges, most operating as stand-alone institutions. A few chains have emerged, such as Amity University with 38 colleges and Manipal University with 20 colleges. The US$7bn market, with 16-17% Cagr, is expected to reach US$12bn by 2012. Hindrances to growth include the influx of substandard colleges, allegations of illegal fees leading to tighter regulatory controls, and allegations of political involvement.
Figure 47
Private professional colleges Status History Current network Business model
Amity Private na 38 colleges including engineering, business schools, law schools and biotechnology
Best diversified across all professional career courses. Has 2,500 faculty and 130 programmes to offer.
Manipal University Private Started in 1953 20 institutions, 13 streams of education, 180 courses
Enrolment of 15,000 students, alumni base of 120,000.
Indian Institute of Planning & Management
Private Started in 1973 9 colleges with 5000 students MBA schools and corporate training through management development programmes.
IBS ICFAI University Started in 1995 Presence in 19 cities MBA schools and corporate training.
Institute of technology & Management
ITM Trust Started in 1991 7 campuses across 4 cities MBA schools and corporate training.
Source: CLSA Asia-Pacific Markets, Company disclosures, Media reports
New channel of education
Expanding footprint for select college chains
Section 2: Diversity promises consolidation Indian education
International examples Apollo Group Apollo Group (Nasdaq:APOL), through its subsidiaries, provides higher education to working adults. It owns and operates the University of Phoenix, Western International University, Axia College (of the University of Phoenix), the College for Financial Planning, and the Institute for Professional Development. In FY07, Apollo reported revenues of US$2.7bn with net income of US$409m.
The University of Phoenix, Apollo’s flagship, is the largest private accredited university in the US offering undergraduate and graduate degrees. Programs are designed to accommodate the needs of working students and are available online. Apollo’s Western International has joint educational agreements in China and India.
Apollo’s Insight Schools operates an online high school aimed at a diverse body of students, including home-schooled children and working adults seeking to complete their high-school education. Apollo had total enrolment of 350,000 in 2007.
Anhanguera Educacional Participações Founded in 1994, Anhanguera Educational Participações (SAO:AEDU11)) is one of the leading private, for-profit post-secondary education companies in Brazil. It offers 48 degree programs, primarily at undergraduate level, covering business, law, engineering, health, and other applied social sciences. As of end-2006, it had 13 campuses with an average of 24,527 students, with six campuses having opened in 2007.
Rush to build more
Section 2: Diversity promises consolidation Indian education
Test preparation - Attractive, but regional A career focus that favours engineering, business, medicine and the civil services has led to the proliferation of privately-run test preparation centres. While the size of the market opportunity (US$1.7bn, with 20% Cagr) is substantial, it has become regionally segmented with very few national-level chains. Some consolidation has taken place in test prep for MBA examinations - Time, IMS and Career Launcher account for nearly two-thirds of the segment, with the rest of the market divided among regional players.
In some cases, test preps offer a wider gamut of courses across engineering, MBA, civil services and medical entrance examinations. For example, while FIITJEE is primarily an engineering test prep brand, Brilliant Tutorials, another test prep company, provides the entire range of coaching courses, from engineering to medicine, MBA and civil services. Among the broad based coaching institutes, Sachdeva College, with 85 centres and an annual intake of 100,000, claims to be the largest. Most players are private and accurate assessments of size or revenues remain difficult. We have used media reports and company disclosures to compile our indicative summary tables.
Figure 49
Engineering, medical, law test preparation - Select players Status History Current network Approx. annual
revenue (Rsm)Business model
Brilliant Tutorials Private Late 1970s 10 na No franchisees. Moving away from correspondence focused to classroom focused. Presence in test-prep across fields.
Vidyasagar Classes Private Founded in 1985 NA 200+ Coaches ~9,000 students annually. Bansal Classes Private Started in 1985 Three centres 200+ Fees range from Rs30,000-60,000 annually.
Focused on engineering test prep. ~8,000 students admitted every year.
Aakash Institute Private Started in 1988 30+ na Medical test prep is the main focus. Also does engineering test prep.
FIITJEE Private Started in 1992 35 1,200 Engineering test prep focus. Employs over 300 faculty.
Career Point Private Started in 1993 1 na Focussed on IIT-JEE coaching.
Source: CLSA Asia-Pacific Markets, Company disclosures, Media reports
Figure 50
MBA test preparation - Select players Status History Current network Approx. annual
revenue (Rsm)Business model
TIME Private Started in 1992. 150+ 1,000 (60% Cagr in past 5 years)
Franchisee model. Coaching for MBA/Engg/MCA entrance.
Career Launcher Private. Investment by Gaja Capital.
Started in 1995. 130+ 690 60% revenue from owned outlets. Major revenues from test prep. Planning chain of preschools, schools and business schools.
IMS Private Started in 1977. 80+ 800-900 Predominantly MBA test prep, though it is now diversifying to other segments including schools.
Professional Tutorials
Private Started in 1993. 60+ 200-250. Breaks 00 in FY08.
Operates through 40 franchisees.
Career Forum Private Started in 1989. 57 120
Source: CLSA Asia-Pacific Markets, Company disclosures, Media reports
Figure 51
Civil Services Test Prep: Profiles of select players Status History Current network Approx. annual
revenue (Rsm)Business model
Rau's Study Circle Private Started in 1953 2 (Delhi, Jaipur) na Charges Rs55,000, ~500 students per intake.
Chanakya IAS Academy
Private Started in 1993 1 (Delhi) na ~900 students per intake.
Vajiram & Ravi Private Started in 1976 1 (Delhi) na Charges ~Rs35,000 per student. Sriram IAS Private Started in 1985 1 (Delhi) na Average fees of Rs25,000.
Source: CLSA Asia-Pacific Markets, Company disclosures, Media reports
Regional segmentation has increased
Brilliant Tutorials and Sachdeva College provide
multiple prep streams
Section 2: Diversity promises consolidation Indian education
Board, Chartered Accountancy Test Prep: Profiles of select players Status History Current network Approx. annual
revenue (Rsm)Business model
Mahesh Tutorials Private Started in 1988. US$12m investment by Helix in 2007.
100+ 360m FY07. double in FY08.
Private tuitions for schools. Also present in test prep in Maharashtra.
Chate Group Private Started in 1989 89 (Maharashtra) na Private tuitions for schools. Also present in test prep in Maharashtra.
Sinhal Classes Private Started in 1981 10 (Mumbai) na Private tuitions for ICSE schools. Also present in test prep in Maharashtra.
SukhSagar Institute
Private Started in 1976 24 na Coaching for Commerce Stream. Specialised in CA/CS coaching.
KalraShukla Classes
Private Started in 1993 6 na Training for XI-XII and engg & medical entrances in Maharashtra.
Source: CLSA Asia-Pacific Markets, Company disclosures, Media reports
Figure 53
GRE/GMAT/TOEFL/SAT Test Prep: Profiles of select players Status History Current network Approx. annual
revenue (Rsm)Business model
TIME/CL/CF/IMS Private Jamboree Private Started in 1995 6 na Training for foreign examinations and
university applications. Edstar Wigan & Leigh
College Started in 1997 12 na Foreign examinations and university.
Dilip Oak's Academy Private 1 (Pune) na Foreign examinations and university. Madhavi Desai Consulting
Private Started in 1986 2 na Foreign examinations and university.
IMFS Global Consultants
Private Started in 1987 4 na Foreign examinations and university.
Source: CLSA Asia-Pacific Markets, Company disclosures, Media reports
International examples Digital Daesung This Korea-based firm is active in three main areas - a learning centre franchise under the brand names Genex School for primary students and Daesung N School for secondary students; e-learning services providing online education under the brand name Daesung Cyber Class; and provision of content for college entrance guidebooks and other educational information. Digital Daesung reported 2006 revenue of 19.9bn won, with net income of 2.4bn won.
Princeton Review Incorporated in March 2000, Princeton Review provides integrated, classroom-based print and online products and services.
Its test preparation division provides classroom-based and online courses and tutoring.
Its K-12 division provides a range of services to schools and school districts aimed at improving academic performance.
Services training - Emerging scale The US$1bn services training market is seeing new entrants. Frankfinn is the largest with FY07 revenues of Rs750m (US$19m) and 120 centres. Kingfisher Academy, which currently has one centre, plans to have 25 franchises by 2010. Avalon (owned by Aptech), has 35 centres and targets 50 by end-2008.
NIIT has also entered this space. Its IFBI initiative, in association with ICICI Bank, provides training for the financial services sector – more over 2,000 placements have reportedly taken place since the programme was launched in September 2006. The programme counts ICICI Bank, HDFC Bank, Yes Bank and ICICI Securities as partners. NIIT has also launched Imperia, a management education and training programme, with established business schools, including the Indian Institutes of Management.
Segment has grown fast in the last three years
New initiatives from NIIT
Section 2: Diversity promises consolidation Indian education
Within the US$500m English-language and communication-training market, Veta has a lead with 175 centres and annual revenue in excess of Rs800m (US$20m, our estimates). It has 175 centres currently, with a target of expansion to 500 centres by 2010, half of which will be owned and the remainder franchised. Other players include the Institute of Communication Management and Komark, as well as the British School of Language, which is mainly in northern India – it has 20 owned and franchised centres in Delhi and its environs, and in Punjab.
Services-sector growth is the key driver for this segment. Job opportunities in private-sector financial services, airlines, retail chains and hotels are expected to expand dramatically in coming years. We estimate organised retail will need 2.5m more people by 2010, 4m by 2012. Financial services will need 2m additional staff by 2012, and airlines will need another 50,000. Hotels are expected to generate demand for 200,000 additional jobs by 2012, of which 35,000 will come from the five-star hotel category. These metrics form the base of current investments in the space. Our estimates suggest that, by 2012, 1.2m people will be undergoing training in one of the service industries, and provision of English language training will double across India.
Figure 54
Vocational training - Select players
Status History Current network
Approx. annual revenue (Rsm)
Business model
Frankfinn Private Started in 1993 120 700-750 Aviation/hospitality training. 15,000-17,000 students.
Avalon Aptech Acquired by Aptech in 2006. 36 40-50 Aviation/hospitality training.
Air Hostess Academy
Private Started in 1997 40 na Aviation/hospitality training. 9,000-11,000 students.
IFBI NIIT Sep06. NIIT, ICICI Bank partnership 15 cities na Training and reskilling for banking jobs. Has placed 2,000.
Imperia NIIT Started in 2007 in alliances with IIMA, IIMC, IIMI, IIFT, and IMT
na na Management education for working professionals and corporates. Programmes range from 3-10 days to upto 12month courses.
ICA Private Started as software training institute but built focus on finance. Has trained 100,000 students.
300 (50 owned)
Claims 100% Cagr in last 4
years
Focus on training chartered accountants for finance department roles within corporates.
Kingfisher Training Academy
UB Group Started in 2007. 1. 25 centres by Dec08.
na 250 students.
Source: CLSA Asia-Pacific Markets, Company disclosures, Media reports
Figure 55
English language training – Select players
Status History Current network
Approx. annual revenue (Rsm)
Business model
Veta Private Started in 1981. Investment of US$10m by SAIF partners in 2007.
175. Plans 500 centres by 2010.
~800+ English language training. Retail & corporate. Has trained 2.1m students.
British School of Language
Private, owned by Satinka Lifestyle Services
Founded by 1975, main presence in New Delhi, franchisees in Punjab, near-Delhi.
20 na Claims to have trained 1.5m students.
English Centre Subsidiary of Institute of Communication Management
Started in 1995 ~30 ~100 English language training. Retail & corporate.
Komark Private Started in 1996 na na English language training. Retail & corporate.
Source: CLSA Asia-Pacific Markets, Company disclosures, Media reports
English-language training on sharp rise
Some 6-6.5m more jobs in services to 2012
Section 2: Diversity promises consolidation Indian education
International examples Navitas Navitas (ASX:NVT), formerly IBT Education, is a global education service provider of university programs, English language, workforce training and student recruitment. It was the first educational institution to be listed on the Australian Stock Exchange. Navitas has partnerships with 19 universities and is the largest provider of English language training in Australia. It has 27,000 students from more than 90 countries. Revenue for FY07 was A$282.7m, with net income of A$36.7m.
BPP Holdings BPP Holdings (LON:BPP) is a UK-based company engaged in professional training and academic
education, supporting individual clients in developing and managing their careers. It serves the financial, legal and business communities, as well as offering tutoring Grade 12 students sitting GSCE A-levels. Revenue for year ended December 2006 was £129.7m, with net income of £22.4m.
SmartPros US-based SmartPros provides training for the financial, legal and engineering professions, as well as the pharmaceutical, banking, securities, insurance and technology industries. It offers training in corporate governance, ethics and compliance for the general corporate market.
Child skill enhancement - Niche market, niche players Child skill enhancement is a new segment aimed at mostly urban households. India forms a ripe market, with education, and especially mathematics education, forming priority – and mental mathematics is accordingly the most attractive segment of the business. The urban and middle to upper middle class focus of the offering provides pricing power, and fee of Rs1,400 per “module” is normal. Both UC MAS and Aloha, two of the largest players in the space, started off in Malaysia in the early 1990s.
Figure 56
Child skill enhancement - Select players Status History Current
networkApprox. annual revenue (Rsm)
Business model
UC Mas Private; based out of Malaysia
Indian operations started in 1999. 900 na Franchise. Mental arithmetic & memory training programs for ages 4-20.
Aloha Private Started in 1993 in Malaysia. Indian subsidiary started in 2002.
Smart Brain Private Started in 2003 in India. 110 10 SIP Academy Private Started in 2002 in India. 450
Source: CLSA Asia-Pacific Markets, Company disclosures, Media reports
IT training - Consolidation done? The US$225m domestic IT training market has emerged from the post-2001 shakeout, with NIIT and Aptech the dominant players. Both have a large presence outside India - this has not been included in our market size calculations. For example, NIIT has about 450 centres in India, and 170 in China, with global coverage of nearly 750 (including Asean/Africa).
The growth of this market segment has remained stunted for various reasons. The post-2001 slowdown hit growth for several years, even as the rise of under-graduate courses in IT (BSc/MSc) within universities removed some of the attractiveness of a private IT course. The segment has revived since 2005 (as the supply crunch in the IT sector worsened), but remains threatened by graduate preference among the larger Indian IT vendors.
There are significant opportunities for IT training in the mid-segment of the industry. The larger vendors have invested large sums into training - Infosys spends US$140m a year. However, smaller vendors lack comparable training
IT training market growth stunted by competing
degree alternatives
Graduate courses in IT are the biggest threat
Mid-segment of IT industry lacks in-house training infrastructure
Urban, upper middle class phenomenon
Section 2: Diversity promises consolidation Indian education
infrastructure, be it real estate space or faculty, and IT training vendors could step in to fill the gap. Koenig, for example, organizes boot camps to attract trainees, and claims to charge 50% less than comparables for training costs in Europe. Broadly, IT-training vendors need to organize around on-going training needs of vendors, rather than hope to depend on placements alone, to generate future growth. There is money to be made in reskilling initiatives for example, and in training activities post recruitment of fresh engineers.
Figure 57
IT training - Select players Status History Current
network Revenue
(Rsm)Business model
NIIT Listed Started in 1981
450 1,484 Hardware/networking/software training. Runs core IT diploma programmes such as GNIIT as well as re-skilling programmes.
Aptech Listed 360 (plus 120 Arena centres)
230 Hardware/networking/software training. Arena Multimedia provides training in multimedia animation and is a pioneer in the field.
JetKing Infotrain
Listed Started in 1990
85+ 860 Hardware/networking training.
CMS Computers
Private Started in 1976
60 230 Hardware/networking/software training. Also provides IT solutions.
Koenig Private Started in 1993
Delhi NA Conducts boot camps across Delhi, Dehra Dun, Himalayas, and Goa – mixing IT training with fun in some cases. Claims 100 participants per boot camp and 50% lower costs compared to equivalent training providers in Europe.
SQL Star Listed Started in 1990
8 150 Hardware/networking/software training. Also provided IT solutions.
Source: CLSA Asia-Pacific Markets, Company disclosures, Media reports
International examples Learning Tree Learning Tree International (Nasdaq:LTRE) is a global provider of training and education to managers and IT professionals in business and government. In the fiscal year ended 28 September 2007, Learning Tree provided training to more than 11,500 organizations in 40 countries. In FY07, the company reported revenue of US$167.2m, with net income of US$17m.
Xpertise Xpertise (LON:XPG) is a UK-based training provider of information technology (IT), professional and soft skills training in the United Kingdom. It has a nationwide network of training centres located in London, Thames Valley, Leeds, Manchester, East Midlands, and Tyne and Wear. These centres have 42 equipped training rooms offering a capacity of 482 delegate places. Training is also carried out at customer locations. During the year ended December
31, 2006, the Company carried out approximately 58,000 training days for 16,000 delegates. Xpertise offers over 400 technical training courses and programmes for IT professionals and developers, Training Services, a division of Xpertise, offers clients a bespoke training for re-skilling projects.
Prosoft Learning Prosoft Learning focuses on job-specific education and training in computer programming, programming languages and operating systems, and has created a library of classroom and e-learning courses. Prosoft distributes its content worldwide through its ComputerPREP division and offers more than 1,000 courses, including three certification programmes. It counts more than 2,800 active customers in 60 countries, including the US, Canada, Germany, Australia, Japan, India and China.
E-learning, tutoring, teacher training – New initiatives New businesses are emerging within e-learning, tutoring and teacher training. E-learning has focused on augmenting classroom study with revision modules on the Internet (for K-12). Some portals such as Studyplaces.com and Pragati Infosoft are functioning as information exchanges for Indian education. 100percentile.com provides online examinations and analysis, while mathguru.com has solved questions on the CBSE Mathematics curriculum. The e-learning market in India is by our estimates worth about US$15m each for retail and corporate. We see e-learning as a suitable force multiplier in a package of educational products, while the segment as a whole will take some years to emerge in scale.
E-learning’s growth is linked to broadband penetration. By end-2007, India had about 3m broadband subscribers, and was adding 0.25m per quarter. At this rate, the Indian market would become scalable for e-learning only after at least three-to-five years, when the user base reaches 8-10m. As of now, e-learning models are likely to target the upper-most segment of India’s student population. Is this meaningful? Recall that:
90m children study in India’s private schools.
18m study in private schools with monthly fee above Rs1,250.
Assuming only those above Grade 6 use e-learning in any meaningful way, the broader market is about 9m students.
A 10% penetration into this segment would yield 900,000 e-learning subscribers. If each of these pay Rs15,000 annually for e-learning, the market can grow to US$300-350m at the upper end.
We are assuming the e-learning for the retail segment grows to less than half this number, or about US$150m, by 2012. This corresponds to a 5% penetration in the Grade 6 and above, or about 500,000 students.
This implies the largest company’s revenue in e-learning, five years out, would be limited to US$30-50m, depending on levels of consolidation. Clearly, e-learning is interesting, but very much a market of the future.
Online testing portals and study help
Broadband penetration critical
Section 2: Diversity promises consolidation Indian education
E-learning – Select players Status History Business model
Extramarks.com Cleaveglobal E-services Ltd
Launched in 2007 Online learning & revision for school students. Offers free registration. Plans to charge Rs1200 a year going ahead for specialised services.
Studyplaces.com Private Launched in 2007, VC funding by KPCB, Sherpalo ventures, Infoedge Ltd
Education Search. Online forums for information exchange.
Mathguru.com Educomp Launched in 2006 Charges Rs18,000 pa and provides online solutions to math textbook problems. More than 30,000 subscribers.
Pragati Infosoft (National Network of Education)
Private. Jalan Group. Launched in 2000 46 education portals. State portals aggregating information on various colleges/educational news/exams.
100percentile.com Private. Owned by Hundred Percentile Education
Launched in 2007. Tied up with Vidyamandir Classes
Online examination and performance analysis.
Excel Soft Technologies
Private Started in 2001 Develops e-learning systems and content. Estimated revenue of Rs500m.
Source: CLSA Asia-Pacific Markets, Company disclosures, Media reports
While tutoring is a US$5bn market, most of the organised initiative here is in the online tutoring space. There is no real chain providing bricks-and-mortar tuition across the high school and secondary levels. Most of the tutoring market is currently in the hands of teachers who run tuition classes specific to a city or locality. Within online tutoring, TutorVista started as an export market business model, but has recently refocused on the domestic market.
International examples K12 Inc Founded in 2000, K12 (NYSE:LRN) is a technology-based US education company providing proprietary curriculum and educational services to students in the K-12 segment. K12 uses online delivery through virtual public schools.
Noah Education Holdings Noah Education Holdings (NYSE:NED) is a provider of interactive education content in China. It develops
and markets interactive, multimedia learning materials to complement prescribed textbooks used in China's primary and secondary school curriculum.
It has 28,000 courseware titles corresponding to printed textbooks or textbook topics licensed from domestic and international educational publishers. In July 2007, it began offering after-school tutoring programs.
Figure 61
Online tutoring - Select players Status History Current
network Approx. annual revenue (Rsm)
Business model
Tutorvista Private. Pvt Equity funding by Sequoia Capital.
Launched in 2005 50,000+ registered students.
na Online tutoring for college and graduate level programs in over 30 subjects. Employs over 600 tutors. Charges US$99/month for unlimited tutoring.
Growing Stars Private Started in 2001 na Charges US$15-20/hr. ~60 tutors.
learninghour.com Educomp owns 76% stake
Started in 2006. In 2007 Educomp acquired 76% stake in ThreeBrix e-Services, the parent company of learninghour.com
~5,000 registered students.
na Online tutoring for school and test prep.
Studyloft.com Private na na na Online tutoring for school and test prep.
Source: CLSA Asia-Pacific Markets, Company disclosures, Media reports
Tutoring a much fragmented market
Section 2: Diversity promises consolidation Indian education
Teacher training is taking off, but scalability issues remain. Educomp claims to have more than 80% of the organised teacher-training business. Despite its small size, this revenue stream has been growing 35-40% YoY for Educomp, which supports our view that the current market of US$15m is too small to drive independently viable or scalable teacher training businesses. Also hindering growth is average teacher pay - Rs10,000-12,000 per month. This in turn implies that schools are willing to pay only Rs800-1,000 per teacher per month for training. Further, only about 10% of all teachers in India, or about 600,000, get training.
Figure 62
Teacher training - Select players Status History Current
network Approx annual revenue (Rsm)
Business model
Educomp Listed Teacher training in association with Intel Foundation, Azim Premji Foundation
>150 master trainers
220 (FY08) Will train 300,000 teachers in FY08.
Academy of Creative teaching
Private Started in 2004 1 centre in Bangalore
70% revenue from teacher
training
Consulting for schools, teacher training, workshops.
International Academy for Creative Teaching
Jain group of institutions
1 centre in Pune
Consulting for schools, teacher training.
The Teacher Foundation Managed by Shraddha Trust
Started in 2001 Offices in 3 cities.
Teacher training, consultancy.
Source: CLSA Asia-Pacific Markets, Company disclosures, Media reports
Private-equity money flowing into education There have been at least nine private-equity deals in education in the past 12 months, with total investment of more than US$90m, compared with three deals in the whole of 2006 and investment of US$17.5m. We expect capital-market involvement in education to increase as opportunity and growth are better understood. Some consolidation is expected, with the emergence of organised chains or national-level players, in test preparation, tutoring, private professional colleges and K-12 school management.
Figure 63
Private equity deals in education (Jan-06 to date)
Private Equity Firm Target Stake (%) Deal size (US$m) Period
WestBridge Capital Partners (Now Sequoia Capital) Brainvisa 5.5 Jan-06
Sequoia Capital Tutorvista 2.0 Jun-06
Lightspeed Venture Partners & Sequoia Capital Tutorvista 10.0 Dec'-6
Regulatory clarity can catalyse growth India’s education sector is one of the last theatres for the liberalisation debate. Planners and educationalists are confronted with the failure of public initiatives to achieve universal coverage - 142m children out of school – and a lingering historical “non-profit” approach that works against greater involvement of the private sector. Change is coming, albeit slowly. There is greater private participation in the provision of higher education, which should spread through all levels of education. There is an urgent need for greater clarity of regulation, which would reduce the need for current complicated structures of ownership and encourage greater public-private participation in this vital sector.
In India, higher education has several regulatory bodies, including AICTE (All India Council for Technical Education) and UGC (University Grants Commission), but there is no umbrella regulation of K-12 schools, nor a uniform law for schools. The charitable and missionary character of some of India’s earliest “private” schools, and the socialistic model of governance for much of the first few decades of independence, has led to a mindset that education cannot be “commercialised”. Education, which is covered by the “Concurrent List” of the Indian Constitution, is by implication regulated at both the central and state government levels. Regulation differs, sometimes radically, from state to state. For example, the state of Delhi frowns on “commercialisation” of education, while Maharashtra, Haryana and Gujarat permit “for profit” schools.
Figure 64
Key regulatory issues around Indian education
Segment Profit making allowed?
Regulatory body? Fee control Market Size (US$m)
Preschools Ambiguous; “reasonable surplus” not defined
No Ambiguous 985
K-12 Ambiguous; “reasonable surplus” not defined
No Ambiguous 19,655
Test Prep Yes na No 1,664
Private professional colleges Yes Yes Partly regulated 7,054
IT-training-Retail Yes na No 187
IT-Training-Corporate Yes na No 38
E-Learning - Retail Yes na No 14
E-Learning - Corporate Yes na No 13
Tutoring Yes na No 5,351
Services training Yes na No 1,365
Child skill enhancement Yes na No 777
Teacher training Yes na No 15
IT/BPO finishing school Yes na No 27
Educational books Yes Yes, books follow set curriculum from boards
No 2,965
Educational stationary Yes na No 1,326
Source: CLSA Asia-Pacific Markets, Discussions with professionals in the education industry
In our view, the next few years will see greater private and public-private initiatives in Indian education. While some degree of regulation will be put in place for private K-12 schools (to ensure quality and accountability of fund usage), recent policy statements suggest a trend towards greater private
Liberalisation debate set to heat up in education
No regulatory body for K-12 in India; no uniform
laws across states
Policy action on the anvil
Section 3: Regulatory clarity can catalyse growth Indian education
participation overall. The Union Government has formally come out in favour of greater foreign direct investment (FDI) in higher education, as can be seen in the Foreign Education Providers Regulation Bill. Leading politicians such as Congress President Sonia Gandhi have made statements in favour of private participation in education. The National Knowledge Commission (NKC), in its recommendations, says that it is necessary to stimulate private investment. The tide is finally turning in favour of liberalisation, but it will likely come last to the K-12 segment, which is beset by conflict among and between regulators and academics, and is the subject of litigation by various vested interests. Private players in K12 will likely remain locked in a two-tier structure, where profit is derived not from the school itself but through its consumption of hardware, intellectual property and services.
Indian education regulations - History of ambiguity The institutions should be permitted to make reasonable profits after providing for investment and expenditure. However, capitation fee and profiteering (is) forbidden.
This is an example of the often ambiguous language used in key judicial judgements involving private education institutions in India. Some of the key legal cases involve other issues - acquisition of land by private schools/institutions at concessional terms from the government without fulfilling the promise of enrolling a specified percentage of students from disadvantaged sections of society. In Maharashtra state, where “for-profit” private schools are permitted, schools are still structured at least on paper as non-profit trusts in order to get recognition from such bodies as the Central Board for Secondary Education.
K-12 regulation in India – Unanswered questions With no regulatory body in place for the K-12 segment, several aspects of running a private school remain unanswered or ambiguous:
Can a school make a “profit” from its operations? What does “surplus” mean? How is the quantum of “reasonable surplus” defined?
Is a private school allowed to set its own fee structure?
What regulations govern the transfer of surplus funds of a school for other activities, including their use to set up other schools?
Can a school charge a “development fee” on top of the tuition fee? If so, how large a fee can be charged?
What are bodies such as the CBSE looking for in private-school accreditation?
Should the acquisition of land at concessional rates from the government be linked to enrolment of students from for poorer sections of society?
There is little clarity in regulation of India’s education system, least of all the level of acceptance of schools as profit-making ventures. This is, however, part of a wider global debate on the role of the private sector in the provision of K-12 education, which is generally considered to be a responsibility of the state. Figure 65 shows how the US, Singapore, Australia and Brazil allow “for profit” schools, but the UK and Korea do not. And while the UK has allowed profit-making in higher education institutes since 2004, Korea has yet to relax its restrictions. Profit would appear to be more philosophically acceptable, or
Several court judgements have left key questions
unanswered
K-12 lacks a regulator, and regulation
US, Singapore, Australia, Brazil are more liberal in
K-12 regulations
Section 3: Regulatory clarity can catalyse growth Indian education
at least more pervasive, in the provision of higher education. Debate continues in the sensitive K-12 segment. Appendix 3 of this report looks at regulations around K-12 and higher education for the US, the UK, Korea, Brazil and Singapore, and identifies a common trend towards greater private involvement in education, either directly or via public-private partnerships.
Figure 65
Regulation in other countries
K-12 Schools Higher education
US No restrictions on private schools on fees or in making profits.
Highly developed for-profit higher education market with large listed players like Apollo Group, Devry etc
UK Private schools are run as charities and get certain tax-exemptions. However there is no cap on the fees charged at these schools.
Higher Education Act of 2004 allows for-profit degree-granting institutes.
Singapore Private schools are allowed to make profits. Government does not interfere in matters of fees and profitability.
For-profit private universities allowed. Foreign universities have also been allowed to set-up in Singapore.
Korea Private School Act allows only qualified non-profit foundations with certain amount of assets to run schools.
Private universities are strictly restricted from making profits. They also have limited autonomy in selecting students.
Australia No formal law against profit-making schools.
For-profit private universities/colleges allowed.
Brazil No restrictions on private schools on fees or in making profits.
No restrictions on profit-making in higher education. 2 big publicly-traded players in the space, Estacio Participacoes and Anhanguera Educacional Part.
Source: CLSA Asia-Pacific Markets, Media reports, Departments of Education of respective countries
Delhi regulations and the Modern School judgment In 1997, an association representing parents went to the Delhi High Court seeking a rollback of fee increases imposed by various private schools in New Delhi. Private schools were also accused of violating the terms of an agreement by the Delhi Development Authority, which provided land at concessional rates with the covenant of enrolling a certain share of students from poorer sections of society. Legal argument turned on the Delhi School Education Act, arguably the most restrictive K-12 regulation of any state in India. The Supreme Court of India handed down its judgment in 2004:
The court upheld the terms of the land allotment and private schools were ordered to follow the conditions on enrolments (ie some share of students from weaker sections of society) when the land was allocated at reduced rates.
Schools were prohibited from raising tuition fees without the prior authorisation of the Directorate of Education, Delhi Administration.
The court ordered that 25% of students would be enrolled from weaker sections of society on scholarships.
The court permitted the schools to charge a development fee of up to 15% of the annual tuition fee as a supplement to school funds and for the upgrade and maintenance of school infrastructure.
The judgement was ambiguous on the question of acceptable profit margins for private schools. The court recognised the right to generate a “reasonable surplus”, but condemned the “commercialization” of education.
Some legal cases around schools have involved
covenant issues
Section 3: Regulatory clarity can catalyse growth Indian education
Affiliation to boards demands the creation of a trust Under prevailing regulations, boards of education accredit only non-profit trusts. As a result, profit-making schools in India need to be structured in such a way as to present the face of a trust, while allocating profit to a range of suppliers of goods and services to the trust, such as land agents, school management and equipment. Educomp’s K-12 business uses subsidiary Edu Infra to provide land and Edu Manage to supply content and services to school trusts, which on paper run the schools. The school trust makes no profit, though the suppliers do, but get no tax break on the profits earned.
Figure 67
Typical management structure for a school
School trust(non-profit)
RealtyProfit from lease of land
SuppliersProfit from supplying equipment and
hardware
Boards of educationCBSE, ICSE, State
Tuition feesDevelopment fees
Intellectual propertyMultimedia content within classrooms
Sourcing teachers and staffConducting and documenting parent-
teacher meetingsConducting educational tours
Profit at Educomp
Regulatory ambiguity on "resonable surplus" drives
two-tier structure of trust/management
Source: CLSA Asia-Pacific Markets, discussions with professionals running schools
Use of surplus funds for expansion In the case of Modern School, the Supreme Court made clear that surplus funds generated by a school could only be used by that school and could not be transferred to another school within the same trust. As a consequence, each individual private school seeking to make profit is structured as a separate trust.
Regulation in higher education – more benign Profit is permitted in higher education, though fee structures are regulated. This has promoted the growth of privately-run engineering, MBA and medical colleges without the regulatory confusion that pervades the K-12 space. Tuition and other fees for a professional college are determined by a state-level committee or standing committee of the University Grants Commission. Fees are reviewed and fixed at least every three years, with half the places designated “free” as opposed to “payment”. A development fee fixed every three years can be charged to cover upgrade and maintenance costs.
India’s boards of education demand non-
profit trusts for affiliation
Trusts have restrictions on transfer of surplus
Though regulated, higher education space has had relatively greater clarity
Section 3: Regulatory clarity can catalyse growth Indian education
Higher education is not, however, without its share of controversy, the courts giving often conflicting judgements:
In Unni Krishnan, J P vs. the State of Andhra Pradesh (1993), the Supreme Court banned the Capitation Fee Act, 1988. Instead, it allowed a number of “paid seats” to be established in consultation with concerned state governments. The idea was to make some families pay full costs toward the education not only of their own wards but also of some others, in the name of social justice. The state governments were also allowed to administer and regulate admissions into unaided and privately promoted institutions providing professional education.
In TMA Pai vs. State of Karnataka (October 2002), the Supreme Court reversed its position curtailing the independence of private educational institutions and permitted financially independent private and minority interests to establish higher education colleges of their choice. Although the court also warned against “commercialization” by private colleges, it was not clear what the practical impact of that warning might be.
In its most recent related judgment of 14 August 2003, the Supreme Court again took a tough stand against capitation fees and profiteering by the private professional colleges. It threatened to “de-recognize” private colleges found guilty of charging capitation fees in any form. Again, the impact remains unclear - there are reports of illegal payments to obtain placement in private professional colleges and of political involvement in setting up such colleges. The role of politicians in setting up educational institutions has been questioned in the media as the cause for “vested interests” and opacity of regulations in the sector.
As education is a joint responsibility of the Central and State governments, some states have passed separate legislations on private higher education. Chattisgarh passed a Private Universities Act in October 2002, and Uttaranchal accepted four private universities in 2002–03. There has been a proliferation of private medical and engineering colleges in the southern and western states of Andhra Pradesh, Tamil Nadu, Karnataka, Kerala, and Maharashtra.
In 2001, Andhra Pradesh had 95 private self-financing engineering colleges and 303 medical colleges, compared with 11 public engineering colleges and 25 public medical colleges. In many states, there have been allegations that private universities lack adequate infrastructure and appropriate faculty, and some established colleges have raised fees sharply in conjunction with professional courses or foreign collaborations. Subsequent judicial intervention has failed to clarify matters.
Regulation for entry of foreign educational institutions Entry of foreign educational institutions to India is covered by the Foreign Educational Institutions (Regulation of Entry and Operation, Maintenance of Quality and Prevention of Commercialization) Bill of 2007, which has stalled in parliament due to political opposition. Key proposals in the bill include:
Foreign institutions be granted university status.
Eligibility for exemption from “national treatment” on enrolments, admissions and fees.
Restriction of surplus revenue usage within India.
Investment of at least 51% of total capital required for establishing an institution in India.
Some 100,000 of India’s students leave each year to study abroad, at a cumulative cost of US$4bn. China has seen a surge in foreign educational institutions partnering with local institutions; its policies and objectives very much in line with India’s views that foreign universities should not eye India as a market, but should invest adequately to set up their own campuses.
Future of regulation in Indian education Our model for K-12 (see Appendix 1) shows that any school charging more than Rs1,000 a month and with a one-time admission fee of Rs25,000 has a reasonable chance of making a profit, or “surplus”. We believe more than 20,000 private schools in India are generating surpluses, and profit-making private schools are expanding faster than ever before. Recent policy statements from the government indicate that substantial education reform lies ahead, and increased fund infusion from the private sector is likely to be a key element of the new philosophy, albeit with some regulations. However, much of the new thinking has been focused on higher education, with only some mentions of private participation in K-12 education coming in within the National Knowledge Commission Report. However, a more progressive approach is beginning to be articulated, suggesting at a multiyear process of educational reform in India. The National Knowledge Commission Report, released in November 2007, was most revealing:
Key recommendations for school education include “recognise and encourage the role of private providers”.
“In three professions – engineering, medicine and management – there has been a de facto privatization of education so that two-thirds to three-fourths of the seats are in private institutions. But private investment in university education, where more than 70 per cent of our students study, is almost negligible. It is essential to stimulate private investment in higher
States enacting their own laws now
Five states comprise 63% of India’s engineering
colleges
At least 20,000 private schools in India should be
making a surplus
Section 3: Regulatory clarity can catalyse growth Indian education
education as a means of extending educational opportunities. We must recognize that, even with the best will in the world, government financing cannot be enough to support the massive expansion in opportunities for higher education on a scale that is now essential.”
“Advances in ICT have had a profound impact on all areas of human pursuit including education. As a result, the concept of a classroom as learning environment with chalk, blackboard, duster, textbook, homework, exams, grades etc. will change as new methods of learning evolve. We believe we have a historic opportunity to capitalize on some of these trends and technologies to benefit teachers and students.”
“We need to create various collaborative models, dispelling mutual suspicions. Public-private-partnerships, academia- industry partnerships, academia-research laboratories, Public-NGOs, Public-community etc. will need to be the models rather than working in separate compartments.”
In the medium term, we expect current models for business to continue. K-12 schools will continue to be structured as trusts, and money will mostly be made in providing services to this trust, a useful - and legally more defensible - way to get around the profit conundrum. Higher education is likely to open up faster for both greater private participation as well as foreign direct investment. Vocational training services and other aspects of education remain a “normal” business activity with no philosophical or political questions around the profit motive.
Over time, we expect greater regulation of privately-run K-12 schools, a step that could eventually lead to clearer regulations. Given the wide range of tuition fee being charged by private K-12 schools, it is unlikely that the government will seek to even out fee structures, but fee inflation on an annual basis could come under the gamut of a regulator. For example, a law preventing more than an inflationary fee hike per year or the need for permissions if this has to be done, can be expected.
Among the risks, political debate, litigations by vested interests and media criticism of the opacity of educational laws and regulations must be expected. Socialistic voices are likely to stay loud, countered in equal measure by protests from entrepreneurs who claim to be solving India’s schooling problems through private initiative.
Media reports - Expect more debate ahead Protests against a PPP plan (April 2007) The proposal to set up the State Institute of Educational Management and Training (SIEMAT) in Karnataka in partnership with Azim Premji Foundation has been opposed by several educationalists and intellectuals, including Jnanpith Award winner U.R. Ananthamurthy and the former Planning Commission member L.C. Jain.
They termed it a "dangerous" sign of the Government relinquishing the core responsibility of policy framing in the area of education in the name of public-private partnership.
Mr Jain told presspersons that education was a constitutional commitment involving every child's future, and this obligation of the State could not be minimised. The Government should place all facts on what necessitated formation of this body in private partnership before the people and reconsider the idea before going any further, he said. Giving details about implications of this partnership, advocate B.T. Venkatesh said the private partner would not only have a say in policy making, but also have the right to seek an "action taken" report from the Government on implementation.
Status quo to continue for sometime more
Creation of a K-12 regulator- positive for
long term clarity
Noisy debate likely to continue
Section 3: Regulatory clarity can catalyse growth Indian education
Strong reactions to ‘modern school’ judgment Comments from a Senior Counsel of the Supreme Court (2004) Comments a senior counsel of the Supreme Court who spoke to Education World on condition of anonymity: "Though Chief Justice Khare who retired in April was a disciplinarian who restored the reputation of the judiciary, he had too many obsolete socialist hang-ups. Thus in the Islamic Academy Case last year, he led a five-judge bench of the court in diluting the judgement of the 11-bench judgement of the Supreme Court in the historic TMA Pai Foundation Case of 2002 which restored the right of self administration under Articles 30 and 19(i)(g) of the Constitution to unaided colleges of professional education. Now the majority judgement of a three-judge bench presided over by Khare in the Modern School Case deprives school administrations the right to self governance and administration. Instead of passing strictures against the Central and state governments for perpetuating abysmal standards of teaching in government schools, the Supreme Court has approved inspector raj in well-managed private schools. Of course the Supreme Court judgement was quite right in upholding the Delhi high court’s orders in the Social Jurist Case which was a contractual matter. But even in this case the schools should have been given an option to pay the current value of the land allotted to them in lieu of admitting poor children on freeships (scholarships)."
Regrettably the court seems unaware of the ground reality that government officials and functionaries steeped in a time-hallowed tradition of venality are unlikely to provide the fair and just regulation of private schools mandated by the apex court.
Comments from school managements Comments Mohina Dhar principal of the four-star CBSE-affiliated Amity International School, Delhi which has 3,000 students on its muster roll and runs the parallel Amitasha afternoon school for poor and under-privileged children: "Instead of levelling down the academic standards of private schools by foisting poor children upon them, why doesn’t government raise standards of teaching and improve the infrastructures of MCD (Municipal Corporation of Delhi) and government schools? It could invite corporate funding into them or do whatever. By trying to raise the poor, isn’t the government levelling down standards in private schools? Moreover how fair is this to the parents of unaided school children who are paying high fees so that their children can study in better environments?"
Also in the matter of regulating tuition fees - a power which has been conferred by the Supreme Court upon the director of education of state governments - unsurprisingly the dominant opinion in unaided schools is that institutional managements together with parents’ associations are the best judges of what are appropriate tuition fees. "Most of our parents appreciate that paying for quality education is an investment, not an expense.
Therefore they understand that tuition fees have to be raised periodically if we are to provide contemporary education and maintain our infrastructure. This year we have raised our fees by 10 percent which is necessary because our entire curriculum is IT based and each one of our 53 classrooms has at least one computer. This is a matter for parents and teachers to resolve. It’s too much to expect of government servants," says R. Sandhu principal of Delhi’s CBSE-affiliated Khaitan Public School (est. 1995) which has an aggregate enrolment of 1,700 students instructed by 50 faculty.
Comments from litigants There’s a similar lack of sympathy for the managements of elite private schools within the parents’ community in the national capital. "It’s quite ridiculous how private schools arbitrarily jack up their tuition fees year after year, throwing all norms of social justice to the winds. The managements of these schools are a mafia which has hapless parents and students at its mercy. They generate black money, don’t pay income tax and extract donations, all of which are illegal, anti-social practices," adds Vijender Gupta, president of the Abhivavak Mahasangh, a Delhi-based parents’ organisation convened in 1997.
But even as Delhi’s middle class parental community is celebrating the Supreme Court’s judgement in the Modern School Case, there’s a possibility that their victory may be pyrrhic. Because while adjudicating this case, the court also upheld the Delhi high court’s order of January 20 directing the director of education to ensure that some 1,200 unaided schools which were allotted land at concessional prices fulfil their obligation to provide scholarships to poor children up to 25% of the schools’ enrolment. Most parents are not only opposed to this directive of the courts, but may well have to pay higher fees to cross-subsidise the education of poor students admitted into their children’s schools.
Section 4: Upside for the well positioned Indian education
Upside for the well positioned Select education stocks globally have generated disproportionate returns, while many others have performed ordinarily. Figure 69 lists the performance of those with market capitalisation well above US$1bn. Interestingly, over fairly long periods of time, the winners have not changed materially. Raffles Education in Singapore, Mega Study in Korea, Devry in the US and, more recently, Educomp in India have comfortably trumped peers over the years. As Figure 70 demonstrates for Brazil, stocks in the same market have also diverged materially in performance. Dissecting opportunities in Indian education, and the competitive situation in each segment, we see a similar pattern. We rate Educomp and Aptech BUYs; NIIT an Outperform, and Everonn Underperform.
Figure 69
Stock returns on select education companies
Mkt cap(US$m)
3M 6M 1Y 2Y 3Y 4Y
ABC Learning Centres 647 (72.6) (78.6) (78.1) (81.5) (73.8) (64.5)Anhanguera Educacional Part 1,641 (21.4) (8.3) na na na naApollo Grp 8,962 (30.2) (9.1) 14.0 2.9 (29.6) (33.2)Benesse 4,216 (8.7) (1.9) (8.9) 3.8 13.4 44.1 Career Education 1,264 (50.6) (51.8) (53.0) (59.5) (58.4) (70.6)Devry Inc 2,898 (29.9) 16.9 49.0 67.7 124.4 35.8 Educomp 1,440 (15.7) 17.8 267.4 695.9 na naITT Educational Services 2,000 (51.1) (53.8) (36.6) (17.7) 3.9 65.5 Mega Study 2,253 23.2 46.8 148.2 484.2 1000.3 naNew Oriental 2,008 (30.0) 5.5 38.0 na na naRaffles Education 1,992 (18.5) 16.3 5.2 146.5 600.6 861.8 Strayer Edu 2,150 (17.8) (8.1) 27.2 53.0 41.1 36.4
Figure 70
Brazil’s education stocks versus Bovespa
50
65
80
95
110
125
140
Jul 07 Aug 07 Sep 07 Oct 07 Nov 07 Dec 07 Jan 08 Feb 08
Kroton Anhanguera Bovespa
(Indexed to 20 Jul'07 prices)
Source: CLSA Asia-Pacific Markets
We rate Educomp a BUY, for its strong positioning in multiple high growth businesses. Educomp has beachheads into multimedia content into classrooms, K-12 school management, preschools, teacher training, e-learning channels and also the public school ICT business - all coming together to deliver 90%+ EPS Cagr over the next three years. Unlike peers, Educomp’s businesses are gravitating faster towards the more scalable segments of the education market. We note the forward integration into
Well-positioned stocks have generated
disproportionate returns
Divergence in Brazil
Educomp - BUY
Section 4: Upside for the well positioned Indian education
private professional colleges, though not announced, should be the logical next step for Educomp’s strategy. Educomp has also demonstrated strong execution, with profits coming 60-65% ahead of our initial assumptions for both FY07 and FY08. More importantly, Educomp has an early start in several segments, most notably Smart Class, its private-school multimedia content business, and this lead of about two years has been strengthened further through accelerating school wins.
We rate Everonn an Underperform as we believe valuations are fully discounting its potential within the relatively less attractive public-sector ICT business and the distance-education programme. Everonn is trading at a premium to Educomp on PE multiples (7% premium on FY09, 36% premium on FY10 PEx), even though we see a number of important business differences. Everonn’s 65% EPS Cagr over FY08-10 is lower than Educomp (105%), and Everonn is also disproportionately exposed to the public school ICT business – a segment that, despite its strong growth, is lower in margins, returns and higher in payment cycle. ICT also has strong competition from Educomp and NIIT, and for all three players, we do not see ICT as a key differentiator of business. Everonn’s distance education segment has taken off nicely, but the scalability of this is yet unproven. In our view, Everonn may need to expand its portfolio into new segments of the market to back up current valuations.
NIIT and Aptech have a common pedigree in IT training, but business direction has now diverged substantially. We rate Aptech a BUY and NIIT an Outperform, primarily because we see NIIT’s portfolio tilted away from the domestic Indian opportunity. By acquiring Element K, a US-based corporate-training business, NIIT has taken a 56% revenue and 27% Ebitda exposure to the corporate-training market, currently characterised by single-digit growth and margins. The business, in our view, is also vulnerable to shifts in human-resource budgets, where training spend originates, especially in a challenging macroeconomic environment. NIIT has ramped up nicely in services training - IFBI is ramping up well, other initiatives also in play - and its IT training brand remains strong, but even with assumptions of near-perfect execution, we see financials trailing peers on many counts. In NIIT’s favour are its inexpensive valuations (17x Mar09), visible success in new vocational-training initiatives, and at least an improving trend of currently inferior financials.
Aptech, by contrast to NIIT, has an India-and-China focused portfolio. It is the market leader in IT training in China, with some 32% market share (NIIT is number three with 8% market share). While NIIT has a 56% revenue exposure to the international corporate training business, Aptech’s exposure is less than 6% and heading down. Aptech has also scaled up in new retail initiatives. It has pioneered multimedia training via its Arena Multimedia brand, while Avalon, its aviation services training venture, has scaled up to 35 centres and will have 50 by December 2008. Aptech and NIIT trade at similar PE multiples (17x Dec08/Mar09), but Aptech’s financials look better with higher revenue Cagr, better return ratios, lower capex intensity, and stronger EPS Cagr (50%+, compared with 43% for NIIT). We rate Aptech a BUY.
Core Projects has some unique public-private partnership structures up-coming, and its joint venture with IETS (IL&FS Education and Technology Services) provides the necessary grounding in financing and content, but the model is still unproven in India. We have no rating yet on Core Projects,
Everonn - U-PF
NIIT - O-PF
Aptech - BUY
Core Projects - No rec
Section 4: Upside for the well positioned Indian education
which is an export-focused technology business with school/college/university specific software systems - library management, online testing software and the like. Core is shifting focus to India and could be bidding to takeover, upgrade and run public schools for specified periods. Greater clarity on its rollouts under public-private partnerships could drive upside to the stock.
Diverging directions visible in portfolios of listed players Educomp: K-12 and its adjacent markets are a clear differentiator. In our view, no peer has a comparable strategy yet. Educomp’s approach of consolidating all suppliers to schools helps it earn profits on annuity revenue streams of school tuition and admission fee. While market coverage maps do not reveal it fully, Educomp also has an 18-24 month lead in multimedia within schools, its K-12 programme. Educomp has more than 500 schools here, NIIT has pilots in 12-15 schools only, and Everonn is working on it. Interestingly, Educomp now has its own books being used in the few schools it manages.
Everonn: Services training through ViTELS is the key differentiator. We are intrigued with the somewhat-delayed ramp-up - class coverage has stayed at c. 325 for quite some time now.
NIIT & Aptech: Both track nearly identical markets, but NIIT’s portfolio is skewed with its US-centric corporate training business, while Aptech’s is not. Within the India opportunity, Aptech seems more clearly focused.
Core Projects: Largely focused on public private partnerships, Core is a model that is currently evolving.
Future potential: Higher education, tutoring for Educomp; K-12 schools for Everonn, and greater multimedia in schools for NIIT and Everonn.
Figure 71
Current and potential market presence (scaled)
Segment Mkt size(US$m)
Cagr (%)
EDSL Everonn NIIT Aptech Core
K-12 19,655 13
Private college (Engg, Medical, MBA) 7,054 17
Tutoring (Grades 5-10) 5,351 16
Textbooks 1,949 11
Test prep 1,664 21
Vocational training 1,365 22
Educational stationery 1,326 14
Preschool 985 35
Child skill enhancement 777 31
IT-training (Retail) 187 21
Educational CD-ROMs 117 31
IT Training (public schools) 90 67
IT-Training (corporate) 38 37
Multimedia 30 76
IT/BPO finishing school 27 68
Teacher training 15 68
E-Learning - Retail 14 68
E-Learning - Corporate 13 68
Public private partnerships ? ?
Notes: Existing presence, New areas where scale up is possible/announced. Source: CLSA Asia-Pacific Markets
Current and potential segments in focus
Section 4: Upside for the well positioned Indian education
Educomp – BUY Strongest positioning in larger market segments (K-12 and adjacent markets); as well as emerging high growth spaces such as IT in public schools, and multimedia in private schools. Potential for expansion in tutoring and private professional colleges.
Everonn – Underperform Two key businesses – services training, with a distance education channel choice, and IT in public schools. Scale and presence in private K-12 opportunity missing. Beginnings made in school management, and have acquired content from Aban.
0
10
20
30
40
50
60
70
80
90
1 10 100 1,000 10,000 100,000Market size (US$m)
(% Cagr, next 5 years)
0
10
20
30
40
50
60
70
80
90
1 10 100 1,000 10,000 100,000
Market size (US$m)
(% Cagr, next 5 years)
Figure 74
Figure 75
NIIT – Outperform Nice ramp in services training, IT training business has also revived. Potential for greater initiative in multimedia in schools segment, but corporate training skews the portfolio away from India. NIIT looks a much better portfolio without Element K.
Aptech – BUY Map reveals roots similar to NIIT, but Aptech is still more “Chindia” focused. Aptech has concentrated on a few initiatives, where it has consistently achieved scale (China IT training, Arena Multimedia, Avalon).
0
10
20
30
40
50
60
70
80
90
1 10 100 1,000 10,000 100,000
Market size (US$m)
(% Cagr, next 5 years)
0
10
20
30
40
50
60
70
80
90
1 10 100 1,000 10,000 100,000
Market size (US$m)
(% Cagr, next 5 years)
Source: CLSA Asia-Pacific Markets, Discussions with companies
Financials reveal differences Educomp tops revenue and earnings Cagr by a wide margin. Educomp makes the highest operating margin, and has the highest (and improving) return on equity. NIIT makes the lowest operating margins (though improving) and has the lowest EPS Cagr forecast, despite our assumptions on strong growth and profitability improvements ahead. Everonn, despite impressive EPS Cagr, is the most expensive stock in education today, and the valuation premium given its current services portfolio, seems unjustified, in our view.
Aptech has sharply improving return on invested capital, and return on equity similar to Educomp, and well ahead of Everonn and NIIT. Notably, Aptech has EPS Cagr slightly lower than Everonn, but trades at 17x 09 PEx, compared with 46x for Everonn. Stripping out earnings inflow from its 25% stake in NIIT Technologies, we find NIIT’s education business trading at 25x FY09.
Educomp tops most financial metrics
Aptech looks good on several parameters
Section 4: Upside for the well positioned Indian education
Priced on 7 March 2008 India Sensex @ 15,975.5 12M hi/lo Rs448/139 12M price target Rs305 ±% potential +52% Target set on 9 March 2008 Shares in issue 43.8m Free float (est.) 68.0% Market cap US$217m 3M average daily volume Rs103.2m (US$2.6m) Major shareholders Promoters & Promoter Group 32.0%
Stock performance (%) 1M 3M 12M
Absolute (17.6) (51.5) 2.9
Relative (9.9) (39.4) (15.9)
Abs (US$) (19.5) (52.9) 12.6
50
100
150
200
250
300
350
400
450
500
Mar 06 Nov 06 Jul 07 Mar 08
60
80
100
120
140
160
180
200
220
Aptech (LHS)Rel to Sensex
(Rs) (%)
Source: Bloomberg
www.clsa.com
Steady growth Aptech focuses on India and China, and the business has demonstrated an ability to scale up, be it in information-technology (IT) training in China, Arena Multimedia, or Avalon aviation training. Aptech is moving away from the public school IT business and overall the firm should deliver a 52% earnings Cagr over the next two years, at a significantly lower capex-intensity than its peers. We maintain our BUY recommendation and a Rs305 target price that implies 52% upside.
Retail forays have achieved scale Aptech conducts IT training at around 650 centres in 35 countries and it leads the pack in China, one of the fastest growing markets, with more than a 30% share. Given China’s position in the IT services lifecycle, demand for IT education should remain relatively steady through industry demand cycles. Meanwhile, Aptech is consolidating its leadership in multimedia training, with 40-50% YoY growth expected over the next three years. The continued lack of trained manpower in India’s aviation and hospitality sectors is expected to drive strong growth in its Avalon business, which is next only to Frankfinn and AHA in scale and coverage. The retail business constitutes 72-75% of Aptech’s revenue and we expect a 31% revenue Cagr over FY07-10.
Changing focus of institutional business is a positive move Aptech’s exposure to the international corporate training market is less than 6% of total revenue, but its focus on the Indian market is growing. This is backed by a lack of qualified trainers in India, amid strong service-sector growth, where training services are in greater demand. Aptech has ramped up from 35 to 100 trainers and its acquisition of Synergetics adds content libraries as well. Aptech is also exiting the loss making government-school IT business (due to its unfavourable terms). We like the India centricity of the new strategy and forecast a 22% Cagr in institutional revenue over FY07-10. Ebitda for the segment should reach 8% in two years (from -5% currently).
Strong financial metrics support rerating potential Aptech’s business model is the least capital intensive of India’s leading education companies. While it is mapped into nearly the same segments as its peer NIIT, it does not suffer from the same drag posed by the US-centric corporate-training market, and seems better placed to exploit growth options at home and in China. A 52% 08-10CL EPS Cagr, superior return ratios and 17x 08CL PE make the stock a BUY. Consistent performance could drive multiple expansion - our target price of Rs305 implies 22x 09CL earnings.
A Chindia story Aptech is building a stake in the rising spend on training (retail and corporate) in India and China. The current business is split almost evenly between India and the rest of the world and is divided into two key segments.
Segmental revenue split
Percentage of total (%) FY07CL FY08CL FY09CL FY10CLRetail Total 71.5 72.7 75.9 75.8India IT training 10.5 10.4 10.4 10.1China IT training 40.0 39.5 39.8 38.5ROW IT training 10.5 10.4 10.7 10.5Arena (multimedia training) 10.0 11.4 13.1 14.2Avalon (aviation/hospitality training) 0.5 1.1 1.8 2.5Institutional total 28.5 27.3 24.1 24.2Government schools (India) 11.0 7.6 1.8 0.0Synergetics (acquired, India)) 4.0 4.9 5.8 6.5Learning solutions (global) 6.0 5.7 5.7 5.5Training & testing 7.5 9.1 10.8 12.2Source: CLSA Asia-Pacific Markets
Retail segment The retail segment includes all forms of training in which a customer walks into an Aptech owned/franchised centre to be trained. It contributes almost 72% of Aptech’s revenue and its contribution is expected to rise to almost 75% by FY09, aided in part by Aptech’s decision to exit the government-schools segment, currently classified as “institutional”. Revenue streams in the segment are relatively more stable and predictable and should increase at a 31.5% FY07-10CL Cagr. Capital intensity in the business is very low as most capital investment is done by the franchisee.
Proportion of revenue from Avalon and Arena to increase
0
500
1,000
1,500
2,000
2,500
3,000
3,500
4,000
FY07CL FY08CL FY09CL FY10CL
AvalonArenaROW IT TrainingChina IT TrainingIndia IT Training
(Rsm)
Source: CLSA Asia-Pacific Markets
IT training ex-China contributes around 20% to Aptech’s revenue and is expected to deliver a 28% Cagr over FY07-10CL. The firm owns and operates 10 centres in India. In addition, there are almost 350 franchisee and 110 fixed-royalty centres through which students can enrol in IT courses run by Aptech. Franchisees pay 15-30% of fees charged as a royalty. To maintain tighter control over franchisees and to stop leakages at the franchisee end, Aptech has implemented a central automation system through which all
Exiting the government business
Stable revenue growth of 31.5% over FY07-10CL
Retail IT training in India estimated to be a US$190m market
Aptech’s internal systems are connected with the franchisee outlets. Aptech also plans to “web-enable” the system which will allow it to move the data from server at franchisee location to a common Aptech server and help to increase data security. Besides India and China, Aptech is present in 33 other countries with major presence in Vietnam, Nigeria, the Middle East, Malaysia and South Africa. The company has recently started training in hardware and networking under the N-Power brand.
Aptech operates in China via a 50:50 joint venture with a Beijing University affiliate. The venture operates through almost 250 centres in 57 cities and is a clear market leader with an estimated market share of 32%. The JV was formed in 2000 and is valid for a 99 year period. This segment contributes almost 40% of Aptech’s revenue. IDC has predicted a 23% Cagr over FY07-11 in the Chinese IT training market. Given Aptech’s market leadership and alliances, we expect this segment to see a 27% Cagr over FY07-10CL. We also believe that the Chinese IT training market is likely to stay steady through demand cycles, given its early stage of growth.
Aptech conducts multimedia training through the Arena brand. Arena is present in 11 countries with 130 centres including 15 outside India. Revenue growth in this segment is expected to remain strong with a Cagr of 45% over FY07-10CL.
Aptech entered the aviation/hospitality training segment through its acquisition of Avalon in 2006. Avalon was acquired mainly for its content, and payments are subject to achieving an earnings threshold over a five-year period. Post acquisition, Aptech has scaled Avalon from two centres to a network of 35 centres. Aptech expects to expand this network to 50 centres by December 2008. It has already tied up with over 35 airlines. It also plans to get into the hospitality training segment. The boom in India’s aviation and hospitality sectors and the shortage of trained manpower is expected to drive demand for services offered by Avalon and we expect a 119% revenue Cagr over FY07-10CL for Avalon.
Institutional segment The institutional segment contributes about 28% to Aptech’s revenue, which is set to enjoy a 22% Cagr over 07-10CL.
Aptech operates 900 schools in Delhi and Orissa. While the ICT and computer-literacy segment contributes around 11% of revenue, it plans to exit this business given the heavy losses it continues to suffer. The contract to operate 600 schools in Delhi will expire in October 2008 and the company’s profitability will improve substantially after this. The contract for 300 schools in Orissa will expire in 2009. After FY09 we do not expect any further revenue from this segment. It appears that Aptech picked up this business in the past at deeply unfavourable terms - current players in the ICT segment make Ebitda margins of 25%+ in newly awarded contracts, though long cash-collection cycles remain a hindrance. In any case, Aptech’s strategy on exiting the business seems more certain than peer NIIT’s ambivalence on the same - NIIT had earlier announced a reduced focus on the business but seems to be bidding for contracts again.
Aptech’s acquisition of Synergetics in 2006, marked its entry into the software-developer training and consultancy segment which primarily deals with induction training, laterals training and open workshops for the IT
industry. It employs close to 110 trainers in this space, up from about 22 when it acquired Synergetics. The segment should deliver a 51% Cagr over FY07-10CL. Risks to this business arise from a slowdown in hiring and cuts in training budgets at IT companies.
Government schools business complete ramp down by FY10
0
200
400
600
800
1,000
1,200
FY07CL FY08CL FY09CL FY10CL
Training & TestingLearning SolnsSynergeticsGovt Schools
(Rsm)
Source: CLSA Asia-Pacific Markets
Training and testing comprises corporate training for all segments other than IT. Aptech has seen early success by signing up marquee clients like Pantaloon Retail and HDFC Standard Life. The lack of skilled manpower in retail and financial-services sectors should increase demand for Aptech’s services. Testing solutions are offered under the Attest brand through 45 franchisee test centres. It has tied up with institutions of higher learning to conduct exams for distance learning. The company administered close to a million of these in 2007, up 100% YoY. This segment contributes about 7% of Aptech’s revenue and will deliver a revenue Cagr of 51% over FY07-10CL.
Learning services caters mainly to clientele in the US and Europe and provides customised/proprietary content. We are cautious on this business for 2008 given the looming slowdown in the United States, which could drive discretionary spending cuts in 2008. The segment contributes about 6% of Aptech’s revenue and should see a 25% Cagr over 07-10CL, albeit from a low base. Aptech’s corporate-training revenue is just 2.5% of NIIT’s revenue base.
Segmental revenue growth estimates
YoY growth FY08CL FY09CL FY10CLRetail Total 34.0 31.4 29.1India IT training 30 27 25China IT training 30 27 25ROW IT training 30 30 27Arena 50 45 40Avalon 200 100 75Institutional total 26.2 11.3 29.2Government schools (8) (70) (100)Synergetics 60 50 45Learning solutions 25 25 25Training & testing 60 50 45Total 31.8 25.9 29.1Source: CLSA Asia-Pacific Markets
FY08CL FY09CL FY10CLRetail Total 38.3 38.7 37.1India IT training 35 35 33China IT training 35 35 33ROW IT training 35 35 33Arena 60 60 58Avalon (5) 7 15Institutional total (4.7) 2.2 8.0Govt schools (10) 0 0Synergetics (5) 0 5Learning solutions (5) 0 7Training & testing 0 5 10Total 26.5 29.9 30.1Source: CLSA Asia-Pacific Markets
Aptech’s positioning in the Indian education and training space
0
10
20
30
40
50
60
70
80
90
1 10 100 1,000 10,000 100,000
Market size (US$m)
Retail ITtraining
Servicestraining
CorporateIT training
IT in publicschools
Retaile-learning
(% Cagr, next 5 years)
Source: CLSA Asia-Pacific Markets
Company background A brief history of Aptech - Fits and starts
Year Event 1986 Started in 1986 as an IT training and education company. 1992 Incorporated as a public limited company under the name Aptech Information
Systems Ltd. 1993 First education and training company in Asia to receive ISO 9001 quality
certification. Launched multimedia training under the Arena brand. 2000 Entered China through a JV locally known as Aptech Beida Jadebird Company. 2001 Aptech’s training business de-merged from the company and the residual
software business merged with the group company, Hexaware Technologies. 2003 SSI bought Aptech from erstwhile promoter Atul Nishar and merged its own
training business with Aptech. 2004 Aptech started a university in the state of Chattisgarh. 2005 Rakesh Jhunjhunwala and group bought out SSI's stake in Aptech. Supreme
court ordered closure of private universities in Chattisgarh. Aptech University closed down.
2006 Acquired Synergetics and Avalon. 2007 Launched hardware and networking training under the N-Power brand. Source: CLSA Asia-Pacific Markets
Aptech's focus is on India and China, which contribute 85% of revenue. The firmimparts IT training through 650 centres in 35 countries and is a market leader inChina with 30%+ share. IT training contributes 60% of revenue with Chinacontributing 40%. Aptech continues to consolidate its lead in the multimedia-training business under its Arena Multimedia brand. This a high-growth, wide-margin segment makes up 10% of revenue. Aptech has ramped up its Avalontraining centres, through which it imparts aviation/hospitality training. While thissegment is a minor contributor to overall revenue, it is also the fastest growing.
Aptech has 100 trainers in the developer-training segment, up from 35 a yearago. This area has a rich customer base including leading tech firms like Wipro,L&T Infotech, Accenture and ITC Infotech. Aptech has also signed up marqueecustomers like HDFC Standard Life and Pantaloon Retail in its non-IT corporate-training business. Aptech provides testing and assessment services under theATTEST brand and conducted more than one million tests in 2007. Aptech is set toexit the loss-making government schools business, which should boost margins.
A 28%+ FY07-10CL revenue Cagr and margin expansion should drive a 47%earnings Cagr. Low capex and superior return ratios could expand multiples.
Softness in the learning solutions business driven by an impending slowdown inUS/Europe is a risk. While Aptech has ramped up its corporate trainers to 100,reduced hiring by Indian IT companies and smaller training budgets could pose abig risk to both revenue growth and margins.
With increased penetration of IT training in schools and colleges in India, demandfor Aptech's retail IT business could be at risk driving revenue downsides.Competitors like NIIT are getting aggressive in the multimedia training business inwhich Aptech enjoys market leadership. This could be a threat to Aptech's revenuegrowth as well as margins given the 60%+ margins Aptech currently enjoys in thesegment.
The boom in Indian services sectors has led to Aptech's expansion of Avaloncentres and increased training staff in its non-IT corporate training segment. Anyslowdown in hiring and cost-cutting in these services segments could adverselyaffect the fortunes of Avalon and Aptech's services training business.
Priced on 7 March 2008 India Sensex @ 15,975.5 12M hi/lo Rs604/119 12M price target NA ±% potential NA Target set on Shares in issue 82.5m Free float (est.) 30% Market cap US$385m 3M average daily volume 269.9m (US$6.7m) Major shareholders Promoters & Promoter Group 50.1%
Exciting opportunity Core Projects began as an IT-services export business and education has become its prominent client segment over time. It is now focused on the domestic opportunity in public private partnerships. The ICT@Schools programme and overall policy focus is opening up avenues for private players in managing, upgrading and profiting from schools, colleges and vocational training institutes. Core’s 50-50 JV with IL&FS Education and Technology Services gives it a headstart in this relatively new space.
Public spending booster; private players welcome Core Projects has an array of technology products that assist in school operations. While public schools in five states in the US have already adopted most of these products, Core has achieved early success in India through a successful pilot implementation (440 schools) in the state of Jharkhand. The increased budgetary outlay for Sarva Shiksha Abhiyan and Core’s tieup with IL&FS Education & Technology Services Ltd (IETS) keep it well positioned to take advantage of increased state government spending on IT in education. Core estimates the market opportunity for IT in education in India at Rs7bn (US$175m). Education services contribute about 65% of Core’s revenue, with close to 70% coming from the US and the rest from the UK.
Business evolving within PPP framework There are opportunities to upgrade and manage public schools for fixed durations to address the infrastructure gap in public schooling in India. Industrial Training Institutes (ITIs) are slowly being opened up to private players for management rights - 244 approvals are already in place. Overall, policy planners including the Planning Commission and the National Knowledge Commission seem to agree that the future of India’s public education will be bleak if left entirely to government initiatives.
Core’s portfolio can shift away from IT services Apart from clients in education (65% of revenue), Core also provides a range of IT solutions to customers in diverse industries with a special focus on healthcare, financial services and logistics. Core has implemented projects for GSK and J&J in healthcare; American Express and GE Capital in financial services; and Balmer Lawrie and Reliance in logistics. This segment contributes about 35% to Core’s revenue. We believe that the rise of PPP revenue streams could reduce this business within the overall portfolio.
Binary potential ahead Core’s market positioning is yet unsubstantiated by meaningful success, except the 156 schools managed by its JV partner, IETS and the 440-school pilot in Jharkhand state. But the beginnings of a potentially big opportunity are visible and Core seems well placed to ride the growth of PPP in India.
Priced on 7 March 2008 India Sensex @ 15,975.5 12M hi/lo Rs5,650/890 12M price target Rs7,000 ±% potential +107% Target set on 10 Jan 08 Shares in issue 17.2m Free float (est.) 9.6% Market cap US$1,438m 3M average daily volume Rs193.5m (US$4.9m) Major shareholders
Promoters 56.1% FIIs 32.8%
Stock performance (%) 1M 3M 12M
Absolute (12.6) (15.7) 277.3
Relative (4.4) 5.4 208.2
Abs (US$) (14.6) (18.1) 312.9
0
1,000
2,000
3,000
4,000
5,000
6,000
Mar 06 Nov 06 Jul 07 Mar 08
50
150
250
350
450
550
650
750
Educomp (LHS)Rel to Sensex
(Rs) (%)
Source: Bloomberg
www.clsa.com
Uninterrupted growth An aggressive K-12 strategy, an early lead in the multimedia-in-schools market and a multiplicity of India-centric high-growth segments set Educomp apart and will drive a sector-leading 93% profit Cagr over FY08-11CL. Execution is also sound. Its Smart Class and ICT business ramp-ups are ahead of schedule and 60 finalised sites for K-12 schools provide visibility on its targets. Profit is almost doubling annually, which should allay valuation concerns. BUY towards our Rs7,000 target price.
Early identification of market opportunities Educomp’s plays are India-centric. Its multimedia-in-schools offering now reaches more than 650 private schools and adoption is accelerating. K-12 school management, a new segment, is set to ramp up to 100 schools over the next three years (150 in four years). IT in public schools, although a fairly narrow-margin business (25-30% Ebitda versus c.60% in other areas), augments this portfolio. Around these businesses are a slew of other niche offerings - teacher training, online tutoring and e-learning, and preschools. In many segments, Educomp enjoys a 12-24 month lead over new entrants.
Portfolio to drive strong growth for several years Educomp will have 4,000 multimedia-enabled schools in its Smart Class programme by end-FY11; the current target base is at least 15,000 schools with monthly fee above Rs1,250/month. Its 100-K-12 schools under management will still be only partially billed in FY11, leaving good scope for growth from higher utilisation. The growth prospects for Educomp appear to be more secular and stretch further into the future than those of its peers.
Execution differential Profit over FY07-08 should be 60-65% ahead of our first estimates made in February 2006. Educomp has resolved the key bottleneck of land acquisition for K-12 via synergistic alliances with realty players and it has already secured 60 school sites. Its sales team services 75 Indian towns and the medium-term target is 100. Management has been structured into business units with significant senior personnel expansion over the past two years.
Profit growth will answer valuation concerns Educomp seems expensive, but earnings are set to grow sevenfold over FY08-11 and the stock price needs to be seen in this context. Our target price of Rs7,000 is based on a discounted cashflow model that assumes a 13% weighted-average cost of capital and 5% terminal growth. Non-linear growth, potential operating leverage as sales and product-development expenses even out, and the potential to expand into adjacent spaces (higher education, for example) provide further boost to the stock.
Uninterrupted growth In FY10, revenue from Educomp’s K-12 school initiative will exceed the company’s total revenue for the current fiscal year. At the same time, the existing Smart Class and ICT businesses continue to run ahead of plans. Putting together the pieces, we forecast a 106% revenue Cagr over FY08-11, even as revenue is set to grow by 100% YoY in FY08.
Educomp’s revenue stack - K-12 starts adding materially from next year
Notes: Business Segment Index: Smart Class – Multimedia Education in private schools; billed to each student monthly. ICT – Computer Labs in public schools; billed to state governments, quarterly. K-12 – School management under brand alliances plus owned “Millennium School” brand. Pre-Schools – Pre-primary schools; located in residential neighbourhoods. Teacher training – Target 300,000 teachers trained in FY08 in alliances with NGOs. e-learning – www.mathguru.com launched and others in the pipeline, Others – Includes tutoring and some retail sales (legacy business, going down). Source: CLSA Asia-Pacific Markets
K-12 growth bolsters the next five years Educomp’s K-12 initiative (managing K-12 schools) is taking off. The real revenue and profit boost from this initiative should start to appear in FY09, but even more strongly over FY10-11, when K-12 school numbers will have reached material scale. The critical success factor in the process is land acquisition, where Educomp seems comfortably placed. A total of 60 sites are in the bag, and we believe that in coming months all of the land acquisition/leasing plans for the 100 school/FY11 target will be in place. Management has begun to articulate the 150 schools/four-year target more loudly, underlying its growing confidence in the ramp-up. Assuming fairly low utilisation numbers in the initial stage of school launch, we still see the K-12 revenue stream exceeding the entire FY08 Educomp topline by FY10.
K-12 is Indian education’s largest segment and makes up US$20bn of annual tuition-fee inflows. Educomp is unique in that it is the first organised initiative around generating profits from the immense opportunity in private school K-12 expansion. Educomp’s school initiative provides a unique option to accelerate the growth of India’s private schools. By taking over land acquisition, infrastructure management, intellectual-property inputs and overall school management, Educomp has located its business where it can legally profit, rather than in the still-confused space surrounding profits at the level of school trusts.
Appendix 1 looks at a K-12 school model in greater detail.
No. of sitesOperational schools 2Sites from DLF 8Sites from other realty player(s) 17Open market plus smaller numbers from realty players 5Total "hot" sites (stage 1 of expansion) 32Other sites finalised (work not yet begun; stage two of expansion) 28Total sites in place 60CLSA forecast for end March 2009 25CLSA forecast for end March 2010 65CLSA forecast for end March 2011 100Source: CLSA Asia-Pacific Markets
K-12 forecasts
FY08CL FY09CL FY10CL FY11CLEop number of schools 5 25 65 100Billable schools (functioning) 2 7 33 72Students per school in steady state 2,300 2,300 2,300 2,300Fee per student per month (Rs) 3,000 3,000 3,000 3,000Capacity utilisation in schools set up last yr (%) 90 90 90 100Capacity utilisation in new schools (%) 50 50 60 60Average capacity utilisation (%) 80 79 83 96Admission fee per student (Rs) 30,000 30,000 30,000 30,000Total collections from admissions - 690 2,346 3,795Annual revenue (Rsm) 132 1,145 4,606 9,525Gross profits (Rsm) 79 687 2,764 5,715Source: CLSA Asia-Pacific Markets
Steady state-supplier surplus
(Rsm)
Steady state revenue per year, per school 120.0
Steady state EBIT (surplus) per year per school (%) 60
Fee to supplier (Edu Manage), per month per student
IPR related fees 650
Technology related services 250
School management services 600
Multimedia education product inside the classroom 150
Total fee per month per student 1,650
Total fee 43
% of school collections 36
Fee to leaser (Edu Infra)
Lease rental = 14.5% of capex 21
Fee revenue = 4.5% of collections 5
Total payment to leaser 26
% of school collections 22
Total payment to suppliers (%) 58
Surplus left in school trust (%) 2Source: CLSA Asia-Pacific Markets
Regulatory ambiguity on "resonable surplus" drives
two-tier structure of trust/management
Source: CLSA Asia-Pacific Markets
Smart Class and ICT - Accelerating growth Educomp will add nearly twice as many schools in FY08 to its Smart Class business as it added in the previous year. In March 2006, Educomp had just 91 schools under Smart Class; by March 2008, it will have 800+ (management guidance is 825). The numbers indicate accelerated acceptance of the Smart Class proposition. With more schools joining in, Smart Class as a concept is becoming better known. At the same time, Educomp has expanded its sales team to over 100 people and now reaches out into nearly 75 Indian towns and cities. Given the Rs150 per month per student fee for Smart Class, we see over 15,000 private schools in India with a monthly fee that exceeds Rs1,250 as the immediate target segment, and Educomp will have tapped less than a quarter of this market even three years from now.
Smart Class forecasts
FY07 FY08CL FY09CL FY10CL FY11CLNo of schools, end of period 331 800 1,500 2,500 4,000Net additions 240 469 700 1,000 1,500Number of schools, average 211 519 1,010 1,900 3,100Classes per school 25 25 25 25 25Students per class 45 45 45 45 45Charge per student (Rs/M) 128 150 150 150 150Revenue (Rsm) 365 1,050 2,045 3,848 6,278Source: CLSA Asia-Pacific Markets
Educomp is also now the biggest in ICT (computer labs in government schools), ahead of its peers Everonn and NIIT. A sustained focus on this segment (NIIT seemed to look elsewhere last year, but has refocused), Educomp’s content library (parts of which are provided to the schools as added value) and regional language conversion of content differentiate
Educomp. We expect 25,000 ICT schools by March 2010. Like other forecasts, Educomp has driven upgrades to assumptions in this business as well.
ICT forecasts FY07 FY08CL FY09CL FY10CL FY11CL# Schools, end of period 2,808 8,000 15,000 25,000 40,000Net addition 2,108 5,192 7,000 10,000 15,000Number of Schools, average 1,122 3,846 9,400 17,000 28,000Revenue per school p.m. 22,379 18,000 18,000 18,000 18,000Revenue (Rsm) 301 831 2,030 3,672 6,048
Source: CLSA Asia-Pacific Markets
ICT market size estimate FY08 FY09 FY10 FY11 FY12 FY13Start of period schools, wired 9,000 16,000 36,000 66,000 106,000 156,000New bids 7,000 20,000 30,000 40,000 50,000 50,000End of period schools, wired 16,000 36,000 66,000 106,000 156,000 206,000Inflow per month per school (Rs) 20,000 20,000 20,000 20,000 20,000 20,000Annual revenue to providers (Rsm) 3,840 8,640 15,840 25,440 37,440 49,443Annual revenue to vendors (US$m) 96 216 396 636 936 1,236% YoY 125 83 61 47 32
Source: CLSA Asia-Pacific Markets
Capex shifting to assets with longer depreciation lives Educomp’s capex pattern is changing. We see two trends in play. First, capex needs in the Smart Class and ICT businesses are expected to be lower than school additions may demand. This is driven by two factors. More Smart Class schools are buying the hardware themselves (about 10%), a trend also seen in some ICT deals (eg, the Gujarat order). Educomp has also entered into a leasing agreement with ICICI Bank for a total of Rs1bn (so far), under which equipment is leased from ICICI at a 10.6% lease rental, shifting down capex needs and converting these into operating costs. Secondly, most of the capex in coming years will flow into the K-12 school expansion. Each school demands Rs120-140m in capex and depreciation will be up to 40 years. Over FY08-11, we expect US$450m+ in capex from Educomp. This funding is nearly secured, including a line of credit from an SBI-led consortium, two convertible issuances already done (our EPS is fully diluted) and internally-generated funding.
Educomp’s capex needs exclude leasing alliances
0
2,000
4,000
6,000
8,000
10,000
12,000
FY06 FY07 FY08CL FY09CL FY10CL FY11CL
K-12 schools
Pre-schools
ICT
Smart Class
(Rsm)
About half of the capex needs forSmart Class and ICT may beaddressed thru leasing alliances
Expansion into adjacent businesses While the growth in Smart Class, ICT and now K-12 seem to dwarf other business initiatives, there are several in play. For example, e-learning via www.mathguru.com has doubled subscriptions between the Sep07 and Dec07 quarters to more than 30,000, and we expect it to do so again in FY09 to exceed 60,000. Apart from some revenue contribution (at margins above 80%), this initiative also pulls more students under the Educomp umbrella. The preschool initiative could receive a boost from an acquisition - we understand that Educomp is looking to acquire a 60-80 school chain in the preschool segment. Licensing of Smart Class content in international markets should stay at 6-8% of total revenue.
Revenue mix - Percentage of Educomp’s total (%) FY08CL FY09CL FY10CL FY11CLSmart Class India 42 36 32 29ICT 33 35 30 28K-12 1 12 23 26Smart Class Global 8 7 6 9Preschools 1 1 2 3E-learning 2 2 3 2Teacher training 9 5 3 2Others 5 2 1 1Source: CLSA Asia-Pacific Markets
Educomp is aggressively pursuing the tutoring market. It acquired a 76% stake in 3-Bricks e-services, which owns an online tutoring portal called www.learninghour.com and www.threebrix.com. Over 250 tutors provide online tutoring at an hourly cost of Rs400, with the Middle East and Dubai the primary markets as of now. Over time, this initiative could expand beyond the online channel to include brick-and-mortar tutoring as well. Educomp has also acquired a 51% stake in AuthorGen Technologies, which owns technology platforms on the Web 2.0 domain for online learning. AuthorGen owns a portal, www.wiziq.com, which connects students and teachers on any web browser and operating system. It also has a 70% stake in Canadian e-learning company, Savvica, which builds online communities around e-learning.
BUY for visible multi-year growth Looking back at our map of the Indian education opportunity, we note that Educomp has a presence in both the larger as well as some of the fastest-growing segments. Over the years, Educomp will retain the option of expanding into the higher-education space. Still, its current portfolio alone should be enough for more than 100% revenue growth until FY11 and we suspect more than 50% growth for some years after that as well. For example, our model bills only 72 K-12 schools (and these only partially) in FY2011, versus the new targets of 150 schools in four years.
More importantly, we find less cyclicality in Educomp’s revenue streams. The typical duration of a Smart Class win is five years. School leases and management contracts run for over 30 years. IT projects in public schools, though a business less to our liking, also run over five years. From the consumer’s perspective, Educomp is strong in segments where spending is more compulsory than it is discretionary.
Over time, operating leverage benefits will kick in. Educomp’s 400-strong development team does not need to grow at the same pace as revenue. The company has been investing heavily in sales expansion lately, but with 75
towns mapped already in India (25 more to go), this investment is also expected to even out over the next 12 months. Improved utilisation of school infrastructure and greater licensing revenue streams as Smart Class penetrates Southeast Asian markets provides further opportunities to defend and expand profitability.
Educomp has the strongest portfolio in Indian education
0
10
20
30
40
50
60
70
80
90
1 10 100 1,000 10,000 100,000
Market size (US$m)
K12 school management
Multimediain private schools
IT in publicschools
Pre-schools
Tutoring, private professional colleges:
future optionality
Books
E-LearningTeachertraining
(% Cagr, next 5 years)
Source: CLSA Asia-Pacific Markets
Our target price of Rs7,000 is based on a DCF valuation. Educomp’s 43x FY09 valuation looks expensive (although lower than Everonn), but needs to be seen in the context of its 93% EPS Cagr until FY11. Moreover, we note that while education has been an increasingly active investment play worldwide, only select stocks have delivered consistent returns over the years. Raffles in Singapore, Devry in the US and MegaStudy in Korea are some examples of stocks that have done remarkably better than their peers. While Indian education’s opportunities are immense, the positioning of its publicly-listed players across market segments are not entirely optimal. Educomp is the exception.
Key earnings driversYear to 31 March 2006A 2007A 2008CL 2009CL 2010CL
Smart Class schools, EOP 91 331 800 1,500 2,500Classes per school 15 25 25 25 25Monthly fee per student 137 128 150 150 150Students per class 50 45 45 45 45ICT schools, EOP 700 2,808 8,000 15,000 25,000Monthly ICT fee (Rs) 25,000 22,379 18,000 18,000 18,000K-12 schools 5 25 65Initial utilisation in K-12 50 50 60Capex (Rsm) 116 639 1,219 3,842 7,186
Educomp has scaled up in multiple segments of the Indian education space, somebeing large markets and others among the fastest growing. 42% of its FY08CLrevenue come from Smart Class, a multimedia content offering within classrooms.Educomp has 500+ schools signed up as of last quarter and the adoption of thisunique proposition is expanding as more schools accept the viability and positiveresults out of multimedia education. It targets 825 schools by March 2008, and weestimate 2,500 by March 2010.
Educomp implements IT training within public schools under BOOT contracts.6,000+ schools have signed up, making Educomp nearly 2x as large as its nearestcompetitors, Everonn and NIIT. The government's spend on education isincreasing, and over 25,000 schools are expected to be bid in CY2008. Thisbusiness is about 33% of FY08 revenues.
Educomp has also entered the highly lucrative school-management space for K-12schools. By consolidating suppliers to schools - lessors, intellectual property orschool management - Educomp can tap into annuity revenue streams with 50%+operating margins. It is set to manage 100 schools in three years, and 150 in fouryears. We estimate a 93% earnings Cagr over FY08-11, easily beating peers.
Execution and regulatory ambiguity around aspects of K-12 schools are the biggestrisks to Educomp. With revenue set to enjoy a 100% Cagr, and multiple revenuestreams expanding at this pace, Educomp has beefed up its top management teamand structured itself around independent business units.
The Indian regulatory environment for education continues to struggle between alargely failed public education approach (142m children out of school) amidst oldsocialistic hang-ups that frown at the "commercialization" of education. Courtjudgements contain conflicting remarks on allowing a "reasonable surplus" inprivate schools, without specifying what a reasonable surplus implies, and at thesame time condemning the commercialization of education. However, some of thisis changing. Working through recent policy documents and statements, we find agrowing acceptance of an increased private sector role in education, starting withhigher education, but also encompassing public private partnerships for K-12schools as well. In the interim, businesses like Educomp have structuredthemselves as school management consultants, supplying land for lease, andproviding a wide gamut of services and intellectual property to schools.
Priced on 7 March 2008 India Sensex @ 15,975.5 12M hi/lo Rs1,235/140 12M price target Rs680 ±% potential +2% Target set on 9 March 2008 Shares in issue 13.9m Free float (est.) 25.8% Market cap US$229m 3M average daily volume Rs102.7m (US$2.6m) Major shareholders
Promoters 31.1% Other locked-in shares 43.1%
Stock performance (%) 1M 3M 12M
Absolute (13.0) 19.2 0
Relative (4.9) 48.9 0
Abs (US$) (15.0) 15.8 0
100
300
500
700
900
1,100
1,300
Jul 07 Oct 07 Dec 07 Mar 08
100
200
300
400
500
600
700
800
Everonn (LHS)
Rel to Sensex
(Rs) (%)
Source: Bloomberg
www.clsa.com
Portfolio expansion needed Everonn’s distance-education and public-school IT businesses are driving a 65% EPS Cagr over FY08-10. Yet valuations at 46x FY09CL and 30x FY10CL diluted earnings seem to factor this in, making it the most expensive education stock in our coverage. Longer term, its current business only covers a small part of the market, and commoditisation of the public-school IT business and scalability in distance learning are risks. We maintain an Underperform call.
IT in public schools: Growing, but getting more competitive While Everonn’s public-school IT business is worth a segment of a larger portfolio, we find it difficult to assign valuation premiums given the risk of commoditisation in the L1 bidding process. This segment comprises 65% of the company’s revenue, where Educomp and NIIT are its competitors. We expect Everonn to add 3,500 schools per year over the next two years, which should drive a strong revenue growth. However, from a valuation perspective, we do not consider this a unique positioning for any of the players in the field.
Distance learning: Niche segment, nice positioning Its Virtual & Technology Enabled Learning Solutions (ViTELS) initiative is unique and differentiates it from peers. Setting up learning centres in schools and colleges (325 on last count), Everonn beams its lectures via VSATs. At a 45% Ebitda margin, this is the more attractive segment of its business, but we see ramp ups beginning to trail earlier expectations. The company’s coverage has not changed materially since its initial public offering in July 2007. We are assuming a 150-centre addition each year going forward. A potential alliance with an international player can help rejuvenate the expansion and add expertise on its course coverage.
Growth in new segments a risk to our view Everonn has articulated expansion plans into school management as well as vocational training. These may create discontinuities in its future growth model, as these segments are not yet included in our estimates. The company manages one school in Cochin, and plans to expand into schools in industrial townships.
Expensive valuations given market coverage On current earnings, Everonn is 7% more expensive than Educomp on FY09 earnings, but due to its lower earnings-per-share (EPS) Cagr, it is 36% more expensive on FY10 EPS. While Educomp is also an expensive stock on current fiscal-year multiples, we believe Everonn’s portfolio will need to widen into larger market spaces to justify current valuations and give confidence in multi-year secular growth. Its current portfolio is exposed to both commoditisation and scalability risks. We rate the stock an Underperform.
Valuations need further backing IEIS - Institutional education & it infrastructure services Everonn signs three- to five-year agreements with state governments to install and run computer classes in public schools, mostly on a Boot (build-own-operate-transfer) basis. This business is tender-based and Everonn currently operates 3,156 schools in nine states, compared to 6,004 for Educomp and 3,828 for NIIT. ICT contributes 65% to Everonn’s revenue.
India has almost 950,000 schools and more than 200,000 government schools (the cream of the public-school network) are expected to come up for tendering over the next five years. Everonn is one of three players (along with Educomp and NIIT) pursuing the opportunity in this segment. We expect Everonn to add around 3,500 schools each year over the next two years.
ICT market-size estimate FY08 FY09 FY10 FY11 FY12 FY13Start of period schools, wired 9,000 16,000 36,000 66,000 106,000 156,000New bids 7,000 20,000 30,000 40,000 50,000 50,000End of period schools, wired 16,000 36,000 66,000 106,000 156,000 206,000Inflow per month per school (Rs) 20,000 20,000 20,000 20,000 20,000 20,000Annual revenue to providers (Rsm) 3,840 8,640 15,840 25,440 37,440 49,443Annual revenue to providers (US$m) 96 216 396 636 936 1,236YoY % 125 83 61 47 32
Source: CLSA Asia-Pacific Markets
While ICT is a high-growth segment, the high debtor days (upwards of 150) and heavy capex intensity (without commensurate operating leverage) makes this business unattractive compared to more lucrative segments available in India’s education space. We find this the less-attractive business segment for its peers NIIT and Educomp as well. However, Everonn has a disproportionate exposure (65% of total revenue) to this segment versus peers, and this needs to change to defend its current valuations.
High growth and capex intensity
FY08CL FY09CL FY10CLNo. of schools EOP 3,156 6,656 10,156No. of schools added 1,237 3,500 3,500ICT revenue (Rsm) 534 840 1,523Capex/school (Rsm) na 0.4 0.4Capex (Rsm) na 1,050 1,050Note: Our key assumption is that 75% of schools added will be on a Boot model with upfront capex paid in equal monthly instalments through the period of the contract. In the remaining 25%, we have assumed that the government will take care of the capex. Source: CLSA Asia-Pacific Markets
Virtual and technology enabled learning solutions (ViTELS) ViTELS is the more attractive and unique segment of Everonn’s portfolio. It provides education and training solutions through satellite-based very-small-aperture terminal (VSAT) technology. Everonn has set up technology-enabled virtual classrooms, ie, Everonn Learning Centres, in more than 300 schools and colleges in India. It also has four studios in Chennai (three more studios are under construction) through which teachers deliver lectures by using VSATs to students sitting in Everonn learning centres. The company employs close to 50 teachers in Vitels.
Everonn invests close to Rs0.25m in setting up one learning centre. If colleges or schools invest a part of the capex, then Everonn shares 15-20% of its revenue with the institution; else, Everonn typically shares 10% of its
revenue with the institution. The average monthly realisation per school student varies from Rs120 to Rs180 and Everonn has a school-student roster of almost 20,000. The absence of quality content has hindered it from making inroads into schools. Thus, the company has now acquired content for schools from ABAN (with more than 6,000 animations) along with a 26-member content team, which should help it penetrate into more schools in the future.
Multimedia in schools
Channels Schools with fees above Rs1,250 per year 15,000No. of classes wired per school 25No. of students per class 45Payment per student per month (Rs) 150Market potential (Rsm) 30,375Market potential (US$m) 759Current base of schools 600Current market (US$m) 30Source: CLSA Asia-Pacific Markets, Discussions with professionals in the education industry
Everonn runs vocational-training/employability-enhancement courses in more than 190 colleges with a current enrolment of about 4,500 students. Course duration ranges from one to ten months and fees per course may vary from Rs800-Rs25,000, depending on the nature of the course. While the government has increased its focus on vocational training, the real booster for Everonn may come from the government’s decision to set up vocational-training centres in government schools/colleges in a public-private partnership (such as ICT). We understand that some of the global education players such as Apollo Group and Raffles Education, which provide vocational education, are keen on entering India, preferably through partnerships with Indian companies. Given Everonn’s beachheads in the segment, it may be a potential candidate for such a tie up.
ViTELS may drive growth but scale up is critical
(Rsm) FY08CL FY09CL FY10CLNo. of classrooms 325 475 625Average revenue per old classroom 1.35 1.35Average revenue per new classroom 1.0 1.0Revenue from ViTELS (Rsm) 284 589 791Investment per school classroom 0.25 0.25No. of classrooms added 150 150No. of studios added 1 2Investment per studio 15 15Capex in ViTELS 46 61Source: CLSA Asia-Pacific Markets
Early-stage expansion into newer segments Schools management Everonn is aggressively looking to enter the schools business by taking over the management of public schools in operation. It manages a school in Kochi and expects to add two to three more schools to its portfolio. Also, it plans to target schools run in public sector undertaking townships (Sail/Isro) for children of resident-township employees.
Testing and alliance partner services (Taps) Everonn designs and delivers customised and standardised testing and assessment services to individuals, educational institutions and corporations.
It has tied up with Educational Testing Services (ETS) to administer tests such as TOEFL and GRE. With about 85,000 students taking either one of GRE/GMAT/SAT tests each year, we estimate the test-preparation market size for this segment at US$20m, out of an overall US$1.7bn test-preparation market in India. Scalability remains a challenge unless Everonn expands beyond the current repository of tests into more lucrative segments.
Overall, we have not assumed material contributions from new businesses to the revenue over the next two years. We believe this is justified given the lack of visibility on plans as of now. However, this remains a risk to our view.
Everonn’s opportunity canvas needs to widen Currently mapping about US$1.5bn worth of market segments in the US$40bn Indian-education market, Everonn has a decent presence in some fast-growing areas such as IT training in public schools and reasonably large areas, eg, vocational and services training. It also intends to get into school management and multimedia education in schools, areas in which we maintain a very positive view.
Everonn’s coverage in the Indian-Education space
0
10
20
30
40
50
60
70
80
90
1 10 100 1,000 10,000 100,000
Market size (US$m)
Servicestraining
K-12
IT training inpublic schools
Multimediain schools
(% Cagr in next five years)
Source: CLSA Asia-Pacific Markets
However, Everonn’s high capex intensity stemming from IEIS continues to be an overhang and limits its ability to invest in other areas in our view. Also, it will have to raise capital to meet our 50%+ YoY revenue growth number for the next two years. This makes Everonn’s financial metrics inferior to some of the other players in the segment. While upsides may come from increased operating leverage in ViTELS, we will wait for proof of execution before factoring in this. Overall, Everonn’s plans need to translate into visible ramp-ups before financial projections can be valued in its new ventures.
We rate the stock an Underperform with a target of Rs680, based on the same PE/G as Educomp, which implies a 46x FY09CL/30xFY10CL PE. Though the stock is present in some good segments and attempts to get in a few highly scalable businesses, its expensive valuations without commensurate portfolio coverage, discontinuous earnings growth and execution track record are hindrances to a positive call. Among the risks to our view are:
Joint venture with international players for vocational training, which may reduce capex burden on the company while strengthening its offering.
Company background Everonn: A brief timeline of events
2000 Formation of Everonn Systems. 2000 Contract for 332 government schools in Tamil Nadu. 2002 Partnered with Hughes Net Global Education for bringing
management education through virtual classrooms. 2004 Launched Zebra Kross, a branded virtual-classroom network. 2005 Test launch of virtual learning at schools and corporations. 2007 Initial public offering. Source: CLSA Asia-Pacific Markets
Everonn sets up computer labs in government schools under its IEIS unit, whichconstitutes 65% of FY08CL revenue. At 3,156 schools won, Everonn competes inthis space with Educomp (6,000+ schools) and NIIT (3,800). Given that more than25,000 schools should come up for bids in the coming year, the market is largeenough for all players, but economics are weaker owing to intense competition, theprice-based bidding process and higher debtor days. We have estimated anaddition of 3,500 schools every year for the next two years and Everonn shouldrequire at least Rs1,050m of capex per year to fund this expansion.
Everonn's ViTELS initiative is unique, and offers distance-learning lectures via VSATlinks into more than 325 centres. We are factoring in a 67% revenue Cagr forViTELS through FY08-10CL and a 400bp margins expansion in the same the periodon the back of higher operating leverage and an addition of 150 Everonn LearningCentres each year.
With new business segments in play, Everonn plans to expand into schoolmanagement for example, and also into vocational training, possibly in an alliancewith an international player. However, we are awaiting proof of concept beforeassigning this into our forecasts.
Everonn has articulated expansion plans into school management and vocationaltraining, which are not part of our estimates. A positive booster from these maypropel its growth, thanks to the demand in both spaces. In school management,Everonn plans to take over schools in industrial townships, while in vocationaltraining, an alliance with an international player can kick-start growth with someearly credibility.
Everonn may be a beneficiary of the Indian Govenrment's high focus on vocationaltraining in public schools/colleges given its presence in this segment. A better-thanexpected pick-up in ViTELS can lead to a much better margin profile andprofitability metrics. While the recent expansion of the ViTELS footprint seems tohave slowed down, there is still a strong demand for the offering, and the grouphas been articulating greater success in the school segment - current centre mix is190 colleges, 125 schools and 15 retail centres.
Finally, we have assumed 3,500 ICT wins per year in our numbers. Greater successin this tender-based bidding process may change our forecasts.
A 77% earnings Cagr over the next two years. EPS Cagr lower at 65% due to our assumptions of capital raising, without which meeting growth targets may be difficult.
India Education Reuters NIIT.NS Bloomberg NNIIT IN
Priced on 7 March 2008 India Sensex @ 15,975.5 12M hi/lo Rs173/80 12M price target Rs150 ±% potential +41% Target set on 9 March 2008 Shares in issue 164.6m Free float (est.) 69.9% Market cap US$433m 3M average daily volume Rs139.1m (US$3.5m) Major shareholders
Promoters 30.1% FIIs 43.7%
Foreign s'holding 43.7%
Stock performance (%) 1M 3M 12M
Absolute (10.4) (30.6) 16.9
Relative (2.0) (13.2) (4.5)
Abs (US$) (12.5) (32.6) 27.9
30
50
70
90
110
130
150
170
190
Mar 06 Nov 06 Jul 07 Mar 08
50
100
150
200
250
300
350
NIIT (LHS)Rel to Sensex
(Rs) (%)
Source: Bloomberg
www.clsa.com
Over the hump? NIIT has done well to ramp up new retail initiatives in services training while maintaining a strong IT-training brand. However, exposure to the US-centric corporate-training market (56% of revenue, 27% of Ebitda) is a risk that will drag the firm’s financials for the foreseeable future. Balancing this, are cheaper valuation multiples than peers and likely revival of the school learning business. We maintain our Outperform rating and Rs150 target price, which implies 41% upside.
New initiatives are going strong, IT training has recovered New businesses, including its financial-services training initiative (backed by ICICI Bank and HDFC Bank, among others) should contribute c.8% of all revenue by FY10 and see improved profitability towards a high-teen Ebitda margin range by FY10. These are positive moves made in the past two years while the IT training business has recovered to 25-30% growth after the protracted post-2001 slump. Together, these businesses contribute 60% of Ebitda and remain the key future growth drivers.
Corporate training skews the portfolio away from India NIIT acquired US-based Element K in August 2006, moving into US corporate training. At 5-8% YoY growth and a 5-8% Ebitda margin, this market remains vulnerable to discretionary-spending cuts. Independent researchers estimate that financial services have the highest cost per person for training but it is difficult to foresee a smooth spending environment in CY08. At 56% of revenue (27% of FY08 Ebitda) and with 94% US exposure, corporate training has left NIIT’s portfolio thinly spread within the domestic-education space. This is the key reason for NIIT’s lower rating than peers Aptech and Educomp.
IT in public schools, back in focus after a period of ambivalence NIIT seems to be back to bidding aggressively for ICT projects in public schools, after a phase of ambivalence when the segment was de-emphasised due to its ‘low margins and high debtor days’. After a net loss of 78 schools last year, we expect 2,500 additions in each of FY09 and FY10, with the potential in Andhra Pradesh the first trigger (1,500-2,000 schools).
Long-term story needs further strengthening At 17x FY09 and 12x FY10 PE, NIIT is cheaper than its sector peers. While its financials look weaker and may continue to do so into FY10, the trend is upwards. Ebitda margins should expand from 10% in FY08CL to 14-15% in FY10, along with improvement in return ratios. The firm’s patchy execution record will need to be addressed before we formulate a longer-term thesis on the stock, although on a 12-month view, it is an Outperform.
Needs to be more India-centric NIIT’s portfolio of services has improved, but there is room for further improvement. Over the past two years NIIT has ramped up vocational financial-training services (IFBI), management education (Imperia), finishing schools (Edgeineer) and recently acquired Evolv (an English language and communications training firm). On top of these positive moves, the IT-training business has recovered. However, NIIT’s portfolio is not taking full advantage of the opportunities in the Indian education space. The corporate-training exposure in the US is one of our primary concerns.
The acquisition of Element K in August 2006, has skewed NIIT’s portfolio away from India. Corporate training will contribute 56% of revenue in FY08, with 94% of that coming from the US market. About 60% of the business involves creating custom content and within this, 60% of the work is technology-content development. The remaining 40% of the business includes services like sourcing trainers and induction training. NIIT paid US$40m for Element K. When acquired, Element K’s revenue was US$80m and the business’ Ebitda margin loss stood at 7-8%. Margins have now improved and the corporate-training business should realise a positive 5% Ebitda margin in FY08.
Element K brings in the second largest content library in the US (only the merged SkillSoft-NetG entity is bigger) within the NIIT fold. It had 40-50 people maintaining its learning platform in the US and a 30-40 member team in India for content development. Rationalisation of the team, which has included some layoffs in the US, has helped to improve profitability. In FY08, corporate learning should deliver revenues of around US$135m, of which, US$95m would come from Element K and the remainder from NIIT’s extant corporate training business.
Corporate training vulnerable to spending cuts Our research on the sector indicates a large education opportunity within India, but the Element K acquisition ensures a wider footprint for NIIT outside the domestic market. This portfolio weighting is not ideal, especially given the lacklustre growth of the US market. The most bullish independent estimates put market growth at 8-10% YoY and some are as low as 5%. Moreover, corporate-training budgets come out of human-resources spending, an area
Element K has made NIIT too US-centric . . .
. . . at a time when the best growth opportunities
are domestic
A strong portfolio of services training
Our research indicates a big education opportunity
that we would classify as discretionary and therefore vulnerable to spending cuts in a challenging macroeconomic environment.
In our view, lacklustre growth in this important segment of NIIT’s portfolio is likely to continue, pulling its overall numbers down. While the rest of its businesses could grow at 30% or above over the next two years, corporate training is expected to grow by just 8% YoY and that does not even factor in US economic woes. Indeed, single-digit growth is vulnerable to spending cuts. Some studies indicate that finance and insurance sectors offer the highest per-person training spend at more than US$1,000 (versus just US$400-500 for retail). This is especially worrying given the financial sector’s current problems in the US.
Apart from overall growth and vulnerability to discretionary budget cuts, there are other challenges. One study indicated that within the overall pie, training outlays at small and medium-sized enterprises grew by 6.5% YoY last year, while large enterprises saw only 3% YoY growth. This indicates that players like NIIT will need to shift some focus into the SME segment, which may demand sales expansion and investments in new technology platforms. Self-study e-learning formed 20% of learning hours last year, up from 15% the year before and much of the increase was driven by smaller organisations with 100-999 employees. NIIT will need to reposition its corporate-learning business within a slow growth and structurally evolving marketplace.
We are intrigued that a business that depends on content development (arguably an intellectual property) and training services should deliver only single-digit Ebitda margins. Even assuming a 200bp margin improvement over the next two years, corporate learning’s profitability is likely to stay sub-10%, and in our view, this is symptomatic of a challenging competitive dynamic in the space. Some studies indicate that the largest player in the market has a low single-digit market share. Fragmentation, the rise of small and medium-sized clients, increasing use of technology and rapid commoditisation of generic content seem to be discontinuous market trends.
New initiatives going strong - IFBI most scalable NIIT has made some aggressive moves into services and vocational training, and among these, its IFBI initiative is the most interesting.
Institute of finance, banking and insurance (IFBI) IFBI addresses the manpower needs of financial-services space in India, where at least two million new jobs are likely to be created between now and 2012. IFBI started in September 2006 and offers a postgraduate diploma in banking operations which includes an internship and placement alliance with ICICI Bank. Since October 2007, IFBI has also allied itself with HDFC Bank. Yes Bank and ICICI Securities are also partner organisations for the business, and we think that the backing of well known names in banking and financial services should draw students under the IFBI umbrella.
Finishing schools NIIT offers a six-month programme for engineering graduates. This is a new market that is worth an estimated US$30m and is growing by 65-70% YoY.
Evolv NIIT acquired English-training company Evolv in January 2008. Evolv has a repository of 50 courses. We estimate this market is worth US$400-500m currently, with competition coming from players such as Veta (175 centres, expanding to 500 by 2010).
Imperia Imperia provides management education for organisations and working professionals. Some of India’s leading MBA institutes such as IIM Ahmedabad and IIM Calcutta are partners and these conduct live classroom sessions for Imperia students. We are less convinced on the scalability of this business, given that the placement track record is unproven. On the other hand, more than 2,000 placements seem to have taken place in the IFBI initiative.
We expect new businesses to ramp up to 8% of revenue by FY10, versus 3.2% as of the latest quarter. We also expect Ebitda margins in new businesses to improve to 12.5% in FY09 and 17% in FY10, as the business scales up. Total registrations in IFBI and Imperia totalled 8,600 by end-2007, with more than 85% of these being in IFBI.
New businesses have made positive Ebitda for the past two quarters
(250)
(200)
(150)
(100)
(50)
0
50
2QFY07 3QFY07 4QFY07 1QFY08 2QFY08 3QFY08
(%)
Source: CLSA Asia-Pacific Markets
IT training is recovering NIIT has a strong presence in IT training worldwide and the market in India has recovered in the last three years since the post-2001 slump and shake-out. IT training revenue will deliver a 25-30% Cagr over the next two years, at Ebitda margins of near 20%. NIIT also has a presence in e-learning. However, our scan of the market indicates that this segment can not become a “game changer” for NIIT, given the size of the domestic market (US$225m) and NIIT’s relatively weaker position in places like China, where Aptech has done very well. Student sentiment around placement prospects from NIIT also waxes and wanes along with sector hiring trends, where the increased propensity of companies to hire from IT graduate courses is a threat to the private diploma that NIIT offers. Nonetheless, the business is healthier than it was and offers consistent growth at stable margins.
1Q07 2Q07 3Q07 4Q07 1Q08 2Q08 3Q08Total capacity in India (Seat Years) 144,648 150,864 150,696 164,584 167,160 177,240 184,016Utilisation in India (%) 59 61 47 52 52 66 46No of centres 725 742 743 757 763 785 796Owned centres 49 51 51 52 52 52 52No of centres in India 446 446 442 443 448 469 473No of centres in China 132 147 152 155 155 159 166Source: CLSA Asia-Pacific Markets
School learning solutions - Ambivalence over? Over the past 12-18 months, NIIT lost its leading position in ICT (computer labs in public schools) to Educomp. While Educomp added 3,196 schools in the last one year, NIIT was down 78. Management indicated that this was a strategic decision and NIIT claimed that it was moving out of the business owing to its relatively lower margins and higher debtor days. We agree that ICT is not the most attractive business in Indian education and our optimism is based more upon its private sector expansion than it is on the public school space. However, the business does provide scale, it makes 25-30% Ebitda margins, and while debtor days are high, the incidences of bad debt have been low – the long invoicing cycle is natural when working with government.
In our view, the market for IT in public schools is likely to grow nearly tenfold over FY08-12, and NIIT needs to return to the space more aggressively. The process may already be underway. We hear of a potential 1,500-2,000 school win in Andhra Pradesh state, for example, and this should help to rejuvenate the business after falling behind last year.
ICT market size estimate FY08 FY09 FY10 FY11 FY12 FY13Start of period schools, wired 9,000 16,000 36,000 66,000 106,000 156,000New bids 7,000 20,000 30,000 40,000 50,000 50,000End of period schools, wired 16,000 36,000 66,000 106,000 156,000 206,000Inflow per month per school (Rs) 20,000 20,000 20,000 20,000 20,000 20,000Annual revenue to providers (Rsm) 3,840 8,640 15,840 25,440 37,440 49,443Annual revenue to providers (US$m) 96 216 396 636 936 1,236%YY 125 83 61 47 32
Source: CLSA Asia-Pacific Markets
NIIT’s school learning business also includes private schools. In the last quarter, about 28% of school learning revenue came from private schools. NIIT has coverage of 940 private schools, but its focus on these has also been on setting up computer labs and (some) multimedia training, in contrast to a more scaled rollout of multimedia inside hundreds of classrooms, a space where Educomp has taken the lead. NIIT has 12-15 pilots running where it is providing similar multimedia services. This business would need a greater management push to make up lost ground and to scale into the more profitable segments – computer labs are a 25-30% margin business, but
multimedia inside classrooms can generate more than 60% Ebitda margins. Challenges include developing enough content to prove a viable counterpoint to the incumbent – potentially an 18-24 month job. Overall, NIIT seems to have realised this and greater efforts are underway in the private-school segment.
School learning solutions for NIIT
Checks - ICT business FY07 FY08CL FY09CL FY10CLPublic schools, end of period 3,906 3,828 6,328 8,828Additions during the year (78) 2,500 2,500Operating margin on older public schools (%) 10 12 12 12Operating margin on newly-won schools (%) 20 20Ebitda, private schools (%) 16 19 20 20Revenue from private schools (%) 29.9 30.5 26.8 22.0Source: CLSA Asia-Pacific Markets
25% stake in NIIT Technologies NIIT Technologies contributes nearly 49% of FY08 NIIT net profit. At US$161m market cap for NIIT Tech, this contributes Rs9.8 per share to NIIT’s value. Removing the NIIT Tech impact on the stock price and profits, we note that education profits are being valued at 25x FY09 PE already, versus the 17x multiple on consolidated profit. On the positive side, a stake sale in NIIT Tech should help to generate cash for future capex. For example, NIIT would need US$30m in capex for FY09-10 if it wins 2,500 ICT schools per year and the NIIT Tech inflow could help to fund this. NIIT will also need to expand its footprint in new initiatives by opening more centres – across the IFBI, Imperia, finishing schools and Evolv (English training) segments.
NIIT minus NIIT Tech
Market cap (US$m) NIIT 433NIIT Tech c. 161NIIT’s stake in NIIT Tech (%) 25Value for NIIT 40Per share value (Rs) 9.8Current share price for NIIT (Rs) 107.8Share price ex-NIIT Tech (Rs) 98Market cap of NIIT ex-NIIT Tech (Rsm) 16,170FY09 net profits, ex-NIIT Tech, (Rsm) 658FY09 PE, ex-NIIT Tech (x) 24.6Source: CLSA Asia-Pacific Markets
NIIT’s map across the opportunity space In our view, NIIT currently maps just US$2bn of India’s US$40bn education market. On the positive side, it has a presence in some fast-growing areas, such as ICT in public schools. It is also involved in E-learning and finishing schools, as well as in reasonably large services and vocational training opportunities. While NIIT’s return ratios, growth and margins are likely to trail sector peers given the drag from corporate training in the US, the direction is likely to be upward. We expect ROAE to improve from 21% in FY08CL to around 30% in FY10, ROIC to reach 17% (versus 8-9% in FY08) and margins to improve as well.
Set to Outperform NIIT’s 30%+ correction this year makes the stock a candidate for a rebound, and it remains a well-recognised brand. Still, NIIT’s long-term value creation thesis appears weaker than those of some of its peers and we rate the stock an Outperform, a notch lower than our ratings on Educomp and Aptech.
Our forecasts assume nearly all of the guidance from the company on financial improvements, including continued growth in corporate training, together with margin expansion in the business, revitalisation of the public-school ICT business at better profit margins, continued growth in IT training with slightly improving margins and explosive expansion of the new businesses with improving profitability. These remain risks, especially in light of NIIT’s mixed execution record. Among the positive factors that could improve long-term fundamentals, we would include the following:
Demerger of the corporate-training business. This could allow investors an opportunity to invest in a more “India centric” growth story, and remove a potentially cyclical business component, which is also the lowest-margin segment in the portfolio currently.
Sale of 25% stake in NIIT Tech. If this happens at a substantial premium to current prices it could help NIIT to raise cash for faster expansion. The cash infusion could accelerate centre expansion for services training, for example.
Faster expansion in new businesses. This could drive better profitability. Among these, IFBI is the biggest candidate for a positive surprise, given that brand names in the space (ICICI Bank, HDFC Bank, Yes Bank among others) have lent formal support to the initiative. This could also draw more students into the fold.
Faster win rate in ICT. Given that tens of thousands of schools are currently under bids, NIIT can win a larger share than our current assumption of 2,500 per year.
NIIT has moved beyond its IT training roots to encompass corporate training (56%of revenue, 94% from US, 5-6% Ebitda margins), vocational training (financialservices through IFBI, MBA through Imperia brands, and IT finishing schoolsthrough Edgeineers). It has also acquired a stake in Evolv, an English-languagetraining and communications training business. These new initiatives are set toramp up to 8% of total revenue by FY10CL. Ebitda break-even in new businesseshappened two quarters ago and we expect margins to improve at the Ebitda levelfrom 2-3% currently to 12.5% in FY09 and 17% in FY10.
In IT training, NIIT has a long standing and well known brand in India. It operatesvia 796 centres, of which 473 are in India, 166 in China and the others spreadacross ASEAN, Africa and other regions. NIIT is #1 in IT training in India and #3 inChina with an 8% market share in the latter.
NIIT also offers school learnings solutions of which 72% is IT labs in public schools.After an year of apparent de-focusing on this business, NIIT is back to biddingaggressively for government contracts. Across 940 private schools, NIIT providesIT training and some curriculum based content on CDs. 12-15 pilots are running totest multimedia content within the classroom channels.
NIIT has had a volatile few years on macro and company-specific issues. On themacro side, the IT-training market is cyclical with growth trends in the industry.For example, NIIT faced a protracted slowdown after the 2001 tech slump. The riseof graduate courses in IT opened an alternative for students who were outside thefour-year degree programme in engineering, reducing the attractiveness of privatediploma providers such as NIIT.
But there have been company issues too. NIIT has entered several segmentswithout achieving scale in many. For example, NIIT has been in training for call-centre agents, and ERP professionals in the past. NIIT has not tapped the Chinamarket deeply enough, where peer Aptech seems to have done better. Despite itstwo-decade-plus branding lead, NIIT was slower to recognise the shift in marketopportunity towards schools. In public schools, NIIT has had a few changes instrategy in the past 18 months.
NIIT's cheaper valuation and improving financial profile mean it could outperform,but we are not convinced on the longer-term story. Execution risk remains.
Appendix 1: Modelling a school Simulation 1: School is a profit making company Schools in India work on a two-tier structure of (i) a non-profit trust, and (ii) profits at the suppliers’ end. For this model, let us assume a K-12 school is a profit-making entity and owns the land on which it is built. For a first look at fundamentals, this helps simplify the picture somewhat. Our assumptions also include distribution of schools between tiers of cities. For example, a Tier-1 city, where real estate prices are high, would likely make do with 2.5 acres at a cost of Rs20m per acre, while in a Tier-2 city a school might cover 3.5 acres at Rs10m per acre. We have assumed 50% of schools in Tier-1 cities, 30% in Tier-2 and the remainder in Tier-3 cities.
Cost of land
(Rsm per acre) Cost %Tier-1 city 20.0 50Tier-2 city 10.0 30Tier-3 city 5.0 20CLSA assumption 14.0Source: CLSA Asia-Pacific Markets
Area of land
Acres %Tier-1 city 2.5 50Tier-2 city 3.5 30Tier-3 city 4.0 20CLSA assumption 3.0Source: CLSA Asia-Pacific Markets
Among the other assumptions, the following are important:
Number of students: A school starts off till Grade 6 in the first year, expands into Grades 8, 10 and 12 by years 2, 3, 4. There are four sections per grade and a peak of 45 students per section – implying capacity of 2,160 students per school.
Fees: Tuition is Rs3,000pm, and the one time admission fee is Rs25,000.
Salaries: The average salary of a teacher is Rs12,000pm, plus allowances equivalent to 12% of salary. Wages rise 8% per year. Tuition fees rise 5% per year. There are two teachers per class, ie a peak of 96 teachers, and a student teacher ratio of 23 at peak capacity. Support staff of 50 (at peak) with average salary of Rs5,000 per month.
We have assumed Rs700 as the cost of construction per square foot. This is lower than an upper end apartment complex for example, but broadly similar to lower cost housing. We think this cost is justified as several facilities in a school are shared and quality of fittings (flooring for example) need not be as opulent.
Our calculations indicate an IRR of at least 40-42% and a payback period of under four years for a K-12 school with the above dynamics. Return on invested capital crosses 40% in the third year of operation, and can go up to 60-65% as the school reaches full capacity. Clearly, running a school can be extremely profitable, even if we reduce tuition to Rs1,500 or less. We believe there would be at least 15,000-20,000 private schools in India generating a reasonable surplus.
Land Acres 3.0Rsm per acre 14.0Cost of land 42.01 acre = sf 43,560Number of sf 130,680Cost (Rs psf) 321.4Building Sqft needed per student 50.0Cost of building psf (Rs) 700.0Total sf needed 108,000Cost of building 75.6Computers Number of computers needed 75Cost per computer (Rs) 50,000Computer cost 3.8Computer cost per student (Rs) 1,736Other equipment Furniture cost per student (Rs) 2,000Science lab equipment cost per student (Rs) 2,500Sports equipment cost per student (Rs) 2,000Total cost per student of other equipment (Rs) 6,500Total cost of other equipment 14.0Library books (10,000 books @Rs500 each) 5.0Other contingency costs 5.0Total capex needed 145.4Source: CLSA Asia-Pacific Markets, Discussions with professionals running schools
Typical completion and capex schedule (Rsm)
Years 0 1 2 3Land 42.0 Building % completion (based on next year enrolment) 33 52 74 100Building cost 25.2 14.0 16.8 19.6Computers 1.3 0.7 0.8 1.0Other equipment 4.7 2.6 3.1 3.6Library 1.7 0.9 1.1 1.3Other costs 2.5 2.5 - -Total capex, initial 77.3 20.7 21.9 25.5Source: CLSA Asia-Pacific Markets, Discussions with professionals running schools
Surplus under scenarios of teacher salary and monthly tuition fee
Average base salary of a teacher per month (12% allowances not included)
Source: CLSA Asia-Pacific Markets, Discussions with professionals running schools
Simulation 2: Non-profit trust, liaises with suppliers In real life, given that most schools are structured as non-profit trusts, the surplus retained within the trust is only marginal, perhaps 0-5% of the total annual income from tuition and admissions. Profit is made at the supplier level, from school management to equipment provision.
School management could include security, student supervision and monitoring, teacher training, examinations, educational tours and the holding of parent-teacher meetings. Within technology services, suppliers could provide school management (database) software, library management software, setting up and maintaining the computer room, hosting and maintaining the school web portal or the alumni portal. Payments could be made to intellectual property, which includes brand licensing payments, lesson plans, textbooks, specific methodologies at the preschool level, online tutoring and lesson help services (access). Payments could also be made for multimedia content within the classroom, such as Smart Class, a product of Educomp. Most of these services can be converted to a charge per student per month.
Land used by the school is also usually leased, typically for an amount equivalent to 14-15% of the school’s capex, plus a service fee, which could be 4-5% of annual collections from tuitions and admissions. The service fee goes partly to such items as maintenance services for the school buildings. Adding the numbers, we note that for each US$100 collected by the school, US$40 is running costs, US$22 for the land lease, US$36 to suppliers, and US$2 is retained. The trust makes no or very little money.
Payment structures
(Rsm)
Steady state revenue per year, per school 120.0
Steady state Ebit (surplus) per year per school (%) 60
Fee to suppliers, per month per student (Rs)
IPR related fees 600
Technology related services 300
School management services 600
Multimedia education product inside the classroom 150
Total fee per month per student (Rs) 1,650
Total fee for all students 43
% of school collections 36
Fee to lessor
Lease rental = 14.5% of capex 21
Fee revenue = 4.5% of collections 5
Total payment to lessor 26
% of school collections 22
Total payment to suppliers (%) 58
Surplus left in school trust (%) 2Source: CLSA Asia-Pacific Markets, Discussions with professionals running schools
Sarva Shiksha Abhiyan Sarva Shiksha Abhiyan (SSA, or “education for all”) is a flagship programme of the Government of India aimed at achieving universal education as mandated by the 86th amendment to the Constitution. This amendment makes free education of children aged 6-14 (some 205 million in number as of 2001) a fundamental right. SSA aims to achieve this goal by 2010.
The programme seeks to open new schools in those habitations which do not have schooling facilities and strengthen existing school infrastructure through provision of additional class rooms, toilets, drinking water, maintenance grant and school improvement grants. Existing schools with inadequate teacher strength are provided with additional teachers, while the capacity of existing teachers is being strengthened by extensive training, grants for developing teaching-learning materials and strengthening of the academic support structure at a cluster, block and district level. SSA seeks to provide quality elementary education including life skills. SSA has a special focus on girls’ education and children with special needs. SSA also seeks to provide computer education to bridge the digital divide. The financial assistance under the programme of SSA was on a 85:15 sharing arrangement (85% Central government, 15% states) during the Ninth Five-Year Plan, and moved to 75:25 during the 10th Five-Year Plan, with 50:50 thereafter.
(Rsbn) Outlay on education Outlay on SSA Expenditure
10th Plan (2002-07) 438.2 170.0 280.8
11th Plan (2007-12) 2,733.3 720.0
Source: CLSA Asia-Pacific Markets, Department of Education, Planning Commission India
Education cess An education cess at the rate of 2% of the aggregate duties of customs, excise and service tax was imposed as part of the finance bill introduced in Jul’04 to fund basic education in India. An additional 1% cess called “Secondary and Higher Education Cess” was imposed on customs and excise duty to fund the expansion of capacity in institutions for higher education.
Collections from education cess have risen significantly
(Rsbn) Education cess Total
Direct tax Indirect tax
FY07 40.3 46.42 86.7
FY06 32.13 44.24 76.4
FY05 18.04 25.14 43.2
Source: CLSA Asia-Pacific Markets, Government of India Ministry of Finance
School enrolment in India (m) Primary (Grades 1-5) Middle (Grades 6-8) Secondary (Grades 9-12) Total enrolment
Boys Girls Total Boys Girls Total Boys Girls Total Boys Girls Total
Appendix 3: Regulations elsewhere Korea, Brazil, Singapore, UK, US Section 3 of this report discusses the regulatory ambiguity around certain aspects of Indian education. This appendix looks at regulations surrounding education in other countries, some of which are instructive from an Indian context, be it in terms of “for profit” education, or the structure of public-private partnerships in K-12 and higher education.
Korea The current education system of Korea was established according to the Education Law enacted in 1949. The school system is a linear one of 6-3-3-4, consisting six years of elementary school, three years of middle school, three years of high school and four years of college or university.
Regulation Low regulatory barrier to establish and operate a private educational institution. Prospective owner just needs to submit papers to the local superintendent of education before setting up an educational institution.
Private sector is allowed to enter all areas of education by market type (exam-prep, personal tutoring, reference materials, online/offline, publishing, etc) and age group (preschool to adult).
Fees for offline institutions are regulated - fees cannot increase faster than inflation. The absolute amount is regulated as well, although this amount varies depending on subject and age group.
Government has exempted private schools from taxation in acquisition and sale of properties related to school education and provides subsidies to cover shortages of remuneration of teachers and operational costs. Loans are provided through the ‘Korea Private School Promotion Foundation’ to help private schools with expansion and renovation of facilities.
Government policy focus English in public schools: English takes up the bulk of private education spend in Korea. Some measures suggested by the new government include giving English lectures in English (not just for the conversation classes but for reading, writing, grammar classes as well) and improving quality of English teachers by hiring outside of the regular teacher pool and recruiting people with good English capabilities (even though they may not have a teaching background), such as Korean-Americans.
After-school classes: Public schools are partnering with private institutions to provide classes after regular school hours. Currently the subjects that are open to the private sector are limited (essay-writing, computers) but more subjects are expected to be available to private operators in the future.
Subsidy from government: Local governments are partnering with private institutions to build community learning centres where private English education is offered at a government-subsidised fee.
English training - Skill development boost from govt EPIK is an interesting example of a government-promoted skill-enhancement programme that India could replicate both for language and for vocational training. EPIK, or the English Programme in Korea, is sponsored by Ministry of Education and puts native English speakers in public schools. Established in 1995, the aim was to improve the English-speaking ability of students and teachers, foster international exchanges, and reform teaching methodologies employed in Korean schools.
Seoul English Village, the first in Korea, started with funding from the local municipality. Management was assigned to Herald Media, owners of the largest English newspaper in Korea. After initial financial problems characteristic of any pioneering venture, the operation is now profitable. Fees are capped by
the Seoul city government. The village costs US$2.3m a year to operate.
Several other villages began operating in 2005 in Incheon (annual budget US$1.7m) and Seongnam (start-up budget US$2.3m). Villages in Asan and Mokpo opened in 2006-07.
In April 2006, Paju, Kyonggi-do commenced operations, built round the 3E model of “education, entertainment and experience”. The provincial government spent US$97m an English-language theme park, complete with tramway. English is incorporated into a range of activities, including cooking classes. Funding was derived from the education board as well as the province’s general development budget.
Brazil Education is under the supervision of the Ministry of Education and Sports, assisted by the National Council for Education. States are directly responsible for the administration of elementary and secondary education. The Ministry of Education has ultimate control over most aspects of higher education. The principal standard-setting agency is Federal Council of Education.
Brazil's education system is financed by funds from both the public sector (through direct and indirect administration agencies at the federal, state and municipal levels of government) and the private sector, which charges tuition fees. Brazil’s Constitution allocates 25% of state and local tax revenues to education. The public expenditure on education, as a percentage of GNP, at the present moment is 4.8%. The education system is divided into three levels: nine years of fundamental education, three years of secondary education and four years of higher education. Preschool or infant education is added to this hierarchical structure, for the purpose of providing assistance to children younger than seven years of age.
Regulation Private-sector participation is subject to government approval.
The government does not interfere in fees/profitability of any private-sector educational institution.
Government reforms Created a new category of institutions, the “university centres”, which enjoy most of the legal privileges as universities, have greater autonomy over curricula and enrolments and have a mandate to concentrate on undergraduate teaching instead of research.
Creation of shorter courses in which a student attains a degree in only 2 years. Annual evaluation of all institutions of higher education.
25% of state and local tax revenues go to education
Bolsa Escola – Rewarding education Bolsa Escola is based on a very simple premise that if children do not study regularly because they have to work, then they will stop working and go to school only if they or their families have the necessary funds. The Bolsa Escola programme was designed based on this simple notion and families who fulfilled the following conditions were invited to participate and received a stipend:
Their income levels were below the national poverty level.
All the children in the family of school age had to be enrolled in school (no exceptions).
The family ensures children did not miss more than two days of class per month. If even one of the children missed more than two days of classes, the family gets no money that month under the Bolsa Escola programme.
Bolsa Escola was introduced on a national-scale in 2001, building on earlier municipal-level program
initiatives. By late 2003, it was in use in almost all of Brazil’s 5,561 municipalities, providing nearly US$500m in stipends for 8.6m children from 5.1m families. In October 2003, Bolsa Escola was merged with three other transfer programmes. The Bolsa Familia Programme aims to reach 11.2m families (or 44m people).
Many aspects of programme implementation for Bolsa Escola devolved to municipal governments, including the identification and selection of beneficiaries, monitoring and enforcement of conditions and management of local accountability mechanisms. Payment of benefits was retained by central agencies. This resulted in considerable variation in the manner in which municipalities chose to implement the programme, providing a unique opportunity to explore how differences in institutional settings lead to different choices in targeting, monitoring and enforcement, and accountability instruments and practices.
Fundef - Innovative funding Brazil set up its educational funding programme Fundef in 1996 and by January 1998 it was in operation in all states. Fundef introduced national minimums for spending per student in Grades 1-8, and imposed a framework for the allocation of funds between the state and municipal public school networks. The federal government was also required to top up spending in jurisdictions unable to achieve the national minimums.
Fundef draws on revenue allocations at the federal, state and municipal levels, as well as revenue from state value-added taxes and federal export taxes, among others. Funding is allocated according to the number of students enrolled.
At least 60 per cent of Fundef allocations must be spent on teachers, the remainder on clearly defined operation and maintenance. School councils monitor the allocation of Fundef resources.
Singapore Education in Singapore is under the supervision of Ministry of Education. The education system is divided into five levels - three years of preschool, four years of foundation primary and two years of orientation primary school, four-to-five years of secondary school, two-to-three years of college and finally university.
Regulation Private schools need to be approved by the ministry and are governed by the Education Act.
Private schools can be set up at any level, but the government recognises only its four universities. Singapore does have foreign universities, but qualifications gained are not locally recognised.
The ministry does not interfere in fees or profitability.
Government policy focus Singapore wants to provide more tertiary education options, especially in the vocational space, and is exploring the establishment of either a technical university or a liberal arts college.
Edusave scheme - An overview Started in 1993, the Edusave Scheme rewards students who perform well or who make good progress in their academic and non-academic work, and provides students and schools with funds to pay for enrichment programmes or to purchase additional resources. The Edusave Endowment Fund is built up from government contributions. The fund is invested by the government and the interest earned is used to finance the contributions, grants and awards given to schools and students. The Government contributed an initial capital sum of S$1bn to the fund in 1993.
i) Edusave Pupils Fund: Children aged six-to-16 have an Edusave account, into which the government makes an annual contribution- essentially, the government pays for education directly. Prior to
2004, only the first three children in a family were eligible. Payments in 2008 were S$180 for primary students and S$220 for secondary students.
ii) Edusave grants: All primary and secondary schools, junior colleges, centralised institutes, institutes of technical education and special education schools receive annual Edusave grants to fund student resources.
There are various reward programmes for students who meet certain academic rankings, some of which are targeted at low-income households. They include the Edusave Scholarships, Edusave Merit Bursary, Good Progress Award, and Edusave Awards for Achievement and Good Leadership and Service.
Manpower 21 Plan - Enhancing employability In response to the workforce challenges of the new millennium, the Manpower 21 Plan was launched by the Singapore government to enhance competitive advantage in the global economy, particularly in knowledge-based industries. Its key strategies are:
Enhanced manpower information systems.
Lifelong learning for lifelong employability.
Augmenting the talent pool.
Transforming the work environment.
Developing a vibrant manpower industry.
Redefining partnerships.
United Kingdom Education in the England is the responsibility of the Department for Children, Schools and Families and the Department for Innovation, Universities and Skills. Local authorities are responsible for implementing policy for public education and state schooling. The compulsory education system is divided into three levels: three years of elementary school, four years of primary and five years of secondary school and two years of college. At the age of 16, students take the GCSE examination, which marks the end of compulsory education. The proposal is to make the school-leaving age 18 years but this is only likely by 2015.
Regulations The Independent Schools Inspectorate (ISI) ensures schools meet national statutory requirements. The government does not interfere in fees or profitability of independent schools, most are structured as charities and qualify for certain tax exemptions.
Higher Education Act 2004 allows profit-making degree institutions, but there is only one private university in the UK, the University of Buckingham.
Government programmes The Beacon Schools programme was established in 1998 and all types
and phases of state maintained schools were included. It identified high performing schools across England and was designed to build partnerships between these schools and represents examples of successful practice, with a view to sharing and spreading that effective practice to other schools to raise standards in pupil attainment.
For secondary schools, the leading edge partnership programme builds on the success and knowledge about collaborative practice gained from the Beacon Schools programme. It supports groups of secondary schools, including special schools, to work together to tackle some of the most intractable barriers to raising standards. Schools within these partnerships are committed to working collaboratively to design, develop, test and share innovative ideas to raise standards of teaching and learning where improvement is most urgently needed.
At the primary level, primary strategy learning networks are being established to help schools work together to raise standards of literacy and mathematics. Groups of primary schools establish themselves as a network with a particular learning focus and receive funding from the Department for Education and Skills to help plan and establish their networks. Local authorities play a key role in determining criteria, evaluating action plans, identifying support for networks and directing funding, based on knowledge of local context and priorities. The long-term aim is that all primary schools should be part of an effective learning network, with most expected to achieve that by 2008.
Specialist schools are an important part of the Government's plans to raise standards in secondary education. The target of 2,000 specialist schools was achieved 18 months ahead of schedule in February 2005. The specialist schools programme mobilises private-sector sponsors and government funding to achieve target standards in both specialisation and national curriculum requirements.
United States The compulsory education system is divided into three levels - seven years of elementary school, three years of middle school and four years of high school. Post-secondary education, college or university, commonly consists of four years of study. The private sector is active in all areas of education by market type and age group. There are no restrictions on fees charged.
No Child Left Behind Act – Progressive, controversial The No Child Left Behind Act of 2001 covers a number of federal programmes aimed at improving the performance of primary and secondary schools by increasing the standards of accountability for states, school districts and schools, as well as providing parents more flexibility in choosing the type of schools their children attend. It promotes an increased focus on reading and extends the Elementary and Secondary Education Act of 1965.
The act aims to:
Increase accountability for student performance: States, districts and schools that improve achievement will be rewarded. Failure will be sanctioned. Parents will know how well their child is learning, and that schools are held accountable for their effectiveness with annual state reading and math assessments in Grades 3-8.
Focus on what works: Federal dollars will be spent on effective, research based programs and practices. Funds will be targeted to improve schools and enhance teacher quality.
Reduce bureaucracy and increase flexibility: Additional flexibility will be provided to states and school districts, and flexible funding will be increased at the local level.
Empower parents: Parents will have more information about the quality of their child’s school. Students in persistently low-performing schools will be given a choice to change schools.
The ‘no child left behind’ policy has generated debate on efficacy and outcomes. Supporters claim it promotes systematic and frequent testing, which helps identify learning gaps early, and so remedial measures can be taken for student groups or for entire schools in time. A frequent criticism has been that it promotes standardized testing, and favours schools aiming to meet outcome targets by teaching within the limits of expected testing patterns and the like. As low-scoring schools are penalised, there are concerns the system will become less inclusive.
Appendix 4: Key US$1bn stocks This section provides a listing of meaningfully large (by market capitalisation) education stocks worldwide and their business description. This is a useful pointer to the future of investment themes in India, both in terms of portfolio offerings and scalability.
Raffles Education Raffles Education (SIN: R17) is a leading education group in Asia, expanding from an initial college in Singapore in 1990 to 28 colleges across Asia-Pacific under five brand names – Raffles University, Hartford Institute, China Education, Shanghai Zhongfa College and Oriental University City. Raffles University colleges and in eight Asian countries and comprise of 16 design institutes and two schools of psychology. Its Hartford institutes offer business management courses in eight colleges and seven countries. China Education offers degree programmes that lead to tertiary qualifications through its Tianjin University of Commerce. Shanghai Zhongfa College offers vocational and technical education, and serves as a feeder school for the group’s tertiary education system in China. Raffles Education also provides basic education through its associate company, Oriental Century. Its latest acquisition, Oriental University City, serves 54,000 students in 19 colleges. Raffles Education reported for the financial year ended June 2007 revenue of S$124m, with a 43% Ebit margin and net income of S$50.7m.
Apollo Group Apollo Group (Nasdaq: APOL) provides higher education to working adults through four owned and operated higher-learning institutions - the University of Phoenix, Western International University, Axia College (of the University of Phoenix), the College for Financial Planning, and the Institute for Professional Development. In FY07, Apollo reported revenue of US$2.7bn, with net income of US$409m. University of Phoenix, Apollo’s flagship university, is the largest private accredited university in the US. Apollo has joint educational agreements in China and India. As of 2007, the combined student enrolment at Apollo was 350,000 students. For the year ended December 2007, Apollo reported revenue of US$2,837m, with an operating margin of 23.4% and net income of US$433.8m.
Strayer Education Strayer Education (NASDAQ:STRA) is active in post-secondary education, through its wholly owned subsidiaries Strayer University, with 51 campuses in the US serving 36,000 students, and Strayer University Online. For the year ended December 2007, Strayer Edication reported revenue of US$318m, 30.7%n Ebit margin and net income of US$64.9m.
New Oriental Education & Technology Group New Oriental Education & Technology Group (NYSE:EDU). is a provider of private educational services in China, primarily English and other language training, test preparation, courses for admissions and assessment tests, primary and secondary school education, development and distribution of educational content and online education. For the year to May 2007, New Oriental had more than 1m students, with 601,000 in its language training programmes and 466,000 in its test preparation courses. Its network comprises 37 schools, 149 learning centres, 19 bookstores, 2,700 teachers in 35 cities and an online network with 3m registered users. For the financial year ended May 2007, the company reported revenue of RM1,044m with a 19.9% Ebit margin and net income of RM226.7m.
ABC Learning Centres ABC Learning Centres (ASX:ABS) is an Australian company and major provider of early-education and care services to children between the ages of 6 weeks and 12 years. ABC owns and operates 2,238 childcare centres in Australia, New Zealand, the US and the UK. It has five US brands - The Children’s Courtyard, Childtime Learning Centres, La Petite Academy, Montessori Unlimited and Tutor Time Child Care/Learning Centers. In the UK, it is primarily active through the Busy Bee network. In FY07, ABC reported net sales of A$1696.4m, with an operating margin of 17.4% and net income of A$143.1m.
Benesse Corp Benesse Corp (TYO:9783) is a Japan-based educational service provider offering home-study courses, English-teaching materials and practice tests for university entrance examinations and English proficiency exams. It publishes magazines and operates websites, as well as offering a home-delivery food service. Benesse if further involved in aged care provision, including nurse training and recruitment. The company is also engaged in telemarketing and information processing service businesses, as well as the development and sale of systems. It has 31 subsidiaries and two associate companies. Net sales for FY07 were ¥354.6bn, with an operating margin of 41.7% and net income of ¥18.2bn.
MegaStudy Megastudy (KDQ:072870) is a Korea-based company providing education services through video-on-demand online classes and study aids. Offline education services and provided by its network of institutes. In the year top December 2997, online service accounted for 68% or revenue, with offline making up the remainder. Megastudy acquired in November 2007 an 86.96% stake in a Korea-based company engaged in the dental education. For FY06, it reported revenue of W101.2bn, with an operating margin of 31.9% and a net income of W26.4bn.
Anhanguera Educacional Participações Founded in 1994, Anhanguera Educacional Participações (SAO:AEDU11) is one of the leading private, for-profit postsecondary education companies in Brazil. It offers 48 degree programmes, primarily at the bachelor level, in business, law, engineering, health, and other applied social sciences. As of end-December 2007, it had 19 campuses with enrolment of 50,000.
Devry DeVry (NYSE:DV) owns and operates through its wholly-owned subsidiaries DeVry University, Ross University, Chamberlain College of Nursing, and Becker Professional Review, which prepares students for certified public accountant (CPA) and chartered financial analyst (CFA) examinations, as well as continuing professional education programmes and seminars. In November 2007, DeVry acquired Advanced Academics Inc (AAI), a provider of online secondary education. For the year ending June 2007, Devry reported revenue of US$933.5m, with an operating margin of 10.9% and net income of US$76.19m.
ITT Educational Services ITT Educational Services (ITT/ESI) (NYSE:ESI), incorporated in 1946, is a provider of postsecondary degree programs in the US with some 93 accredited technical institutes in 34 states serving 49,000 students. In the year to December 2007, ITT reported revenue of US$869.5m, with an operating margin of 27.8% and net income of US$151.6m.
Career Education Corp Career Education Corp (CEC) (Nasdaq:CECO) is an educational services company operating in six segments, with 71 on-ground campuses serving over 98,000 students across the US, France, Canada, Italy and the UK. Schools include the International Academy of Design and Technology, Le Cordon Bleu and Kitchen Academy and Sanford-Brown in health education, as well as the American Intercontinental University (AIU) and Colorado Technical University CEC is active in the development of a range of short-term online learning and informational programs that generate revenue through the sale of products, premium digital content and advertising space. In the year to December 2006, CEC reported revenue of US$1785.6bn, with an operating margin of 9.3% and net income of US$46.6m.
The CLSA Group, CLSA's analysts and/or their associates do and from time to time seek to establish business or financial relationships with companies covered in their research reports. As a result, investors should be aware that CLSA and/or such individuals may have one or more conflicts of interests that could affect the objectivity of this report. The Hong Kong Securities and Futures Commission requires disclosure of certain relationships and interests with respect to companies covered in CLSA's research reports and the securities of which are listed on The Stock Exchange of Hong Kong Limited and such details are available at www.clsa.com/member/research_disclosures/. Disclosures therein include the position of the CLSA Group only and do not reflect those of Calyon and/or its affiliates. If investors have any difficulty accessing this website, please contact [email protected] on (852) 2600 8111. If you require disclosure information on previous dates, please contact [email protected]
The CLSA Group, CLSA's analysts and/or their associates do and from time to time seek to establish business or financial relationships with companies covered in their research reports. As a result, investors should be aware that CLSA and/or such individuals may have one or more conflicts of interests that could affect the objectivity of this report. The Hong Kong Securities and Futures Commission requires disclosure of certain relationships and interests with respect to companies covered in CLSA's research reports and the securities of which are listed on The Stock Exchange of Hong Kong Limited and such details are available at www.clsa.com/member/research_disclosures/. Disclosures therein include the position of the CLSA Group only and do not reflect those of Calyon and/or its affiliates. If investors have any difficulty accessing this website, please contact [email protected] on (852) 2600 8111. If you require disclosure information on previous dates, please contact [email protected]
Research & sales offices
www.clsa.com
China – Beijing CLSA Beijing Unit 10-12, Level 25 China World Trade Centre Tower 2 1 Jian Guo Men Wai Ave Beijing 100004 Tel : (86) 10 5965 2188 Fax : (86) 10 6505 2209
India CLSA India 8/F, Dalamal House Nariman Point Mumbai 400 021 Tel : (91) 22 6650 5050 Fax : (91) 22 2284 0271
Philippines CLSA Philippines 19/F, Tower Two The Enterprise Center 6766 Ayala corner Paseo de Roxas Makati City Tel : (63) 2 860 4000 Fax : (63) 2 860 4051
Thailand CLSA Thailand 16/F, M. Thai Tower All Seasons Place 87 Wireless Road, Lumpini Pathumwan, Bangkok 10330 Tel : (66) 2 257 4600 Fax : (66) 2 253 0532
China – Shanghai CLSA Shanghai 3/F, Suites 305-310 One Corporate Avenue No.222 Hubin Road Luwan District, Shanghai 200021 Tel : (86) 21 2306 6000 Fax : (86) 21 6340 6640
Indonesia CLSA Indonesia WISMA GKBI Suite 901 Jl Jendral Sudirman No.28 Jakarta 10210 Tel : (62) 21 2554 8888 Fax : (62) 21 574 6920
Singapore CLSA Singapore 9 Raffles Place, No.19-20/21 Republic Plaza II Singapore 048619 Tel : (65) 6416 7888 Fax : (65) 6533 8922
USA Calyon Securities (USA) Calyon Building 1301 Avenue of The Americas New York, New York 10019 Tel : (1) 212 408 5888 Fax : (1) 212 261 2502
China – Shenzhen CLSA Shenzhen Room 3111, Shun Hing Square Di Wang Commercial Centre 5002 Shennan Road East Shenzhen 518008 Tel : (86) 755 8246 1755 Fax : (86) 755 8246 1754
Japan Calyon Securities Japan 15/F, Shiodome Sumitomo Building 1-9-2, Higashi-Shimbashi Minato-ku, Tokyo 105-0021 Tel : (81) 3 4580 5533 (General) (81) 3 4580 8722 (Trading) Fax : (81) 3 4580 5896
Taiwan CLSA Taiwan 27/F, 95, Tun Hwa South Road Section 2 Taipei Tel : (886) 2 2326 8188 Fax : (886) 2 2326 8166
United Kingdom CLSA (UK) 12/F Moor House, 120 London Wall, London EC2Y 5ET Tel : (44) 207 614 7000 Fax : (44) 207 614 7070
Dubai Calyon Gulf Dubai World Trade Centre Level 32 PO Box 9256 Dubai United Arab Emirates Tel : (9714) 331 4211 Fax : (9714) 331 3201
Korea CLSA Korea 15/F, Sean Building 116, 1-Ka, Shinmun-Ro Chongro-Ku Seoul, 110-061 Tel : (82) 2 397 8400 Fax : (82) 2 771 8583
Hong Kong CLSA Hong Kong 18/F, One Pacific Place 88 Queensway Hong Kong Tel : (852) 2600 8888 Fax : (852) 2868 0189
Malaysia CLSA Malaysia Suite 20-01 Level 20 Menara Dion 27 Jalan Sultan Ismail 50250 Kuala Lumpur Tel : (60) 3 2056 7888 Fax : (60) 3 2056 7988
Key to CLSA investment rankings: BUY = Expected to outperform the local market by >10%; O-PF = Expected to outperform the local market by 0-10%; U-PF = Expected to underperform the local market by 0-10%; SELL = Expected to underperform the local market by >10%. Performance is defined as 12-month total return (including dividends).
may provide or have provided investment banking, capital markets and/or other services to, the entities referred to herein, their advisors and/or any other connected parties. This research report is being distributed into the United States of America by CLSA solely to persons who qualify as “Major U.S. Institutional Investors” as defined in Rule 15a-6 under the Securities and Exchange Act of 1934 and who deal with CALYON. However, the delivery of this research report to any person in the United States shall not be deemed a recommendation to effect any transactions in the securities discussed herein or an endorsement of any opinion expressed herein. Any recipient of this research in the United States wishing to effect a transaction in any security mentioned herein should do so by contacting Calyon Securities (USA), Inc. (a broker-dealer registered with the Securities and Exchange Commission) and an affiliate of CLSA. Japan: This publication/communication is distributed in Japan by Calyon Securities Japan, a member of the JSDA licensed to use the “CLSA” logo in Japan. United Kingdom: Notwithstanding anything to the contrary herein, the following applies where the publication/communication is distributed in and/or into the United Kingdom. This publication/communication is only for distribution and/or is only directed at persons (“permitted recipients”) who are (i) persons falling within Article 19 of the Financial Services and Markets Act 2000 (Financial Promotion) Order 2001 (the “FPO”) having professional experience in matters relating to investments or high net worth companies, unincorporated associations etc. falling within Article 49 of the FPO, and (ii) where an unregulated collective investment scheme (an “unregulated CIS”) is the subject of the publication/communication, also persons of a kind to whom the unregulated CIS may lawfully be promoted by a person authorised under the Financial Services and Markets Act 2000 (“FSMA”) by virtue of Section 238(5) of the FSMA. The investments or services to which this publication/communication relates are available only to permitted recipients and persons of any other description should not rely upon it. This publication/ communication may have been produced in circumstances such that it is not appropriate to categorise it as impartial in accordance with the FSA Rules. The analyst/s who compiled this publication/communication hereby state/s and confirm/s that the contents hereof truly reflect his/her/their views and opinions on the subject matter and that the analyst/s has/have not been placed under any undue influence or pressure by any person/s in compiling such publication/ communication.
MSCI-sourced information is the exclusive property of Morgan Stanley Capital International Inc. (MSCI). Without prior written permission of MSCI, this information and any other MSCI intellectual property may not be reproduced, redisseminated or used to create any financial products, including any indices. This information is provided on an "as is" basis. The user assumes the entire risk of any use made of this information. MSCI, its affiliates and any third party involved in, or related to, computing or compiling the information hereby expressly disclaim all warranties of originality, accuracy, completeness, merchantability or fitness for a particular purpose with respect to any of this information. Without limiting any of the foregoing, in no event shall MSCI, any of its affiliates or any third party involved in, or related to, computing or compiling the information have any liability for any damages of any kind. MSCI, Morgan Stanley Capital International and the MSCI indexes are services marks of MSCI and its affiliates. The Global Industry Classification Standard (GICS) was developed by and is the exclusive property of Morgan Stanley Capital International Inc. and Standard & Poor's. GICS is a service mark of MSCI and S&P and has been licensed for use by CLSA Asia-Pacific Markets. 22/02/2008
At CLSA we supportsustainable development.
We print on paper sourced from environmentally conservative factories that only use fibres