Working Paper 169 Indian Public Expenditures on Social Sector and Poverty Alleviation Programmes during the 1990s Abusaleh Shariff Prabir K. Ghosh Samir K. Mondal National Council of Applied Economic Research Human Development Division November 2002 Overseas Development Institute 111 Westminster Bridge Road London SE1 7JD UK
Transcript
Working Paper 169
Indian Public Expenditures on Social Sector andPoverty Alleviation Programmes during the 1990s
Abusaleh Shariff
Prabir K. Ghosh
Samir K. Mondal
National Council of Applied Economic ResearchHuman Development Division
November 2002
Overseas Development Institute111 Westminster Bridge Road
LondonSE1 7JD
UK
ii
Acknowledgements
The authors would like to thank Anil Gumber and Ratna Sudarshan for their important inputs.They also acknowledge Shashanka Bhide for his comments.
Abusaleh Shariff is Chief Economist and Head of the Human Development Programme at theNational Council of Applied Economic Research, Delhi.Email: [email protected]
Prabir K Ghosh is Research Assistant at the National Council of Applied Economic Research,Delhi.Email: [email protected]
Samir K Mondal is Junior Economist at the National Council of Applied Economic Research,Delhi.Email: [email protected]
All rights reserved. No part of this publication may be reproduced, stored in a retrieval system, ortransmitted in any form or by any means, electronic, mechanical, photocopying, recording orotherwise, without the prior written permission of the publishers.
iii
Contents
Abbreviations, Acronyms and Definitions of Local Terms viSummary viii
1. Introduction 11.1 Plan and non-Plan expenditure 11.2 Data sources 2
2. Trends in Centre and State Shares on Selected Expenditure Heads 32.1 Education, sports, arts and culture 52.2 Social sector 72.3 Poverty alleviation 9
3. State Expenditure (all States and Union Territories Aggregates) 123.1 State budgetary allocation 123.2 Rural Development (RD) 13
4. Central Budget Allocations 154.1 Education sector 164.2 Health sector 174.3 Poverty alleviation 18
5. Under-utilisation of Budgets 24
6. Discussion and Conclusions 26
References 30
Appendix Tables 31Table 1 Rates of exchange for the Rupee against US$ and £ Sterling, 1990–2002 31Table 2 Central Government's share of various budget heads (% of total expenditure) 31Table 3 All India head count ratios (HCRs) for rural, urban and combined areas (%) 31Table 4 Total (Centre plus States) expenditure (Rs bn) on various budgets heads
(constant 1993/4 prices) 32Table 5 Distribution (%) of State Governments’ budget expenditure to major budget heads,
1991–2000 33Table 6 Change (%) in State Government budget expenditure on major budget heads,
1991–2000 (constant 1993/4 prices) 34Table 7 Cumulative expenditure (Rs bn) by State Governments, 1991–2000
(constant 1993/4 prices) 35Table 8 Distribution (%) of Central Government budget expenditure on Social Services
Programmes, 1990–2002 36Table 9 Trends in Central Government budget expenditure on Social Services
Programmes, 1990–2002 (nominal prices, Rs bn) 37Table 10 Change (%) in Central Government budget expenditure on Social Services
Programmes, 1990–2002 (constant 1993/4 prices) 38Table 11 Trends in Central Government budget expenditure (bn Rs) on Social Services
Programmes, 1990–2002 (constant 1993/4 prices) 39
iv
Table 12 Distribution of Central Government budget expenditure on Rural and UrbanDevelopment, Food and Public Distribution and Social Justice with specialreference to Poverty Alleviation Programmes, 1990–2002 40
Table 13 Trends in Central Government budget expenditure on Rural and UrbanDevelopment, Food and Public Distribution and Social Justice with specialreference to Poverty Alleviation Programmes, 1990–2002 (nominal prices bn Rs) 41
Table 14 Change (%) in Central Government budget expenditure on Rural and Urban Development,Food and Public Distribution and Social Justice with special reference to PovertyAlleviation Programmes, 1990–2002 (constant 1993/4 prices) 42
Table 15 Trends in Central Government budget expenditure (Rs bn) on Rural and UrbanDevelopment, Food and Public Distribution and Social Justice with specialreference to Poverty Alleviation Programmes, 1990–2002 (constant 1993/4 prices) 43
List of BoxesBox 1 Overview of Social Sector Programmes 3Box 2 Overview of Poverty Alleviation Programmes 4
List of Figures
Figure 1 State and Central Government shares (%) of total expenditure on selectedbudget heads, 1999/2000 5
Figure 2 Change (%) in Government expenditure on Education (constant 1993/4 prices),1991–2000 6
Figure 3 State and Central Government expenditure on Education (% of GNP), 1991–2000 6Figure 4 Public expenditure (as % of GNP) on Education since the 1950s 6Figure 5 Central Government share (%) of total expenditure on Education, 1991–2000 7Figure 6 Total Government expenditure on Education (constant 1993/4 prices), 1991–2000 7Figure 7 Change (%) in Government expenditure on Health and Family Welfare
(constant 1993/4 prices), 1991–2002 7Figure 8 State and Central Government expenditure on Medical, Public Health and
Family Welfare (% of GNP), 1991–2000 7Figure 9 Central Government share (%) of total expenditure on Medical, Public Health
and Family Welfare, 1991–2000 8Figure 10 Total Government expenditure on Medical, Public Health and Family Welfare
(constant 1993/4 prices), 1991–2000 8Figure 11 Central Government share (%) of total expenditure on Medical and Public Health,
1995–2000 8Figure 12 Total Government expenditure on Medical and Public Health (constant 1993/4
prices), 1995–2000 8Figure 13 Central Government share (%) of total expenditure on Water Supply and
Sanitation, 1991–2000 9Figure 14 Total Government expenditure on Water Supply and Sanitation (constant
1993/4 prices), 1991–2000 9Figure 15 Head count poverty ratios (HCRs) for rural and urban India, 1973–2000 9Figure 16 Central Government share (%) of total expenditure on Rural Development,
1991–2000 10Figure 17 Total Government expenditure on Rural Development (constant 1993/4 prices),
1991–2000 10Figure 18 Central Government share (%) of total expenditure on Urban Development,
1991–2000 10
v
Figure 19 Total Government expenditure on Urban Development (constant 1993/4 prices),1991–2000 10
Figure 20 Central Government share (%) of total expenditure on Welfare of SCs, STsand OBCs, 1991–2000 11
Figure 21 Total Government expenditure on Welfare of SCs, STs and OBCs (constant1993/4 prices), 1991–2000 12
Figure 22 Trends in Development and Non-development expenditure by StateGovernments, 1991–2000 12
Figure 23 State Government expenditure (%) on key social sectors, 1991–2000 12Figure 24 Sector shares (%) in total Central Government budget allocations, 2001/2 15Figure 25 Share (%) of Social Sector and Poverty Alleviation Programmes in total Central
Government budget allocations, 2001/2 15Figure 26 Central Government expenditure on key social sectors, 1991–2002 15Figure 27 Central Government expenditure on Poverty Alleviation Programmes
(constant 1993/4 prices), 1990–2001 19Figure 28 Change (%) in Central Government expenditure on Poverty Alleviation
Programmes (constant 1993/4 prices), 1990–2001 23Figure 29 Central Government expenditure (as % of GNP) on Poverty Alleviation
Strategies, 1990–2001 23Figure 30 Gross fiscal deficit (% of GNP), 1991/2 to 1999/2000 26
vi
Abbreviations, Acronyms and Definitions of Local Terms
AAGR Annual Average Growth Rate (%)AAY Antyodaya Anna Yojana (Distribution of Food Grains to the Poor)AIDS Acquired Immune Deficiency SyndromeAPL Above the Poverty LineBALCO Bharat (India) Aluminum CompanyBE Budget EstimateBPL Below the Poverty LineCGHS Central Government Health SchemeCSP Centrally Sponsored ProgrammesDFID Department for International DevelopmentDPEP District Primary Education ProgrammeEAS Employment Assurance SchemeEC Economic CostESAC Education, Sports, Arts and CultureFCI Food Corporation of IndiaFII (CONCOR) Foreign Institutional Investor (Container Corporation)FW Family WelfareGAIL Gas Authority of India LimitedGoI Government of IndiaGDP Gross Domestic ProductGDR (VSNL) Global Depository Receipts (Videsh Sanchar Nigam Limited)
(International Transmission Corporation Limited)GDR (MTNL) Global Depository Receipts (Mahanagar Telephone Nigam Limited)
(Metropolitan Telephone Corporation Limited)GNP Gross National ProductGram Panchayat A body of elected representatives for governance at village levelHCR Head Count: Poverty RatioHFW Health and Family WelfareHIV Human Immuno-deficiency VirusIAY Indira Awas Yojana (Indira Housing Scheme)ICDS Integrated Child Development ServicesIDBI Industrial Development Bank of IndiaIEC Information Education and CommunicationIOC Indian Oil CorporationIT Information TechnologyJGSY Jawahar Gram Samridhi Yojana (Jawahar Rural Development Scheme)KCC Kisan (farmer) Credit CardMFIL Modern Food India LimitedMPHFW Medical, Public Health and Family WelfareMSP Minimum Support PriceNAOPS National Old Age Pension Scheme (NSAP)NE New EstimateNIPFP National Institute of Public Finance and PolicyNPE National Policies on EducationNRI Non-Resident IndianNSAP National Social Assistance ProgrammeNSPE Nutrition Support to Primary EducationNRY Nehru Rojgar Yojana (Nehru Employment Scheme)
vii
OBC Other Backward Castes, according to Articles 341 and 342 of theConstitution of India
Panchayati Raj A system of local self-governmentONGC Oil and Natural Gas CommissionPDS Public Distribution SystemPHFW Public Health and Family WelfarePMIUPEP Prime Minister’s Integrated Urban Poverty Eradication Programme (SJSRY)RBI Reserve Bank of IndiaRD Rural DevelopmentRE Revised EstimateRs RupeesSGSY Swarnajyothi Gram Swarojgar Yojana
(Golden Jubilee Urban Employment Scheme)SSA Sarva Shiksha Abhiyan (Movement for Education for All)SC Scheduled Caste, according to Articles 341 and 342 of the Constitution of
IndiaSoE Statement of ExpenditureST Scheduled Tribe, according to Articles 341 and 342 of the Constitution of
IndiaTB TuberculosisTDPS Targeted Public Distribution SystemUBSP Urban Basic Services for the PoorUD Urban DevelopmentWSS Water Supply and SanitationWTO World Trade Organization
viii
Summary
This paper presents trends in public expenditure in the social and poverty-alleviation sectors since1990/91, about the time the Economic Reforms were initiated. Individual States account for aconsiderable proportion of this expenditure, but in India the Centre’s share of expenditure seems tobe increasing over time. This paper therefore analyses trends in State expenditure, expenditure bythe Central government through annual budgets, Centre- and State-adjusted combined expenditure.Overall it appears that expenditure on social-sector schemes is increasing in real terms, but mainlythrough increased expenditure by the Centre. Thus, the State Governments seem to be easing out oftheir constitutional commitment to sustain programmes in social sectors, this is a matter of concern.There are large inter-sectoral reallocations of funds in the poverty-alleviation sectors. One majordevelopment has been that huge funds that were allocated to employment-generation strategies havenow been diverted to the rural road-construction programme. While the previous employment-generation programmes were both inefficient and unproductive, they were aimed at providing dailywages through employment generation. This provided income to sustain the bare minimum ofrequired nutrition. The reallocation of poverty-alleviation funding may not generate employmentbecause rural road-construction activity is likely to be capital-intensive with labour replacingtechnology because of pressure to create rural infrastructure. A promise to link enhanced social-sector allocations to disinvestment proceeds after labour welfare functions are complete isdisillusionary, and should be a matter of concern to all. Another noteworthy aspect is that both theState and Central Governments do not fully utilise their allocated funds, especially in selectedprogrammes.
1
1 Introduction
Ever since India’s Independence, both its Central and State governments have claimed that theywant to work towards social development and the eradication of poverty. Much has been achievedin the past half century. For example, it is claimed that the incidence of poverty declined from over50% in the 1950s to 26% in the late 1990s, the literacy rate increased from less than 20% in 1951 to65% in 2001, and the infant mortality rate declined from 146 per 1000 live births in 1950s to 70 per1000 live births in 2000. In spite of these gains, the absolute and relative dimension of deprivationis still too large to be ignored by policy concerns. Therefore, how genuine is the governments’claim that poverty eradication and social development are the main challenges they face, and thattheir commitment to address these issues have continued over time?
Analysing the Indian National Budgets on Social Sector and Poverty Alleviation allocations andexpenditure of the 1990s is not simple. An analysis of the annual national budget in isolation ismeaningless unless the State scenarios are simultaneously analysed. This paper presents State-adjusted expenditure on, and allocations to the social and poverty-alleviation sectors in India. Whilethe National Budget contributes about one half of the total combined public expenditure of Statesand Centre, a disproportionately high share of expenditure on social sector and poverty alleviationis provided by the State Governments. This is so because the social and poverty alleviation sectorsare either placed in the Concurrent or State Lists of the Indian Constitution making it the States’responsibility to make such investments. The States use both their own resources and thosetransferred by the Central Government according to the recommendations of the Finance andAnnual Planning Commission allocations. Often the States are also expected to share substantiallyin newly introduced plan programmes as a part of the national budget exercise. The net effectresults in the States bearing over 80% of the burden of expenditure on the social sector, and around60% of that on poverty-alleviation programmes but this is increasing over time. The followingdiscussion only presents the trends, direction, and extent of change in State-adjusted budgetaryallocations and expenditure in the social and poverty alleviation sectors. It does not dwell on thepositive developmental effects of expenditure, as the efficiency of reallocations has not beenanalysed. The following explanations might help to the terms used.
1.1 Plan and non-Plan expenditure
The Central Government budget categorises total expenditure (both revenue and capital) into Planand non-Plan expenditure. Plan expenditure (both revenue and capital) pertains to Central Plan andCentral assistance for State and Union Territory Plans. The Plan budget contains spending for newprogrammes associated with the current Five-Year Plan on both recurrent and capital spending,including virtually all capital spending. The non-Plan expenditure consists of regular governmentoperations, including programmes that have moved out of the Plan budget and into the regularappropriations process. Typically, the non-Plan budget contains no capital spending, although thereare minor exceptions to this generalisation.
1.1.1 Revenue expenditure
Relates to the normal running of Government of India (GoI) departments and various services,interest charges on debt incurred by the GoI, and grants given to State Governments and otherparties. Broadly, all expenditure of the Government, which does not result in the creation ofphysical or financial assets, treated as Revenue Expenditure.
2
1.1.2 Capital expenditure
That expenditure of the GoI that leads to the creation of physical or financial assets or reduction inrecurring financial liabilities falls into this category. Such expenditure pertains to payments onacquisition of such assets as land, buildings, machinery, and equipment, and to investments inshares, and loans and advances given to State Governments, public sector enterprises, and otherparties.
1.2 Data sources
The Centre’s Annual Budget provides detailed scheme-wise and budget-head specific ‘AnnualBudgetary Allocations’ and ‘Revised Estimates’ (RE) (that become available one year later).1 TheStates’ annual expenditure is available from the annual budgets of the respective StateGovernments. Often in case of the States, one finds a vast disparity between the budget allocationsand/or Revised Estimates to actual expenditure. Therefore, it is absolutely necessary to analyse theactual expenditure called ‘Accounts’ by the State Governments and provided annually by theReserve Bank of India (RBI). These data have a delay period of about 2 years For example, thelatest Accounts of the State Governments available in 2002 are those for the year 1999–2000.
A simple addition of the Centre and State expenditure data neither adds up to, nor presents a correctpicture of the total expenditure. Inter-governmental adjustments are needed to get an accuratepicture. Therefore, the States and Centre figures that are separately published by the RBI have beenadded together. The RBI then provides a separate series of total Centre and State expenditure thatagain do not match with the above total. An inter-governmental adjustment factor was computed bydividing the summed total figures of the Centre and State made by the authors, by the total Centreand State figures that are separately given [GOI, 2000, Table 99]. This deflator was applied on apro-rata basis to sectoral expenditure over time to the reported total State expenditure. However,when considering the following discussion, the deficiency of this pro-rata adjustment should beborne in mind, as it is impossible to determine a scheme and programme-specific adjustment factor.
A reasonable understanding of the pattern of expenditure on social and poverty alleviation sectorcan only be made if both the State and Centre expenditure series are interpreted both independentlyand, where necessary, in combination. This Working Paper has 6 sections that cover:
1. Introduction2. Analysis of the trends and scenarios of the combined total expenditure of both the Centre and
the States, and changes in Centre’s share of expenditure on a few some major budget-heads3. A presentation of State Government expenditure on social services that broadly conforms to
scheme-specific Social Sector and Poverty Alleviation Programmes4. An analysis of the Centre’s expenditure on Social Sectors and Poverty Alleviation Programmes5. The Phenomenon of budget under-utilisation6. Discussions and Conclusions
1. The final actual State expenditure is published as ‘Accounts’ by the Reserve Bank of India (RBI) which has been used to studystate adjusted expenditures. In case of National Budget, revised estimates are used in this analysis.
3
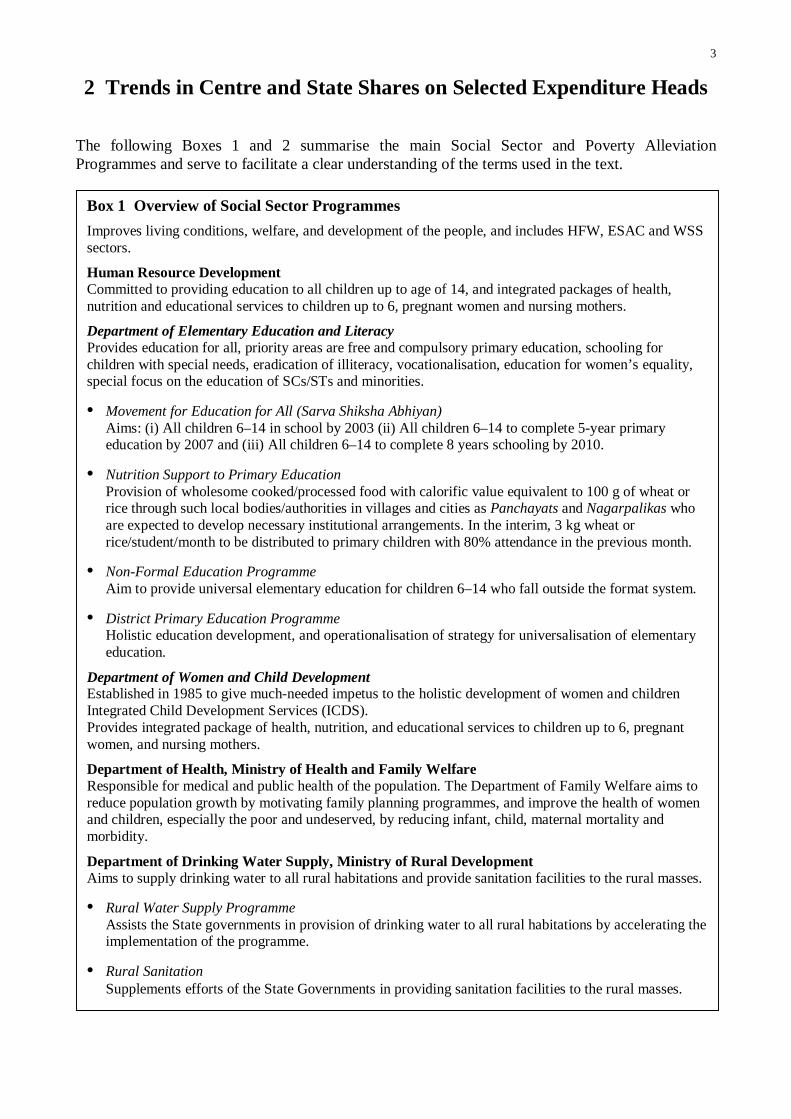
Box 1 Overview of Social Sector Programmes
Improves living conditions, welfare, and development of the people, and includes HFW, ESAC and WSSsectors.
Human Resource DevelopmentCommitted to providing education to all children up to age of 14, and integrated packages of health,nutrition and educational services to children up to 6, pregnant women and nursing mothers.
Department of Elementary Education and LiteracyProvides education for all, priority areas are free and compulsory primary education, schooling forchildren with special needs, eradication of illiteracy, vocationalisation, education for women’s equality,special focus on the education of SCs/STs and minorities.
• Movement for Education for All (Sarva Shiksha Abhiyan)Aims: (i) All children 6–14 in school by 2003 (ii) All children 6–14 to complete 5-year primaryeducation by 2007 and (iii) All children 6–14 to complete 8 years schooling by 2010.
• Nutrition Support to Primary EducationProvision of wholesome cooked/processed food with calorific value equivalent to 100 g of wheat orrice through such local bodies/authorities in villages and cities as Panchayats and Nagarpalikas whoare expected to develop necessary institutional arrangements. In the interim, 3 kg wheat orrice/student/month to be distributed to primary children with 80% attendance in the previous month.
• Non-Formal Education ProgrammeAim to provide universal elementary education for children 6–14 who fall outside the format system.
• District Primary Education ProgrammeHolistic education development, and operationalisation of strategy for universalisation of elementaryeducation.
Department of Women and Child DevelopmentEstablished in 1985 to give much-needed impetus to the holistic development of women and childrenIntegrated Child Development Services (ICDS).Provides integrated package of health, nutrition, and educational services to children up to 6, pregnantwomen, and nursing mothers.
Department of Health, Ministry of Health and Family WelfareResponsible for medical and public health of the population. The Department of Family Welfare aims toreduce population growth by motivating family planning programmes, and improve the health of womenand children, especially the poor and undeserved, by reducing infant, child, maternal mortality andmorbidity.
Department of Drinking Water Supply, Ministry of Rural DevelopmentAims to supply drinking water to all rural habitations and provide sanitation facilities to the rural masses.
• Rural Water Supply ProgrammeAssists the State governments in provision of drinking water to all rural habitations by accelerating theimplementation of the programme.
• Rural SanitationSupplements efforts of the State Governments in providing sanitation facilities to the rural masses.
2 Trends in Centre and State Shares on Selected Expenditure Heads
The following Boxes 1 and 2 summarise the main Social Sector and Poverty AlleviationProgrammes and serve to facilitate a clear understanding of the terms used in the text.
4
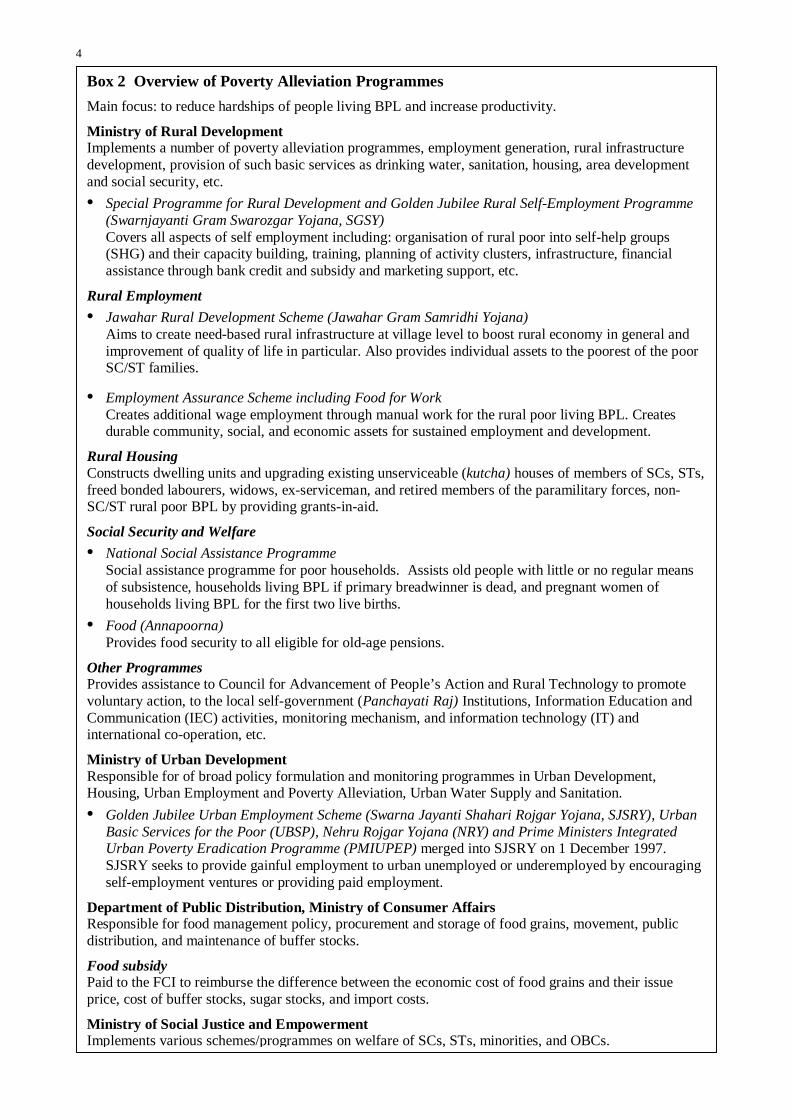
Box 2 Overview of Poverty Alleviation Programmes
Main focus: to reduce hardships of people living BPL and increase productivity.
Ministry of Rural DevelopmentImplements a number of poverty alleviation programmes, employment generation, rural infrastructuredevelopment, provision of such basic services as drinking water, sanitation, housing, area developmentand social security, etc.
• Special Programme for Rural Development and Golden Jubilee Rural Self-Employment Programme(Swarnjayanti Gram Swarozgar Yojana, SGSY)Covers all aspects of self employment including: organisation of rural poor into self-help groups(SHG) and their capacity building, training, planning of activity clusters, infrastructure, financialassistance through bank credit and subsidy and marketing support, etc.
Rural Employment
• Jawahar Rural Development Scheme (Jawahar Gram Samridhi Yojana)Aims to create need-based rural infrastructure at village level to boost rural economy in general andimprovement of quality of life in particular. Also provides individual assets to the poorest of the poorSC/ST families.
• Employment Assurance Scheme including Food for WorkCreates additional wage employment through manual work for the rural poor living BPL. Createsdurable community, social, and economic assets for sustained employment and development.
Rural HousingConstructs dwelling units and upgrading existing unserviceable (kutcha) houses of members of SCs, STs,freed bonded labourers, widows, ex-serviceman, and retired members of the paramilitary forces, non-SC/ST rural poor BPL by providing grants-in-aid.
Social Security and Welfare
• National Social Assistance ProgrammeSocial assistance programme for poor households. Assists old people with little or no regular meansof subsistence, households living BPL if primary breadwinner is dead, and pregnant women ofhouseholds living BPL for the first two live births.
• Food (Annapoorna)Provides food security to all eligible for old-age pensions.
Other ProgrammesProvides assistance to Council for Advancement of People’s Action and Rural Technology to promotevoluntary action, to the local self-government (Panchayati Raj) Institutions, Information Education andCommunication (IEC) activities, monitoring mechanism, and information technology (IT) andinternational co-operation, etc.
Ministry of Urban DevelopmentResponsible for of broad policy formulation and monitoring programmes in Urban Development,Housing, Urban Employment and Poverty Alleviation, Urban Water Supply and Sanitation.
• Golden Jubilee Urban Employment Scheme (Swarna Jayanti Shahari Rojgar Yojana, SJSRY), UrbanBasic Services for the Poor (UBSP), Nehru Rojgar Yojana (NRY) and Prime Ministers IntegratedUrban Poverty Eradication Programme (PMIUPEP) merged into SJSRY on 1 December 1997.SJSRY seeks to provide gainful employment to urban unemployed or underemployed by encouragingself-employment ventures or providing paid employment.
Department of Public Distribution, Ministry of Consumer AffairsResponsible for food management policy, procurement and storage of food grains, movement, publicdistribution, and maintenance of buffer stocks.
Food subsidyPaid to the FCI to reimburse the difference between the economic cost of food grains and their issueprice, cost of buffer stocks, sugar stocks, and import costs.
Ministry of Social Justice and EmpowermentImplements various schemes/programmes on welfare of SCs, STs, minorities, and OBCs.
5
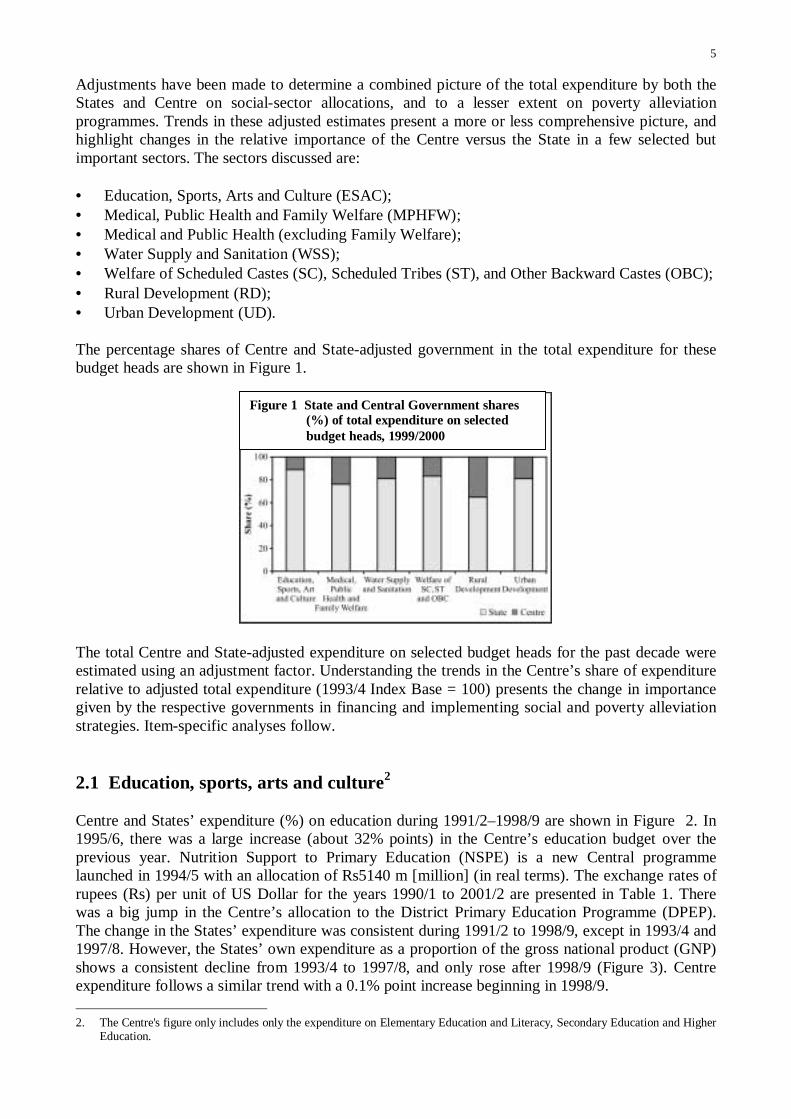
Adjustments have been made to determine a combined picture of the total expenditure by both theStates and Centre on social-sector allocations, and to a lesser extent on poverty alleviationprogrammes. Trends in these adjusted estimates present a more or less comprehensive picture, andhighlight changes in the relative importance of the Centre versus the State in a few selected butimportant sectors. The sectors discussed are:
• Education, Sports, Arts and Culture (ESAC);• Medical, Public Health and Family Welfare (MPHFW);• Medical and Public Health (excluding Family Welfare);• Water Supply and Sanitation (WSS);• Welfare of Scheduled Castes (SC), Scheduled Tribes (ST), and Other Backward Castes (OBC);• Rural Development (RD);• Urban Development (UD).
The percentage shares of Centre and State-adjusted government in the total expenditure for thesebudget heads are shown in Figure 1.
The total Centre and State-adjusted expenditure on selected budget heads for the past decade wereestimated using an adjustment factor. Understanding the trends in the Centre’s share of expenditurerelative to adjusted total expenditure (1993/4 Index Base = 100) presents the change in importancegiven by the respective governments in financing and implementing social and poverty alleviationstrategies. Item-specific analyses follow.
2.1 Education, sports, arts and culture2
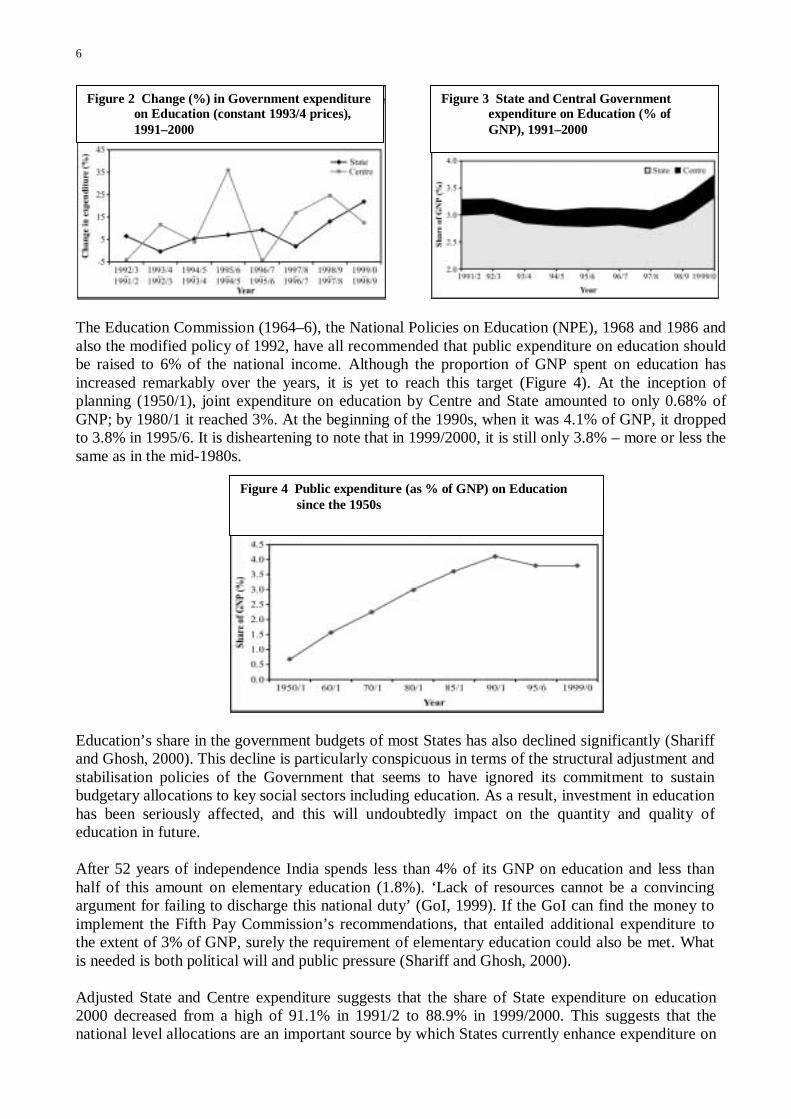
Centre and States’ expenditure (%) on education during 1991/2–1998/9 are shown in Figure 2. In1995/6, there was a large increase (about 32% points) in the Centre’s education budget over theprevious year. Nutrition Support to Primary Education (NSPE) is a new Central programmelaunched in 1994/5 with an allocation of Rs5140 m [million] (in real terms). The exchange rates ofrupees (Rs) per unit of US Dollar for the years 1990/1 to 2001/2 are presented in Table 1. Therewas a big jump in the Centre’s allocation to the District Primary Education Programme (DPEP).The change in the States’ expenditure was consistent during 1991/2 to 1998/9, except in 1993/4 and1997/8. However, the States’ own expenditure as a proportion of the gross national product (GNP)shows a consistent decline from 1993/4 to 1997/8, and only rose after 1998/9 (Figure 3). Centreexpenditure follows a similar trend with a 0.1% point increase beginning in 1998/9.
2. The Centre's figure only includes only the expenditure on Elementary Education and Literacy, Secondary Education and HigherEducation.
Figure 1 State and Central Government shares(%) of total expenditure on selectedbudget heads, 1999/2000
6
The Education Commission (1964–6), the National Policies on Education (NPE), 1968 and 1986 andalso the modified policy of 1992, have all recommended that public expenditure on education shouldbe raised to 6% of the national income. Although the proportion of GNP spent on education hasincreased remarkably over the years, it is yet to reach this target (Figure 4). At the inception ofplanning (1950/1), joint expenditure on education by Centre and State amounted to only 0.68% ofGNP; by 1980/1 it reached 3%. At the beginning of the 1990s, when it was 4.1% of GNP, it droppedto 3.8% in 1995/6. It is disheartening to note that in 1999/2000, it is still only 3.8% – more or less thesame as in the mid-1980s.
Education’s share in the government budgets of most States has also declined significantly (Shariffand Ghosh, 2000). This decline is particularly conspicuous in terms of the structural adjustment andstabilisation policies of the Government that seems to have ignored its commitment to sustainbudgetary allocations to key social sectors including education. As a result, investment in educationhas been seriously affected, and this will undoubtedly impact on the quantity and quality ofeducation in future.
After 52 years of independence India spends less than 4% of its GNP on education and less thanhalf of this amount on elementary education (1.8%). ‘Lack of resources cannot be a convincingargument for failing to discharge this national duty’ (GoI, 1999). If the GoI can find the money toimplement the Fifth Pay Commission’s recommendations, that entailed additional expenditure tothe extent of 3% of GNP, surely the requirement of elementary education could also be met. Whatis needed is both political will and public pressure (Shariff and Ghosh, 2000).
Adjusted State and Centre expenditure suggests that the share of State expenditure on education2000 decreased from a high of 91.1% in 1991/2 to 88.9% in 1999/2000. This suggests that thenational level allocations are an important source by which States currently enhance expenditure on
Figure 2 Change (%) in Government expenditureon Education (constant 1993/4 prices),1991–2000
Figure 3 State and Central Governmentexpenditure on Education (% ofGNP), 1991–2000
Figure 4 Public expenditure (as % of GNP) on Educationsince the 1950s
7
education (Table 2). For a trend analysis of State-adjusted expenditure on education between1980/1 and 1996/7 that confirms the increasing Centre share in education expenditure (Shariff andGhosh, 2000). This combined expenditure account shows a doubling-up (at constant 1993/4 prices)from Rs185.91 bn [billion] in 1991/2 to Rs370.33 bn in 1999/2000 (Table 4 and Figure 6). Theshare of Central Government expenditure also shows an upward increase with some fluctuations,from about 9% in 1991/2 to 11% in 1999/2000 (Figure 5).
2.2 Social sector
2.2.1 Health and Family Welfare (HFW)
The real-term percentage changes from year to year in expenditure on health by Centre and States isgiven in Figure 7. A large increase in both their budgets can be noticed in 1999/2000. This jump inCentre funding is due to a 33% increase in the allocation to the Family Welfare Programme largelyto its rural programme. It is also noticeable that State expenditure during the 1990s was lessvacillating than that of budget expenditure.
An analysis of combined Centre and State expenditure on HFW as a percentage of GNP suggests noimprovement over the years, despite increased allocations. This suggests that there was a consistentdecline in its proportion of the GNP from 1993/4 to 1998/9 and that it increased only marginallyduring 1999/2000 (Figure 8).
The Centre’s share of the combined expenditure on this sector is closer to one quarter, much higherthan that in the education sector. The rate of growth in State expenditure on health increased inrecent years as it did on education. However, the total share (15%) of the health sector in social
8
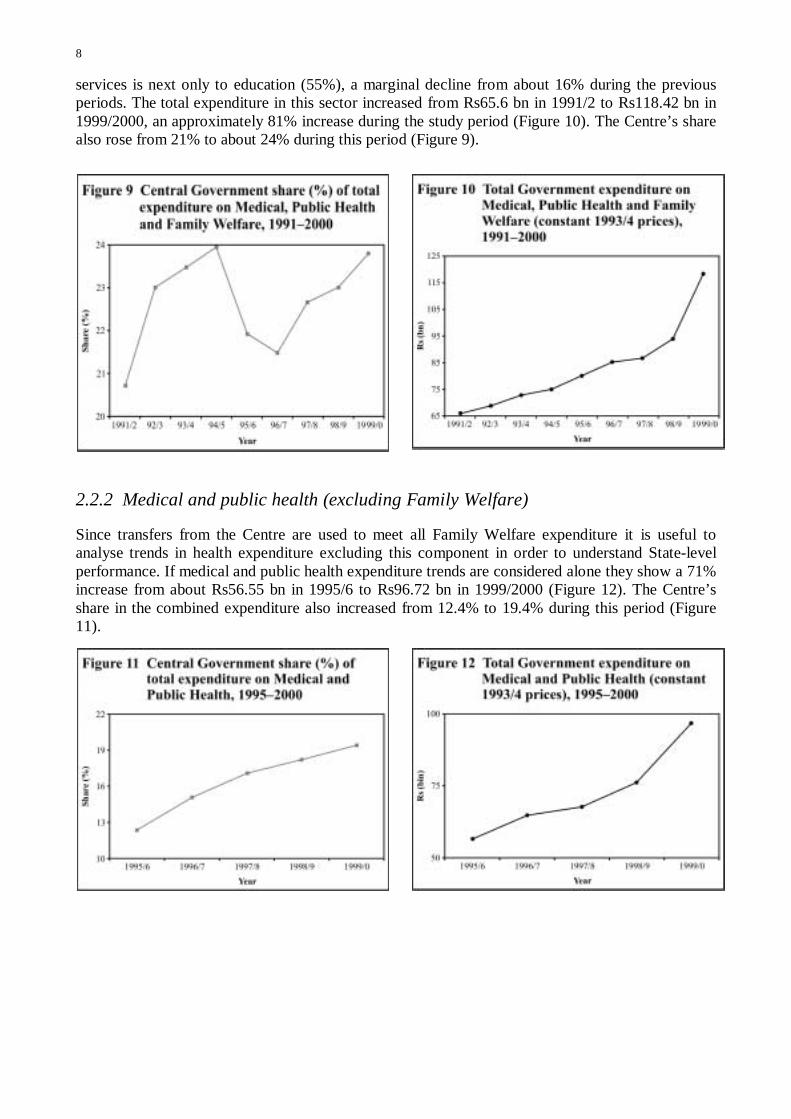
services is next only to education (55%), a marginal decline from about 16% during the previousperiods. The total expenditure in this sector increased from Rs65.6 bn in 1991/2 to Rs118.42 bn in1999/2000, an approximately 81% increase during the study period (Figure 10). The Centre’s sharealso rose from 21% to about 24% during this period (Figure 9).
2.2.2 Medical and public health (excluding Family Welfare)
Since transfers from the Centre are used to meet all Family Welfare expenditure it is useful toanalyse trends in health expenditure excluding this component in order to understand State-levelperformance. If medical and public health expenditure trends are considered alone they show a 71%increase from about Rs56.55 bn in 1995/6 to Rs96.72 bn in 1999/2000 (Figure 12). The Centre’sshare in the combined expenditure also increased from 12.4% to 19.4% during this period (Figure11).
9
2.2.3 Water Supply and Sanitation (WSS)
Expenditure on WSS aims not only to increase the quality of life but also to improve healthconditions. There was an increase from Rs29.13 bn in 1991/2 to Rs53.8 bn in 1999/2000, i.e. anincrease of about 86% during the decade (Figure 14). But the Centre’s share shows a decliningtrend with wide fluctuations from 21.5% to 18.8% (Figure 13).
2.3 Poverty alleviation
2.3.1 Head count poverty ratios (HCRs)
It is useful to begin with an analysis of the trends in HCRs that have been popular measures ofpoverty for about 30 years (Table 3). While poverty still persists, both in its absolute and relativedimensions, alleviation of poverty remain a major challenge to the nation even after 50 years sinceIndependence. A steadily declining trend in HCRs is obvious in the last two decades (Figure 15).
In absolute numbers about 58 m individuals are claimed to have come out of the poverty trap by1999/2000 from a high of 317 m in 1993/4, and leaving 259 m who are still poor (EconomicSurvey, 2001). This decline could be attributed to the positive impact of the economic reforms onthe one hand, and the improved efficiency of the poverty alleviation programmes introduced byboth the Centre and State governments on the other. But the debate about the spread and structureof decline was contrary to this trend until 2001, suggesting stagnation in rural poverty decline whileurban poverty declined slowly during the post-reform period (Kundu, 2001). There are contentiousdebates, first as to the level, direction, and change in poverty as it is currently defined, and to
10
whether the way poverty is defined captures all the dimensions of the deprivations that reflectpoorly upon the quality of life of those affected.
There are some common heads and programmes of expenditure, that directly or indirectly affect notonly the ‘poor’ but also the ‘neglected, deprived, and victims of inequality’ in terms of caste,gender, age and physical deficiency. These budget heads broadly fall in the departments of RD, UD,Social Justice and Empowerment and Food and Public Distribution. While discussing expenditureby Centre and States further subdivisions of these broad budget heads are discussed. However, it isnot practically possible to disaggregate all expenditure between Centre and the States, so, thefollowing aggregate picture presented only covers three broad budget heads.
2.3.2 Rural Development (RD)
Combined expenditure on RD increased only 50% from about Rs76.65 bn in 1991/2 to Rs115.5 bnin 1999/2000 (Figure 17). The Centre’s share increased from 30% to 35% during the period (Figure16). However, it showed an upward trend to 50% in 1995/6 that started declining from 1997/8.
2.3.3 Urban Development (UD)
The combined expenditure on this account increased more than twice, i.e. from Rs12.25 bn in1991/2 to Rs27.89 bn in 1999/2000 (Figure 19). However, the Centre’s share declined from 28% to19% over the whole period (Figure 18).
11
2.3.4 Welfare of Scheduled Castes (SCs), Scheduled Tribes (STs) and OtherBackward Castes (OBCs)
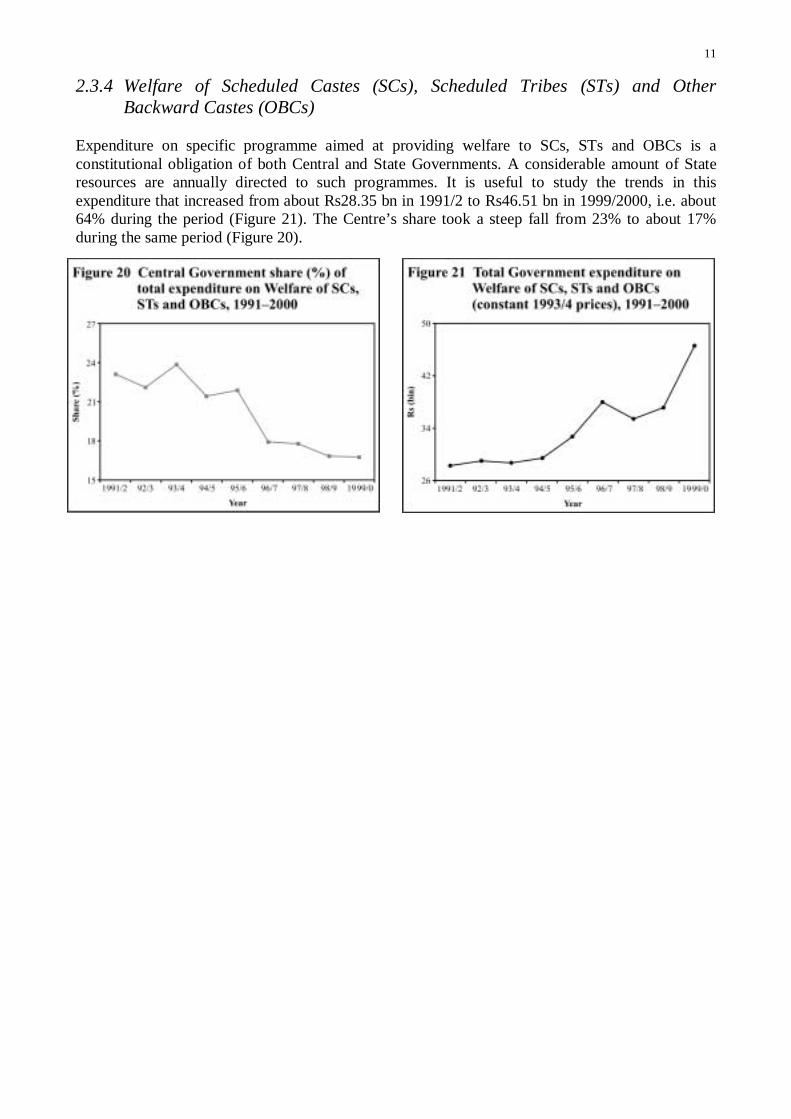
Expenditure on specific programme aimed at providing welfare to SCs, STs and OBCs is aconstitutional obligation of both Central and State Governments. A considerable amount of Stateresources are annually directed to such programmes. It is useful to study the trends in thisexpenditure that increased from about Rs28.35 bn in 1991/2 to Rs46.51 bn in 1999/2000, i.e. about64% during the period (Figure 21). The Centre’s share took a steep fall from 23% to about 17%during the same period (Figure 20).
12
3 State Expenditure (all States and Union Territories Aggregates)
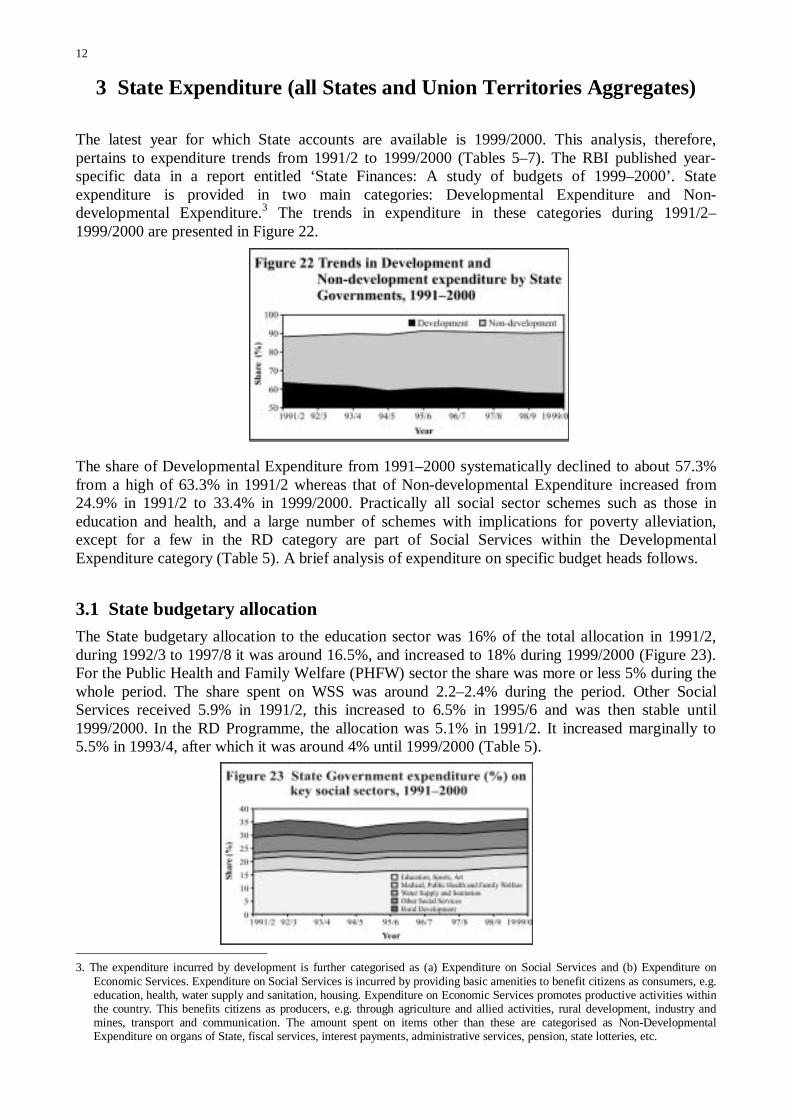
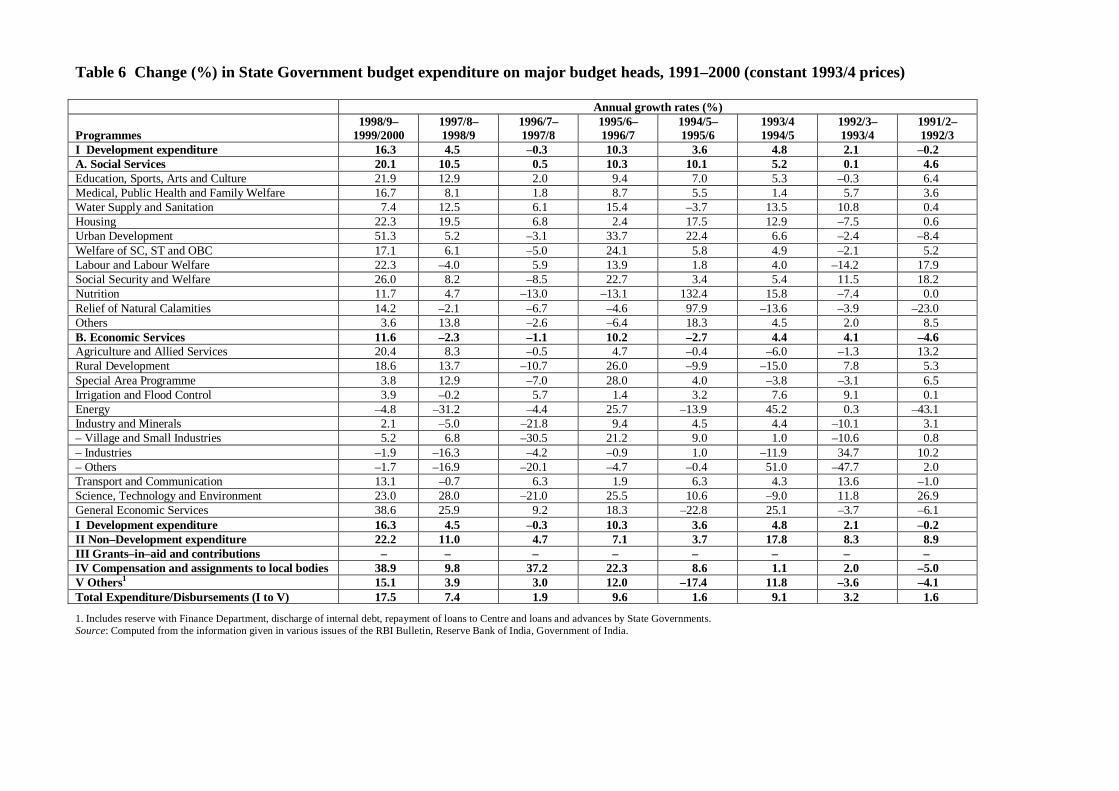
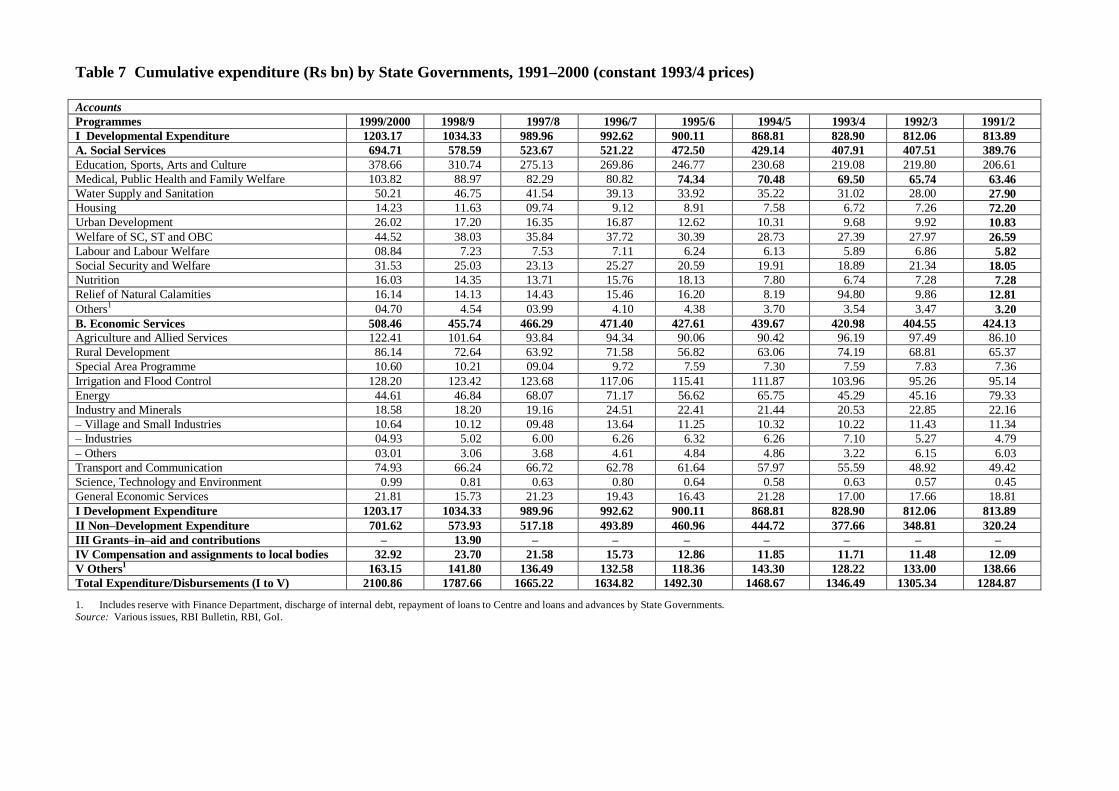
The latest year for which State accounts are available is 1999/2000. This analysis, therefore,pertains to expenditure trends from 1991/2 to 1999/2000 (Tables 5–7). The RBI published year-specific data in a report entitled ‘State Finances: A study of budgets of 1999–2000’. Stateexpenditure is provided in two main categories: Developmental Expenditure and Non-developmental Expenditure.3 The trends in expenditure in these categories during 1991/2–1999/2000 are presented in Figure 22.
The share of Developmental Expenditure from 1991–2000 systematically declined to about 57.3%from a high of 63.3% in 1991/2 whereas that of Non-developmental Expenditure increased from24.9% in 1991/2 to 33.4% in 1999/2000. Practically all social sector schemes such as those ineducation and health, and a large number of schemes with implications for poverty alleviation,except for a few in the RD category are part of Social Services within the DevelopmentalExpenditure category (Table 5). A brief analysis of expenditure on specific budget heads follows.
3.1 State budgetary allocationThe State budgetary allocation to the education sector was 16% of the total allocation in 1991/2,during 1992/3 to 1997/8 it was around 16.5%, and increased to 18% during 1999/2000 (Figure 23).For the Public Health and Family Welfare (PHFW) sector the share was more or less 5% during thewhole period. The share spent on WSS was around 2.2–2.4% during the period. Other SocialServices received 5.9% in 1991/2, this increased to 6.5% in 1995/6 and was then stable until1999/2000. In the RD Programme, the allocation was 5.1% in 1991/2. It increased marginally to5.5% in 1993/4, after which it was around 4% until 1999/2000 (Table 5).
3. The expenditure incurred by development is further categorised as (a) Expenditure on Social Services and (b) Expenditure onEconomic Services. Expenditure on Social Services is incurred by providing basic amenities to benefit citizens as consumers, e.g.education, health, water supply and sanitation, housing. Expenditure on Economic Services promotes productive activities withinthe country. This benefits citizens as producers, e.g. through agriculture and allied activities, rural development, industry andmines, transport and communication. The amount spent on items other than these are categorised as Non-DevelopmentalExpenditure on organs of State, fiscal services, interest payments, administrative services, pension, state lotteries, etc.
13
3.1.1 Social services – education
Social Services are sub-divided into 11 categories of which ESAC is the largest part. SocialServices received 58% of all State Developmental Expenditure in 1999/2000 but only 48% in1991/2. Simultaneously, the State share of expenditure on Education+ increased from about 53% to55%. The relative increase substantially occurred after 1997/8. Thus, the education sector aloneconstitutes more than one half of the total State Social Sector allocations as defined by the RBI, andabout 32% of the total Developmental Expenditure of the States.
There is evidence that State Expenditure on ESAC has increased, but is still far from adequate tobridge a vast literacy and enrolment gap that exists in India. From these data it is not possible toshow what type of intra-sectoral reallocations are taking place between primary, secondary, higher,and technical education.4
3.1.2 Health and Family Welfare (HFW)
The second dominant sector of State expenditure within the Social Services is MPHFW. Thissector’s share of total State developmental expenditure was 8.6% and expenditure on social serviceswas 15% in 1999/2000. The percentage increase in annual expenditure in real terms was negligibleexcept in 1998/9 and 1999/2000.
3.1.3 Other social services
An analysis of States’ expenditure suggests noteworthy improvements over previous yearsbeginning in 1995/6 in such sectors as Housing, UD, Welfare of SCs and STs, Social Security, andWelfare and Nutrition. However, the combined share of all these sectors in States’ developmentalexpenditure only increased from 9.3% in 1991/2 to 11.7% in 1999/2000.
3.2 Rural Development (RD)
RD is categorised as part of Economic Services in the developmental expenditure of Stategovernments, but much of the expenditure in this category has poverty alleviation impact. Theannual growth rates in this sector were considerable, but its relative share in Economic Servicesremained more or less constant at about 17% during the whole period.
In both Central and State governments’ budgets, all schemes categorised under the PovertyAlleviation Programme are put together under two broad expenditure heads: RD and UD. Centre-sponsored schemes under the Rural Poverty Alleviation Programmes implemented by Stategovernments and seen in 2001/2 budget documents are:
• Golden Jubilee Rural Self-Employment Programme (Swarnajyoti Gram Swarojgar Yojana);• Jawahar5 Rural Development Scheme (Jawahar Gram Samridhi Yojana);• Indira6 Housing Scheme (Indira Awas Yojana);• Employment Assurance Scheme (EAS);• National Social Assistance Programme (National Old Age Pension Scheme).
4. Shifts in intra-sectoral allocations within the Education Sector from 1980/1 to 1996/7 are discussed by Shariff and Ghosh (2000).5. Jawahar is the first name of the first Prime Minister of Independence India. His full name was Pandit Jawaharlal Nehru.6. Indira was Ex Prime Minister of India. Her full name was Indira Gandhi.
14
Apart from these, States have their own schemes under such programmes as CommunityDevelopment and Panchayats, and the Special Rural Works Programme that includes the ChiefMinister’s Special Rural Development Fund. However, State-level data on these programmes arenot easily available for deeper analysis.
There are, of course, other schemes apart from those specified under the heading RuralDevelopment. Although these programmes are not in the ‘poverty alleviation’ category, theycertainly aim to provide benefit to the weak and the distressed. ‘Social Welfare’ includes childwelfare including Integrated Child Development Services (ICDS), women’s welfare including theIndira Women (Mahila) Scheme (Mahila Yojana) and the key Nutrition Programme. But, these arecommon programmes that cover the urban population. Similarly, there are schemes to benefit thehandicapped, SC/ST/OBC, and tribal populations that do benefit the weaker sections who fall intothese categories.
There are of course other schemes apart from those specified under the heading Rural Development.Although these programmes are not in the ‘poverty alleviation’ category, they certainly aim toprovide benefit to the weak and the distressed. ‘Social Welfare’ includes child welfare includingICDS, women’s welfare including the Indira Women Scheme and key Nutrition Programme. But,these are common programmes that cover the urban population. Similarly, there are schemes tobenefit the handicapped, SC/ST/OBC, and tribal populations, which do benefit the weaker sectionswho fall into these categories.
15
4 Central Budget Allocations
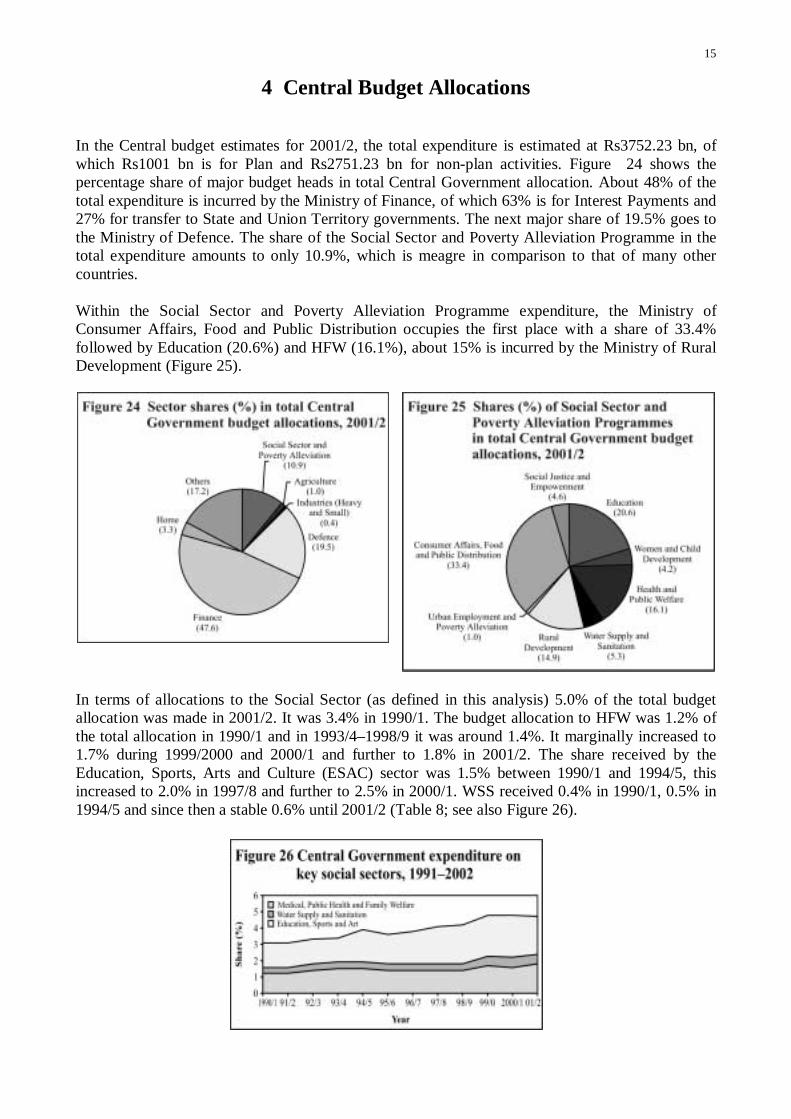
In the Central budget estimates for 2001/2, the total expenditure is estimated at Rs3752.23 bn, ofwhich Rs1001 bn is for Plan and Rs2751.23 bn for non-plan activities. Figure 24 shows thepercentage share of major budget heads in total Central Government allocation. About 48% of thetotal expenditure is incurred by the Ministry of Finance, of which 63% is for Interest Payments and27% for transfer to State and Union Territory governments. The next major share of 19.5% goes tothe Ministry of Defence. The share of the Social Sector and Poverty Alleviation Programme in thetotal expenditure amounts to only 10.9%, which is meagre in comparison to that of many othercountries.
Within the Social Sector and Poverty Alleviation Programme expenditure, the Ministry ofConsumer Affairs, Food and Public Distribution occupies the first place with a share of 33.4%followed by Education (20.6%) and HFW (16.1%), about 15% is incurred by the Ministry of RuralDevelopment (Figure 25).
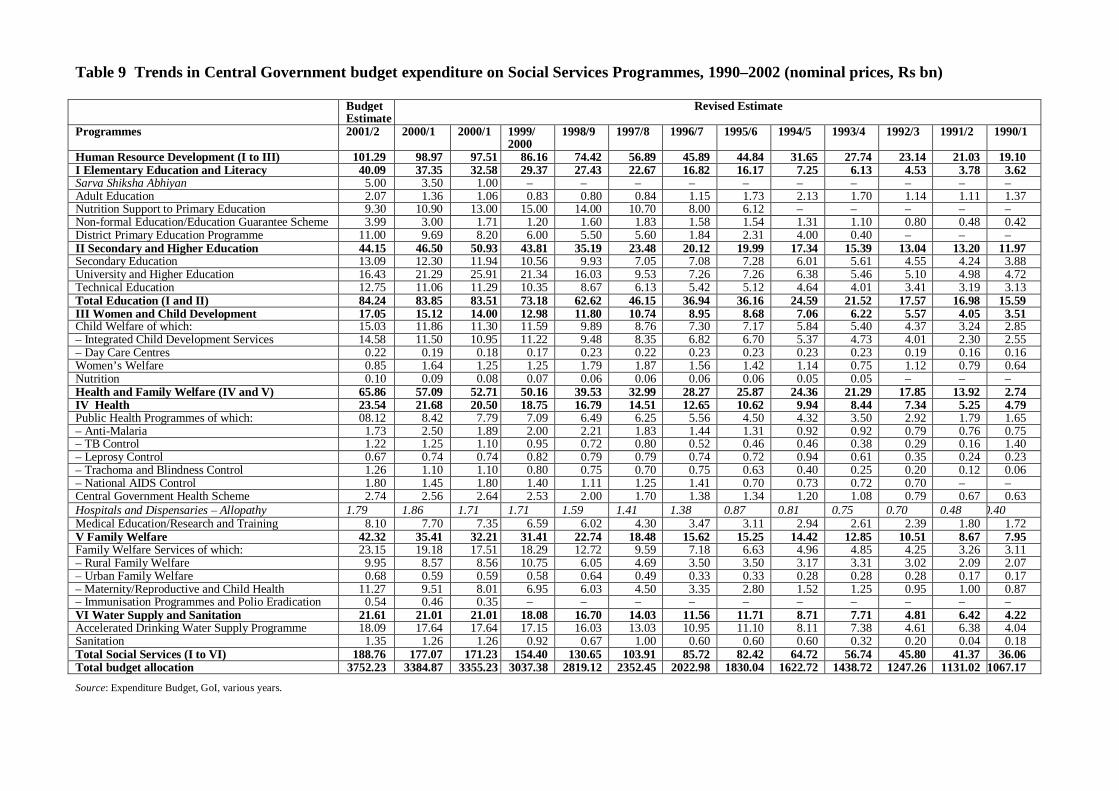
In terms of allocations to the Social Sector (as defined in this analysis) 5.0% of the total budgetallocation was made in 2001/2. It was 3.4% in 1990/1. The budget allocation to HFW was 1.2% ofthe total allocation in 1990/1 and in 1993/4–1998/9 it was around 1.4%. It marginally increased to1.7% during 1999/2000 and 2000/1 and further to 1.8% in 2001/2. The share received by theEducation, Sports, Arts and Culture (ESAC) sector was 1.5% between 1990/1 and 1994/5, thisincreased to 2.0% in 1997/8 and further to 2.5% in 2000/1. WSS received 0.4% in 1990/1, 0.5% in1994/5 and since then a stable 0.6% until 2001/2 (Table 8; see also Figure 26).
16
4.1 Education sector
Highlights:
• An integrated national education programme (Sarva Siksha Abhiyan) launched to standardiseelementary education with an allocation of Rs5 bn (at current prices);
• Technology education upgraded and expanded;• Role of the private sector to be encouraged.
Education draws in substantial State resources, in 2000 the States share in total educationexpenditure was 89% (State-adjusted total expenditure is discussed in Section 2). The importance ofthe Central budget is not so much in its absolute size, as the fact that it is expected to play astrategic role in identifying critical bottlenecks. The 1990s saw an increase in the priority given toelementary education (Tables 8–11). As a percentage of all resources for human resourcedevelopment, a significant upward shift occurred in 1995/6, and the proportionate sharecorrespondingly increased from around 22–23% to 36–37%. In the current budget the share is 39%.
4.1.1 Elementary education and literacy
At constant prices, the proposed increase in budget estimates (BE) is from Rs23.34 bn in 2000/1 toRs24.3 bn in 2001/2 at 1993/4 prices. Programmes that benefit include Operation Blackboard,Employment Guarantee Scheme, DPEP, Movement for Education for All (Sarva Siksha Abhiyan,SSA). Overall, the priority given to elementary education in the Central Government EducationBudget continues to increase, and rose from 21% in 1993/4 to 45% in 2001/2. Over the sameperiod, the share of secondary education from 26% to 15.5%, while that of higher education fellfrom 23% to 19.5%.
There has been a decline in the amount allocated for mid-day meals (around 24% of the total) by15%. The Mid-day Meal Scheme first made its appearance in 1995/6, and allocations to it continuedto increase until 1999/2000, when it accounted for 51% of the elementary education budget.Presumably, this was intended to be an incentive to draw a large number of out-of-school childreninto school, following the success of the scheme in Tamil Nadu. Since then, allocations have beenreduced with no clear reasons given for such a major shift in policy.
The thrust towards universal education is evident. Firstly, in the increased share of OperationBlackboard (14% of the total, 30% budgeted increase); the mainstream programmes of the DPEP(29% of the total, 13.5% budgeted increase); and the SSA (13% of the total, 43% budgetedincrease). Secondly, in the extension of the Education Guarantee Scheme, started in MadhyaPradesh in 1997, to the rest of the country (33% budgeted increase). In other words, a two-tracksystem is being used to try and meet the goal of universal primary education.
DecentralisationAn emphasis on decentralisation is also evident, but in different ways. ‘Community ownership’ isan important feature of United Nations/GoI education programme. In the case of SSA andEducation Guarantee Schemes it is explicitly mentioned that the schemes will be administeredthrough State-level registered societies, which therefore acquire some autonomy and run parallel tothe decentralised administrative structure. Concern has been expressed about such parallel systemsof governance will have on the Panchayati Raj (local self government) system.
17
External assistanceThe role of foreign assistance should be noted. Although small in absolute size (2.8% of the totalbudget, excluding DPEP; but 32% if DPEP is included), all the innovative programmes designed toreach out to disadvantaged groups and to girls who are out of school, have been developed withforeign assistance.
4.1.2 Secondary and higher-level education
There was an increase of 6.5% in secondary level education, but allocations to university and highereducation were slashed by 23%. There is a considerable emphasis on technical education throughsuch programmes as computer education in schools (increase of 181%) and the TechnologyDevelopment Mission. The main thrust of the secondary education budget is on the New Schools(Navodaya Vidyalayas) (34% of the total). These are residential schools spread all over the countryand inspired by the Andhra Pradesh Residential Schools; and Central Schools (KendriyaVidyalayas) (46% of the total) that are day schools meant for the children of government officials intransferable jobs. It should be noted that the budget for vocational education is only 3.2% of thetotal. The purpose of the ‘10+2’ system is to allow children to pursue options other than highereducation, but the resource allocation is at odds with this stated intention. If alternatives are to betaken seriously they need to be attractive and lead to certification in a range of other activities thathold out the promise of high returns. The current allocations do not suggest that this is being donewith any seriousness. The current allocation to Navodaya Vidyalayas is around Rs10.5 m/school; toKendriya Vidyalayas Rs68 m/school; and for vocational education only Rs65,500/school.
4.2 Health sector
Highlights:
• Plan allocation for MPHFW stepped up from Rs49.2 bn to Rs57.8 bn (at current prices);• Enhanced allocation for HIV (Human Immuno-deficiency Virus)/AIDS (Acquired Immune
Deficiency Syndrome) Control Programme to Rs1.8 bn;• Patenting and Information Education and Communication (IEC) about herbal products;• Strengthening State drug testing laboratories and pharmacies;• Provision of similar benefits to those enjoyed by the pharmaceutical industry to Indian systems
of medicine and homeopathy;• Reduction in price-control mechanisms for drugs and the pharmaceutical industry;• Universal coverage of Kisan (farmer) Credit Card (KCC) within next 3 years and expanded
benefits to include personal social insurance (accidental death and disability);• Development of rural infrastructure, including connectivity.
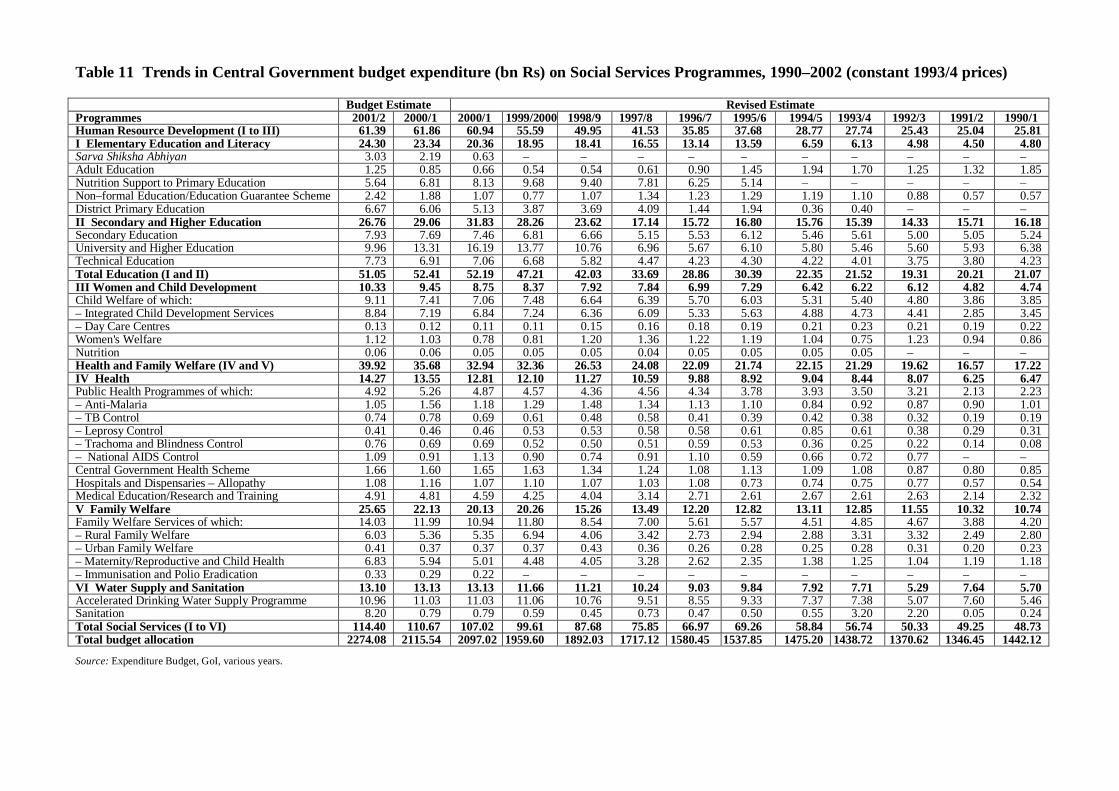
The 2001/2 budget allocated Rs65.86 bn (BE) to HFW compared to Rs57.09 bn (BE) in 2000/1, anincrease of 15.4% (Table 9). A big chunk of this increase was in the family welfare sector (fromRs35.41 m in 2000/1 to Rs42.32 bn in 2001/2 with an increase of 19.5%). For medical and publichealth the increase was only a modest 8.6%.
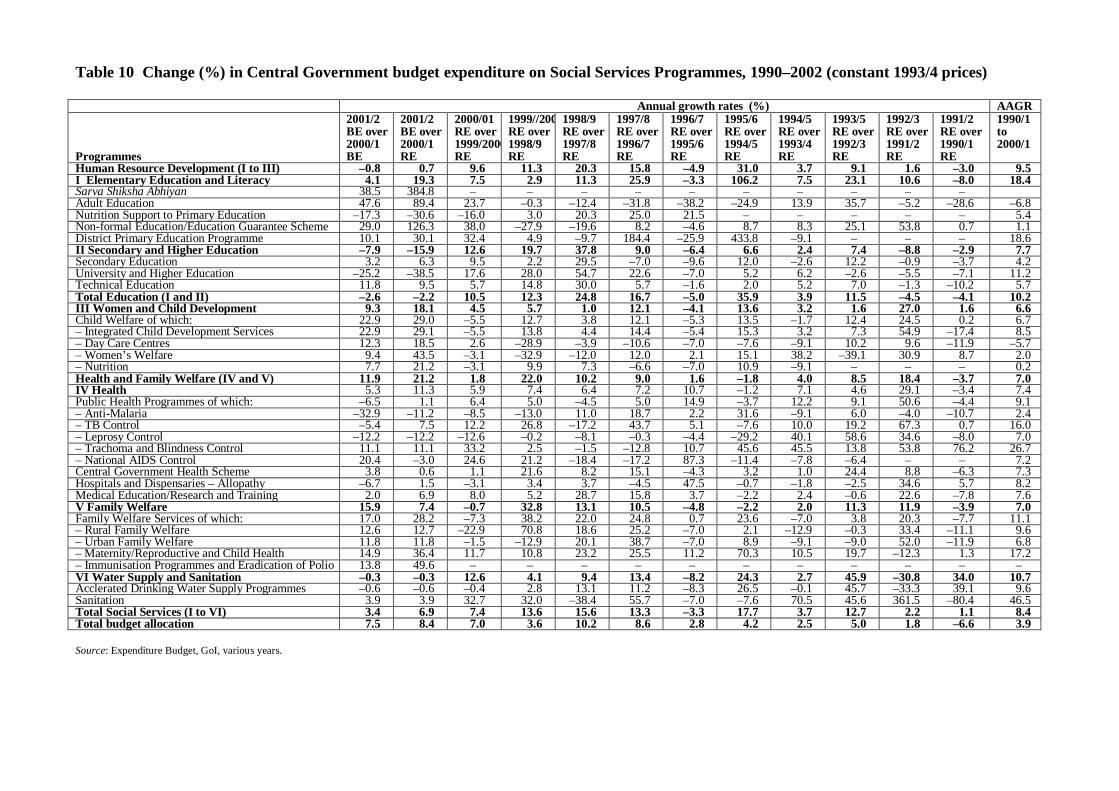
Although in nominal terms allocation to the health sector increased substantially during the 1990s,in real terms it did not. For instance, in real terms the increase over the previous year BE allocationwas 11.9% (5.3% for MPH and 15.9% for FW) (Table 10). On two occasions 1996/7 and 2001/2during the last decade the increase in allocation in real terms over the previous year was less than2%, and in 2 other years (1991/2 and 1995/6) the allocation actually declined. Thus, in 4 out of 10years in real terms per capita allocation to the HFW sector declined over the previous year.
18
4.2.1 Major heads of HFW sector
There are four major heads in HFW. These are:
• Public Health;• Central Government Health Scheme (CGHS);• Hospitals and Dispensaries – Allopathy;• Medical Education/Research and Training.
Surprisingly, the BE of 2001/2 for Public Health is lower by Rs300 m than that of the previousyear. The decline in allocation is more in the Anti-Malaria Programme followed by Leprosy and TBControl Programmes. The allocation has been increased for National AIDS and Trachoma andBlindness Control Programmes. This could be because of an increase in external assistance to theseprogrammes (e.g. the World Bank is currently assisting the Blindness Control Programme). Theallocation to allopathic hospitals and dispensaries was reduced by Rs70 m. On the other hand,allocation to CGHS increased by Rs180 m and to Medical Education, Research and Training byRs400 m. In real terms these increases are only about 3.8% and 2.0%. The picture is different forFW where all the sub-heads recorded higher allocations in both nominal and real terms (the increasein real terms for all sub-heads was more than 11%). This indicates that the Plan outlay (because allFW outlays are covered by the Plan) in the HFW sector was not affected so much as the non-Planones.
4.3 Poverty alleviation
Highlights:
• Decreased allocation for Special Programme for RD to Rs4.5 bn from Rs9 bn (at current prices);• Enhanced allocation to the schemes for welfare and upliftment of SCs in the Ministry of Social
Justice and Empowerment (from Rs7.09 bn to Rs7.9 bn);• Enhanced allocation for welfare schemes for STs in the Ministry of Tribal Affairs (from Rs7.87
to Rs9.87 bn);• Social security cover extended to the poorest sections of society, two new schemes introduced;• Agricultural Labourers Insurance Scheme (Khetihar Mazdoor Bima Yojana), that provides
benefits of insurance cover and a pension of Rs100/month to the beneficiaries on attaining theage of 60;
• An Education Co-operation Scheme (Shiksha Sahyog Yojana), that provides an educationallowance of Rs100/month to the children of parents living below the poverty line.
Over the years poverty-alleviation programmes of various types have expanded, and today there is awide variety of such programmes that absorb a large volume of resources. All poverty-alleviationprogrammes under the Central Government budget are put together under two broad expenditureheads–RD (Rs92.240 bn nominally budgeted in 2001/2) and UD (Rs11.57 bn nominally budgetedin 2001/2). Within RD a separate allocation: Rural Employment and Poverty Alleviation7
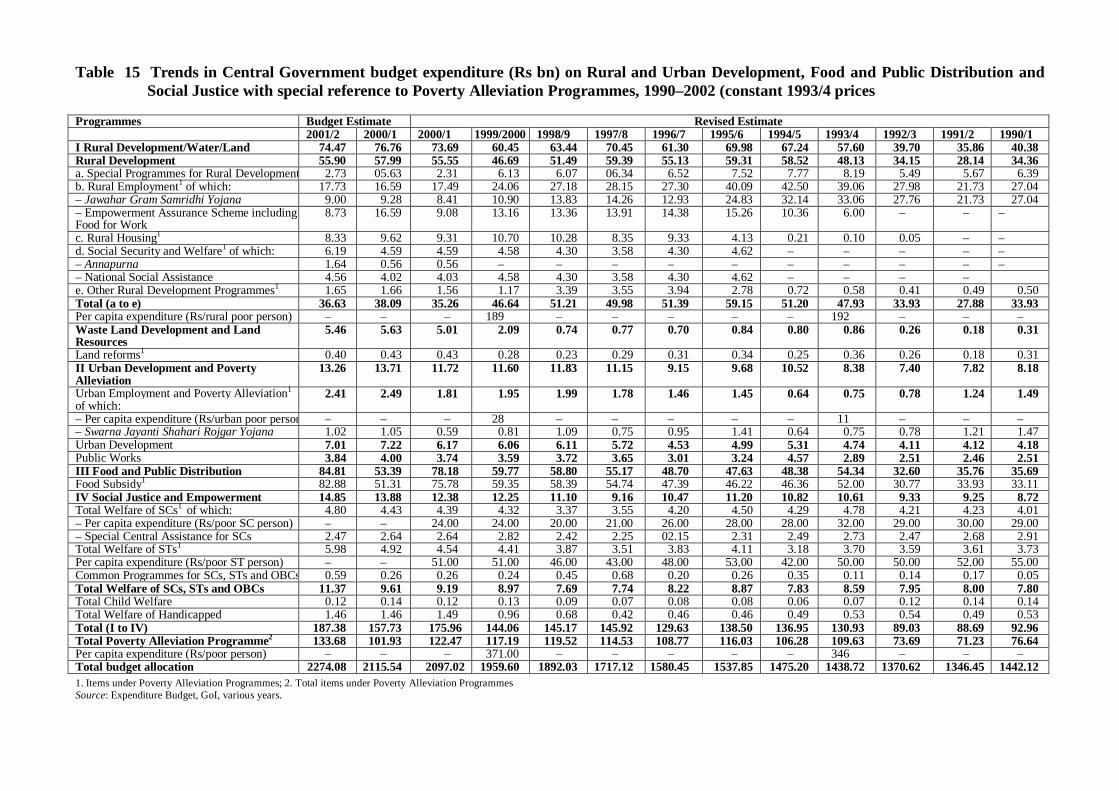
allocations concentrate on poverty-alleviation strategies. Similarly, within UD, Urban Employmentand Poverty Alleviation whose programmes are meant exclusively for the direct benefit of the poor.Programmes and schemes that have a direct bearing on poverty-alleviation strategies have beenidentified, and data and computation are presented in Tables 12–15.
7. From 1996/7 to 1999/2000, a separate department, the Department of Rural Employment and Poverty Alleviation was created inthe Ministry of Rural Development. But in the Budget papers of 2000/1 and 2001/2 there is no mention of this Department. Theschemes under the Poverty Alleviation Programmes are included under the broad heading Rural Development. But, the separateheading for Urban Employment and Poverty Alleviation Programme is retained in the Urban Sector.
19
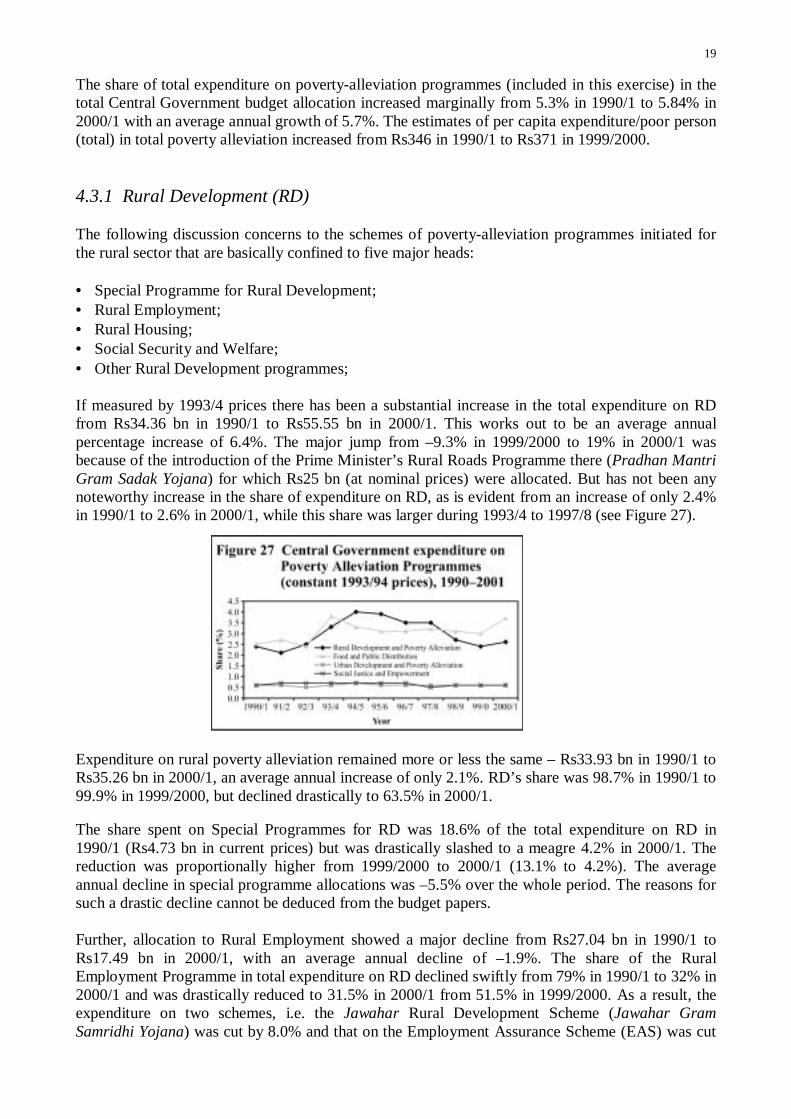
The share of total expenditure on poverty-alleviation programmes (included in this exercise) in thetotal Central Government budget allocation increased marginally from 5.3% in 1990/1 to 5.84% in2000/1 with an average annual growth of 5.7%. The estimates of per capita expenditure/poor person(total) in total poverty alleviation increased from Rs346 in 1990/1 to Rs371 in 1999/2000.
4.3.1 Rural Development (RD)
The following discussion concerns to the schemes of poverty-alleviation programmes initiated forthe rural sector that are basically confined to five major heads:
• Special Programme for Rural Development;• Rural Employment;• Rural Housing;• Social Security and Welfare;• Other Rural Development programmes;
If measured by 1993/4 prices there has been a substantial increase in the total expenditure on RDfrom Rs34.36 bn in 1990/1 to Rs55.55 bn in 2000/1. This works out to be an average annualpercentage increase of 6.4%. The major jump from –9.3% in 1999/2000 to 19% in 2000/1 wasbecause of the introduction of the Prime Minister’s Rural Roads Programme there (Pradhan MantriGram Sadak Yojana) for which Rs25 bn (at nominal prices) were allocated. But has not been anynoteworthy increase in the share of expenditure on RD, as is evident from an increase of only 2.4%in 1990/1 to 2.6% in 2000/1, while this share was larger during 1993/4 to 1997/8 (see Figure 27).
Expenditure on rural poverty alleviation remained more or less the same – Rs33.93 bn in 1990/1 toRs35.26 bn in 2000/1, an average annual increase of only 2.1%. RD’s share was 98.7% in 1990/1 to99.9% in 1999/2000, but declined drastically to 63.5% in 2000/1.
The share spent on Special Programmes for RD was 18.6% of the total expenditure on RD in1990/1 (Rs4.73 bn in current prices) but was drastically slashed to a meagre 4.2% in 2000/1. Thereduction was proportionally higher from 1999/2000 to 2000/1 (13.1% to 4.2%). The averageannual decline in special programme allocations was –5.5% over the whole period. The reasons forsuch a drastic decline cannot be deduced from the budget papers.
Further, allocation to Rural Employment showed a major decline from Rs27.04 bn in 1990/1 toRs17.49 bn in 2000/1, with an average annual decline of –1.9%. The share of the RuralEmployment Programme in total expenditure on RD declined swiftly from 79% in 1990/1 to 32% in2000/1 and was drastically reduced to 31.5% in 2000/1 from 51.5% in 1999/2000. As a result, theexpenditure on two schemes, i.e. the Jawahar Rural Development Scheme (Jawahar GramSamridhi Yojana) was cut by 8.0% and that on the Employment Assurance Scheme (EAS) was cut
20
by 12%. It appears that allocations were diverted to fund the Prime Minister’s Rural RoadsProgramme (Pradhan Mantri Gram Sadak Yojana) that was introduced during 2000/1, andallocated the large sum of Rs25 bn (at nominal prices).
The Jawahar Rural Development Scheme is a descendant of the Jawahar Employment Scheme(Jawahar Rojgar Yojana) that was renamed and retooled in April 1999 with rural infrastructure asits principal objective. Employment generation has been retained as a secondary objective while thefocus has now been shifted towards the creation of durable community assets that may help topromote regionally balanced economic growth in the medium- to long-term. A recent econometricstudy for India by Fan et al.8 (Anon, 2001a) on the impact of alternative avenues of publicexpenditure over the period 1970–93 establishes that building rural infrastructure such as roads hasthe greatest impact on poverty reduction, with a simultaneous positive impact on agriculturalproductivity growth. This finding makes it especially important that the Jawahar RuralDevelopment Scheme, Employment Assurance Scheme (EAS), and the new Prime Minister’s RuralRoads Programme be effectively utilised.
Expenditure on Rural Housing has remained more or less the same (in constant prices) since1996/7, i.e. Rs9.33 bn in 1996/7, and Rs9.31 bn in 2000/1. Its share in total RD expenditure alsoremained stagnant during that period at just about 17% of the RD allocations. The share ofexpenditure on Social Security and Welfare has remained more or less constant since its inceptionin 1996/7, and this share has been around 8% of total RD. The share in total RD expenditure ofOther RD Programmes increased from 1.5% to 2.8% with an average annual increase of 33%.
The share of all rural poverty alleviation programmes in the Centre’s total budget allocation fellfrom 2.4% to 1.68% with an annual growth of 2.1%. The per capita expenditure on each per poorrural person declined from Rs192 in 1990/1 to Rs189 in 1999/2000.
4.3.2 Wasteland development and land resources
Expenditure in constant 1993/4 prices (Table 14) on Wasteland Development and Land Resourcesincreased many folds from a meagre Rs310 m in 1990/1 to of Rs5010 m in 2000/1, an averageannual increase of 53%. Land reforms were the only constituent of expenditure under this head,consuming all of the total expenditure until 1992/3. From 1993/4 onwards, Land Reform’s sharedeclined to just 8.5% in 2000/1. In absolute terms it was only Rs430 m in 2000/1 of a totalexpenditure of Rs5010 m falling from Rs310 m in 1990/1. This is because, since 1993/4 severalnew schemes and programmes e.g. Integrated Wasteland Development, Drought-Prone Areas, andDesert Development Programmes have been introduced, while expenditure on land reforms in realterms remained more or less stagnant. The declining expenditure on land reforms certainly has adirect relationship with the implementation of land reform programmes. Implementation of anyscheme involves funds, and this declining trend in expenditure depicts a lack of emphasis on thepart of those at the helm. This is very well substantiated as, with the exception of West Bengal,Kerala and Tripura, States have not reported on this account. It is not necessary to mention the roleof the land reforms in bringing about a structural change in the rural sector by eliminating the age-old feudal form of land-tenure system and establishing the rights of sharecroppers and landless tothe land they till. This on the one hand removes the means of landlords to exploit the tillers of soil,and on the other, drastically improves the economic and social status of the tillers.
8. It appears that this study analyses national-level allocations and expenditure without adjusting for the double counting ofbudgetary and expenditure figures.
21
4.3.3 Urban Development (UD)
The annual growth in expenditure on the Urban Poverty Alleviation Programme was a healthy 8.1%in real terms, with an allocation of Rs11.57 bn in the current year. The share of the UrbanEmployment and Poverty Alleviation Programme in the total expenditure on UD declined from26.3% in 1990/1 to 22.7% in 2000/1. The most important scheme, the Golden Jubilee UrbanEmployment Scheme (Swarna Jayanti Shahari Rojgar Yojana) which was the only expenditure inpoverty alleviation programmes until 1993/4 only received 32.8% in 2000/1 because of the additionof such new schemes as Investment in Public Enterprises, and the lump sum provision forprojects/schemes for the benefit of the North Eastern Region and Sikkim.
The share of Urban Poverty Alleviation Programmes in the total Central budget allocation declinedfrom 0.1% to 0.08% with an annual average growth of 8.1%. The urban poverty alleviationexpenditure on each urban poor person increased from Rs11 in 1990/1 to Rs28 in 1999/2000. But, itwas only 1/8th of the amount spent on each rural poor person, a very meagre amount.
4.3.4 Social justice and empowerment
The total expenditure in constant 1993/4 prices under this head rose from Rs8.72 bn in 1990/1 toRs12.38 bn in 2000/1 an annual growth rate of 4.0%. But its share of the total budget allocationremained more or less the same at 0.6% during the period 1990/1 and 2000/1. Expenditure on thewelfare of SCs, STs and OBCs formed about 74.3% of this sector in 2000/1 compared to 89.5% in1990/1. In absolute terms and constant prices, expenditure increased from Rs7.8 bn in 1990/91 toRs9.19 bn in 2000/1 with an average annual growth rate of 2.0%. The expenditure on each SCperson from Central Government expenditure on Welfare of SCs declined from Rs55 in 1990/1 toRs51 in 2000/1, and for each ST person it decreased from Rs29 to Rs24 during the same period.
Expenditure on Child Welfare9 by the Department of Social Justice and Empowerment remainedmore or less the same during the reference period. The share of expenditure on child welfare in thetotal expenditure declined from 1.6% in 1990/1 to 1% in 2000/1 with an average annual growth of2.1%. Expenditure in real terms declined slightly from Rs140 m in 1990/1 to Rs120 m in 2000/1.
Expenditure on the Welfare of the Handicapped registered a very high rate of annual growth at13.7%. It increased from Rs530 m in 1990/1 to Rs1590 m in 2000/1, reflecting an increasingconcern to address the issues of the handicapped. Welfare of the Handicapped’s share in totalexpenditure on Social Justice and Empowerment increased from 6% in 1990/1 to 12% in 2000/1with an average annual growth of 13.7%.
4.3.5 Food and public distribution
Food subsidy10 forms about 96% of the total expenditure under this head. Its importance lies in theimplementation of food distribution at reasonable rates through fair-price shops to benefit people inlow-income groups. Expenditure on this account increased from Rs33.11 bn in 1990/1 to Rs75.78 at
9. The Department of Woman and Child Development, undertake expenditure on Integrated Child Development Services (ICDS) asa separate scheme.
10. The volume of subsidy is mainly dependant on two components, 1. Economic cost, i.e. the minimum support or procurementprice + administrative cost, and 2. Issue prices. The higher the difference between the two, the higher will be the amount ofsubsidy. If the procurement price goes up while the issue price remains the same, producers enjoy the benefit of the increase inthe subsidy. On the other hand, the consumers enjoy the benefit if procurement prices are lowered while administrative costsremain the same. If neither the procurement price nor the issue price increases, but the volume of subsidy continues to increase,then neither the consumer nor the producer gets the benefit. It can simply be attributed to the increasing administrative cost,reasons for which could be anything from the inefficiency of the Agent (FCI) to increasing transportation, storage, increasingadministrative expenses incurred by salary increases following revision of staff pay structure or over-staffing, etc.
22
constant 1993/4 prices in 2000/1. Its share in the total budget also increased from 2.3% to 3.61%during this period, with an average annual increase of 10.5%.
The Public Distribution System (PDS) had been widely criticised for its failure to serve thepopulation living below the poverty line. Therefore, an effort was made to streamline the PDS, byintroducing the Targeted Public Distribution System (TDPS) in June 1997. This system follows atwo-tier subsidised pricing structure: for families below the poverty line (BPL), and those above thepoverty line (APL). The Union Budget 2000/1 announced a monthly allocation of 10–25 kg foodgrains to each BPL family under the TPDS. This measure expanded the access of about 60 m BPLfamilies to subsidised food grains. The issue price of food grains for BPL families is fixed at 50%of their economic cost. For APL families, the price of food grains is fixed at the economic cost ofthe Food Corporation of India (FCI). But the States have only taken 55% of the food grains offeredby the Centre as observed by the Union Minister of Consumer Affairs and Public DistributionSystem. He says, ‘I have been asking Chief Ministers why the off-take is not 100%, particularlywhen the average monthly requirement of a BPL family is 50 kg? The response has been worsefrom States that have been offered food grains at 50% of the cost for implementing Food for WorkProgrammes. Not even one State has responded to this offer so far’.
In order to make the TPDS more focussed and targeted towards the poor, the scheme onDistribution of Food Grains to the Poor (Antyodaya Anna Yojana, AAY) was launched in December2000. The scheme contemplated identifying 10 m poor families and providing them with 25 kg offood grains each month at Rs2/kg for wheat, and Rs3/kg for rice. The estimated annual allocation offood grains for poor families is 3 m tonnes, and involves a subsidy of Rs 23.15 bn.
Given the failure of the PDS network to distribute food grains to elderly people in rural India, theFood for All scheme, (Annapoorna Anna Yojana) was launched in 2000/1 by the Department ofRD. Through this scheme, 10 kg food grains are given free each month to those who are eligible forold age pensions but are not covered by the National Old Age Pension Schemes (NOAPS). But theUnion Minister stated that, in the first year States only used 70% of that available (1.1 m tonnes outof 1.6 m tonnes).
In the Union Budget 2001/2, the scheme was modified to extend coverage to those persons who arecovered by the NOAPS (approximately 6.9m), in addition to those initially targeted the AAYscheme (1.4 m). Rs2700 m was allocated to the scheme in 2001/2, an increase from Rs900 m in2000/1 (at nominal prices).
The entire edifice of the PDS depended on the premise that the public would receive food grains atprices that were substantially lower than the free market price. However, two things have happened:a. there is no shortfall in the supply position, as domestic production has reached a far higher levelthan the market or PDS can absorb, and b. the market prices are often lower than the APL priceunder the PDS. Therefore the Government is faced both with the problem of carrying large surplusstocks, and by the off-take of food grains, particularly of wheat under the PDS being low during thelast 2 years, the latter, because of narrowing differentials between the PDS and open market prices.There is therefore a need to rationalise the present procurement and price-setting policy.
Another problem associated with this scheme is that the poor, particularly the poorest, generally dono accumulate enough cash to buy 25 kg of grains at a time. There is need to put in place a systemthat allows the purchase of PDS grains in instalments, say four times a month, or at least allowspeople to pay in instalments while receiving their monthly supply. This would recognise the factthat food distribution is a very difficult task indeed.
23
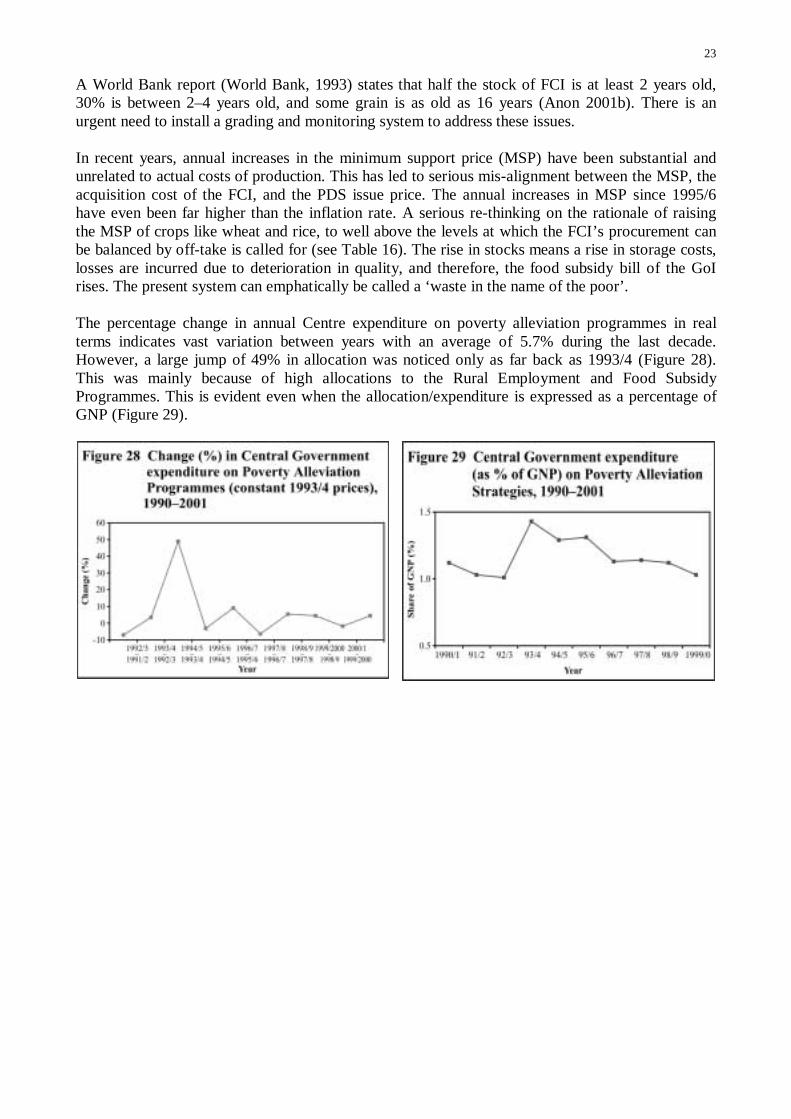
A World Bank report (World Bank, 1993) states that half the stock of FCI is at least 2 years old,30% is between 2–4 years old, and some grain is as old as 16 years (Anon 2001b). There is anurgent need to install a grading and monitoring system to address these issues.
In recent years, annual increases in the minimum support price (MSP) have been substantial andunrelated to actual costs of production. This has led to serious mis-alignment between the MSP, theacquisition cost of the FCI, and the PDS issue price. The annual increases in MSP since 1995/6have even been far higher than the inflation rate. A serious re-thinking on the rationale of raisingthe MSP of crops like wheat and rice, to well above the levels at which the FCI’s procurement canbe balanced by off-take is called for (see Table 16). The rise in stocks means a rise in storage costs,losses are incurred due to deterioration in quality, and therefore, the food subsidy bill of the GoIrises. The present system can emphatically be called a ‘waste in the name of the poor’.
The percentage change in annual Centre expenditure on poverty alleviation programmes in realterms indicates vast variation between years with an average of 5.7% during the last decade.However, a large jump of 49% in allocation was noticed only as far back as 1993/4 (Figure 28).This was mainly because of high allocations to the Rural Employment and Food SubsidyProgrammes. This is evident even when the allocation/expenditure is expressed as a percentage ofGNP (Figure 29).
24
5 Under-utilisation of Budgets
The most peculiar and undesirable part of the budget lies in the fact that while the planners andacademicians (including social scientists) have taken great pains to evolve ways and means to poolresources under the growing fiscal crises and rolling back of public expenditure in the process ofliberalisation, to fund Social Sector and Poverty Alleviation Programme expenditure according tothe budget provisions of both Central and State Governments, very little attention has been paid tothe utilisation of the ‘allocated funds’. There is scant information on what is really happening to thebudgetary allocations made year after year to implement several development schemes. Are theybeing fully utilised or not? If not, why? Is it because of the delay in the release of funds by theCentral to the State Governments and subsequently to district treasuries and in providing access tothe implementing agencies?
Broadly, the phenomenon of under-utilisation of funds is reflected in the difference in the GoI’sbudget allocations, releases and utilisation in different sectors and schemes. But this provides onlyan overall picture. The fact that funds allocated for different programme components and sub-components are under-utilised goes unnoticed because of the lack of an adequate ‘financialmanagement information’ system (Rajaraman, 2001b; Bhatt, 2000). Within a given programme, thevariations in utilisation of different schemes are also significant. The information suggests that it isgenerally the larger States that face problems, suggesting complexities in managing the programmesin these States.
Some sketchy ideas on the severity and dimension of the issue at the sub-sectoral andimplementation level can be captured from scattered references. Until the financial year 2000/1, theGovernment of Delhi Union Territory only spent just a third of its budget. Not only does thisindicate that the amount supposed to be spent on development work had not been spent, in the longrun it also affects the budget allocation that Delhi gets from the Centre. Within this budget, of theRs280 m allocated to the Municipal Corporation of Delhi for development of the Trans Yamunaarea, only Rs12.8 m or just 4.5% was spent. The Department of Information and Technology, whichthe city government considers a high-priority area spent just 8% of its budget. In the field of labourwelfare utilisation was 8.5%, the Directorate of Employment 9.69% and the Directorate of Trainingand Technical Education 9.10%. While the Public Works Department spent only Rs180 thousandout of Rs100 m on low-cost housing, they spent more than 90% of their budget on officeaccommodation. The obvious question is raised, ‘How can the Delhi Government ask the PlanningCommission for additional funds for Delhi when they could not even spend what was given tothem? (Sangwan, 2001). At the Ministry’s Parliamentary Committee meeting, the Minister of Statefor Social Justice and Empowerment criticised the lack of fund utilisation by State governments(Anon, 2001c). Patients suffer as Delhi Government hospitals fail to utilise funds, e.g. G. B. PantHospital, the Delhi Government’s best hospital had utilised only 36% of its annual plan outlay ofRs250 m for 2001/2 by December 2001. The Maulana Azad Medical College and Hospital spentonly 27.9 m of its annual outlay of Rs90 m (Chauhan, 2002). Many key government departments inOrissa have utterly failed to utilise their Plan allocations. In the financial year 2001/2 somedepartments had failed to spend even 10% of their annual allocations by the end of October 2001(Pattnaik, 2001). Central funds for the ‘Rural Connectivity Road Programme’ aimed to connectremote villages with main roads, lied unused by the Bihar Government. The Centre allocatedRs1500 m to Bihar under the first phase of the programme, 6 months elapsed, but the StateGovernment failed to utilise even a single rupee! It was feared that the money would have to besurrendered as there was no way to spend it all by the end of the current financial year (2001/2).The Centre will withhold the second phase allocation (about Rs3 bn) since the State will not be ableto produce a utilisation certificate (Mishra, 2001a).
25
It is hardly possible to bring out the causes for under-utilisation of allocated funds for all the sectorstogether. Because of the differences in objectives, funding sources, administrative machinery andimplementing agencies across the sectors and within a sector. However it is possible to identifycertain common causes and factors that affect almost all the sectors.
In Centrally Sponsored Programmes (CSPs), financial resources flow through different levels ingovernment. Funding for services at the District level, currently comes through numerousindependent channels including central allocations routed through State Governments. From theCentral Government treasury it is passed on to the State treasury and is made available at theDistrict or Block level. Over the period, the resource flows have become more uncertain thusaffecting programme performance (Bhatt, 2000). Even though the pattern of funding to the Statesby the Central Planning Commission is uniform, there are substantial difference between States inutilisation of funds and in completion of the targeted work without time and cost overruns. ThePlanning Commission provides approximately 50% of Plan funds for minimum-needs programmes.The States are not able to spend this amount and usually divert it to the non-Minimum NeedsProgramme component.
The cash remittances to Districts are highly uneven and uncertain. The mapping of funds transferredfrom Centre to States does not exactly match cash remittances made by the Centre and cashremittances received by the Districts. For example, examination of the data on release of funds forthree family welfare schemes (under the Ministry of Health and Family Welfare) to a particulardistrict in West Bengal revealed that until September in a particular financial year, no remittancereached the District barring a meagre 1.21% in July, 57% of the remittance reached the District inthe third quarter, and the remaining 42% in the last quarter of the financial year.
Though financial rules and procedures are well defined, delay in funding flow is a generalexperience for managers implementing sector programmes. Sometimes at the District level noguidance is available to programme managers on fund utilisation. There is considerable amount ofconfusion at different levels about the way implementing agencies are expected to interact withagencies outside the Government and how funds are supposed to be utilised. Thus, availableresources are not put to use, and are sometimes under-utilised.
States and other projects report that a major bottleneck to funding flows is the delay or default inreporting Statements of Expenditure (SOE). This further delays the consolidation of expenditure atthe Central level and reporting from there to Parliament and external donors.
26
6 Discussion and Conclusions
India recorded strong economic growth during 1980–2000, especially during the 1990s, a decadeknown for noteworthy structural economic reforms. This period also recorded declines in theincidence of poverty, and improvements in such parameters of human development as levels ofliteracy, health, and nutrition. Broad-based development policies focused on enhanced and targetedpublic investment in programmes that facilitated improvements in the quality of life of the masses.
Public expenditure on social sectors constitutes a substantial part of budget allocations in manymodern-day developed and developing countries. For example, in 1996/7 public allocations forhealth and education were 13.7% of the gross domestic product (GDP) in France, 12% in the US,11% in UK, 6.6% in Malaysia, and 4.8% in Sri Lanka. In India this expenditure amounted to only4.1% of the GDP. India along with its many States, has high level of deficit financing (around 12%)that exerts pressure on public finances. Since the late 1970s, most of the governments in developingand developed countries have been facing fiscal crises that have forced them to cut into socialsector expenditure (World Bank, 1993). In context of India, it can be observed that the Gross FiscalDeficit of the Central Government (as a percentage to GDP) remained more or less at 6.0% during1991/2 to 1999/2000. In contrast, the State Governments’ deficit shows a rising trend from 3.6% in1991/2 to 5.1% in 1999/2000 (Figure 30).
Therefore, the tendency towards a cutback in social sector expenditure becomes an unavoidablefact. The major reasons can be attributed to:
• State governments are not able to mobilise the additional resources required to financeincreasing budgetary demands. There seems to be a lack of administrative efficiency andpolitical will to raise resources mainly through indirect taxes;
• Due to the increasing share of non-developmental expenditure by the States (Figure 22), ashortfall in the developmental expenditure has affected the social sector and poverty alleviationprogrammes;
• As a result of the structural adjustment policy States have little control over the functioning ofthe economy.
In the context of the 2001/2 budget, a promise was made that funds would be allocated to the SocialSector by sharing the disinvestment proceeds between Labour Reform and the Social Sector. Thisbudget aimed for disinvestment proceeds of Rs.120 billion, of which Rs.70 billion was to beallocated to Labour Reform, and remaining the Rs.50 billion to the Social Sector. But as shown in
Figure 30 Gross Fiscal Deficit (% of GDP), 1991/2to 1999/2000
Table 17 this did not happen. Even in 2001 the promise to provide Rs.50 billion was not kept. Thiskind of policy announcement seems irrelevant, and gives an impression of a lack of seriouscommitment to address the human development and poverty issues facing the nation.
These factors together with uneven public policy concerns over the past half-century have resultedin low funding of the Social Sector. This has in turn resulted in India’s prevailing high levels ofilliteracy, low life expectancy at birth, high incidence of disease, disability, and malnutritioncompared to those in certain other developing countries. The Indian Constitution imposes uponGovernment (at both Central and State level) that basic necessities are made available to all citizensacross the whole of India. The Constitution binds governments to allocate funds, formulateprogrammes and policies to improve social conditions, and to alleviate poverty. There are a plethoraof schemes in India that aim to provide primary and middle-level education, and public and primaryhealth care, ensure employment for those seeking work, subsidise food distribution, and provide anumber of social welfare programmes. Such a multiplicity of programmes has proved counter-productive, and many of them are deeply criticised for being unsuccessful in generating theirintended outputs due to their poor implementation and shortfall in achieving targets in a transparentmanner.
While, over the years, public expenditure on the social sectors and poverty alleviation has increasedsubstantially in absolute terms, relatively speaking the rate of increase during the reforms of the1990s slowed by 1997/8, with Central budgets picking up again during 1998/9 and 1999/2000.There is also an anomaly between the BEs and Revised Estimates (REs) that suggests that 10–12%of Central BE allocations are never spent, especially on social services and poverty alleviation. It isimportant to explore the reasons for low spending, and what corrective measures national and Stategovernments undertake annually.
Driven by a concern to promote growth, in line and in tune with international mandates relating tothe World Trade Organization (WTO), recent budgets have shown signs of reducing publicsubsidies. Subsidies that have been in place for the last half-century accounted for 12.8% of theCentre’s revenue receipts in 1999/2000. They declined to 10.6% in 2000/1, largely due toreductions in fertiliser and food subsidies. The need to continue subsidies that favour the poorthrough self-targeting and cross-subsidisation strategies, but in ways that do not dampen theenthusiasm of investment classes is still pressing in India. For India as a whole the public (Centreand State) share is only about one quarter of the total expenditure on health and about 60% of thaton primary and elementary education. The remainder is provided from householders’ own privatebudgets. Per capita public expenditure on social sector and poverty alleviation programmes is low,and most of the allocated moneys is spent on salaries and establishment costs.
In the Indian context, it is erroneous to analyse the process of development, particularly in theSocial Sector and Poverty Alleviation Programmes from national budgets alone, because Statepolicies independently play a dominant role. The main components of these are:
• Education, Sports, Arts and Culture (ESAC);• Medical, Public Health and Family Welfare (MPHFW);• Water Supply and Sanitation (WSS);• Welfare of SCs, STs and OBCs;• Rural Development;• Urban Development.
Total expenditure on these accounted for only 7.4% of the GDP in 1999/2000 of the combined(adjusted) Centre and State expenditure (in 1993/4 prices) It was 7% of the GDP during1991–8. Byfar the single largest item was public expenditure on education (including higher education) that
28
jumped from 3.29% of the GDP in 1998/9 to 3.73% in 1999/2000. Despite increased allocationduring the last decade in the MPHFW sector, both State and Centre expenditure (as percentages ofthe GNP) have not attained the levels enjoyed during 1990/1. The relative share of Centralexpenditure on RD has declined substantially from about 42% in 1998/9 to 35% in 1999/2000, alarge part being reallocated to rural road construction programmes.
An additional problem facing Social Sector and Poverty Alleviation Programmes is that within eachsector, such as those for primary education, rural employment, micro-credit programmes, old-ageassistance programmes, and so on, there are a large number of targeted sub-schemes. One can findover 150 welfare-oriented programmes at the State level. This multiplicity of programmes is theprimary cause of so much confusion, and the reason that among all the programmes none seems tobe efficiently implemented.
The performance of several major poverty alleviation programmes has not been satisfactory in thepast few yeas. For instance, the EAS (for rural areas started in 1993) aims to create additional paidwork opportunities during periods of acute shortage of wage employment, through manual work forthe rural poor living BPL in drought-prone, desert, tribal, and hill areas. In 1999/2000, the targetwas to generate 409 m person-days of employment, but only 262 m were actually generated.Similarly, in the Chief Minister’s Employment Scheme for urban areas the target was to generate 55m person-days of employment, whereas the actual achievement was only 48 m person-days.
It is surprising to note that out of all the total Central allocations, States utilised only a small part ofthe available resources, i.e. only about 49% of the Jawahar Gram Samridhi Yojana (JGSY)(Jawahar Rural Development Scheme), 56% of EAS, and 31% of the Golden Jubilee Self-Employment Scheme, and 32% of Rural Sanitation; and only around 40% of these released fundswere utilised during April–December 2001 i.e. during the first 9 months of the financial year. It isnot unexpected to find similar utilisation levels in public expenditure on welfare of SCs, STs andOBCs. Public expenditure on this group has indeed declined during the last decade, as is evident inthe data presented. Such financial institutions as the SCs and STs Development Corporation, theMinorities Development Corporation, and so on, are not at all effective due to their total failure todisburse the allocated funds amongst the States for their intended objectives.
A fairly explicit phase of Economic Reforms began in 1991 in India. The basic philosophy of thesereforms was to reduce public involvement in a number of production and distribution mechanismswhose performance can be better sustained and even enhanced by the private sector. It appears thatthis process has also affected the commitment and performance of the public machinery inimplementing social sector and poverty alleviation programmes. The implicit requirement forprivate contributions is likely to be unaffordable by the majority of the population. The State,therefore, cannot be absolved from its constitutional duty to provide basic services to the people.Another relevant factor is that reforms are putting pressure on State finances in two ways. First: tax:GDP ratios are not increasing commensurately with the increases in GDP, and often fall short oftargeted collections. Second, pressures to enhance GDP growth demands reallocation of publicfunds to the industrial, manufacturing, infrastructure, and service sectors at the expense of socialsectors, poverty alleviation programmes, rural development, and primary sectors.
Although the relative share of agriculture in growth has declined from about 60% during the 1950sto about 25% during recent years, over 65% of the labour force is still trapped in low-productivityagricultural and farming activities. The importance of sustaining improved growth rates in theagricultural sectors in future, as the shares of manufacturing and services increase concurrentlycannot be overemphasised. Enabling labour-market flexibility, and effecting inter-sectoral shifts inthe work force is an absolute necessity.
29
Budgets are intended to play catalytic roles by targeting financial expenditure on priority sectors topromote efficiency in growth, and sustainability and equity in development. Budgets should bereliable enough to provide adequate annual support to policies and programmes that are essential,and to those that have shown results; but should be dynamic enough to address emerging issues andchallenges. Flexibility and dynamism is especially needed to accomplish objectives that are oftennot entirely set by the formal political structures, but rather by public sentiments supported byacademic rigour. The cases in point are the need for increased allocations to promote and provideelementary education and basic health services, and to ensure adequate nutrition for the poorest.Given the fact that enhanced public allocations are necessary, and that improving the efficiency ofinvestment is essential, the 2000/1 Budget announcement linking additional allocations to thevolume of public disinvestment proceeds appears naive. It must be noted that public investment toboost the rural economy and agriculture is imperative to improve the social sectors and alleviatepoverty, even if GDP growth continues to increase towards the projected 8% growth.
30
References
Anon. (2001a) ‘Rural Infrastructure got Huge Funds’, The Economic Times, 10 May, pp.11.Anon. (2001b) ‘States not lifting food stocks: Shanta Kumar’, Times of India, 25 July, pp. 3.Anon. (2001c) ‘Maneka raps states for not utilising funds’, Times of India, 18 January, pp. 5.Bhatt, Ramesh. (2000) Emerging Institutional Mechanism in Financing Health Sector Programmes
and its Implications, Ahmedabad, India: Indian Institute of Management, 30 pp.Chauhan, Chetan. (2002) ‘Patients Suffer as Delhi Government Hospitals Fail to Utilise Funds’,
The Hindustan Times, 23 January, pp. 5.GoI (1999) Expert Group Report on Financial Requirements for Making Elementary Education a
Fundamental Right, New Delhi, India: Ministry of Human Resource Development, Departmentof Education, Government of India.
GoI (2001) Economic Survey 2000–2001, New Delhi, India: Economic Division, Ministry ofFinance, Government of India, 269 pp.
GoI (2002) Economic Survey 2001–2002, New Delhi, India: Economic Division, Ministry ofFinance, Government of India, 272 pp.
GoI (2001) Expenditure Budget, Volume 2, New Delhi, India: Economic Division, Ministry ofFinance, Government of India, 222 pp.
GoI (2001a) Symposium on Financial Reforms, 9–11 August, 2001, Supported by EuropeanCommission, New Delhi, India: Department of Family Welfare, Government of India, 85 pp.
GoI (2001b) National Accounts Statistics 2001, New Delhi, India: Central Statistical Organisation,Ministry of Statistics and Programme Implementation, Government of India, 117 pp.
Kundu, Amitabh. (2001) ‘Poverty and Unemployment in India: An Analysis of Interdependenciesfor Building an Explanatory Framework’, Paper presented at the Poverty Round TableDiscussion, National Council of Applied Economic Research, New Delhi, India, 31 July 2001,22 pp.
Mishra, A.K. (2001a) ‘Central funds for rural roads in Bihar lie unused’, The Hindustan Times, 13December, pp. 7.
Mishra, R.K. (2001b) ‘Privatisation of Public Enterprises’, Paper presented at Indo-Russian JointSeminar on Socio-Economic Strategies at the beginning of the New Century, Moscow, Russia,22–24 October 2001. (Unpublished)
Pattnaik, Soumyajit. (2001) ‘Orissa Government Departments Fail to Utilise Plan Allocation’, TheHindustan Times, 13 December, pp. 7.
Rajaraman, Indira. (2001a) ‘Expenditure Reform’, The Economic Times, 10 May, pp. 6.Rajaraman, Indira. (2001b) Growth-Accelerating Fiscal Devolution to the Third Tier, Paper
presented at National Institute of Public Finance and Policy (NIPFP) – World Bank –Department for International Development (DFID Conference of India: Fiscal Policies toAccelerate Economic Growth, 21–22 May 2001, New Delhi, India: Government of India.(Unpublished)
RBI (1990–2001) Reserve Bank of India Bulletins, New Delhi, India: Government of India.Sangwan, Soni. (2001) ‘Delhi Government still to spend 66% of its Budget’, The Times of India, 16
January, pp. 6.Shariff, Abusaleh. (2000) ‘The Millennium Budget: Social Sector and Poverty Alleviation
Allocations’, Margin 31(3): 24–38.Shariff, Abusaleh and Ghosh, P.K (2000). ‘Indian Education Scene and the Public Gap’, Economic
and Political Weekly, 35(6): 399–406.World Bank (2000) ‘Entering the 21st Century: World Development Report 1999/2000’, New York,
USA: Oxford University Press, 285pp.World Bank (1993) ‘World Development Report’, New York, USA: Oxford University Press,
329pp.
31
Appendix Tables
Table 1 Rates of exchange for the Rupee against US$ and £ Sterling, 1990–2002
I Development expenditure (% of total) 57.3 57.9 59.4 60.7 60.3 59.2 61.6 62.2 63.3A. Social Services (% of Development) 57.7 55.9 52.9 52.5 52.5 49.4 49.2 50.2 47.9Education, Sports, Arts and Culture 54.5 53.7 52.5 51.8 52.2 53.8 53.7 53.9 53.0Medical, Public Health and Family Welfare 14.9 15.4 15.7 15.5 15.7 16.4 17.0 16.1 16.3Water Supply and Sanitation 7.2 8.1 7.9 7.5 7.2 8.2 7.6 6.9 7.2Housing 2.0 2.0 1.9 1.7 1.9 1.8 1.6 1.8 1.9Urban Development 3.7 3.0 3.1 3.2 2.7 2.4 2.4 2.4 2.8Welfare of SC, ST and OBC 6.4 6.6 6.8 7.2 6.4 6.7 6.7 6.9 6.8Labour and Labour Welfare 1.3 1.2 1.4 1.4 1.3 1.4 1.4 1.7 1.5Social Security and Welfare 4.5 4.3 4.4 4.8 4.4 4.6 4.6 5.2 4.6Nutrition 2.3 2.5 2.6 3.0 3.8 1.8 1.7 1.8 1.9Relief of Natural Calamities 2.3 2.4 2.8 3.0 3.4 1.9 2.3 2.4 3.3Others1 0.7 0.8 0.8 0.8 0.9 0.9 0.9 0.9 0.81. Total 100.0 100.0 100.0 100.0 100.0 100.0 100.0 100.0 100.0B. Economic Services (% of Development) 42.3 44.1 47.1 47.5 47.5 50.6 50.8 49.8 52.1Agriculture and Allied Services 24.1 22.3 20.1 20.0 21.1 20.6 22.8 24.1 20.3Rural Development 16.9 15.9 13.7 15.2 13.3 14.3 17.6 17.0 15.4Special Area Programme 2.1 2.2 1.9 2.1 1.8 1.7 1.8 1.9 1.7Irrigation and Flood Control 25.2 27.1 26.5 24.8 27.0 25.4 24.7 23.5 22.4Energy 8.8 10.3 14.6 15.1 13.2 15.0 10.8 11.2 18.7Industry and Minerals 3.7 4.0 4.1 5.2 5.2 4.9 4.9 5.6 5.2– Village and Small Industries – – – – – – – – –– Industries – – – – – – – – –– Others – – – – – – – – –Transport and Communication 14.7 14.5 14.3 13.3 14.4 13.2 13.2 12.1 11.7Science, Technology and Environment 0.2 0.2 0.1 0.2 0.1 0.1 0.2 0.1 0.1General Economic Services 4.3 3.5 4.6 4.1 3.8 4.8 4.0 4.4 4.4Total 100.0 100.0 100.0 100.0 100.0 100.0 100.0 100.0 100.0I Development expenditure 57.3 57.9 59.4 60.7 60.3 59.2 61.6 62.2 63.3II Non–Development expenditure 33.4 32.1 31.1 30.2 30.9 30.3 28.0 26.7 24.9III Grants–in–aid and contributions 0.0 0.8 0.0 0.0 0.0 0.0 0.0 0.0 0.0IV Compensation and assignments to localbodies
1.6 1.3 1.3 1.0 0.9 0.8 0.9 0.9 0.9
V Others 7.8 7.9 8.2 8.1 7.9 9.8 9.5 10.2 10.8Total Expenditure/Disbursements (I to V) 100.0 100.0 100.0 100.0 100.0 100.0 100.0 100.0 100.0
1. Includes reserve with Finance Department, discharge of internal debt, repayment of loans to Centre and loans and advances by State Governments.Source: Various issues RBI Bulletin, GoI.
Table 6 Change (%) in State Government budget expenditure on major budget heads, 1991–2000 (constant 1993/4 prices)
Annual growth rates (%)
Programmes1998/9–
1999/20001997/8–1998/9
1996/7–1997/8
1995/6–1996/7
1994/5–1995/6
1993/41994/5
1992/3–1993/4
1991/2–1992/3
I Development expenditure 16.3 4.5 –0.3 10.3 3.6 4.8 2.1 –0.2A. Social Services 20.1 10.5 0.5 10.3 10.1 5.2 0.1 4.6Education, Sports, Arts and Culture 21.9 12.9 2.0 9.4 7.0 5.3 –0.3 6.4Medical, Public Health and Family Welfare 16.7 8.1 1.8 8.7 5.5 1.4 5.7 3.6Water Supply and Sanitation 7.4 12.5 6.1 15.4 –3.7 13.5 10.8 0.4Housing 22.3 19.5 6.8 2.4 17.5 12.9 –7.5 0.6Urban Development 51.3 5.2 –3.1 33.7 22.4 6.6 –2.4 –8.4Welfare of SC, ST and OBC 17.1 6.1 –5.0 24.1 5.8 4.9 –2.1 5.2Labour and Labour Welfare 22.3 –4.0 5.9 13.9 1.8 4.0 –14.2 17.9Social Security and Welfare 26.0 8.2 –8.5 22.7 3.4 5.4 11.5 18.2Nutrition 11.7 4.7 –13.0 –13.1 132.4 15.8 –7.4 0.0Relief of Natural Calamities 14.2 –2.1 –6.7 –4.6 97.9 –13.6 –3.9 –23.0Others 3.6 13.8 –2.6 –6.4 18.3 4.5 2.0 8.5B. Economic Services 11.6 –2.3 –1.1 10.2 –2.7 4.4 4.1 –4.6Agriculture and Allied Services 20.4 8.3 –0.5 4.7 –0.4 –6.0 –1.3 13.2Rural Development 18.6 13.7 –10.7 26.0 –9.9 –15.0 7.8 5.3Special Area Programme 3.8 12.9 –7.0 28.0 4.0 –3.8 –3.1 6.5Irrigation and Flood Control 3.9 –0.2 5.7 1.4 3.2 7.6 9.1 0.1Energy –4.8 –31.2 –4.4 25.7 –13.9 45.2 0.3 –43.1Industry and Minerals 2.1 –5.0 –21.8 9.4 4.5 4.4 –10.1 3.1– Village and Small Industries 5.2 6.8 –30.5 21.2 9.0 1.0 –10.6 0.8– Industries –1.9 –16.3 –4.2 –0.9 1.0 –11.9 34.7 10.2– Others –1.7 –16.9 –20.1 –4.7 –0.4 51.0 –47.7 2.0Transport and Communication 13.1 –0.7 6.3 1.9 6.3 4.3 13.6 –1.0Science, Technology and Environment 23.0 28.0 –21.0 25.5 10.6 –9.0 11.8 26.9General Economic Services 38.6 25.9 9.2 18.3 –22.8 25.1 –3.7 –6.1I Development expenditure 16.3 4.5 –0.3 10.3 3.6 4.8 2.1 –0.2II Non–Development expenditure 22.2 11.0 4.7 7.1 3.7 17.8 8.3 8.9III Grants–in–aid and contributions – – – – – – – –IV Compensation and assignments to local bodies 38.9 9.8 37.2 22.3 8.6 1.1 2.0 –5.0V Others1 15.1 3.9 3.0 12.0 –17.4 11.8 –3.6 –4.1Total Expenditure/Disbursements (I to V) 17.5 7.4 1.9 9.6 1.6 9.1 3.2 1.6
1. Includes reserve with Finance Department, discharge of internal debt, repayment of loans to Centre and loans and advances by State Governments.Source: Computed from the information given in various issues of the RBI Bulletin, Reserve Bank of India, Government of India.
Table 7 Cumulative expenditure (Rs bn) by State Governments, 1991–2000 (constant 1993/4 prices)
1. Includes reserve with Finance Department, discharge of internal debt, repayment of loans to Centre and loans and advances by State Governments.Source: Various issues, RBI Bulletin, RBI, GoI.
Table 8 Distribution (%) of Central Government budget expenditure on Social Services Programmes, 1990–2002
1 The figures in these rows indicate the percentage allocation to the Total Budget AllocationSource: GoI Expenditure Budget, various years.
Table 12 Distribution of Central Government budget expenditure on Rural and Urban Development, Food and Public Distribution and SocialJustice with special reference to Poverty Alleviation Programmes, 1990–2002
1. Items under Poverty Alleviation Programmes2. Total items under Poverty Alleviation Programmes3. The figures in these rows indicate the allocation (%) to total budget allocationSource: Expenditure Budget, GoI, various years.
Table 13 Trends in Central Government budget expenditure on Rural and Urban Development, Food and Public Distribution and SocialJustice with special reference to Poverty Alleviation Programmes, 1990–2002 (nominal prices bn Rs)
1. Items under Poverty Alleviation Programmes2. Total items under Poverty Alleviation ProgrammesSource: Expenditure Budget, GoI, various years.
Table 14 Change (%) in Central Government budget expenditure on Rural and Urban Development, Food and Public Distribution andSocial Justice with special reference to Poverty Alleviation Programmes, 1990–2002 (constant 1993/4 prices)
Urban Development –2.9 13.7 1.7 –0.8 7.0 26.1 –9.2 –6.0 12.0 15.3 –0.2 –1.4 4.5Public Works –3.9 2.8 4.2 –3.7 2.1 21.3 –7.0 –29.2 58.2 15.3 1.7 –2.0 6.1(III) Food and Public Distribution of which: 58.9 8.5 30.8 1.6 6.6 13.3 2.3 –1.6 –11.0 66.7 –8.8 0.2 10.0– Food Subsidy1 61.5 9.4 27.7 1.7 6.7 15.5 2.5 –0.3 –10.8 69.0 –9.3 2.5 10.5(IV) Social justice and empowerment of which 7.0 20.0 1.1 10.3 21.2 –12.5 –6.5 3.5 2.0 13.7 0.9 6.1 4.0Total Welfare of SC1 of which: 8.3 9.2 1.6 28.3 –5.0 –15.4 –6.7 4.8 –10.2 13.6 –0.4 5.3 1.6– Special Central Assistance for SCs –6.7 –6.7 –6.2 16.4 7.8 4.6 –7.0 –7.2 –8.8 10.4 –7.7 –7.8 –0.6
Total Welfare of STs 21.6 31.6 3.0 14.0 10.3 –8.3 –6.8 29.1 –14.0 3.0 –0.4 –3.3 2.7Common Programmes for SCs, STs and OBCs1 124.0 129.4 7.3 –46.9 –33.8 247.6 –25.0 –26.5 222.3 –23.0 –14.3 208.3 51.6Total welfare of SCs, STs and OBCs 18.3 23.7 2.4 16.7 –0.6 –5.9 –7.3 13.3 –8.9 8.1 –0.7 2.6 2.0Total Child Welfare –11.8 2.1 –8.0 47.9 32.8 –15.9 –7.0 32.1 –9.1 –42.1 –15.4 5.7 2.1Total Welfare of Handicapped 0.3 –1.8 54.7 40.4 61.7 –8.2 –0.3 –5.9 –7.4 –1.6 10.3 –7.4 13.7Total (I to IV) 18.8 6.5 22.1 –0.8 –0.5 12.6 –6.4 1.1 4.6 47.1 0.4 –4.6 7.6Total Poverty Alleviation Programme2 31.2 9.2 4.5 –1.9 4.4 5.3 –6.3 9.2 –3.1 48.8 3.5 –7.1 5.7Total budget allocation 7.5 8.4 7.0 3.6 10.2 8.6 2.8 4.2 2.5 5.0 1.8 –6.6 3.91. Items under Poverty Alleviation Programmes2. Total of items under Poverty Alleviation Programmes3. AAGR =Annual Average Growth Rate (%)Source: Computed from the information given in Expenditure Budget, Volume 2, Government of India, various years
Table 15 Trends in Central Government budget expenditure (Rs bn) on Rural and Urban Development, Food and Public Distribution andSocial Justice with special reference to Poverty Alleviation Programmes, 1990–2002 (constant 1993/4 prices