Page 1
Emerging Trends
In
India’s Steel Tubes and Pipes Industry
Project conducted in ET Intelligence Group in June / July 2013
Submitted By:
Karan Ashar
Project done under the guidance of:
Ramkrishna Kashelkar,
ET Intelligence Group
Project Report submitted to:
1. Rahul Joshi, Executive Editor, The Economic Times
2. Shaji Vikraman, Head of ET Intelligence Group
Page 2
2
TABLE OF CONTENTS
EXECUTIVE SUMMARY 3
INDUSTRY OVERVIEW 4
STRUCTURE OF THE INDUSTRY 6
PRODUCT SUMMARY 7
KEY GROWTH DRIVER 8
INTERNATIONAL DEMAND DRIVERS 9
DOMESTIC DEMAND DRIVERS 12
KEY CHALLENGES 15
INDUSTRY FINANCIALS 16
COMPANY FINANCIALS AT A GLANCE 21
A PLAYER TO WATCH FOR 23
BIBLIOGRAPHY 26
Page 3
3
EXECUTIVE SUMMARY
The last decade experienced an evolution in the Indian steel industry, with steel and iron
ore producers expanding their operations on a global scale. On the contrary, the Indian
steel pipe industry witnessed slow growth; however, with promising prospects. At
present, the Indian steel pipe industry enjoys growth through demand on a domestic and
global level, particularly from the oil & gas sector.
For investors the industry has not proven to be a value creator for last five years, rather,
in case of several leading companies the market capitalization has drastically fallen due
to various reasons. While company specific issues, such as high indebtedness, unhedged
forex exposure or promoters pledging their shares, were responsible, the industry also
suffered from growing competition amid raw material price volatility keeping the
margins under check.
Nevertheless, it’s not all gloom and doom. A large growth potential is waiting to be
exploited, with steel tubes and pipes finding robust demand from various sectors in the
domestic market like infrastructure, engineering, real estate, telecommunication, powers,
metros, ports and airports. Globally the petroleum Exploration & Production (E&P)
industry – particularly after the advent of shale gas boom in the US – is providing a
growing demand for the industry.
This is creating a scenario where leaders of the past are falling behind weighed down by
their own set of problems, and mid-sized players are fast emerging as the new leaders of
the industry. For example, the leading players Welspun Corp and Jindal Saw are seen
under pressure due to high debt and pledged shares etc. It then follows that the investors
should focus on these players who are showing promise for the future growth rather than
getting discouraged by the dispirited performance of the leaders.
Page 4
4
INDUSTRY OVERVIEW
India has become a leading country in the world for manufacturing steel pipes mainly due
to its lower cost, high quality and geographical advantages. Still, if compared to the huge
steel industry, the size of domestic steel tubes and pipes industry is a relatively small.
Almost all the major steel manufactures such as SAIL, Tata Steel, Jindal Stainless, Essar
Steel etc. have presence in the pipe manufacturing as a way of forward integration.
However, for their main line of business this forms a minor part. There exists a parallel
industry of focused players who act as converters. The key challenge they face is the high
dependency on purchased raw material, which is as high as 70%-80% of revenues for
some.
The steel tubes and pipes industry caters primarily to the needs to flowing materials to
desired distance under pressure and force. What material needs to be flowed and under
what pressure, temperature etc determines the complexity of the pipes. Every industrial
complex or manufacturing unit usually needs a large amount of piping and plumbing to
work with various types of fluids including water. Of course, here the steel pipes compete
with pipes made from various other materials ranging from cement to plastics depending
on the required usage.
Infrastructure sector also generates a chunk of demand for the industry owing to the fact
that a hollow tube is generally more efficient than a rod in constructions. Thus
construction of dams, power projects, railways and bridges etc. typically consume a huge
quantity of pipes. Polished steel pipes are also being increasingly used to add glitz to the
interiors of malls as well as hotels.
High level of tensile strength and corrosion resistance has made the steel pipes a
preferred option in the oil & gas industry – particularly in the exploration and production
phase. Sensing the opportunity in this sector, Indian companies have been proactive in
obtaining global accreditations and certifications, enabling them to supply to most of the
world’s largest petroleum companies.
Page 5
5
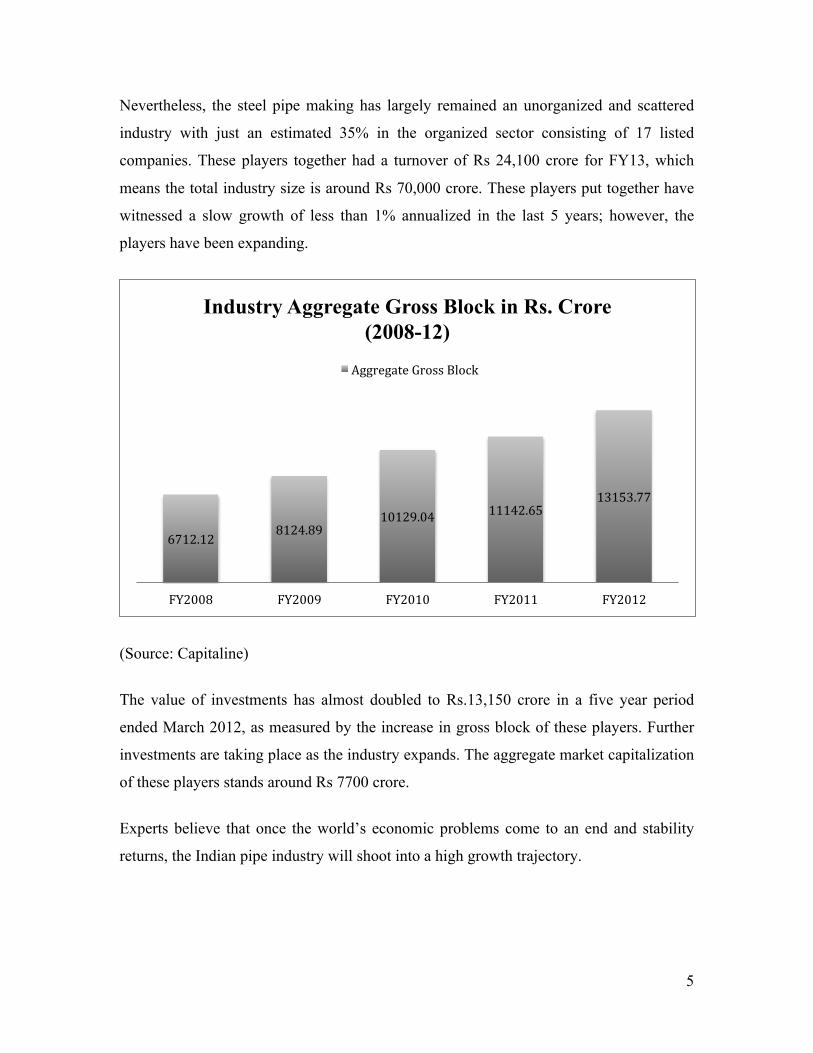
Nevertheless, the steel pipe making has largely remained an unorganized and scattered
industry with just an estimated 35% in the organized sector consisting of 17 listed
companies. These players together had a turnover of Rs 24,100 crore for FY13, which
means the total industry size is around Rs 70,000 crore. These players put together have
witnessed a slow growth of less than 1% annualized in the last 5 years; however, the
players have been expanding.
(Source: Capitaline)
The value of investments has almost doubled to Rs.13,150 crore in a five year period
ended March 2012, as measured by the increase in gross block of these players. Further
investments are taking place as the industry expands. The aggregate market capitalization
of these players stands around Rs 7700 crore.
Experts believe that once the world’s economic problems come to an end and stability
returns, the Indian pipe industry will shoot into a high growth trajectory.
6712.12 8124.89
10129.04 11142.65 13153.77
FY2008 FY2009 FY2010 FY2011 FY2012
Industry Aggregate Gross Block in Rs. Crore (2008-12)
Aggregate Gross Block
Page 6
6
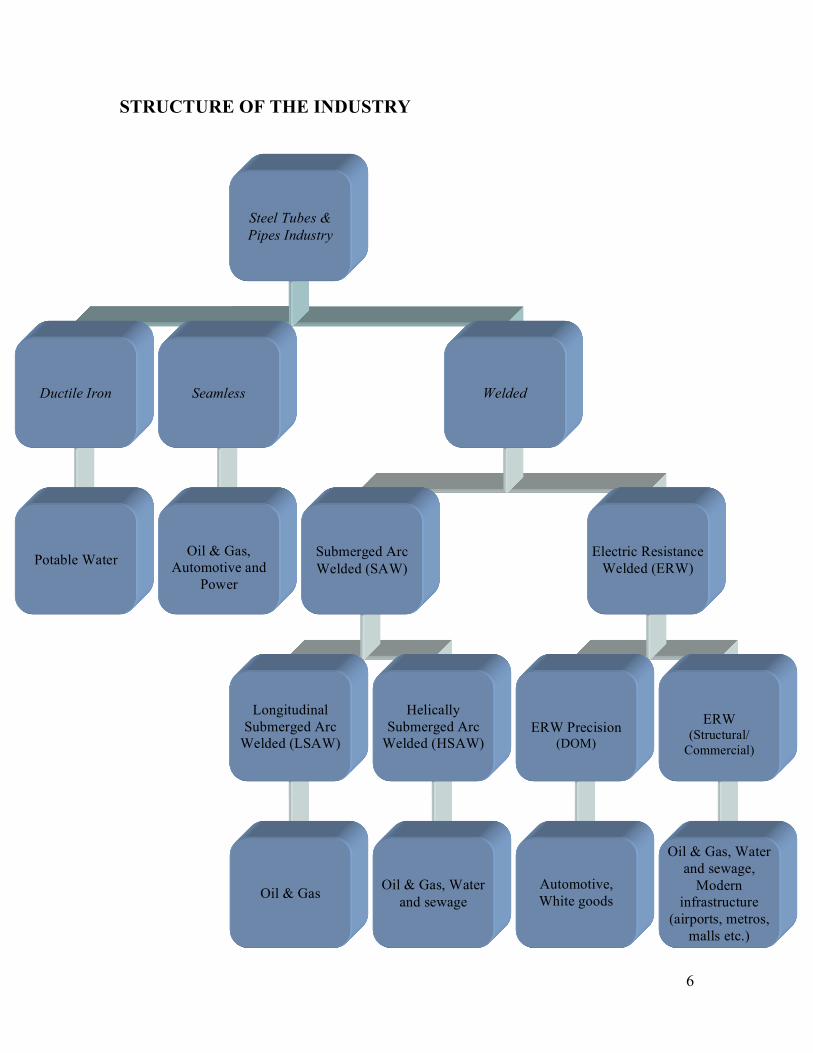
STRUCTURE OF THE INDUSTRY
Steel Tubes & Pipes Industry
Ductile Iron Seamless Welded
Submerged Arc Welded (SAW) Potable Water
Oil & Gas,
Automotive and Power
Longitudinal Submerged Arc
Welded (LSAW)
Helically Submerged Arc
Welded (HSAW)
Electric Resistance
Welded (ERW)
ERW Precision (DOM)
ERW (Structural/
Commercial)
Automotive, White goods
Oil & Gas, Water and sewage,
Modern infrastructure
(airports, metros, malls etc.)
Oil & Gas, Water and sewage Oil & Gas
Page 7
7
PRODUCT SUMMARY
Pipe
Features
Ductile Iron
Seamless
LSAW
HSAW
ERW Precision
(DOM)
ERW (Structural/
Commercial)
Size 3” to 40”
diameter
0.5” to 14”
diameter
16” to 50”
diameter
18” to 120”
diameter
0.5” to 4.5”
diameter
0.5” to 22”
diameter
Key raw
material
Pig iron/ Cast
iron/ Sponge
iron
Steel billets Steel plates HR Coils HR Coils HR Coils
Manufacturing
process
Pig iron in blast
furnace
Piercing
ingots/billets of
steel at high
temperatures
Longitudinally
submerged arc
welding
of steel plates
Spirally
welding
HR coils
Converging HR
coils welded using
high frequency
induction welding
Hot rolled steel
coils using
electrical
resistance welding
process
Application Potable water
transportation
Oil & Gas
Exploration,
Engineering
Oil & Gas
Transportation
Oil & Gas/
Water
Transportat
ion
Automotive, White
goods
Oil & Gas (city gas
distribution), Water
and sewage,
Modern
infrastructure
Key players Electrosteel,
Jindal SAW
Maharashtra
Seamless,
Jindal SAW,
Remi Metals
Jindal Saw,
Welspun Corp,
Man
Industries
PSL, Jindal
Saw,
Welspun
Corp, Man
Industries
Tata Steel,
Innoventive
APL Apollo, Surya
Roshni,
Maharashtra
Seamless
Page 8
8
KEY GROWTH DRIVERS
The steel tubes and pipes find application in a variety of industries including Oil & Gas
exploration, production and transportation as well as Infrastructure projects such as
railways, ports and airports, water projects etc.
The global oil & gas industry has proven to be a major demand driver for Indian steel
tubes and pipes industry — particularly the seamless variety in exploration & production.
With global gas demand expected to rise by 576 million cubic meters from 2012 to 2017,
and emphasis on usage of natural gas, the surge in demand for pipes harbors huge
prospects for the Indian pipe industry to penetrate into the international market and at the
same time maintain interest in a developing domestic market. With energy demand
expected to rise by 60.71% in India by 2025, the domestic market has the potential to
support the growth of the industry.
Oil and gas along with coal continue to be the most widely used fuels, with their global
consumption expected comprise 80% of the energy consumption in 2040. Asia,
responsible for 20% of the global gas consumption and 30% of global pipe demand, is
expected to provide a suitable market for Indian steel pipe makers to target. However, a
global recession has hindered the prospects for growth.
Within India also there exist a number of growth drivers for the steel pipes industry. By
2017, India will have a natural gas pipeline grid stretching 30,000 Km connecting
consumption centers to fuel sources. The 11th Five Year Plan (2007-12) announced by the
government had introduced the decision of investing $83 billion in the water and
irrigation system, thereby deriving demand from water projects.
Being, a developing country, India has laid emphasis on infrastructure, ranging from
malls to airports. Similarly, sectors such as real estate, automobiles and
telecommunications among others hold potential to drive the demand for the pipe
industry.
Page 9
9
International Demand Drivers
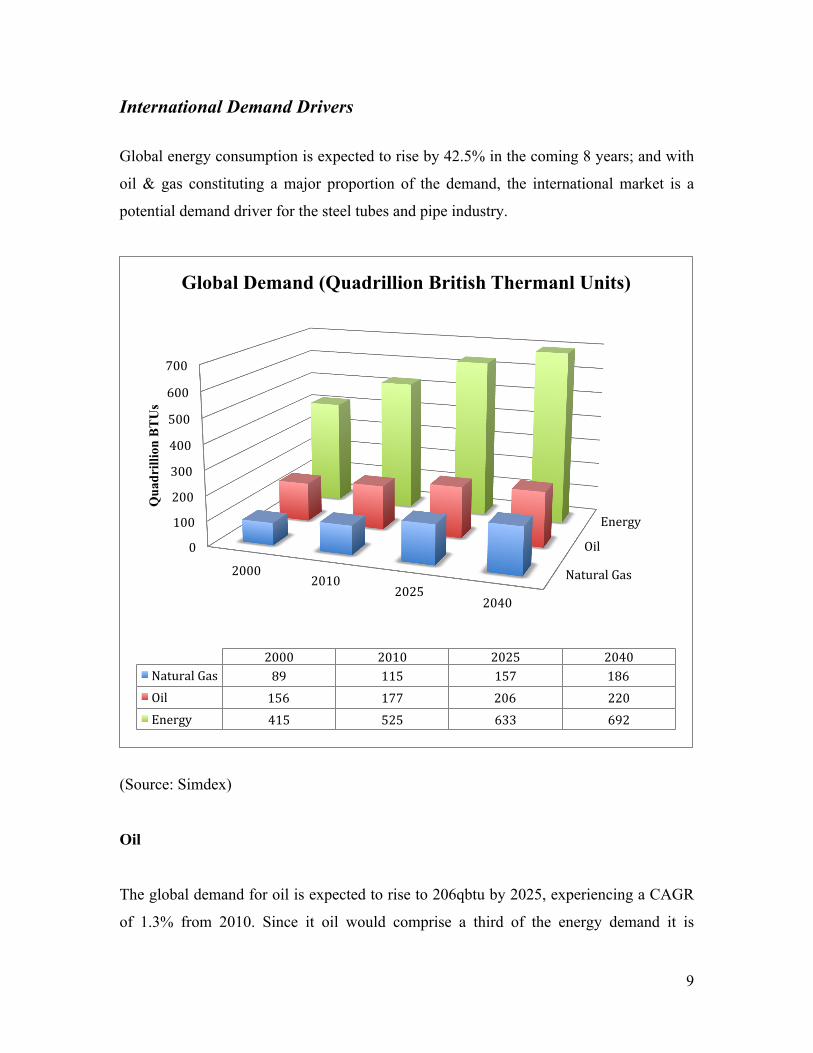
Global energy consumption is expected to rise by 42.5% in the coming 8 years; and with
oil & gas constituting a major proportion of the demand, the international market is a
potential demand driver for the steel tubes and pipe industry.
(Source: Simdex)
Oil
The global demand for oil is expected to rise to 206qbtu by 2025, experiencing a CAGR
of 1.3% from 2010. Since it oil would comprise a third of the energy demand it is
Natural Gas
Oil
Energy
0
100
200
300
400
500
600
700
2000 2010
2025 2040
Qua
drill
ion
BT
Us
2000 2010 2025 2040 Natural Gas 89 115 157 186 Oil 156 177 206 220 Energy 415 525 633 692
Global Demand (Quadrillion British Thermanl Units)
Page 10
10
important for the Indian steel pipe manufacturers to take advantage of the opportunity
presented on the international market. Besides, 2012 recorded a global oil supply capacity
of 91.9 mb/d; this figure is expected to rise by 2016 to 100.6 mb/d, providing an impetus
for the industry to meet the increasing necessity for transportation of oil.
Natural Gas
With oil consumption outstripping oil production there raises a need for an alternative
source of energy, with natural gas being a viable option since it is cheaper than oil.
Besides, it is the cleanest fossil fuel and hence will play an important part in the coming
years. The consumption of fossil fuel in 2008 reached 111 trillion cubic feet, and the
figure is expected to rise to 169 trillion cubic feet, and increase of 52.3%. With the global
demand for natural gas predicted to rise at CAGR of 2.1% from 2010-25, the steel pipe
manufacturers will aim to draw demand from its consumption.
Future pipeline projects: Oil and Gas Transportation and Exploration
(Source: Simdex) [Figures in number of projects (%)]
North America, 192 (27%)
Latin America, 56 (8%)
Europe , 101 (14%)
Africa, 49 (7%)
Middle East , 111 (16%)
Asia, 142 (20%)
Australia, 59 (8%)
Page 11
11
27% of the future pipeline projects are directed towards North America, whereas Asia
holds the second largest share of 142 projects. Since several countries in Asia are in the
developing stage, primarily India and China, it is likely that the along with a demand in
energy, mainly oil and natural gas, there will be an increase in the figure for number of
pipeline projects. Besides demand for pipes for transportation and exploration in the
Middle East, Asia and North America harbor great potential to drive growth of the steel
pipe industry.
Future pipeline projects (Km): Oil and Gas Transportation and Exploration
(Source: Simdex)
Around a third of the total length of pipeline projects is directed towards Asia, primarily
due to developing countries such as India and China. Despite having fewer projects than
North America, the average length of each pipeline project for Asia is 669 Km as
compared to 384 Km for North America. Middle East contributes to 13% of the total
length, where as Europe holds a similar share with 44784 Km of pipeline projects.
0
20000
40000
60000
80000
100000
North America
Latin America
Europe Africa Middle East Asia Australia
Length of Pipeline Projects
Page 12
12
Domestic Demand Drivers
India is poised in the top 3 steel tube/pipe manufacturing hub after Japan and Europe with
production estimated to be 10 million tonnes. Being a developing country, India holds
several sectors that can generate demand for steel tube and pipes.
Power
The 12th 5 year plan (2012-2017) announced by the government added 1,00,000 MW
power capacity with proposed 17426 ckm transmission lines in central, state and private
sector for 2012-13. The power capacity is almost doubled as compared to the estimated
installation of 52,000 MW during the 11th Five Year plan. Hence the power sector will be
a major force in propelling the demand for steel tubes and pipes.
Oil & Gas
India is ranked as the world’s fifth largest energy consumer, with 30% of the total energy
consumption accountable to oil. India has 5.8 billion barrels of proven oil reserves with
an average oil production of 815,000 barrels per day (B/D). With oil consumption
expected to rise to 4 million barrels B/D by 2015, there will be an increased demand on
steel pipes for transportation. Besides, 78% of the country’s sedimentary area is yet to be
explored; hence, stressing on the importance of the industry to provide tubes and pipes
for exploration.
Gas consumption in India is predicted to grow at a CAGR of 7.7% due to slower gas
supplies. However, the total gas demand for the previous year stood at 253 million metric
standard cubic feet per day (mmscmd) and is expected to touch 550 mmscmd by 2019-
20. As a result the increased consumption for gas will help trigger the demand for steel
pipe manufacturers.
Page 13
13
Ports
Steel tubes and pipes find major application in ports. The Indian coastline extends 7500
Km long and harbors 13 major ports and 200 minor ports. With the need for
development, the Indian government has announced an investment of US$110 billion for
improving its ports and shipbuilding industry by 2020.
Airports
With 136 airports, India presents itself as the 9th largest aviation market. According to the
12th 5-year plan Rs. 547.43 billion was injected into the aviation sector, which is expected
to grow at CAGR of 16% in the years 2010-13. The government has also targeted to
invest US$30 billion in the next decade with the intention to modernize Indian airports.
Besides, 16 Greenfield airports have been approved, of which 12 of them are in their
developing stage.
Water projects
Covering significant sectors such as water transportation, irrigation and drainage, water
projects are beneficial to the steel pipe industry. Transportation of potable water across
several homes in the country will draw demand for tubes and pipes. Besides, a proposal
to allocate Rs 3,000 million to Vidarbha Intensified Irrigation Development Programme
under Rashtriya Krishi Vikas Yojana (RKVY) will provide for increased irrigation and
higher demand for steel pipes/tubes.
Shale Gas
Due to its recent discovery, shale gas has not immediately found its application in India.
However, India boasts 537 trillion cubic feet (tcf) of shale gas in 28 sedimentary basins.
Of this figure around 260 tcf is estimated to be recoverable. Hence, the importance for
exploration, production and transportation of shale gas has fostered the need for steel
Page 14
14
pipes and tubes. The capability of Indian shale gas reserves to extract enough gas to
support the nation for 200 years has generated significance and hence the propelled
demand in the steel pipes industry.
Automobile
An important component in the construction of cars, steel tubes and pipes are likely to
expect demand due to the growth of the automotive industry. The Center for Monitoring
Indian Economy predicted a rise in overall automobile production by a healthy 9.6% in
2012-13 wherein commercial vehicle production is expected to expand by 8.5%. Where
two wheelers production is expected to grow at 9.7%, multi utility vehicle is expected to
experience a rampant 19.7% rise.
City Gas Distribution
The city gas distribution has a network of 26,500 Km spread across India significantly
over western and northern parts of the country. Though CGD comprises of approximately
8-9% of the total gas consumption in India, pipe manufactures can seek respite in the fact
that improvements in the pipeline infrastructure are required on south and east India.
According to the 12th 5-year plan, the CGD sector plans to achieve a CAGR of 28.8%
from 13 mmscmd to 46 mmscmd, thereby triggering demand for the industry.
Besides, several sectors play an important part in propelling the demand for steel tubes
and pipes. Real estate, which grew promisingly in the past few years, generated sales for
the industry. However, with real estate sector in decline mode, it seems less likely to play
major role in the future. Alternatively, transportation of potable water and sewage
treatment require ductile iron pipes, where as bridges and bus body parts will also
contribute to the growth of the industry. Additionally, metros and construction of bridges
will increase the need for steel tubes and pipes.
Page 15
15
KEY CHALLENGES
Although the industry’s growth prospects appear lucrative, most of the domestic players
have been under-performing for last several years. This underlines the fact that the
industry is facing a bunch of uphill tasks.
1. Fluctuations in raw material prices: Since the pipe manufacturers are dependent
on steel as the key input, volatility in steel and iron price hurts them directly.
2. Weak Global Economic Growth: Economic growth and Development tends to
be directly correlated with increased energy consumption. The slowdown and
uncertainties in world’s economic growth has resulted in slowing down
investments in industrial capacities, which is having a negative impact on the
overall demand for pipe industry.
3. Growing Competition: The pipe-making industry is facing growing competition
on domestic as well as international front. Within India most of the players have
aggressively expanded pipe-making capacities in last five years — the gross block
of the listed players has doubled between FY08 and FY12 — with a few players
such as APL Apollo still in expansion mode. Globally, countries like China and
Turkey have seen a growing number of pipe-making companies competing with
Indian players for the international projects.
4. Anti-dumping duty in the US: With a view to protect the domestic steel pipe
makers US has imposed an anti-dumping duty on Indian steel pipes since 2011.
This erodes the competitiveness of Indian products in the US, which is seeing a
burst in demand thanks to the shale gas boom.
5. Weakening Financials: The domestic industry has also become a victim of its
own aggressive growth, as the current status of financial health appears weak. The
industry has seen slowing sales growth and dwindling margins with key return
ratios such as RoCE and RoE falling consistently.
Page 16
16
INDUSTRY FINANCIALS
The industry’s performance of last five years has not been exciting with leading players
facing challenges on revenue growth. As the graph below shows industry leaders such as
Welspun Corp and Jindal Saw had just 10% higher revenues in FY13 as compared to
FY09, while Maharashtra Seamless, Man Industries and PSL are selling less than five
years back.
6109.68 6905.83 6270.4 5769.71 6632.17
5161.06
6974.81
4345.26 5190.72 5612.86
3487.96
2761.52
2578.67 2346.94 2201.32
2183.51
1691.22
1761.27 2291.69 1722.01
4528.3 4081.73
4664.09 5784.74 5649.5
FY2009 FY2010 F2011 FY2012 FY2013
Aggregate Gross Sales in Rs. Crore (2009-13)
Others (Ratnamani, APL Apollo, Man Industry etc.)
Mah. Seamless
PSL
Jindal Saw
Welspun Corp
Page 17
17
On this backdrop, mid-sized firms like APL Apollo and Innoventive Industries have done
exceedingly well with their revenues more than doubling in last five years.
The industry’s operating profit margins have also been under pressure for last four years
after peaking in FY10. This has also impacted the industry’s ability to generate profits.
The aggregate operating profit of all the listed players in FY13 was barely crossing the
profit levels five years back.
Again in this case, the large sized players Welspun Corp and Jindal Saw have suffered
the biggest margin erosion, while Ratnamani Metals, Man Industries and PSL have
witnessed healthy improvement in margins in this period. For FY13 Ratnamani Metals
enjoyed the best operating profit margins of 21.3% as against APL Apollo that had 8%
PBDIT margin.
2758.24
4016.22 3510.61
2939.45 2788.03
13.3
17.8 16.8
13 11.7
0
2
4
6
8
10
12
14
16
18
20
0
500
1000
1500
2000
2500
3000
3500
4000
4500
FY2009 FY2010 FY2011 FY2012 FY2013
Aggregate Operating Profit in Rs. Crore (2009-13)
Operating ProTit Operating ProTit Margin
Page 18
18
The industry has seen overall leverage coming down steadily in last five years. However,
a weakness in overall operating profit margins, coupled with rising interest rates has
resulted in industry’s interest coverage ratio deteriorating to a very low level.
When it comes to the leverage, Maharashtra Seamless is the best placed presently with a
debt-equity ratio of 0.02. Naturally, it is also best placed on the interest coverage ratio
with operating profits sufficient to cover 39.2 times its interest commitment.
On the other side of the spectrum, PSL is carrying the biggest chunk of debt compared to
its equity, with a D/E ratio of 2.9. At 0.9, its interest coverage ratio is one of the lowest
in the industry.
2 1.4 0.6 0.8
0.7
4.2
6.4
5.1
3.5
2.4
FY2009 FY2010 FY2011 FY2012 FY2013
Leverage Ratios (2009-13)
D/E Ratio Interest Covergae Ratio
Page 19
19
On an aggregate level, the return ratios for the industry have been trending downwards
after peaking out in FY10. The industry’s Return on Capital Employed (RoCE) has
dwindled to 12.6% in FY13 from 23.5% of FY10. This is both on account of a slowdown
in revenue growth and margins on one hand and growing investment in the industry on
the other. This has proved to be one key factor in destroying investor value.
In a likewise manner the Return on Equity (RoE) — a matrix that equity investors need to
watch out closely — has dropped to an abysmally low level in FY13.
At the end of FY13, Ratnamani recorded the highest RoCE at 43.7%, whereas Mah.
Seamless slumped to 8.4%. As for RoE, Ratnamani was again the standout performer
with a ratio of 29.6%. With respect to the bottom end, Innoventive experienced a poor
RoE of 2.9%.
20.6%
23.5%
16.3%
11.6% 12.6%
8.7%
14.2%
11.4% 6.9%
2.9%
FY2009 FY2010 FY2011 FY2012 FY2013
Return Ratios (2009-13)
RoCE RoE
Page 20
20
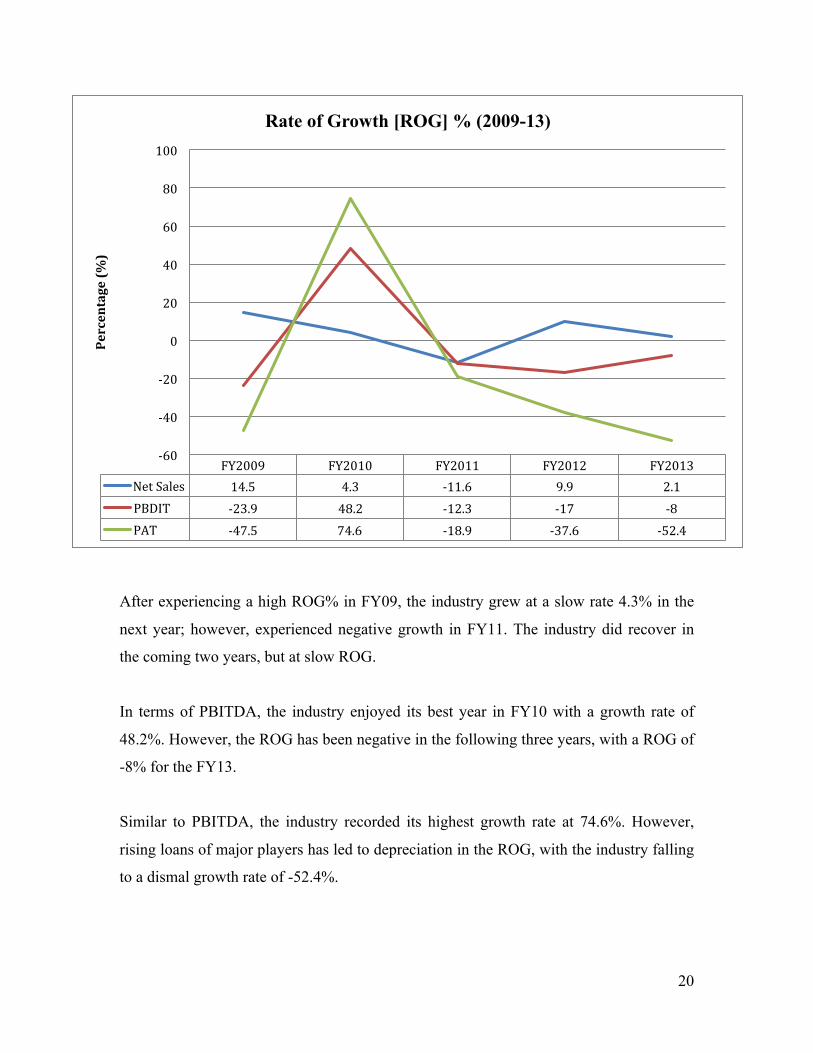
After experiencing a high ROG% in FY09, the industry grew at a slow rate 4.3% in the
next year; however, experienced negative growth in FY11. The industry did recover in
the coming two years, but at slow ROG.
In terms of PBITDA, the industry enjoyed its best year in FY10 with a growth rate of
48.2%. However, the ROG has been negative in the following three years, with a ROG of
-8% for the FY13.
Similar to PBITDA, the industry recorded its highest growth rate at 74.6%. However,
rising loans of major players has led to depreciation in the ROG, with the industry falling
to a dismal growth rate of -52.4%.
FY2009 FY2010 FY2011 FY2012 FY2013 Net Sales 14.5 4.3 -‐11.6 9.9 2.1 PBDIT -‐23.9 48.2 -‐12.3 -‐17 -‐8 PAT -‐47.5 74.6 -‐18.9 -‐37.6 -‐52.4
-‐60
-‐40
-‐20
0
20
40
60
80
100
Percentage (%
)
Rate of Growth [ROG] % (2009-13)
Page 21
21
COMPANY FINANCIALS AT A GLANCE
Company Financials
Welspun Corp
Jindal Saw
PSL
Mah. Seamless
APL Apollo
Man Inds.
Ratnamani Metals
Innoventive Ind.
Remi
Metals Guj.
Zenith Birla
Networth (Rs. Cr.)
3626.1
3728.6
949.5
2848.1
334.8
630.7
597.3
462.2
-182.1
255.7
Networth – 3 Year
CAGR (%)
9.8
1.8
4.2
22.6
19.5
10.7
17.9
87.3
N/A
11.4
Gross Block (Rs. Cr.)
3174.5
2572.8
1376.4
539.9
115.1
590.8
529.3
336.0
428.8
125.4
Gross Block – 3 Year
CAGR (%)
13.8
24.7
25.9
33.3
47.0
1.5
7.8
47.9
8.9
4.7
Net Sales (Rs. Cr.)
6632.2
5612.9
2134.3
1722.0
1609.1
1408.8
1201.1
636.2
353.0
273.2
Net Sales – 3 Year
CAGR (%)
0.0
-6.1
-8.2
2.6
61.9
-2.6
12.1
17.6
-1.7
-17.1
Net Profit (Rs. Cr.)
53.1
193.4
-156.0
153.3
34.7
100.7
136.0
56.5
-93.3
-44.7
Net Profit – 3 Year
CAGR (%)
-53.9
-35.6
N/A
-18.6
26.2
14.5
18.6
27.3
N/A
N/A
OPM (%)
9.3
10.2
14.8
14.0
5.9
16.0
21.3
26.7
-6.4
-6.0
Market Cap (Rs. Cr.)
1132.0
1585.4
125.4
1409.4
352.0
596.7
668.2
430.6
11.9
13.1
P/E Ratio
13.3
5.7
0.0
9.2
10.1
4.3
4.9
7.6
0.0
0.0
P/BV Ratio
0.3
0.4
0.2
0.6
1.0
0.8
1.0
0.9
-0.1
0.1
D/E Ratio
0.7
0.9
2.9
0.0
1.1
0.8
0.3
0.5
N/A
0.8
Current Ratio
1.2
2.6
0.9
6.7
5.1
1.9
2.1
1.5
0.9
2.1
Page 22
22
Company Financials
Welspun Corp
Jindal Saw
PSL
Mah. Seamless
APL Apollo
Man Inds.
Ratnamani Metals
Innoventive Ind.
Remi Metals Guj.
Zenith Birla
RoCE (%)
10.8
9.0
14.9
8.4
20.1
35.6
43.7
21.3
N/A
N/A
RoE (%)
4.7
10.3
5.9
6.8
4.2
7.5
27.6
2.9
N/A
N/A
Promoters Holding
(%)
34.9
46.0
39.4
55.7
47.3
51.6
59.9
45.4
87.3
7.6
Institutional Holding
(%)
20.6
29.9
13.0
25.2
9.7
9.5
13.2
24.3
0.1
3.6
Dividend (%)
10.0
50.0
0.0
120.0
50.0
40.0
200.0
10.0
0.0
0.0
Page 23
23
A PLAYER TO WATCH FOR
APL Apollo
With major companies of the industry recording negative or slow growth over the past 5
years, APL Apollo has displayed positive margins as compared to its peers. With 44%
revenue growth in FY13 and a CAGR of 49% over FY08-13, APL Apollo has posted
robust and consistent growth, highest amongst peers. At a production capacity of 600,000
TPA, APL enjoys 7% of the domestic market share for ERW pipes, gaining share from
the unorganized sector through its product superiority, reach and strategic expansion.
Valuation
APL Apollo is currently trading at a price to earnings multiple (P/E) of 5.5 as compared
to an average multiple of 2.7 of its peers. Similarly, its price to book value ratio (P/BV) is
0.55 below in line with an average value of 0.57 of its peers. Considering the growth
prospects, healthy balance sheet and attractive return ratios the company is likely to
emerge a value creator over the next 3 years
Unorganized Sector 60%
APL Apollo 7%
Other Organized Sector 33%
ERW Market Share
Page 24
24
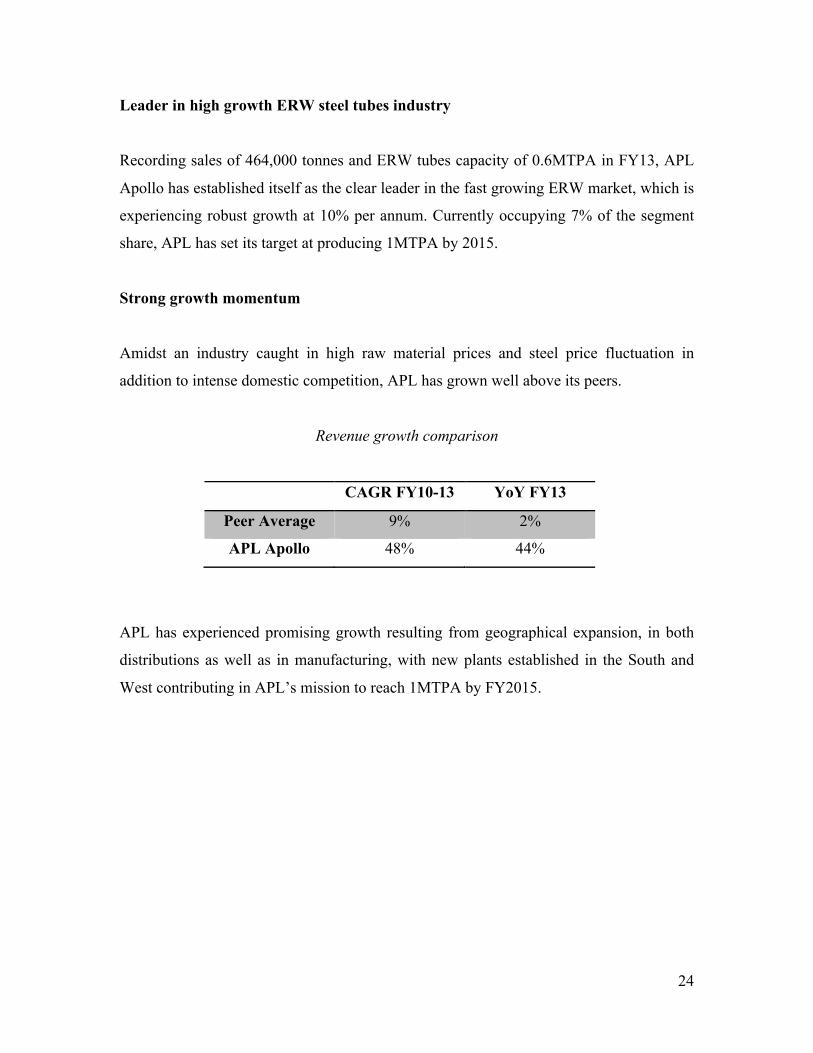
Leader in high growth ERW steel tubes industry
Recording sales of 464,000 tonnes and ERW tubes capacity of 0.6MTPA in FY13, APL
Apollo has established itself as the clear leader in the fast growing ERW market, which is
experiencing robust growth at 10% per annum. Currently occupying 7% of the segment
share, APL has set its target at producing 1MTPA by 2015.
Strong growth momentum
Amidst an industry caught in high raw material prices and steel price fluctuation in
addition to intense domestic competition, APL has grown well above its peers.
Revenue growth comparison
CAGR FY10-13 YoY FY13
Peer Average 9% 2%
APL Apollo 48% 44%
APL has experienced promising growth resulting from geographical expansion, in both
distributions as well as in manufacturing, with new plants established in the South and
West contributing in APL’s mission to reach 1MTPA by FY2015.
Page 25
25
Financial summary (Rs. Crore)
Year
Financials
FY2010 FY2011 FY2012 FY2013
Revenues 618.00 905.20 1392.30 2008.30
EBITDA 57.10 89.70 115.10 159.50
PAT 29.80 43.10 49.10 68.60
EPS 14.7 21.2 23.0 30.7
EBITDA margin 9.2% 9.9% 8.3% 7.9%
Net margin 4.8% 4.8% 3.5% 3.4%
RoE 16.7% 20.2% 18.3% 20.6%
RoCE 15.4% 20.3% 19.7% 21.2%
D/E 0.8 1.0 1.0 1.2
P/E 7.6 6.2 7.7 5.5
EV/EBITDA 6.2 5.4 5.8 4.9
Dividend payout 13.6% 9.4% 8.7% 16.3%
Page 26
26
BIBLIOGRAPHY
Following Sources and References were extensively used in preparation of the report:
1) Capitaline Corporate Database for all the Financial Numbers
2) Annual Reports of all the leading companies in the Steel Pipe making industry
such as Welspun Corp, Jindal SAW, Maharashtra Seamless, PSL Limited, APL
Apollo etc.
3) Annual Reports of leading Steel manufacturing companies such as Tata Steel,
Essar Steel, JSW Steel, Jindal Stainless
4) Presentations and Concall Transcripts of the companies, wherever available
5) Historical references from websites of Economic Times, Mint, Business Standard
6) Research Reports from various brokerage houses on the industry and players
7) SIMDEX, which is a leading provider of worldwide pipeline projects and metal
tube manufacturers
8) www.etintelligence.com
9) Websites of Bombay Stock Exchange (BSE) and National Stock Exchange (NSE)
Contact Details:
Name: Karan Ashar
Email ID: [email protected]
Phone No.: 9920043665