DOI: 10.1126/science.1207969 , 576 (2011); 333 ScienceK. S. James India's Demographic Change: Opportunities and Challenges This copy is for your personal, non-commercial use only. clicking here. colleagues, clients, or customers by , you can order high-quality copies for your If you wish to distribute this article to others here. following the guidelines can be obtained by Permission to republish or repurpose articles or portions of articles ):October 28, 2013www.sciencemag.org (this information is current as ofThe following resources related to this article are available online athttp://www.sciencemag.org/content/333/6042/576.full.html version of this article at: including high-resolution figures, can be found in the online Updated information and services, http://www.sciencemag.org/content/333/6042/576.full.html#related-urls 1 articles hosted by HighWire Press; see: cited by This article has been http://www.sciencemag.org/cgi/collection/economics Economics subject collections: This article appears in the following registered trademark of AAAS. is a Science2011 by the American Association for the Advancement of Science; all rights reserved. The title Copyright American Association for the Advancement of Science, 1200 New York Avenue NW, Washington, DC 20005. (print ISSN 0036-8075; online ISSN 1095-9203) is published weekly, except the last week in December, by the Science o n O c t o b e r 2 8 , 2 0 1 3 w w w . s c i e n c e m a g . o r g D o w n l o a d e d f r o m o n O c t o b e r 2 8 , 2 0 1 3 w w w . s c i e n c e m a g . o r g D o w n l o a d e d f r o m o n O c t o b e r 2 8 , 2 0 1 3 w w w . s c i e n c e m a g . o r g D o w n l o a d e d f r o m o n O c t o b e r 2 8 , 2 0 1 3 w w w . s c i e n c e m a g . o r g D o w n l o a d e d f r o m o n O c t o b e r 2 8 , 2 0 1 3 w w w . s c i e n c e m a g . o r g D o w n l o a d e d f r o m o n O c t o b e r 2 8 , 2 0 1 3 w w w . s c i e n c e m a g . o r g D o w n l o a d e d f r o m
Transcript
8/13/2019 Indias Demographic Change- Opportunities and Challenges
subject collections:This article appears in the following
registered trademark of AAAS.is aScience 2011 by the American Association for the Advancement of Science; all rights reserved. The title
CopyrighAmerican Association for the Advancement of Science, 1200 New York Avenue NW, Washington, DC 20005.(print ISSN 0036-8075; online ISSN 1095-9203) is published weekly, except the last week in December, by thScience
decade later (5, 7 ). The life expectancy achieve-
ment, on the contrary, is more rapid according to
the PFI-PRB projection. The life expectancy of
70 years will be achieved by around 2025 accord-
ing to the PFI-PRB projection and a decade later
according to UNPD (5, 7 ). International migration
has not figured to a substantial extent in any of
these projections because the current incidence of international outmigration from India is too minor
to alter the projected final population totals.
The ultimate population size
in India will critically depend
on all the anticipated changes to
fertility, mortality, and migra-
tion.It is possible that the current
fertility transition and its future
trends may completely redefine
the ultimate size of India’s pop-
ulation. It may be remembered
that there is a high level of un-
certainty that is unavoidable in
any long-run population projec-tion. For instance, themathemat-
ical projection by Kingsley Davis
in 1951, which estimated a pop-
ulation of only 790 million for
India and Pakistan in 2001, was
obviously much off the mark (9).
Similarly, the projection by Coale
and Hoover estimated a popu-
lation of about 120million above
the 2001enumerated census pop-
ulation (10). Even with all the
uncertainty, it may be safely ar-
gued that India will overtake
China and become the most pop-ulous country in the world with-
in the next two decades. The population will
continue to grow at least until 2050, despite all the
expected changes.
India’s Demographic Transition
and Heterogeneity
It is now vividly evident that the demographic
character of India’s population is changing rap-
idly. India is now entering the final stages of
demographic transition, with the country nearing
replacement-level fertility. Of late, the demo-
graphic scenario in India has been viewed more
optimistically as compared with the widespread
anguish that was evident a few decades earlier,
with successive census figures providing hardly
any major change in the growth rate of population
(2, 3). The classical demographic transition that is
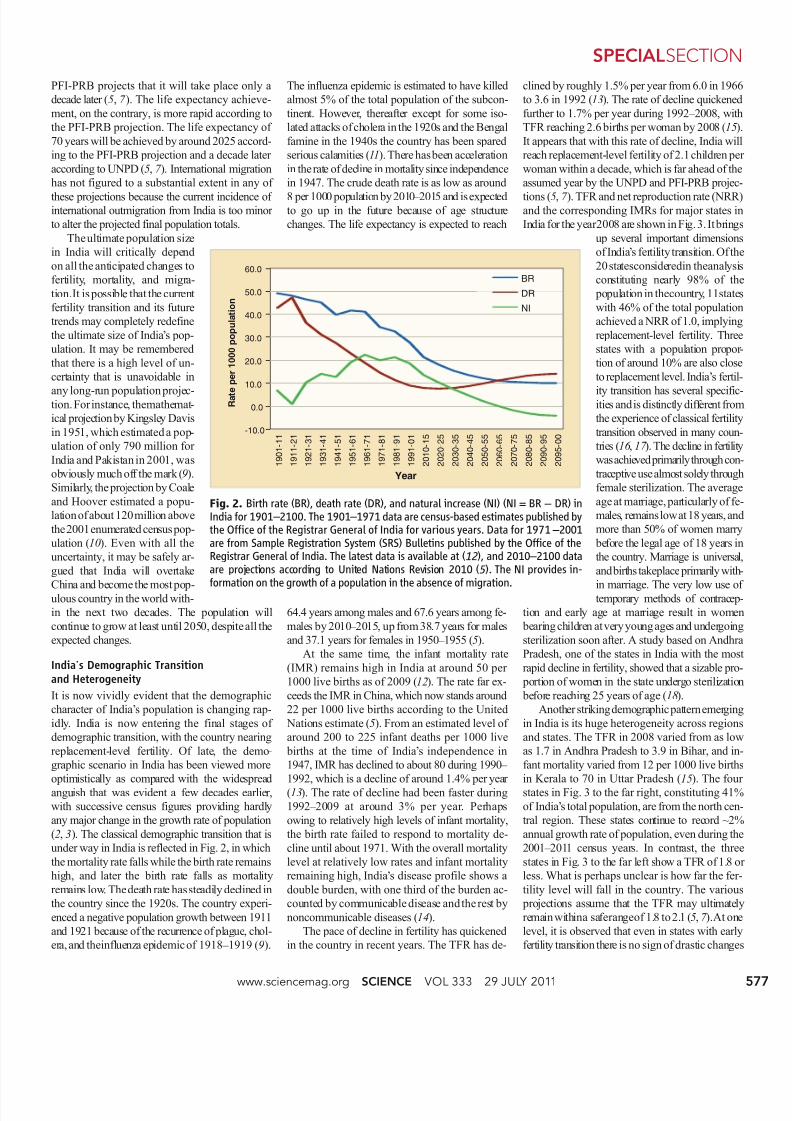
under way in India is reflected in Fig. 2, in which
the mortality rate falls while the birth rate remains
high, and later the birth rate falls as mortality
remains low. The death rate hassteadily declined in
the country since the 1920s. The country experi-
enced a negative population growth between 1911
and 1921 because of the recurrence of plague, chol-
era, and theinfluenza epidemic of 1918 – 1919 (9).
The influenza epidemic is estimated to have killed
almost 5% of the total population of the subcon-
tinent. However, thereafter except for some iso-
lated attacks of cholera in the 1920s and the Bengal
famine in the 1940s the country has been spared
serious calamities (11). There hasbeen acceleration
in the rate of decline in mortality since independence
in 1947. The crude death rate is as low as around
8 per 1000 population by 2010 – 2015 and is expectedto go up in the future because of age structure
changes. The life expectancy is expected to reach
64.4 years among males and 67.6 years among fe-
males by 2010 – 2015, up from 38.7 years for males
and 37.1 years for females in 1950 – 1955 (5).
At the same time, the infant mortality rate
(IMR) remains high in India at around 50 per
1000 live births as of 2009 (12). The rate far ex-
ceeds the IMR in China, which now stands around
22 per 1000 live births according to the United
Nations estimate (5). From an estimated level of
around 200 to 225 infant deaths per 1000 live
births at the time of India’s independence in
1947, IMR has declined to about 80 during 1990 –
1992, which is a decline of around 1.4% per year
(13). The rate of decline had been faster during
1992 – 2009 at around 3% per year. Perhaps
owing to relatively high levels of infant mortality,
the birth rate failed to respond to mortality de-
cline until about 1971. With the overall mortality
level at relatively low rates and infant mortality
remaining high, India’s disease profile shows a
double burden, with one third of the burden ac-
counted by communicable disease and the rest by
noncommunicable diseases (14).
The pace of decline in fertility has quickened
in the country in recent years. The TFR has de-
clined by roughly 1.5% per year from 6.0 in 19
to 3.6 in 1992 (13). The rate of decline quicken
further to 1.7% per year during 1992 – 2008, w
TFR reaching 2.6 births per woman by 2008 (1
It appears that with this rate of decline, India w
reach replacement-level fertility of 2.1 children
woman within a decade, which is far ahead of t
assumed year by the UNPD and PFI-PRB proj
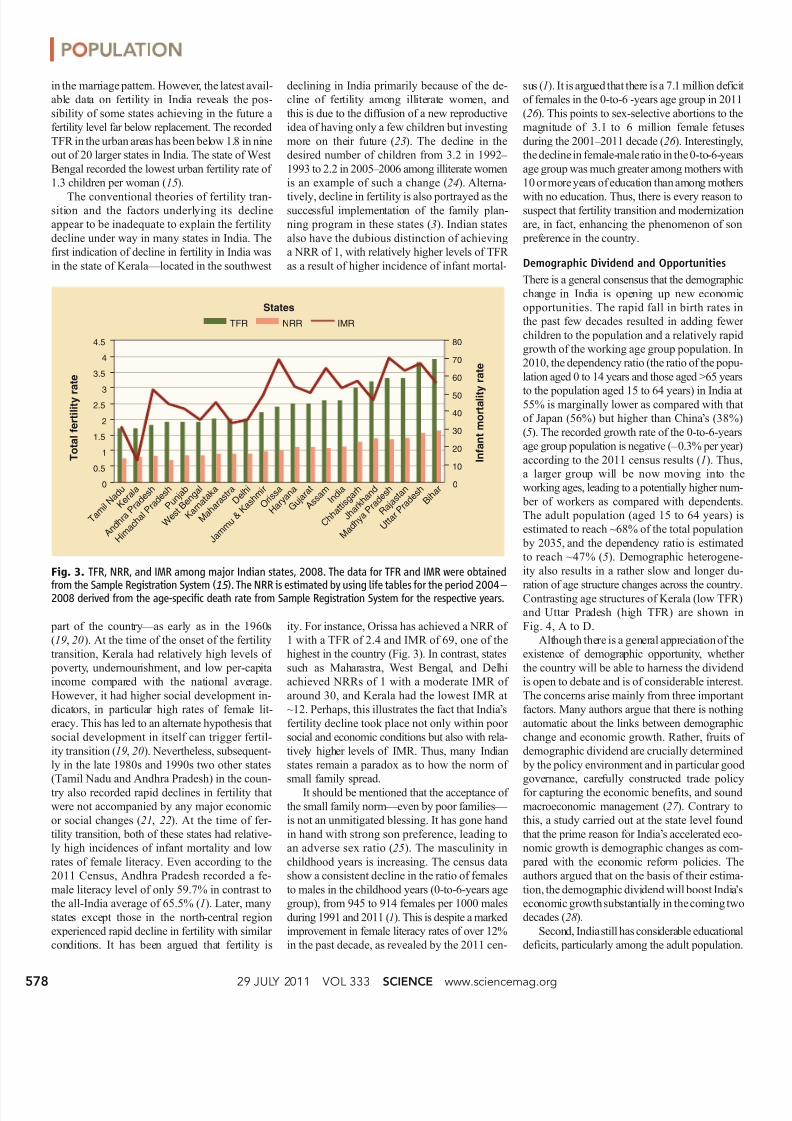
tions (5, 7 ). TFR and net reproduction rate (NRand the corresponding IMRs for major states
India for the year2008 are shown in Fig. 3. It brin
up several important dimensio
of India’s fertility transition. Of
20 statesconsideredin theanaly
constituting nearly 98% of
population in thecountry, 11sta
with 46% of the total populat
achieved a NRR of 1.0, implyi
replacement-level fertility. Th
states with a population prop
tion of around 10% are also clo
to replacement level. India’s fer
ity transition has several speciities andis distinctly different fr
the experience of classical ferti
transition observed in many cou
tries (16 , 17 ). The decline in ferti
wasachievedprimarilythrough c
traceptive use almost solely throu
female sterilization. The avera
age at marriage, particularly of
males, remainslowat 18 years, a
more than 50% of women ma
before the legal age of 18 years
the country. Marriage is univer
andbirths takeplace primarily w
in marriage. The very low usetemporary methods of contrac
tion and early age at marriage result in wom
bearing children at very young ages and undergo
sterilization soon after. A study based on Andh
Pradesh, one of the states in India with the m
rapid decline in fertility, showed that a sizable p
portion of women in the state undergo sterilizat
before reaching 25 years of age (18).
Another strikingdemographic patternemerg
in India is its huge heterogeneity across regio
and states. The TFR in 2008 varied from as l
as 1.7 in Andhra Pradesh to 3.9 in Bihar, and
fant mortality varied from 12 per 1000 live bir
in Kerala to 70 in Uttar Pradesh (15). The fo
states in Fig. 3 to the far right, constituting 41
of India’s total population, are from the north c
tral region. These states continue to record ~2
annual growth rate of population, even during
2001 – 2011 census years. In contrast, the th
states in Fig. 3 to the far left show a TFR of 1.8
less. What is perhaps unclear is how far the f
tility level will fall in the country. The vario
projections assume that the TFR may ultimat
remain withina saferangeof 1.8 to 2.1 (5,7 ).At o
level, it is observed that even in states with ea
fertility transition there is no sign of drastic chang
-10.0
0.0
10.0
20.0
30.0
40.0
50.0
60.0
R a t e p e r 1 0 0 0 p o p u l a t i o n
Year
1 9 0 1 - 1 1
1 9 1 1 - 2 1
1 9 2 1 - 3 1
1 9 3 1 - 4 1
1 9 4 1 - 5 1
1 9 5 1 - 6 1
1 9 6 1 - 7 1
1 9 7 1 - 8 1
1 9 8 1 - 9 1
1 9 9 1 - 0 1
2 0 1 0 - 1 5
2 0 2 0 - 2 5
2 0 3 0 - 3 5
2 0 4 0 - 4 5
2 0 5 0 - 5 5
2 0 6 0 - 6 5
2 0 7 0 - 7 5
2 0 8 0 - 8 5
2 0 9 0 - 9 5
2 0 9 5 - 0 0
BR
DR
NI
Fig. 2. Birth rate (BR), death rate (DR), and natural increase (NI) (NI = BR – DR) inIndia for 1901–2100. The 1901–1971 data are census-based estimates published bythe Office of the Registrar General of India for various years. Data for 1971–2001are from Sample Registration System (SRS) Bulletins published by the Office of theRegistrar General of India. The latest data is available at (12), and 2010–2100 dataare projections according to United Nations Revision 2010 (5). The NI provides in-formation on the growth of a population in the absence of migration.
www.sciencemag.org SCIENCE VOL 333 29 JULY 2011
SPECIALSECTIO
8/13/2019 Indias Demographic Change- Opportunities and Challenges