Economic and Political Weekly August 9, 2003 3373 S pecial articles I Introduction Introduction Introduction Introduction Introduction F or most people the story of Indian reforms starts in the nineties, following the balance of payments (BOP) crisis of 1990-91. There was, however, a detectable increase in the rate of growth of the Indian economy in the eighties, arising from the liberalisation of the 1980s [Virmani 1989; Ahluwalia 1991]. Nevertheless, our analysis of reforms focuses on the nineties because their scope was much wider and deeper than that seen in the eighties. This was particularly so in the case of the external sector, which is the focus of the current paper. Section II gives a summary of the broad-based and fairly comprehensive external sector reforms that followed the BOP crisis of 1990-91. It also sheds some light on the decision-making process. Section III starts with the macroeconomic adjustment under- taken in 1991-92. The contribution of fiscal deficit reduction, exchange rate depreciation, and other factors in the dramatic reduction in the current account deficit by 2.8 per cent of gross domestic product (GDP) in 1991-92 are quantified. The section then goes on to analyse the external sector reforms in the nineties and their impact and puts them in comparative international perspective. External reforms were among the most successful reforms undertaken in India during the nineties. These reforms have opened up the economy, strengthened the external account, and made it much less vulnerable to shocks. India’s trade share rose by 0.11 per cent of world trade during the nineties raising India’s world ranking by six positions. India also became more open in terms of capital flows with its rank in terms of foreign direct investment (FDI) inflows rising by nine positions. Equity inflows increased even more rapidly to raise India’s rank among the emerging markets by eight positions during the nineties. In 1999 only 13 emerging markets received more FDI than India and only five received more equity inflows. Of these China, South Korea, Thailand, and Brazil had larger inflows of both FDI and foreign equity than India during this year. Paradoxically, however, the Indian economy remains relatively closed. As shown in Section III, international trade and FDI are still small relative to the size of the economy. There is a 15- position difference between India’s trade rank and its GDP rank (both in terms of US $ value). India’s customs tariff rates are still among the highest in the world with only two countries known to have a higher weighted average tariffs. The contribution of FDI to gross domestic investment (GDI) is still minuscule with India ranking 126th in terms of the ratio of FDI to GDI. Further India’s External Reforms Modest Globalisation, Significant Gains The liberalisation of India’s external sector during the past decade was extremely successful in meeting the BOP crisis of 1990 and putting the BOP on a sustainable path. These reforms improved the openness of the Indian economy vis-à-vis other emerging economies. Much, however, remains to be done. India’s economy is still relatively closed compared to its ‘peer competitors’. Further reduction of tariff protection and liberalisation of capital flows will enhance the efficiency of the economy and along with reform of domestic policies will stimulate investment and growth. The main lesson of the nineties is that liberalisation of the current and capital account increases the flexibility and resilience of the BOP. This applies to trade, invisibles, equity capital, MLT debt flows, and the exchange market. The author’s analysis confirms that in India the exchange rate is a powerful instrument of adjustment in the current account deficit. It also confirms that equity outflows are very unlikely to be a major cause of BOP problems (unlike short-term debt). The impact of fiscal profligacy on the external account has become indirect and circuitous with the implementation of external sector reforms. It operates much more through the general expectations about economic (growth) prospects and the risk premium demanded by foreign (and domestic) investors and lenders. Thus its negative effects are likely to be focused on the domestic rather than the external account. In other words, the negative long-term effects of fiscal profligacy are more likely to be felt in future on the growth rate of the economy and the health of the domestic financial sector. ARVIND VIRMANI
For most people the story of Indian reforms starts in thenineties, following the balance of payments (BOP) crisisof 1990-91. There was, however, a detectable increase in the
rate of growth of the Indian economy in the eighties, arising fromthe liberalisation of the 1980s [Virmani 1989; Ahluwalia 1991].Nevertheless, our analysis of reforms focuses on the ninetiesbecause their scope was much wider and deeper than that seenin the eighties. This was particularly so in the case of the externalsector, which is the focus of the current paper.
Section II gives a summary of the broad-based and fairlycomprehensive external sector reforms that followed the BOPcrisis of 1990-91. It also sheds some light on the decision-makingprocess.
Section III starts with the macroeconomic adjustment under-taken in 1991-92. The contribution of fiscal deficit reduction,exchange rate depreciation, and other factors in the dramaticreduction in the current account deficit by 2.8 per cent of grossdomestic product (GDP) in 1991-92 are quantified. The sectionthen goes on to analyse the external sector reforms in the ninetiesand their impact and puts them in comparative international
perspective. External reforms were among the most successfulreforms undertaken in India during the nineties. These reformshave opened up the economy, strengthened the external account,and made it much less vulnerable to shocks. India’s trade sharerose by 0.11 per cent of world trade during the nineties raisingIndia’s world ranking by six positions. India also became moreopen in terms of capital flows with its rank in terms of foreigndirect investment (FDI) inflows rising by nine positions. Equityinflows increased even more rapidly to raise India’s rank amongthe emerging markets by eight positions during the nineties. In1999 only 13 emerging markets received more FDI than Indiaand only five received more equity inflows. Of these China, SouthKorea, Thailand, and Brazil had larger inflows of both FDI andforeign equity than India during this year.
Paradoxically, however, the Indian economy remains relativelyclosed. As shown in Section III, international trade and FDI arestill small relative to the size of the economy. There is a 15-position difference between India’s trade rank and its GDP rank(both in terms of US $ value). India’s customs tariff rates arestill among the highest in the world with only two countriesknown to have a higher weighted average tariffs. The contributionof FDI to gross domestic investment (GDI) is still minuscule withIndia ranking 126th in terms of the ratio of FDI to GDI. Further
The liberalisation of India’s external sector during the past decade was extremely successful inmeeting the BOP crisis of 1990 and putting the BOP on a sustainable path. These reformsimproved the openness of the Indian economy vis-à-vis other emerging economies. Much,
however, remains to be done. India’s economy is still relatively closed compared to its‘peer competitors’. Further reduction of tariff protection and liberalisation of capitalflows will enhance the efficiency of the economy and along with reform of domestic
policies will stimulate investment and growth.The main lesson of the nineties is that liberalisation of the current and capital account
increases the flexibility and resilience of the BOP. This applies to trade, invisibles, equitycapital, MLT debt flows, and the exchange market. The author’s analysis confirms that in
India the exchange rate is a powerful instrument of adjustment in the current account deficit.It also confirms that equity outflows are very unlikely to be a major cause of BOP problems(unlike short-term debt). The impact of fiscal profligacy on the external account has becomeindirect and circuitous with the implementation of external sector reforms. It operates much
more through the general expectations about economic (growth) prospects and the riskpremium demanded by foreign (and domestic) investors and lenders. Thus its negative effectsare likely to be focused on the domestic rather than the external account. In other words, the
negative long-term effects of fiscal profligacy are more likely to be felt in future on the growthrate of the economy and the health of the domestic financial sector.
ARVIND VIRMANI
Economic and Political Weekly August 9, 20033374
reforms that enhance openness will therefore strengthen not onlythe external sector but also the competitiveness of the Indianeconomy.
IIIIIIIIIIComprehensive Reform in the NinetiesComprehensive Reform in the NinetiesComprehensive Reform in the NinetiesComprehensive Reform in the NinetiesComprehensive Reform in the Nineties
One result of the BOP crisis of 1990-91 was to create theconditions under which a retired professional economist withwide experience in government and universally well-regardedfor his sincerity and integrity could become the finance ministerof India. The prime minister of the time deserves full credit forgrabbing this opportunity, despite the heartburn that it causedamong the members of his party and despite heading a minoritygovernment. The new Finance Minister, having been thegovernment’s top economic bureaucrat during the previous decade,had been instrumental in raising economic expertise within thegovernment, by bringing a number of market-savvy economistsinto the government. He was, therefore, relatively well-posi-tioned to make the move from a socialist-inspired approach toeconomic development to a market-oriented approach.
The new government in July 1991 initiated a new approachto economic development policy. It recognised that only correct-ing the underlying macroeconomic imbalance and replacing theoppressive system of controls by the discipline of market com-petition could overcome the BOP crisis. The new finance ministerand his chosen team of advisors were aware that in many countriesthe textbook macro solution for a BOP crisis had led to a slowingof private investment and growth in the two years (and oftenfor longer periods) following the macro adjustment. They werealso aware of the remarkable growth rates and poverty reductionachieved by the more open economies of east and south Asiaduring the previous two decades. Extensive decontrol and de-licensing was recognised as necessary to release the productivepotential of Indian entrepreneurs, reduce the period of privateinvestment and growth slowdown and raise the underlying growthrate of the Indian economy. It was also clearly recognised thatthe best way to put the BOP on a long-term sustainable path wasthrough comprehensive liberalisation of international trade, fi-nance/capital inflows and the exchange regime. The phasing andtiming of liberalisation were, however, determined not only bythe exigencies of the economic situation, but also the problemof calming genuine fears, convincing ideological diehards,and overcoming vested interests, both within and outside thegovernment.
The comprehensive import control (or quantitative restrictions(QRs)) regime was gradually dismantled, starting with capitaland intermediate goods and moving after a period of slowdownto consumer goods. The slowdown was due to the differing natureof these two sets of goods. In the case of intermediate and capitalgoods, the gainers and losers are more evenly balanced, whilefor consumer goods the potential beneficiaries are fragmentedand unorganised and no match for concentrated number of easilyorganised opponents. Tariff rates were brought down over adecade from a peak rate of about 300 per cent to a peak rateof 35 per cent. The problems of overdependence on debt andthe high proportion of short-term debt were addressed byliberalising FDI and foreign equity (foreign institutional invest-ment, FII) inflows while keeping a very tight lid on short-termdebt obligations and maintaining the control regime for externalcommercial borrowing (ECB). A comprehensive reform of theexchange control regime was undertaken based on thorough
intellectual and administrative preparation. The illegal foreignexchange markets and its link with smuggling and invisiblestransactions were addressed by a comprehensive liberalisationof gold imports.
The macroeconomic response to the BOP crisis as it existedat the start of 1991-92 was the classic textbook one of expenditurecompression through a sharp fiscal correction and expenditureswitching through devaluation. The fiscal deficit of the centrewas reduced from 7.8 per cent of the GDP in 1990-91 to 5.6per cent of the GDP in 1991-92. The nominal effective exchangerate (NEER) was depreciated by 18 per cent in 1991 resultingin a real effective depreciation of 12.4 per cent. In terms of ourestimated equation (1) below, the fiscal squeeze and the realdepreciation reduced the current account deficit by 1.03 per centof GDP and 0.97 per cent of GDP, respectively.
The total effect of these two measures was therefore to reducethe current account deficit by 2 per cent of the GDP out of thetotal actual decline of 2.8 per cent of the GDP. The decline of1.6 per cent points in the private investment rate contributed about0.5 per cent to the reduction. The remaining decline of 0.3 percent of the GDP can perhaps be attributed to the overall increasein private confidence arising from the major economic reformsinitiated in 1991-92.
The following reduced form equation is estimated to find theimpact of the fiscal deficit on the current account deficit, usingdata from 1970-71 to 1999-2000.
CAD = f (FDc, REER, Ipvt, t)
where, CAD is the ratio of the current account deficit to the GDP,FDc is the fiscal deficit of the central government as a ratio tothe GDP, REER is the 36-country trade weighted real effectiveexchange rate (1985 = 100), and Ipvt is the ratio of privateinvestment to the GDP. The time trend ‘t’ represents the upwardtrend in the private saving rate. The fiscal deficit of the centralgovernment is much more exogenous than that of the states givenconstitutional limitations on the latter’s ability to borrow. As alonger time series is available for the REER in calendar yearsthan for the fiscal years (April to March), the former is used.The estimation is done in first difference form with the rate ofgrowth taken for the REER. The results are as follows.
where, ∆CAD = [CAD – CAD(-1)], ∆FD = [FDc – FDc(-1)],∆Ipvt = [Ipvt – Ipvt(-1)], Greer = rate of growth of REER, andthe numbers in brackets are t-values.1
Thus every per cent point of GDP increase in the fiscal deficitof the central government resulted in a 0.47 per cent of GDPincrease in the current account deficit.2 It is also clear that theexchange rate has a powerful impact in countering the effect ofthe fiscal deficit. A 6 per cent depreciation of the real effectiveexchange rate is sufficient to counter and nullify the impact ofa 1 per cent point increase in the fiscal deficit. The effect of privateinvestment on the current account is also statistically very signi-ficant with a 1 per cent point increase in its ratio to GDP resultingin a 0.3 per cent point increase in the current account deficit.
Export pessimism was not just a belief, but also almost anideology among the resident economic elite of India for decades.The two prominent exceptions to this belief in academic circles,Jagdish Bhagwati and T N Srinivasan were both non-residentIndians (NRIs) [Bhagwati and Srinivasan 1975]. Among thedomestic exceptions were the new finance minister himself, whoas an academic had done work on exports [Singh 1964], and theeconomist who was to later become his finance secretary. Theconventional wisdom among the domestic Indian experts asencapsulated in Nayyar (1976) and Ghosh (1990) was that Indianexports were supply-constrained and not very responsive torelative price changes. The alleged failure of the 1966 devaluationwas cited as one of the proofs of this proposition. The attitudeof the elites was reflected in the negative reaction that a 1989Planning Commission research paper, which showed high rela-tive price elasticities of demand for manufactured exports andimports, elicited in the upper reaches of the Planning Commission[Ghosh 1991].3 The research paper of June 1989 was circulatedto members of the Planning Commission and economic advisorsin key economic ministries. Unlike earlier research that focusedeither on total exports or individual commodities this paperconstructed three sub-aggregates to show that supply constraintswere important only for primary exports and that both the supplyand demand for manufactured exports was highly elastic [Virmani1991a]. Imports were also shown to be very responsive todevaluation. Fuel imports and exports were not amenable to anyrational analysis and could therefore have biased earlier aggregateestimates. The paper also showed that that the effect of the 1966devaluation was spread over two years.
For non-economic participants in the decision-making processthe main argument against import bans was that by providinginfinite protection to manufactured goods such bans biased theeconomy against agriculture and labour-intensive manufactures.The QRs also favoured large, capital-intensive manufacturing andmining thus contradicting and undermining the policy of encour-aging small-scale industry. The removal of QRs and the reductionof the high tariffs on manufactured goods would therefore favouragriculture and labour-intensive manufactured exports.
Import Controls: QRs
Though trade reform had begun in the 1980s, the import controlregime was still incredibly complex in 1990-91. This was parti-cularly true of the duty-free input import regime for exporters(based on the efficiency principle of either not taxing or refundinginput taxes). A significant effort was made to clean up thiscomplex regime in July-August 1991 by introducing the ‘EximScrip’ – a freely tradable import licence (30 per cent of exportvalue as import entitlement from the Limited Permissible List)– the premium on which effectively constituted a dual exchangerate.4 The existing Cash Compensatory System, which variedby product category and perceived domestic value-addition, wasabolished. QRs were eased on 96 items by moving them fromthe ‘restricted’ to the ‘limited permissible’ category. The removalof QRs on 37 items by moving them from the ‘limited permissible’to the ‘open general licence’ category was, however, overwhelmedby a reverse movement of 110 items. QRs were also lifted onsix items (de-canalised) and eased on 16 others (moved from thecanalised category to the ‘limited permissible’ category). Proce-dural improvements were also made in the capital goods import
regime for exporters. Export controls were also lifted on 116 items.The trade policy of April 1, 1992 freed imports of almost all
intermediate and capital goods. Only 71 items remained re-stricted/licensed (3 banned, 7 canalised). These consisted mainlyof dual-use goods like office equipment and consumer goods.A Special Import Licence (SIL) was given to star exporters forimporting restricted items. The trade policy of April 1, 1993removed 146 items from the negative (restricted) list of exports.Kerosene, liquified petroleum gas (LPG), low sulphur heavystock (LSHS), waxes, and fertilisers (phosphoric potash) werede-canalised. In the April 1994 policy, the scope of the SIL wasexpanded, and second-hand capital goods (with a residual lifeof five years) allowed to be imported. The import policy of April1995 put 78 consumer goods in the freely importable category.At this point, out of a total of 5021 6-digit items on the HarmonisedTariff System’s list, 3000 were freely importable while 1487 wereimportable using the freely tradable SIL. Further progress wasmade in 1996-97 by the lifting of QRs on over 100 items andthe movement of about 70 items to the SIL.
After the initial major step of removing QRs on a host ofintermediate and capital goods in April 1992, further liberalisationwas a painful and slow process requiring infinite patience. Twomain problems had to be overcome by those who believed thatimport liberalisation would benefit the economy and the peopleas a whole. The Commerce Ministry, institutionally charged withpromoting exports was conditioned to thinking in terms of exportincentives. Thus, they had a strong incentive to preserve the listof items importable under the SIL so that premiums would remainas high as possible in the belief that this was the best way tobenefit exporters and exports. They had to be slowly and gradu-ally convinced that exchange rate adjustments would provide thesame incentives in a much more efficient manner.
The other set of objections came from producer ministries whowere convinced (without being able to produce any data or hardfacts), that producers of consumer goods would suffer if QRson consumer goods imports were lifted. Unlike in the case ofintermediate and capital goods where user groups or ministriescould provide support, consumers were not represented in thediscussions and arguments about the benefits to consumers wereseldom heeded. The evidence (of no negative effect) providedby earlier removal of QRs on intermediate goods spread ex-tremely slowly. Other arguments relating to the visible availabilityof certain smuggled consumer goods, which had little impact ondomestic producers, were sometimes effective. The fact that tariffrates were still quite high did sometimes help to calm the fearsof neutral participants. It was only the loss of the World TradeOrganisation (WTO) case against India, however, that finally ledto the complete elimination of QRs previously justified on BOPgrounds on April 1, 2000. Otherwise the process of removal ofQRs on consumer durable goods could have dragged on foranother half decade or more.
Customs Tariffs
The overall objectives of customs tariff reform were clear fromthe beginning – to reduce overall protection by reducing theaverage rate of tariffs and to reduce the arbitrary distribution ofprotection among industries by reducing the dispersion of tariffs.An incredible array of general, specific, and end-use exemptionshad also been built up over the decades in response to the demandsof vested interests, backed by little or no economic analysis ofthe costs or benefits. Though economists working on India’s customs
Economic and Political Weekly August 9, 20033376
tariffs had some idea of its complexity in terms of multiplicityof rates and end-use exemptions, none initially had a detailedknowledge of the system and its incredible array of exemptions.
In addition to the array of industrial interests and producerministries opposed to the lifting of QRs, customs tariff reformfaced two additional difficulties. The revenue department, chargedwith collecting revenues understandably had an inbuilt resistanceto reduction of any tariff. Secondly, the secrecy of the budgetprocess meant that it was difficult to bring in expertise fromoutside the revenue department. Secrecy could also be used asa handle to keep information asymmetric and at critical pointsdismiss arguments as based on imperfect practical knowledge.
The Chelliah committee on tax reform, which outlined a broadstructure of peak tariff rates for different categories of goods,proved important in overcoming bureaucratic inertia [Ministryof Finance 1991, 1993]. Its reports helped reformers to keep thefocus on peak tariff reductions despite pressures on customsrevenue. The other effort was to mount an exercise within theFinance Ministry to collect and analyse all available informationon customs duties and customs revenue collection. It was onlyafter this detailed knowledge had been acquired that economistscould begin to effectively cut through the jungle of exemptionsand reduce the multiplicity of rates and start removing the negativeprotection and other anomalies. Due to the budget secrecy issuementioned above, the only route available was to prepare detailedtariff reform papers that applied economic principles to thedetailed structure of tariffs and exemptions. This detailed knowl-edge could not, however, be brought to bear at the criticaldecision-making budget formulation stage and tariff rationalisationwas often incomplete or internally inconsistent. This was alsopartly due to the pressures from public sector units and oppositionfrom their ministries, which expressed themselves through theirministers at the budget formulation stage.
With the peak customs tariff rate at around 300 per cent in1990-91 it was apparent from the start that there was a lot of‘water in the tariff’. The first step was therefore to cut the peakrate to half (150 per cent) in the 1991-92 budget and follow it upby another cut in the peak rate to 110 per cent in the 1992-93budget. The reduction of the import duty on capital goods wasaccelerated by reducing the general rate to 55 per cent in 1992-93 because of the potential role of capital goods imports ininvestment and modernisation. Some categories of capital goodswere set even lower (50 per cent for electronic industry).
The momentum of peak-rate reductions (to 85 per cent in 1993-94, 65 per cent in 1994-95, and 50 per cent in 1995-96) wasmaintained, often by taking recourse to the recommendations ofthe Chelliah committee. The fiscal problem did however constrainthe pace of tariff reduction, as there was always a pressure on thoserecommending faster peak rate reductions to produce offsettinggains in revenue. As the peak rate recommended by this com-mittee was 50 per cent, this recourse was no longer availableonce the peak rate had been reduced to 50 per cent. The next peakrate reduction (to 40 per cent in 1997-98) was based on internalrecommendations and was part of a bold tax reform plan announcedby the Finance Minister.5 The peak rate was raised to 45 percent in 1998-99 by imposing a surcharge and a special additionalduty of 4 per cent was imposed as an analytical counterpart ofthe state sales taxes on domestically produced goods. The nominalpeak rate was reduced to 40 per cent in 1999-2000, but thesurcharge was increased to 10 per cent on items having a dutyof less than 40 per cent. The peak rate was reduced to 35 percent in 2000-01, reducing the effective peak protective duty to
about 38 per cent. This surcharge was removed in 2001-02bringing the effective peak rate down to 35 per cent.
Peak rate reductions, along with a gradual elimination ofexemptions also helped reduce the variance of rates. Rates oncapital goods (general and project-linked) were simultaneouslyreduced to 35 per cent in 1993-94 and 25 per cent in 1994-95,where they came to rest. The well-known (to economists) issueof negative protection for the capital goods industry, whichsurfaced occasionally in public debate, was addressed in thedetailed customs reforms papers papered from 1992 onwards.6
Following from these, an attempt was made to rationalise themetal-capital-good chain. A similar exercise was done for thechemicals chain. The 1993-94 budget set the rate for ferrousmetals at 75 per cent to 85 per cent and non-ferrous metals at55 per cent. The widely dispersed rates on machine tools werealso reduced to three (40 per cent, 60 per cent, and 80 per cent).Chemical feed stock rates were integrated at 15 per cent and thoseon major intermediates at 40 per cent. Rates on personal (baggage)imports were reduced from 225 per cent to 100 per cent. The1994-95 budget rationalised machine tool rates to 35 per centand 45 per cent and rates on medical equipment to 0 per cent15 per cent and 40 per cent depending on social value. It reducedrates on steel and non-ferrous metals to 50 per cent. There wasalso an attempt to prune end-use notifications. In the 1995-96budget, 80 per cent of capital goods rates were unified at 25 percent and metals at 35 per cent and 40 per cent.
As a result of these customs tariff rate reductions, the customsduty collection rate, went from 47 per cent in 1990-91 to 44 percent in 1991-92, 37 per cent in 1992-93, 30 per cent in 1993-94, and 29 per cent in 1994-95. The movement in the collectionrate since then has fluctuated with the rate rising to 31 per centin 1996-97 before falling to 27 per cent 1997-98 and 23 per centin 1998-99. It rose again to 24 per cent in 1999-2000. Thecollection rate includes not just the protective duty, but also the‘additional duty’ which is the counterpart of domestic excise taxes(also referred to as countervailing duty, CVD).
Exports
The import control system for exports was primarily directedto providing duty free access to imported inputs (intermediategoods) and reduced duty access to capital goods used in exportproduction. Profits from exports were completely exempt fromincome tax. 100 per cent Export-Oriented Units (EOUs) andExport Promotion Zones (EPZs) had the additional incentive ofa 5 to 8 year tax holiday for profits arising from the 25 per centDomestic Tariff Area (DTA) sales that were allowed. This incentivesystem was pretty much in place by the end of the eighties.Paradoxically, concern with misuse of the duty free systemsometimes made the system even more cumbersome for honestexporters than the normal system for local producers. The chiefobjective during the reforms was to simplify the system whilemaking it as comprehensive as possible. In the April 1993 tradepolicy, the EOU-EPZ system was expanded to agriculture andallied exports with 50 per cent DTA sale allowed. Under theExport Promotion Capital Goods (EPCG) scheme for exporters,the concessional duty on capital goods was reduced to 25 percent (with an obligation to export 3 times the value of the import)and 15 per cent (with an obligation to export 4 times the valueof the import). In April 1994, an Electronic Hardware TechnologyPark scheme was introduced on par with the EPZ. The conceptof a Free Trade Zone was finally accepted in 1999-2000.
The long-term considerations arguing for raising the flow offoreign equity capital relative to debt were known even beforethe crisis.7 The BOP crisis reinforced these arguments forencouraging external equity vis-à-vis debt financing. The emer-gency loans taken from multilateral and bilateral sources to meetthe BOP crisis resulted in a further rise in foreign debt. Foreigndebt, which had risen to 25.1 per cent of the GDP by the endof March 1991 (from 22.9 per cent a year earlier) rose furtherto 33.8 per cent of the GDP by the end of March 1992 (Table 1).Part of this rise was due to the rise in the rupee value of foreigndebt because of the July 1991 devaluation (or conversely the fallin the dollar value of the GDP due to the devaluation). The need todispense with these emergency loans and repay them as soon aspossible added to the urgency of opening up equity flows to India.
Foreign Direct Investment
In India’s traditional policy framework, FDI was treated as justanother form of foreign saving to plug the ‘domestic saving gap.In the new reform approach its many other advantages, such asthe bundling with knowledge (technology), trade (exports), andinvestment were fully recognised. Given the need for creatingconfidence among foreign investors, FDI policy reform formedpart of the first package of industrial reforms in July 1991. Theattempt at de-control of FDI took the form of an ‘automatic route’through the Reserve Bank of India (RBI) (Annual Report, variousissues; ‘Handbook of Statistics on the Indian Economy’, 2000(CD ROM)) that basically constituted a registration procedure.
FDI with up to 51 per cent (up from 40 per cent) foreign equitywas thus freed for a historically defined list of 34 ‘priority’(intermediate and capital good) industries and international trad-ing companies. However, the dividend balancing conditionremained.8 The 51 per cent level was chosen as this allowedforeign companies to amalgamate profits and losses from sucha company into those of the parent company for tax purposes.Technology import was also put under the automatic route subjectto conditions on royalty (<5 per cent domestic and <8 per centexport) and lump-sum payment (<Rs 1 crore). Any FDI ortechnology import had to be approved by a newly created ForeignInvestment Promotion Board (FIPB). The principal secretary tothe prime minister chaired the FIPB, to ensure speedy approvalof FDI proposals outside the ambit of the automatic route.
Within the next nine months, the dividend balancing conditionwas removed for all except consumer industries. The dividendbalancing condition on consumer goods was finally removed in2000-01. Fifty-one per cent foreign equity was also allowed forFDI in oil exploration, production, refining, and marketing andcaptive coal mining. NRIs and overseas corporate bodies (OCBs)were allowed 100 per cent equity in priority industries. This wasmade automatic in 1997-98. Dis-investment by foreign investorsno longer required RBI permission. International firms wereallowed to use their own trademarks and India ratified and joinedthe Multilateral Investment Guarantee Agency (MIGA).
In 1996-97 the automatic approval list was expanded to 48industries, with three mining-related activities allowed 50 percent and 9 infrastructure activities allowed 74 per cent foreignequity. The latter was raised to 100 per cent two years later. Asignificant step was taken in 1999-2000 with the introduction
Table 1: Balance of PaymentsTable 1: Balance of PaymentsTable 1: Balance of PaymentsTable 1: Balance of PaymentsTable 1: Balance of Payments
of a negative list approach with all other sectors open to automaticapproval. The foreign equity limit in manufacturing was elimi-nated at this time, while some sector-specific limits such as intelecom and civil aviation remained.
A study done by a private international consultancy organisationin 1992 showed that both the FDI policy and its implementationthrough the RBI automatic route and the FIPB were comparableto those in south-east Asia and China. By the FDI policy is meantany element of policy that discriminates against (or providespreferential treatment to) foreign nationals and companies wantingto invest in a country relative to the country’s nationals andcompanies. Though domestic policies and procedures that areformally neutral between foreign and domestic investors mayhave a differential impact on foreigners, these are conceptuallydistinct from FDI policy. In practice they are as, if not more,important than FDI policy per se.
The gradual liberalisation of FDI rules is an example of phasingbeing dictated by various pulls and pressures arising from publicattitudes (the East India Company syndrome), organised pressuregroups, and political resistance. Unlike trade policy where thecommerce ministry is formally responsible and tariff policy forwhich the finance ministry is responsible, the responsibility ofFDI policy for any sector or sub-sector falls within the purviewof the ministry that deals with that particular sector. To the extentthat the industry ministry deals with general industrial policy itis also responsible for the FDI policy for general industry. Thefinance ministry also comes into the picture, as it is responsiblefor the BOP aspects of FDI. For this reason the FDI policy forindustry made much faster progress within the government andsignificant resistance to speedier liberalisation came only fromoutside the government (industry and their civic/public support-ers). Because of the universal agreement on the need for FDIin infrastructure sectors, liberalisation for these sectors was alsoreasonably fast, though in some of these sectors the limit hasgot stuck below 50 per cent. The resistance to change came mainlyfrom public monopolies or public-private bilateral monopoliesthat could convince the concerned ministers. Reform of domesticinvestment policy as well as of FDI policy in other sectors suchas real estate has been relatively slow because responsibility iswidely dispersed.
Portfolio Capital: FII
As shown in a recent review of financial sector issues by theWorld Bank (2001: Figure 4.5, p 172), among the emergingeconomies, India was one of the early openers of the equity marketto foreign portfolio investment. According to this study onlyMexico started a Country Fund for foreign equity investmentabout 6 years prior to India, while the South Korean fund wasset up only one year before India’s. In 1992-93, direct portfolioinvestment by foreign institutional investors in Indian equitymarket was allowed. At this time the degree of opening wasgreater than in almost all east and south-east Asian emergingeconomies, but perhaps less than that in the large Latin Americanemerging economies. In addition to the general objective ofraising equity flows there were two other considerations thatweighed positively in this decision. Though the domestic savingrate was relatively high the availability of risk capital in the equitymarket was relatively low. It was thought that the flow of foreignequity would help in developing the domestic equity market, bybringing in the world’s best practices and stimulating compe-tition. Secondly, because equity markets respond much faster than
FDI, it was hoped that the foreign equity investors would comein quickly, learn about and disseminate the opportunities availablein India (i e, act as a window to the world) and, thus, help drawin more FDI. Given residual suspicions and fears, as a safetyprecaution all such foreign equity had to be channelled throughforeign institutional investors registered with the SecuritiesExchange Board of India (SEBI) and the RBI (for the ForeignExchange Regulaton Act, 1973, FERA). The FII category washowever quite wide and included pension funds, mutual funds,asset management companies, investment trusts, and institutionalportfolio managers. Both primary and secondary market invest-ments up to 24 per cent of the total equity of any company wereallowed. An equity-debt ratio of 70:30 was allowed for equityfunds. The dividend tax was limited to 20 per cent and the long-term capital gains tax to 10 per cent. The use of Global DepositoryReceipts (GDRs) to raise foreign equity funds was also allowedand encouraged.
The process of reform thereafter was incremental and depen-dent on the exigencies of the situation including the perceptionof the BOP situation by the RBI and the fears of equity flowreversals in Delhi. Investment in equity of unlisted companieswas allowed in 1996-97 subject to corporate governance typesafeguards. 100 per cent debt funds were also allowed to investin Gilts and listed company securities the same year, with entryinto primary treasury options and access to unlisted companydebt securities allowed in 1998-99. The company-specific ag-gregate foreign equity limits were subsequently raised to 30 percent (1997-98), and then to 40 per cent and 49 per cent (2001-02), subject to the company boards’ discretion. At present foreignnationals can directly invest in the Indian equity market throughany SEBI-registered investment intermediary. A special regimefor venture capital funds has also been put in place.
Indian FDI
In the attempt to raise equity inflows, the potential gains fromIndian investment abroad were not overlooked. Just as in the caseof inward FDI it was recognised that outward FDI also had thepotential to raise the general level of technology and managementavailable to Indian industry. The effort to compete globally couldhelp industry upgrade domestically. The first step was taken in1992, by putting a time limit of 30 days for approving outwardFDI up to $2 million. This limit was raised progressively insubsequent years and its scope expanded.
DebtDebtDebtDebtDebt
The cautious policy towards debt flows was outlined in 1992-93. This included tight control on short-term borrowing and acap on total ECB. At this point, ECB was to have a minimummaturity of five years, and could only be used for purchasingcapital goods abroad. Priority within the cap was given to in-frastructure, exports, and small and medium enterprises. Thispolicy was gradually liberalised. The strict short-term debt policyresulted in the closing of the Foreign Currency (Banks and Others)[FC (B and O)] deposit scheme in July 1992 and the withdrawalof the Foreign Currency Non-Resident (FCNR) account schemeof less than one year in May 1993 and the FCNR account schemeof less than two years in October 1993. As a result of this policyshort-term debt declined from 6.1 per cent of total external debtby the end of March 1989 to 3.5 per cent of total debt at theend of March 2001. Short-term debt was less than 9 per cent
Economic and Political Weekly August 9, 2003 3379
of foreign currency reserves at the end of March 2001. Even ifwe include medium- and long-term debt with residual maturityof less than a year, it would be less than 30 per cent of foreigncurrency reserves [i e, excluding gold and Special Drawing Rights(SDRs)].
Another element of this policy was to eliminate ECB by thegovernment, increase scrutiny of borrowing by public sectorcompanies, and increase the share of the private sector in ECB.As a consequence, the government’s share in external debt fellby about 20 per cent points between March 1989 and March 2001,while external private debt had risen to 14.8 per cent of totaldebt by March 1999.
New institutional structures were created to ensure that controland monitoring of ECB was economically rational and consistentwith the liberalised approach. A high-level committee on debtmanagement and a task force on external debt statistics to provideregular reports were set up. A unit was also set up for aggregatedebt monitoring and management support. The first status reporton external debt was produced in October 1993. This unit evolvedinto the External Debt Management Unit (EDMU), which helpedimprove debt monitoring and management.
The ECB policy was gradually liberalised, though the Asiancrisis revived diffuse fears about liberalisation. It was clear tothose who studied the Asian crises that the problem was one ofshort-term debt, which remained under strict control. In fact itwas argued that the missed lesson of the Asian crisis was thatmedium- and long-term (MLT) debt above one year (and certainlyabove three years) was not a problem and could be freed com-pletely. Greater attention would have to be paid to monitoringand modelling the residual maturity of this MLT debt.
Exchange ControlExchange ControlExchange ControlExchange ControlExchange Control
Partial Convertibility: LERMS
The exchange market reform was an example of the mostsurprising (to the public and outside observers) yet mostthoroughly prepared and carefully executed reform. A numberof development policy research papers done at the PlanningCommission between 1989 and 1991 had suggested the possi-bility of introducing a ‘dual exchange rate’ system to ease thetransition from a heavily controlled trade regime to a free marketsystem encompassing both trade and payments. After the intro-duction of ‘Exim Scrips’ by the commerce ministry in August1991, the last paper in this series spelt this out more explicitlyin September 1991. This paper envisaged a complete de-licensingof intermediate and capital goods imports and inclusion of thesealong with, “all currently permitted service trade, technology andlabour payments (including remittances)” in the “full fledgedmarket determined dual exchange rate.”9 It was noted that themost important reason for switching over to this system was itsself-equilibrating property, which would automatically ensureBOP balancing. This system was however administratively tiedto what was called a foreign exchange certificate (FEC), a morecomprehensive cousin of the ‘Exim Scrip’ applicable to servicesand with proportions of 85 per cent to 90 per cent (instead of30 per cent). It was suggested that the system could be operatedthrough FEC accounts with authorised banks.
Based on these initial thoughts a comprehensive concept paperon liberalising the foreign exchange market using a dual exchangerate was prepared in November 1991. After several rounds ofcomments and discussion, the final version of this internal paper
(which eliminated the FEC accounts) was prepared in February1992, which formed the economic background of the decisionto move to partial convertibility.10
The Liberalised Exchange Rate Management System (LERMS)was announced in the Union Budget of 1992-93 and spelled outby RBI the next day. Exporters and remittances would surrender40 per cent of exchange at the official rate (which was leftunchanged at 25.89), while the rest would be converted at thefree market rate. This effectively meant that export proceeds weretaxed at 0.4 times the difference between the market and officialexchange rate. One hundred per cent EOUs and EPZs could sellthe entire amount at the market rate and were thus not taxed inthis way. All capital account transactions, except those relatedto the International Monetary Fund (IMF), multilateral aid, andrepayment of rupee debt, would also be at the market rate.Exporters could retain up to 15 per cent of earning in a foreigncurrency account with an authorised bank. The exchange sur-rendered at the official rate was to be used by the governmentfor official transactions, thus effectively subsidising these usesby the difference between the market and official rate. Comparedto a market exchange rate the system represented a cross taxsubsidy scheme in which exporters subsidised certain type ofgovernment related imports. This was explicitly designed tominimise the immediate impact on the fiscal situation as wellas to reduce any risk on this account at a time when a reductionof the fiscal deficit was thought to be essential for reducing themacroeconomic imbalance.
The announcement of this system in the Union Budget for 1992-93 (18 months after the crisis) took the country as well as foreignobservers by surprise. The extent of excitement among commonpeople, those who may never have the opportunity to undertakeforeign exchange transactions took even those involved in itspreparation by surprise. Even the common person welcomed thefreedom that it implied and the confidence that it denoted on thepart of the government. Many intellectuals and economistspredicted that there would be huge capital outflows and the rupeewould sink to Rs 40 per US $ on the market channel. Some scepticseven predicted a free fall to Rs 50 per US $. The market exchangerate opened around Rs 31.27 per US $ in March 1992 and roseto Rs 30.87 per US $ in January 1993.
Under the aegis of the Finance Ministry, the RBI, and thecommerce ministry, joint committees were set up to monitor andmanage the system after it was announced and to iron out anykinks that emerged. Several difficult issues such as how to dealwith rupee trade arrangements and the alleged adverse effect onexporters were hammered out during the year. By the end of 1992it was clear that the scheme was even more successful than washoped for by its initiator, the finance ministry. It had been thoughtearlier that a second year of transition could perhaps be necessary,in which the surrender ratio would be reduced along with areduction of the number of items on the official exchange channel.The performance of the exchange market, however, gave deci-sion-makers the confidence to move directly to an integrated,market-based exchange rate system in 1993-94 by eliminatingthe official channel. Thus, the cross tax-subsidy (exporters togovernment) was in operation for only one year. On integration,the exchange rate depreciated to Rs 32.43 per US $ in February1993, but appreciated thereafter. Till August 1995 it remainedbelow the peak reached in February 1993. Only in September1995 did it depreciate to Rs 33.58 per US $.
As the RBI retains the right to intervene (and does intervene)to even out excessive volatility in the exchange rate, in inter-
Economic and Political Weekly August 9, 20033380
national terminology this system is classified as a ‘managedfloat.’
Gold Imports
In October 1991, the Remittance in Foreign Exchange Immu-nity Scheme was introduced for repatriation of funds. This wasfollowed by longer term structural attempts to decriminalisetransaction that are considered legitimate in a free and opensociety and to move them from the ‘hawala’ (unofficial/under-ground) market to the open market
Reform of the ban on gold imports also received attention inthe run up to the 1992-93 budget. Though there were no officialstatistics, knowledgeable people agreed that most gold smugglingwas financed by labour and other remittances through the ‘hawala’market. The ‘hawala’ operators had a network of agents in the westAsia and other countries, who bought the remittance earnings ofIndian migrants and sold it to the smugglers. The rupee leg ofthe transaction was completed in India by collecting the paymentsfrom the smugglers’ agents in India and paying the beneficiariesof the worker remittances. Thus, it was essential to liberalise goldimports to eliminate smuggling and ensure that labour remittancesto India were sent through official rather than ‘hawala’ markets.This would reduce the size of the ‘hawala’ market and strengthenthe newly liberalised market exchange rate channel.
The only contentious issue among the experts was on what dutyrate to set. One side argued for a very low duty rate, close tozero, with the hope that this could eliminate gold smuggling inone fell sweep. The other side argued that the duty rate shouldbe set competitively to the smuggling margin. Based on availableinformation about normal smuggling costs and risks through thesea route, a duty rate of about 15 per cent was judged to be optimalfor maximising revenues.11 As there is little domestic productionof gold the customs duty can be viewed as the notional counterpart(CVD) of a domestic indirect tax on gold.12 It was further arguedthat this could be lowered subsequently if smuggling remainedhigh. The former argument however prevailed.
As silver or gold is one of the first quasi-financial assets tobe acquired by all households including the poor, gold importliberalisation was expected to benefit the common man by makingit cheaper and easier to buy gold.13 There was some fear thatthe government would be accused of wasting scarce foreignexchange on inessential consumption. All the experts on thesubject were however convinced that opening of gold importswould merely shift the whole market above the line with noadverse effect on the BOP. There would also be a benefit in termsof additional customs revenue. The compromise solution was toallow gold imports only by returning Indians.14 They wereallowed to import gold up to 5 kg at a duty of Rs 220 per 10 grams(3 per cent). Subsequently silver import was also freed at a dutyof Rs 500 per kg.15 These duty rates were made applicable in1994-95 to gold and silver imported as personal baggage.
Further liberalisation of gold imports took place through atransfer of gold to list of commodities importable under the SIL.The SIL was an entitlement given to exporters to import specifieditems such as gold whose import was otherwise on the restrictedor banned list. Subsequently, selected banks were allowed toimport and sell gold freely in the domestic market. The case forcomplete freedom for gold imports rested on the argument thatthis would allow specialist gold import and sale companies tocome in and thus reduce margins through competition. This wouldalso allow customs tariffs on gold to be closer to those on other
commodities. The counter argument, that import of gold hasmonetary implications and thus must be handled differently fromother commodities has, however, prevailed so far. Prima facie,with all vestiges of the gold standard removed, this argumentis not very convincing.
By comparing the estimates of the World Gold Council, onimport of gold into India, with the official Indian data on importsone can get an idea of the trends in smuggling of gold into India.If it is assumed that the difference represents the amount of goldthat is smuggled into India, then the supply of gold through thesmuggling declined from virtually almost 100 per cent beforeliberalisation to 48 per cent by 1995-96 and 39 per cent by 1996-97. Up to 1996-97 most (87 per cent) of imports were throughthe NRI baggage route, which had been opened up in 1992.Thirteen per cent were through the special import license givento exporters, a route that was opened subsequently. After theopening of the normal (OGL) route to selected importers theproportion of imports through the normal route increased rapidlyto reach 42 per cent in 1997-98, 93 per cent the next year, and99 per cent in 1999-2000. However, even in this year about 36per cent of gold imports were through the smuggling route. Arise in import duties during 1998-99 (to Rs. 400 per 10 gramsin January 1999) increased the incentive for smuggling, whichincreased rapidly to 54 per cent of total import the next year (59per cent in 2000-01). To eliminate smuggling, gold import needsto be treated like any other import, so that anyone can importit (i e, unrestricted OGL). The duty rate can be set (keeping inmind that gold is a relatively easily smuggled high-value good)to maximise customs revenue collection.
Current Account Convertibility
Restrictions relating to the non-trade elements of the currentaccount were also addressed subsequently. The foreign exchangerules for business travels were the first to be eased. In 1994,several measures for liberalisation of current account transactionswere announced. These included indicative limits for travel, etc,on the basis of which foreign exchange could be bought bycitizens directly from authorised foreign exchange dealers. InAugust 1994, India accepted the IMF’s article VIII and thus therupee officially became convertible on the current account. Furtherliberalisation of exchange purchase rules for current accounttransactions took place in 1995-96 with authorised dealers al-lowed to sanction funds above indicative limits themselves andin 1997-98 with higher indicative ceilings for travel, studiesmedical and other service purchases from abroad. A new foreignexchange Act was introduced in 1999-2000, based on a concep-tual approach that current account convertibility must be codifiedin the new law and capital controls minimised and based on aregulatory rather than control approach.16
IIIIIIIIIIIIIIIImpact of Nineties’ ReformImpact of Nineties’ ReformImpact of Nineties’ ReformImpact of Nineties’ ReformImpact of Nineties’ Reform
External sector reforms have been the most successful of allthe reforms that were undertaken in the nineties. They haveconfounded all the fears of Indian critics and the sceptics thatimports would go through the roof and current account deficitswould balloon. They confirmed the faith of the reformers thata well-regulated market-based foreign trade and payments systemwould be more efficient and equally stable. Both the trade andinvisibles account are now much more resilient than they were
Economic and Political Weekly August 9, 2003 3381
in the eighties. Capital inflows are now much more diversifiedand therefore much less risky for the country. Both FDI andportfolio flows increased rapidly through the mid-nineties. Thestrength of the external account rests substantially on the flexi-bility of the ‘managed float’, in response to changes in demand-supply conditions in the exchange market. Difficulties and tem-porary weaknesses have emerged and will arise in the future ifand only if considerations other than market supply-demanddetermine the management of the floating exchange rate.
One result of the success of the capital flow liberalisation wasthe unprecedented surge in equity capital inflows between October1993 and November 1994. Based on analysis by the EconomicDivision and internal discussions, the Department of EconomicAffairs developed a macro-management strategy for this ‘DutchDisease’ problem that was quite different from the standard oneproposed by the IMF.17 Though other countries in other timeperiods have undoubtedly used variants of the same policy, ourexperience in this regard may also have useful lessons for others.
Even in the case of the successful trade and capital accountliberalisation the country has not in my view moved as far oras fast as it could have without taking undue risk. The Asiancrisis and the economic sanctions share some of the blame asthey the revived the primal fears of the sceptics, which weregradually being laid to rest. Too often, however, this has spectrebeen used to avoid or slow down external sector reform. The
nineties experience shows that external liberalisation will payfurther dividends probably in the form of higher growth.
Contrary to the perception of many outside observers the Indianeconomy has become more open relative to other emergingeconomies. India’s ranking with respect to trade, FDI, and portfolioflows has improved noticeably over the eighties (Table 4). Onlyin the case of tariffs is there is no relative improvement, probablybecause India was a complete outlier. There is however still avery long way to go to attain a ranking in trade and FDI thatis commensurate with the size of the economy. Trade as wellas FDI remain pathetically low when measured as ratio to GDPand ranked accordingly. China’s success in trade and FDI is notonly a challenge but also a message of hope that India too canmake a quantum jump by greater opening of the economy andby ensuring that domestic economic policies are conducive tothe exploitation of the growth potential of trade and FDI.
TradeTradeTradeTradeTrade
The opening of the economy to international trade has suc-cessfully raised the share of trade in the GDP. Goods and servicestrade has increased from an average of 15.1 per cent of the GDPduring the eighties to an average of 24.8 per cent of the GDPin the nine years (1992-93 to 2000-01) after the crisis. Similarlymerchandise trade, which had averaged 12.6 per cent of the GDP
Sources:Handbook of Statistics on the Indian Economy, RBI; WTO, World Merchandise Trade Data.
Economic and Political Weekly August 9, 20033382
in the decade of the eighties, has increased significantly to anaverage of 20.1 per cent of the GDP in the post-crisis period(Table 3). Contrary to the expectations of reform critics, thechange on the import side has been less than on the export side.Exports (imports) increased from 4.7 per cent (7.9 per cent) ofthe GDP in the decade before the crisis to 8.5 per cent (11.6per cent) in the nine years succeeding it (i e, post crisis period).As a consequence, the proportion of imports financed by exportshas increased from 0.59 in the pre-crisis period to 0.74 in thepost-crisis period (Table 3).
For a disaggregated view one has to go from the payments datato the customs data. The growth of customs exports in US $ valueaccelerated from an average of 8.1 per cent during the pre-crisisyears to an average of 10.9 per cent during the post-crisis years(Table 2). This increase in growth was solely due to the accele-ration in the quantum of exports, whose growth rate almostdoubled from 5.4 per cent per annum in the first period to 10.2per cent per annum in the second period. This compensated fora deceleration in the growth of unit values from 10.3 per centper annum in the pre-crisis period to 7.7 per cent per annum inthe post-crisis period. The net terms of trade have actuallyimproved in the post-crisis period. Despite the slowing down ofunit value growth rates they remain high by world standards.World merchandise (manufacture) export unit values increased
by 2.7 per cent (2.9 per cent) per annum during the eighties and0 per cent (0.5 per cent) per annum in the nineties.
Manufactured exports responded well to the trade reform andincreased from an average of 60.7 per cent of total exports in theeighties to an average of 76.1 per cent of total exports after thecrisis (Table 3). As a result, the ratio of manufactured exportsto the GDP more than doubled from a pre-crisis average of 2.8per cent to a post-crisis average of 6.3 per cent. Its share of totalexports also increased from 60.7 per cent to 76.1 per cent betweenthe two periods.18 The importance of manufactured exports todomestic manufacturers has correspondingly increased. This isbest captured by the ratio of manufactured exports to the GDPfrom registered manufacturing, which has also more than doubledfrom a pre-crisis average of 6.4 per cent to a post-crisis one of13.2 per cent. Thus, even with the many domestic controls andpolicy distortions still hampering manufacturing in India thissector has demonstrated its comparative advantage vis-à-vis othertrade sectors.
On the import side, oil and non-oil imports have followed asignificantly different path. Oil imports have increased margin-ally by 0.2 per cent of the GDP after the crisis (Table 3). Non-oil imports have in contrast jumped from a pre-crisis averageof 5.2 per cent of the GDP to a post-crisis average of 7.6 percent of the GDP. Given the relatively low price elasticity of
Table 3: Balance Of Payments RatiosTable 3: Balance Of Payments RatiosTable 3: Balance Of Payments RatiosTable 3: Balance Of Payments RatiosTable 3: Balance Of Payments Ratios(Per Cent of GDP at Current Market Prices)
Net imports of manufactured goodsratio to manufacturing GDP 1.8 8.9 2.5 2.3 7.7 10.1 -0.2 4.8 13.7 -6.2
Machinery and equipment importshare in manufacture imports 26.0 29.0 29.6 29.7 26.6 31.4 31.1 28.4 36.3 19.1
Sources: RBI, Handbook of Statistics on the Indian Economy; Directorate General of Commercial Intelligence and Statistics (DGCI and S).
Economic and Political Weekly August 9, 2003 3383
demand for oil, prices determined by the Organisation of Petro-leum Exporting Countries (OPEC) have largely driven the changesin value (US$) of oil imports, with domestic disruptions insupply19 playing a small role.
Elasticity pessimists in India have generally been very con-cerned about the effects of opening the economy on the manu-facturing sector (‘de-industrialisation’). That these fears haveproved unjustified can be seen from the value of net imports ofmanufactured products (calculated as the value of imports lessthe value of exports). This has fallen dramatically from a pre-crisis average of 8.9 per cent of the GDP to a post-crisis averageof 2.5 per cent of the GDP (Table 3). In fact, exports of manu-factures exceeded imports of manufactures (i e, a net surplus)during each of the four years from 1991-92 to 1994-95. This showsthat manufacturing trade was highly responsive to the exchangerate devaluation of July 1991, as predicted in Virmani (1991b).
Despite all these changes in the trade account, the trade deficithas not changed significantly in the post-crisis period. It averaged3.1 per cent of the GDP in the post-crisis period, compared to3.2 per cent in the eighties and 3.0 per cent in the second halfof the eighties. The trade balance was in fact stronger than isapparent from the bare numbers, as the post-crisis imports includea substantial proportion of gold imports that earlier were notcaptured in the import numbers (due to smuggling). The break-up of the USSR also disrupted established trade patterns and newmarkets had to be found to replace those lost in the USSR andEast Europe. Further, despite the Asian crisis in late 1997-98,the trade balance improved in 1998-99.
Paradoxically, these changes in exports and imports haveoccurred despite the fact that the real effective exchange rateaveraged the same in the post-crisis period as in the pre-crisisdecade. This is however quite misleading as the real effectiveexchange rate depreciated by an average of 1.9 per cent per annumin the nineties, because of a depreciation of 15.1 per centin 1991-92 and 11.1 per cent in 1992-93 (Tables 1 and 2). Thereal depreciation rate was therefore only 0.1 per cent per annumslower than in the eighties and 0.2 per cent per annum slowerthan in the seventies. As a result India’s share in world exportscontinued to increase from 0.52 per cent in 1990 to 0.67 per centin 2000 (Table 4). This increase was higher than in the previous
decade because of the gradual lifting of the QRs and reductionin customs tariffs.
Several commentators have, however, raised the issue of aslowing and perhaps even some reversal of reforms (tariffs andexchange rate management) during the second half of the ninetiesand its affect on exports and balance of trade. A comparison ofthe performance in the second half of the nineties relative to thatin the first half can shed some light on this issue. The ratio of exportsto the GDP, which was identical during the two halves of theeighties (4.7 per cent) jumped to 7.3 per cent in the first half ofthe nineties and thence to 8.3 per cent in the second half of thenineties. It was 9.5 per cent of the GDP in 2000-01 (Table 1).
The trajectory of India’s share in world merchandise exportsshows a similar trend. India’s share of world trade increased by0.08 per cent points between 1990 and 1995 and by 0.07 percent points between 1995 and 2000 (Table 4).
The share of manufactured exports in India’s total exports alsoincreased during the nineties. It went from an average of 74.7per cent during the first half of the nineties to an average of 76.2per cent in the second half of the nineties (Table 3). This increasewas however significantly less than the 8 per cent-point increasein the share of manufactured exports between the second halfof the eighties and the first half of the nineties. The decelerationin the manufactured-export growth rate over the nineties may bepartly due to the slowing of real effective depreciation to 2.9 percent per annum during the first half and to 0.8 per cent per annumduring the second half of the nineties (Table 2 and Figure 1).
The trade deficit after falling sharply during 1990-94 (2.1 percent of the GDP) has increased even more sharply during1995-99 to an average 3.6 per cent of the GDP (Table 3). Thisis higher than in 1980-84 (3.5 per cent). It touched 4 per centof the GDP in 1999-2000 but fell back to 3 per cent in 2000-01.The increase in the import-GDP ratio over the nineties is drivenby the increase in manufactured imports (Tables 2 and 3). Thenet imports of manufactured goods, which become negative (i e,net exports), have risen in the second half of the nineties. Theystill remain well below that in the first half of the eighties. Thereare a number of reasons for these developments. The euphoriathat preceded the Asian crisis created large capacities in many(un-differentiated) products in Asia that has put downward pressure
Figure 1: India's Share of World Exports and REERFigure 1: India's Share of World Exports and REERFigure 1: India's Share of World Exports and REERFigure 1: India's Share of World Exports and REERFigure 1: India's Share of World Exports and REER
55
65
75
85
95
105
1975
-76
1976
-77
1977
-78
1978
-79
1979
-80
1980
-81
1981
-82
1982
-83
1983
-84
1984
-85
1985
-86
1986
-87
1987
-88
1988
-89
1989
-90
1990
-91
1991
-92
Year
Rea
l Effe
ctiv
e E
xcha
nge
Rat
e In
dex
REER Export share
Economic and Political Weekly August 9, 20033384
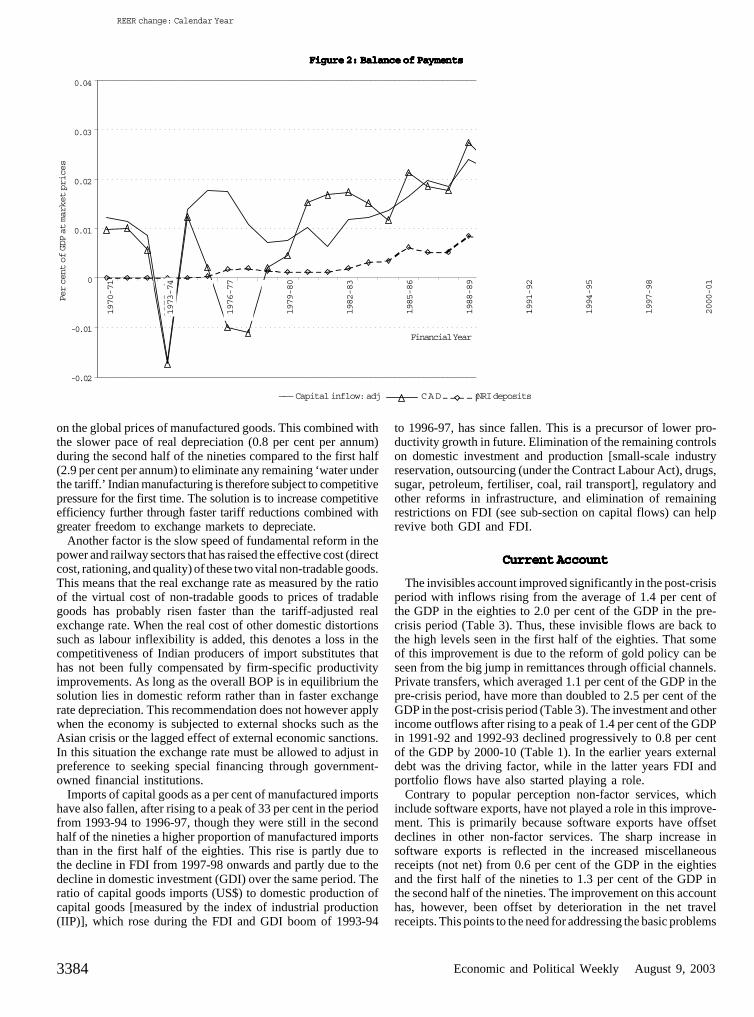
Figure 2: Balance of PaymentsFigure 2: Balance of PaymentsFigure 2: Balance of PaymentsFigure 2: Balance of PaymentsFigure 2: Balance of Payments
to 1996-97, has since fallen. This is a precursor of lower pro-ductivity growth in future. Elimination of the remaining controlson domestic investment and production [small-scale industryreservation, outsourcing (under the Contract Labour Act), drugs,sugar, petroleum, fertiliser, coal, rail transport], regulatory andother reforms in infrastructure, and elimination of remainingrestrictions on FDI (see sub-section on capital flows) can helprevive both GDI and FDI.
Current AccountCurrent AccountCurrent AccountCurrent AccountCurrent Account
The invisibles account improved significantly in the post-crisisperiod with inflows rising from the average of 1.4 per cent ofthe GDP in the eighties to 2.0 per cent of the GDP in the pre-crisis period (Table 3). Thus, these invisible flows are back tothe high levels seen in the first half of the eighties. That someof this improvement is due to the reform of gold policy can beseen from the big jump in remittances through official channels.Private transfers, which averaged 1.1 per cent of the GDP in thepre-crisis period, have more than doubled to 2.5 per cent of theGDP in the post-crisis period (Table 3). The investment and otherincome outflows after rising to a peak of 1.4 per cent of the GDPin 1991-92 and 1992-93 declined progressively to 0.8 per centof the GDP by 2000-10 (Table 1). In the earlier years externaldebt was the driving factor, while in the latter years FDI andportfolio flows have also started playing a role.
Contrary to popular perception non-factor services, whichinclude software exports, have not played a role in this improve-ment. This is primarily because software exports have offsetdeclines in other non-factor services. The sharp increase insoftware exports is reflected in the increased miscellaneousreceipts (not net) from 0.6 per cent of the GDP in the eightiesand the first half of the nineties to 1.3 per cent of the GDP inthe second half of the nineties. The improvement on this accounthas, however, been offset by deterioration in the net travelreceipts. This points to the need for addressing the basic problems
on the global prices of manufactured goods. This combined withthe slower pace of real depreciation (0.8 per cent per annum)during the second half of the nineties compared to the first half(2.9 per cent per annum) to eliminate any remaining ‘water underthe tariff.’ Indian manufacturing is therefore subject to competitivepressure for the first time. The solution is to increase competitiveefficiency further through faster tariff reductions combined withgreater freedom to exchange markets to depreciate.
Another factor is the slow speed of fundamental reform in thepower and railway sectors that has raised the effective cost (directcost, rationing, and quality) of these two vital non-tradable goods.This means that the real exchange rate as measured by the ratioof the virtual cost of non-tradable goods to prices of tradablegoods has probably risen faster than the tariff-adjusted realexchange rate. When the real cost of other domestic distortionssuch as labour inflexibility is added, this denotes a loss in thecompetitiveness of Indian producers of import substitutes thathas not been fully compensated by firm-specific productivityimprovements. As long as the overall BOP is in equilibrium thesolution lies in domestic reform rather than in faster exchangerate depreciation. This recommendation does not however applywhen the economy is subjected to external shocks such as theAsian crisis or the lagged effect of external economic sanctions.In this situation the exchange rate must be allowed to adjust inpreference to seeking special financing through government-owned financial institutions.
Imports of capital goods as a per cent of manufactured importshave also fallen, after rising to a peak of 33 per cent in the periodfrom 1993-94 to 1996-97, though they were still in the secondhalf of the nineties a higher proportion of manufactured importsthan in the first half of the eighties. This rise is partly due tothe decline in FDI from 1997-98 onwards and partly due to thedecline in domestic investment (GDI) over the same period. Theratio of capital goods imports (US$) to domestic production ofcapital goods [measured by the index of industrial production(IIP)], which rose during the FDI and GDI boom of 1993-94
1970
–1
1971
–2
1972
–3
1973
–4
1974
-5
1975
–6
1976
–7
1977
–8
1978
–9
1979
–80
1980
–1
1981
–2
1982
–3
1983
-4
198
4–5
1985
–6
1986
–7
1987
–8
1988
–9
Financial Yea
capital inflow:adj CAD N
0.04
0.03
0.02
0.01
0
-0.01
-0.02
Per cent of GDP at market prices
——– Capital inflow: adj
Financial Year
CAD NRI deposits
1970-71
1973-74
1976-77
1979-80
1982-83
1985-86
1988-89
1991-92
1994-95
1997-98
2000-01
REER change: Calendar Year
Economic and Political Weekly August 9, 2003 3385
that bedevil foreign tourists coming to India, like lack of healthand hygiene (at tourist sites and in hotels), information (abouttourist sites, places, and cities), common courtesy (from immi-gration counters to local transport to tourist sites) and entertain-ment at tourist destinations.20
The most critical area of infrastructure reform from the tourismperspective is transport. The quality and efficiency of airports anddomestic airlines can be improved through increased competition.Domestic airlines must be allowed to enter into joint ventureswith foreign airlines and the foreign equity proportion raised atleast to the level in the telecom sector. Airport services can beunbundled so that the government can focus on improvement inair traffic control and landing equipment and in security and safetyprocedures. The rest can then be left to the private sector. Railwaytransport can also play a part in tourism earnings if the metro-politan railway stations are privatised and turned into cleancommercial hubs and the supply of passenger rail services openedup to private entry and competition (with no price control).
There was also a minimal effect of the Asian crisis on invisibleswith a decline of 0.2 per cent of the GDP in the invisible surplusin 1998-99 and a strong bounce up the next year (Table 1). Theimprovement in invisibles earning has ensured that there was littlecriticism of the current account liberalisation.
As a result of the strengthening of the invisibles account, thecurrent account deficit averaged 1.1 per cent of the GDP in thepost-crisis period (Table 3). There is no evidence of deteriorationin the current account over the decade, with the current accountdeficit being marginally lower in the second half (1.2 per cent)of the nineties compared to the second half (1.3 per cent). Thecurrent account deficit is lower than the pre-crisis average of 1.8per cent of the GDP and the 1.5 per cent average of the first halfof the eighties. The position was even better (0.5 per cent) in2000-01. The external reforms have therefore been successfulin putting the current account balance on a sustainable path.
The total fiscal deficit during the last five years is comparableto the fiscal deficit in the first half of the eighties. This has notprevented the current account deficit from declining dramatically.The difference in impact is due to the external sector and otherreforms that have improved the flexibility of the economy. Thefiscal adjustment that has taken place during the nineties mayhowever be underestimated because quasi-fiscal elements suchas exchange guarantees have also been absorbed. The high fiscaldeficit may in future act as a drag on economic growth even ifits impact on the external deficit is lower.
The central government fiscal deficit declined from an average6.6 per cent of the GDP, during the pre-crisis decade of theeighties, to an average of 5.2 per cent of the GDP in the post-crisis period (1992-93 to 2000-01). This decline of 1.4 per centof the GDP was double the 0.7 per cent of the GDP decline inthe current account deficit between the two periods (Table 3).Using the coefficient of our estimated equation (1), the declinein the fiscal deficit explains about 0.65 per cent of the improve-ment in the current account deficit, while the rest is explainedby the average real effective depreciation of 0.7 per cent perannum in the post-crisis period.
Underlying this unchanged quantitative picture are a numberof changes that may have affected the links between the fiscaldeficit and the external account and other variables. Firstly,exchange guarantees on NRI deposits had to be paid by the
government after the 1991 devaluation. There has also been aconscious effort to reduce exchange and interest guarantees ondebts incurred by public financial institutions and public sectorunits. The reduction of the statutory liquidity ratio (SLR) require-ments on banks to hold government securities coupled withpayment of market interest on these liabilities has eliminated theimplicit tax on banks while raising government interest payments.Customs duty reforms have similarly raised the efficiency of thetax system, while reducing revenue collections. Capital expen-ditures have been cut much more sharply than salaries and wages,thus decreasing the share of tradable goods in the governmentexpenditure basket. The overall result is that the primary deficithas fallen much faster than the fiscal deficit (by 2.5 per cent pointsof the GDP), the efficiency of the tax system has increased, whilethe quality of expenditure has declined.
Prima facie the fiscal picture appears bleaker if one looks at thetotal deficit of the centre and the states (C and S). The total fiscaldeficit (C and S) has declined by only 0.9 per cent of the GDP,from an average of 8.1 per cent of the GDP in the pre-crisis decadeto an average of 7.2 per cent in the post-crisis period (1992-93to 1999-2000). The total fiscal deficit (C and S) increased by1.6 per cent of the GDP between the first and second half of theeighties. It then declined by 1.7 per cent of the GDP in the post-crisis period. Though the average fiscal deficit in the second halfof the nineties (7.2 per cent of the GDP) was marginally lowerthan in the first half of the eighties (7.3 per cent of the GDP),in 1999-2000 it was again up to 7.9 per cent of the GDP (Table1). Such a high fiscal deficit also makes it difficult to respondto cyclical fluctuations with an active fiscal policy. Further theunderlying problem of efficiency and productivity of governmentexpenditures remains to be addressed. Thus, the fiscal problemremains a potential threat to the economic health of the country.
Regressions using a slope dummy for the post-crisis period,suggest that the impact of the central fiscal deficit on the currentaccount is a fraction of what it was till 1991-92.21
Similar results are obtained if the central government’s primarydeficit is used in the equations instead of its fiscal deficit. Thisis not surprising given the fundamental changes in the externalsector. One of these has been to reduce the share of the govern-ment in total external debt thus reducing the direct link betweenthe fiscal deficit and external borrowing. More generally, thereduction in controls and restrictions has changed the nature ofthe link between government behaviour and private actions. Thus,the combination of fiscal and external sector reform has mod-erated the fiscal influence on the current account and inflation.The movement to a managed floating exchange rate has reducedthe external spillover effect of the fiscal deficit on the currentaccount deficit, while the elimination of import barriers hasmitigated the effect of the impact of the fiscal deficit on inflation.
Capital FlowsCapital FlowsCapital FlowsCapital FlowsCapital Flows
The capital account of the BOP has also shown correspondingimprovement. Capital inflows (adjusted or excluding ‘othercapital’) increased from an average of 1.6 per cent of the GDPin the pre-crisis decade to an average of 2.2 per cent of the GDPin the post-crisis period (Table 3). Even more significant thanthe overall increase was the increase in the foreign investmentinflows from negligible levels in the eighties to an average of1.1 per cent of the GDP in the post-crisis period. The contributionsof external assistance and rupee debt declined by 0.2 per centof the GDP, each. The contribution of ECB increased by 0.1 per
Economic and Political Weekly August 9, 20033386
cent of the GDP while that of NRI deposits remained unchanged.Thus, the objective of raising the equity-debt ratio of externalliabilities has been achieved (Figure 2).
FDI responded extremely quickly to the new policy announce-ment in July 1991, recovering to $129 million in 1991-92 itselfand then more than doubling to $ 315 million the next year(Table 1). It continued to grow fairly rapidly to reach $ 3.56billion by 1997-98. Between 1990-91 and 1997-98, FDI grewat a compound annual rate of 67 per cent (with a simple averageof 73 per cent for the 1991-92 to 1997-98 period). This rapidgrowth was followed by the Asian crisis and economic sanctions,resulting in a decline of about 30 per cent in 1998-99 and 13per cent in 1999-2000. Though much of the decline in 1998-99was part of the overall decline in FDI flows to emerging marketsbecause of changed risk perceptions, India did not share in therecovery of flows in 1999-2000. Despite positive growth in2000-01 India’s share in FDI to emerging markets remains belowthe peak reached in 1997-98.
During 1990-91 to 2000-01 about half of the foreign investmentinflow was FDI and the other half portfolio (FII and GDR). Thissuggests that the opening of the equity market has been relativelymore successful than the opening of FDI. This is not due to FDIpolicy alone. In the manufacturing sector where 100 per centautomatic FDI is allowed in all areas open to large domesticindustry, there is only one specific restriction that applies to FDIbut not domestic investment. This is the requirement that anexisting foreign direct investor must obtain a no objection fromthe Indian joint-venture partner before starting a new independentunit. This restriction has no relevance to green-field investorsand those without a domestic joint-venture partner, but may haveslowed the growth of the existing FDI. The more importantproblems in the case of FDI in the manufacturing sector aredomestic policy constraints such as small-scale industry reser-vation and labour policy and rules and procedures that makeChina a more attractive destination than India. This discouragesboth foreign and Indian companies from investing in a slew oflabour-intensive exportable sectors.
In the case of infrastructure, foreign equity limits exist in twomajor sectors, aviation and telecom. The 49 per cent limit intelecom has clearly had a negative affect on FDI inflows intothis sector and should be removed. The ban on foreign airlinesin domestic aviation has been a more important factor in aviationand needs to be removed forthwith. A generic problem affectingmany infrastructure sectors has been one of regulatory capture(and potential capture-creating regulatory risk) by public sectormonopolies abetted by their supervisory ministries. This problemhas taken an excruciatingly long time to sort out thus slowinginvestment in infrastructure. A modern independent regulatorysystem in all infrastructure sectors would help to accelerate bothforeign (FDI) and domestic investment.
In the case of the power sector the most fundamental problemis the ‘T and D (transmission and distribution) Mafia,’ that hasa vested interest in maximising power theft by consumers. Thisproblem has to be addressed through a special police task forcethat arrests the corrupt employees and sequesters their ill-gottengains. Some amendments may also be required in the Preventionof Corruption Act to make it possible to freeze the financialreturns from investment of stolen power by employees. A breakup of the ‘T and D Mafia’ will also make it easier to solve thesecondary problem of raising user costs to economic levels. Itwill also make it possible to attract private entry into the powersector within a competitive generation industry and well- regu-
lated distribution and transmission sub-sectors. In the meanwhile,greater transparency in the implicit tax-subsidy arrangements andtheir replacement by an explicit tax-subsidy regime will makeit possible for private generators to operate outside the strangle-hold of the state electricity boards (SEBs).
In non-infrastructure services, particularly in some servicesectors that have attracted large investments in other countries,domestic reforms as well as liberalisation of FDI has beenpainfully slow. The entire policy framework for private entryinto provision of urban infrastructure, real estate, housing, andretail trade (particularly grocery super markets) needs to bereformed to attract both domestic and foreign investment.22
Equity flows also responded quickly to the policy change, risingfrom almost nil in 1991-92 to $ 244 million in 1992-93 and thento an incredible $ 3.57 billion in 1993-94 followed by another$ 3.8 billion in 1994-95 (Table 1). The quarterly build-up ofequity flows was even starker and created issues for monetaryand exchange range management. Equity flows increased from$ 307 million in July-September 1993 to $ 935 million in October-December 1993 and to $ 2,283 millon in January-March 1994,before stabilising at a lower rate of about $1 billion a quarterin the next three quarters. Thus, the four quarters of (calendaryear) 1994 saw a portfolio inflow of $ 5.5 billion with anunprecedented $ 6 billion flowing in over a 12-month periodstarting in mid-October 1993.
In analysing the reasons, it was found that this was partly dueto the push provided by the reduction of US interest rates, butmainly due to the opening of the equity market and the favourableenvironment created by the broad based economic reforms.23
Given the accelerated build-up, part of this incredible flow wastherefore viewed as a portfolio stock adjustment. In the absenceof any historical data it was, however, difficult to determine howmuch of the increased flow was temporary and how muchpermanent. In dealing with the monetary and exchange rateimplications of the flow the following three-fold strategy wassuggested.
(a) To absorb the temporary part of the upsurge in reservesand to partially sterilise the reserves build up. The inflation ratewould be carefully watched so that the sterilised proportion couldbe stepped up if pressure is built up on the inflation front.
(b) To not sterilise the permanent increase in the inflow sothat it could increase the capital available in the economy, reducereal interest rates and stimulate investment.
(c) To accelerate the opening of the current and capital ac-counts, to improve the efficiency of the economy, so that thesepermanent inflows would be productively utilised.
The build-up of reserves meant that the nominal exchange ratewould not appreciate. It was the Economic Division’s argumentthat partial (incomplete) sterilisation was essential to allow thisnewly available source of saving to be translated into lowerinterest rates that would stimulate investment. In the implicitmodel it was understood that there would be some pressure onprices, but it was believed that the real appreciation would belower through this channel than if the capital flow was translatedinstantaneously into a nominal appreciation (i e, no purchasesby the RBI to build reserves).24 Given the thinness of the foreignexchange market, nominal appreciation to equilibrate an inflowof $6 billion over 12 months would have been in double digits.Inflation as measured by the wholesale price index in fact in-creased by about 4.3 per cent in 1994-95 (relative to the averageinflation in 1993-94 and 1995-96).
There was an alternative monetarist view that this equity flow
Economic and Political Weekly August 9, 2003 3387
was due to the high Indian interest rates produced by the higherfiscal deficit in 1993-94. Responding to the fears of the monetarists,part of the inflow could be sterilised. Our preferred alternativeto the monetarist approach was, however, to accelerate the paceof external liberalisation, including on capital account, and thusabsorb the permanent component of the inflow to increase ef-ficiency of resource use and stimulate investment and growth.
India’s debt statistics reflect the reduction in the dependenceon debt. The ratio of total external debt to the GDP has declinedfrom a peak of 33.8 per cent at the of end March 1992 to 19.8per cent of the GDP at the end of March 2000 (Table 1). Theshare of short-term debt in total debt has been reduced from apeak of 10.2 per cent on March 31, 1991 to 4.1 per cent on March31, 2000. The ratio of short-term debt was only one-tenth offoreign currency reserves (excluding SDRs and gold) at the latterdate. At the end of March 1999, the MLT debt of residual maturityless that one year was less than 1.5 times the short-term debt,which was about 4.5 per cent of total debt and one-tenth ofreserves. Thus, even if the residual short-term debt element ofthe MLT repayments coming due within the year 1999-2000 isadded to the short-term debt, this constituted only a quarter offoreign exchange reserves at the beginning of the year.
The effectiveness of the external sector reforms was demon-strated by the ease with which the BOP weathered the doublewhammy of the Asian crisis in late 1997-98 and the nuclear-related economic sanctions imposed in early 1998-99. The currentaccount deficit declined as a per cent of the GDP in the subsequentyears. As anticipated, the most clear and significant effect of thisshock was on equity inflows, which declined from 1.3 per centof the GDP in 1997-98 to 0.6 per cent of the GDP in 1998-99(Table 3). It had been anticipated that FDI may slow downtemporarily and equity inflows may stop for a while.25 FDI flowsdid in fact decline by 31 per cent in 1998-99 and by 12.6 percent in 1999-2000 before recovering the next year (Table 1). Ourforecast of portfolio flows turned out to be marginally over-optimistic. There was an outflow in each of the first three quartersof 1998-99, of $ 423 million, $ 117 million, and $ 149 million,respectively (Table 2A).26 Almost the entire outflow was, howevermade up in the last quarter of 1998-99 with an inflow of $621million, leaving a net outflow of $ 68 million for the year asa whole. As a result, total foreign investment declined from 1.3per cent of the GDP in 1997-98 to 0.6 per cent of the GDP in1998-99. They recovered quickly to 1.1 per cent of the GDP thenext year (Table 1).27
BOP and REERBOP and REERBOP and REERBOP and REERBOP and REER
The strengthening of the BOP as a result of the external sectorreforms was (also) reflected in the overall balance and the realexchange rate. There was an annual average reserve accumulationof 1.1 per cent of the GDP in the post-crisis period comparedto the annual draw down of 0.2 per cent of the GDP during thepre-crisis decade. The real effective exchange rate showed nodepreciation on average during the post-crisis period after depre-ciating by an average of 2 per cent per annum during the eighties.
The issue of temporary fluctuations and anticipated temporaryshocks and how to deal with them has arisen in the context ofthe borrowing through the India Millennium Deposits in 2000-01. Consumption-smoothing arguments suggest that short-termborrowing or a temporary draw-down of reserves would bejustified if an adverse shock to imports, exports, or an item ofthe capital account were temporary. The alternative is to let the
exchange rate depreciate when the adverse shock hits and thenappreciate after the shock has reversed itself. Medium-termborrowing is, however, inappropriate to meet a short-term shock.If the external fluctuation is of uncertain duration, the policychoice between external borrowing and allowing the currencyto depreciate is much starker. In the case of a shock that couldlast more than a year, the exchange rate should be allowed todepreciate sufficiently to improve the trade balance and makethe financing unnecessary. The lesson of the 1990-91 BOP crisisis that external borrowing through government-owned financialinstitutions is a palliative, which ultimately weakens (rather thanstrengthening) the external balance.
The comment has often been made that though India may havestepped up the pace of reforms during the nineties, it has notimproved its position vis-à-vis other countries as they have allbeen reforming at the same or faster pace. This paper addressesthis issue for the external sector using a number of parametersfor which international comparative data is available.
India’s merchandise export growth increased from 7.7 per centper annum during the 1980s to 8.7 per cent per annum duringthe 1990s (Table 4). This was faster than the rate of growth ofworld exports at 5.4 per cent and 6.3 per cent for the two periodsrespectively. As a result the share of India in world exportsimproved from 0.42 per cent in 1980 to 0.52 per cent in 1990and further to 0.67 per cent in 2000. India’s growth was howeverslower than the average for Asia during the eighties, but roseabove it in the nineties. India’s growth ranking consequentlyimproved from 52 during the eighties to 46 during the nineties.Most of the economies whose GDP growth was faster than India’sduring these decades, like China, Korea, Singapore, Thailand,Malaysia, Ireland, and Vietnam, also had a faster growth ofexports. Other countries like Hong Kong, Bangladesh, Sri Lanka,and Mexico had a faster growth of exports than India, but theirper capita GDP growth was slower than India’s.
The improvement in the trade share was from 0.57 per centin 1980 to 0.60 per cent in 1990 and further to 0.71 per centin 2000 (Table 4). This improvement was reflected in the countryranking (total trade in US $ or share of trade). This rankingimproved from 43 to 33 to 27 (Table 4). Thus, the improvementin rank was less than commensurate with the improvement inshare, suggesting that a number of competitor countries improvedeven more. The import rank was slightly better and the exportrank slightly lower than the trade rank.
Given that India’s GDP in US $ was the 12th highest in theworld, India’s trade rank (in terms of US $ value of trade) of27 clearly shows that India is still a very closed economy.Economies that are smaller than India’s in US $ GDP, but arerelatively large like Korea, Australia, Russia, Netherlands,Switzerland, Belgium, and Sweden have a higher value of tradethan India. The reasons are not far to seek. At the end of thedecade India still had the highest tariffs in the world with onlya few exceptions. Of the 70 countries for which (weighted)average tariff rates are available in the World DevelopmentIndicators (WDI) database, India had the third highest rates(Table 4).28 Only Pakistan and Cameroon had higher rates.Despite the fact that the India had reduced its tariff rates by 40per cent over a five-year period (the 22nd highest reduction), itsoverall rank improved by only one position. In fact, this happenedonly because Cameroon raised its tariff rates sharply.
Economic and Political Weekly August 9, 20033388
Among the countries having a lower weighted-average tariffthan India (29.5 per cent) are its neighbours, Sri Lanka (22.5 percent), Bangladesh (22 per cent), Nepal (18 per cent), and China(15.7 per cent). This creates additional problems of import diversionand smuggling. The fact that India has some form of free-tradearrangement with several of its neighbours means that it becomesprofitable to import many items into these countries and thenexport them to India. Any objective assessment would suggestthat Indian industry can surely compete with industry in thesecountries and there can be no rationale for an average rate higherthan that of Nepal. Thus, the commitment made in the UnionBudget of 2001-02, to reduce peak rates to 20 per cent must beimplemented as soon as possible. In fact, it should be our endeavourto bring the weighted average rate subsequently down to thatof Thailand (15 per cent) and then to that of Chile (9.9 per cent).
Customs duty collection rates are available for a larger set ofcountries (about 114 in 1999). According to these India ranked103rd in 1999 (Table 4).29 Only 11 out of the 114 countries hada higher customs duty collection rate than India. Among the 11countries are Malawi, Myanmar, and Syria. Even though thecollection rates for India (and possibly other countries) includethe counterpart of domestic taxes, this is offset by exemptionssuch as for inputs and capital goods used by exporters.
The comparative picture with respect to FDI contrasts some-what with that for trade. India’s position at 39th with respectFDI inflows (US $ value) was better than its trade rank in 1980
(Table 4). India’s overall rank however worsened during theeighties to reach 42nd in 1990. Since then it has improvedsignificantly to 33rd in 1999, but is now worse than its traderank. If the rich countries are excluded, as is often done, andwe consider only the emerging markets and developing countries,then India was ranked 14th in 1999 up from 22nd in both 1980and 1990. Even Russia and Angola, however, had more FDIinflow than India in 1999.
Domestic resistance to further opening of FDI has focused onthe fear of foreigners taking over Indian industry/economy. Agood way to quantify this fear in a comparative perspective isto look at the share of FDI in GDI. In 1999 the ratio was only2.1 per cent for India compared to 5.3 per cent for Russia, 8.5per cent for S Korea, 10.5 per cent for China and Mexico, 21.3per cent for Brazil 23.8 per cent for Thailand, and 25.1 per centfor Singapore (Table 8A). What is most telling is that both Chinaand Singapore have among the highest domestic saving rates inthe world. They recognise that the knowledge, initiative, andinternational marketing links that comes with FDI is much moreimportant than the fact that it also constitutes use of foreign savingin the domestic economy. In terms of the comparative rank thisputs India at 126 out of 201 countries, with only about 25 countrieshaving a lower role for FDI in the domestic economy. Thus fearsabout the role of foreign investment in the Indian economy arequite unjustified given the very low proportion of FDI in IndianGDI.
Table 4: Global Share, Comparative Rates, and Rank of IndiaTable 4: Global Share, Comparative Rates, and Rank of IndiaTable 4: Global Share, Comparative Rates, and Rank of IndiaTable 4: Global Share, Comparative Rates, and Rank of IndiaTable 4: Global Share, Comparative Rates, and Rank of India
Sources: WTO, Merchandise Trade Data Set; World Bank, World Development Indicators 2001.
Economic and Political Weekly August 9, 2003 3389
The position with respect to portfolio flow is better than forFDI. In the WDI database, only emerging market data is available.According to this India’s rank has improved from 14th in 1990to 6th in 1999 (Table 4). Only South Korea, South Africa, China,Thailand, and Brazil received more portfolio flows in 1999.Except for South Africa the other four countries also receivedmore FDI than India in 1999. Because of foreign equity holdinglimits, the weight of Indian equity in emerging market equityindices has been reduced in 2000-01.
The improved access to external capital markets during thenineties has reduced the relative interest cost to the Indian economy.The lending rate spread over the London Inter-Bank Offer Rate(LIBOR) gives some indication of this convergence. Because offluctuations we use five-year averages over the last 15 years. Indiawas ranked 55th over 1985-89, 45th over 1990-94, and 37th over1995-99 (Table 4). Thus, the opening of the capital account hasalso helped lower the relative cost of capital, but India still hasa long way to go.30
The comparative picture presented above confirms, for thosewho still need such confirmation, that foreign direct investorsare not knocking at our gates to enter the Indian markets. Theleast we can do is to remove unnecessary barriers created by FDIpolicy. One of these is to put all FDI into India on the 100 percent automatic route (as manufacturing and much of infrastruc-ture already are). A fair and transparent safeguard would be toapply this unlimited automatic route only on a reciprocal basis.Thus a foreigner from a country that does not allow Indians toown TV stations would have to go through the FIPB route forinvestment in Indian TV stations. In a few sectors in whichnational security conditions may be relevant, a security clearancecan be prescribed for foreign nationals and companies fromsensitive countries (for instance those harbouring terrorists). Alllaws that apply to Indians would assuredly continue to apply toforeigners (for instance, land ceiling laws in agriculture). Rulesand regulations applicable to professional practice by foreignerswould have to be made more explicit (a reciprocity rule wouldalso be applicable here).
To retain and strengthen our equity ranking, foreign equityinflows should be freed from the remaining controls. Furtherliberalisation of equity inflows has to go hand in with domesticliberalisation of financial markets and strengthening of the regu-latory system for these markets. Restrictions on foreign equityinvestment in the Indian capital market can be removed immediatelyby allowing 100 per cent foreign equity in all listed companies.
The liberalisation of India’s external sector during the pastdecade was extremely successful in meeting the BOP crisis of1990 and putting the BOP on a sustainable path. These reformsimproved the openness of the Indian economy vis-à-vis otheremerging economies. Much, however, remains to be done. India’seconomy is still relatively closed compared to its ‘peer competi-tors.’ Further reduction of tariff protection and liberalisation ofcapital flows will enhance the efficiency of the Indian economyand along with reform of domestic policies will stimulate invest-ment and growth.
The main lesson of the nineties is that liberalisation of thecurrent and capital account increases the flexibility and resilienceof the BOP. This applies to trade, invisibles, equity capital, MLTdebt flows, and the exchange market. Our analysis confirmed
that in India the exchange rate is a powerful instrument ofadjustment in the current account deficit. It also confirms thatequity outflows are very unlikely to be a major cause of BOPproblems (unlike short-term debt). The impact of fiscal profligacyon the external account has become indirect and circuitous withimplementation of external sector reforms. It operates much morethrough the general expectations about economic (growth) pros-pects and the risk premium demanded by foreign (and domestic)investors and lenders. Thus its negative effects are likely to befocussed on the domestic rather than the external account. In otherwords, the negative long-term effects of fiscal profligacy are morelikely to be felt in future on the growth rate of the economy andthe (health of the) domestic financial sector.
NotesNotesNotesNotesNotes[Any views expressed in this paper are those of the author and should notbe attributed to the organisation for which he works. I would like to thankSurjit Bhalla, Roberto Zagha, Suman Bery, Homi Kharas, James Gordon,Sudhir Mulji and Willima Wadhwa for their comments on earlier versionsof the paper. I would also like to thank Jayant Ganguly for his help in editingthis version of the paper.]
1 Monetary and credit variables are found to be statistically insignificantwhen included in equation (1). The estimates are virtually unchanged ifthe primary deficit is substituted for the fiscal deficit in (1).
2 If private investment is crowded out (reduced) by government borrowingto finance the fiscal deficit the total (direct plus indirect) impact of thefiscal deficit is less than indicated by this coefficient.
3 It did, however, help subsequently in persuading some sceptics anddispelling some fears.
4 The commerce secretary responsible for introducing ‘Exim Scrips’ movedto the Finance Ministry soon afterwards as the Secretary, Departmentof Economic Affairs (DEA).
5 Internal research papers of the Economic Division, DEA, Ministry ofFinance, see the references in Virmani (2000).
6 Internal research paper of the Economic Division, DEA, Ministry ofFinance, see the references in Virmani (2000)
7 As analysed in the report of the Working Group on BOP for the EighthFive-Year Plan, 1989. A change in the government, however, meant thatthe Working Group was reconstituted and this report was not published.
8 Cumulative dividends remitted out of the country could not exceed thetotal FDI in that company.
9 See Virmani (September 1991b)10 The understanding and belief of the Secretary, DEA and the Minister of
Finance, as well as the political judgment and authority of the latter werecritical to the actual decision. Without these, the paper titled ‘TowardRupee Convertibility: A Free Market Exchange Rate Channel’, wouldundoubtedly have met the same fate as so many other papers and suggestionsdid before June 1991.
11 Internal research paper of the Economic Division, DEA, Ministry ofFinance, see the references in Virmani (2000).
12 Formally a sales tax of 15 per cent would have to be imposed on goldproduced in India.
13 India was well recognised in the nineteenth century as a sink for worldprecious metal production and remained so to some extent till independence.Though the spread of modern banking has increased the ratio of financialinstruments in India’s stock of saving, virtually every household in India,even the poorest, own some gold or silver jewellery. These are oftenpurchased for weddings.
14 This restriction on free import ensured that smuggling would not beeliminated.
15 In contrast to gold India was a net exporter of silver till recent times andwas in near balance at the beginning of the nineties.
16 Internal paper of the Economic Division, DEA, Ministry of Finance, seethe references in Virmani (2000).
17 See for instance Virmani (1998). I should add that the IMF’s India division/Asia department staff endorsed the strategy after it was implemented.They also helped us collect the literature on the capital inflow experienceof other countries that we needed urgently.
� �
Economic and Political Weekly August 9, 20033390
18 This is also consistent with the elasticity measured in Virmani (1991a).The paper will be updated using data from the nineties to see thequantitative significance.
19 Virmani (1991a) showed that neither oil export nor oil import functionscould be estimated because these were not market-determined in the periodof estimation.
20 The average duration of stay at Agra is less than one day because thereis no tourist-oriented entertainment in Agra.
21 The estimated equation (2) isCAD = 0.001 + 0.685 FDc – 0.766 FDc(92+) + 0.072 Greer + 0.247 DIpvt,where FDc(92+) is the dummy variable. All slope coefficients remainhighly significant while adjusted R2 increases to 0.58.
22 See, for instance, Virmani (1999).23 Internal research paper of the Economic Division, DEA, Ministry of
Finance, see the references in Virmani (2000)24 This paper was later presented at a seminar organised by the Asian
Development Bank (ADB) and the World Bank in March 1998 (Virmani1998).
25 Internal research paper of the Economic Division, DEA, Ministry ofFinance, see the references in Virmani (2000)
26 Appendix tables, suffixed by A or B, are not included here but are availablewith the author.
27 ECB has, however, declined because of demand factors. Total privatedemand for credit has fallen because of weak industrial demand, whiledemand for external credit has fallen even more because of the rise inworld interest rates relative to domestic rates.
28 Appendix table 7A.29 Appendix table 7A.30 China, South Korea, and Thailand, which have both higher FDI and
equity flows than India, had lower spreads than India during thenineties.
ReferencesReferencesReferencesReferencesReferencesAhluwalia, Isher Judge (1991): ‘Productivity and Growth in Indian
Manufacturing’, Oxford University Press, Oxford and New York.
Bhagwati, Jagdesh and T N Srinivasan (1975): Foreign Trade Regimes andEconomic Development: India, National Bureau of Economic Research,New York, Columbia University Press.
Ghosh, Arun (1991): ‘Eighth Plan: Challenges and Possibilities IV –Balance of Payments’, Economic and Political Weekly, Vol XXVI, No 6,February 9.
Ghosh, Jayati (1990): ‘Exchange Rates and Trade Balance: Some Aspectsof Recent Indian Experience’, Economic and Political Weekly, Vol XXV,No 9, March 3.
Ministry of Finance, Department of Revenue, Government of India (1991):‘Tax Reform Committee: Interim Report’, New Delhi.
– (1993): ‘Tax Reform Committee: Final Report Part II’, New Delhi.Nayyar, Deepak (1976): ‘India’s Exports and Export Policies in the Sixties’,
Cambridge Universtiy Press, Cambridge.Singh, Manmohan (1964): India’s Export Trends and the Prospects for Self-
sustained Growth, Oxford, Clarendon Press.Virmani, Arvind (1989): ‘Growth, Capital and Employment: Performance
in Perspective’, Economic Research Paper No 3, February, PlanningCommission (processed).
– (1991a): ‘Demand and Supply Factors in India’s Trade’, Economic andPolitical Weekly, Vol XXVI, No 6, February 9.
– (1991b): ‘Trade Policy Reform: De-Licensing, Tariff Reform and ExchangeRates’, Development Policy Research, Planning Commission, New Delhi,September.
– (1998): ‘Macro-Management of Economic Growth with UnderemployedLabour and Technological Inertia’, ADB-World Bank Senior PolicySeminar on Managing Global Financial Integration in Asia, Manila,Philippines, March 10-12.
– (1999): ‘From Poverty to Middle Income: Reforms for AcceleratingGrowth in the 21st Century’, Chintan, April; ‘Urban Infrastructure, RealEstate and Housing Policy: Eliminating Slums and GeneratingEmployment’, Chintan Policy Paper No 8, May. Expanded versionreissued in December 1999.
– (2000): ‘India’s 1990-91 Crisis: Myths, Reforms and Paradoxes’, WorkingPaper No 4, Planning Commission (processed).
World Bank (2000): Finance for Growth, Oxford University Press.