Page 1
India’s Growing Trade Relationship within South Asia: Reflections from Trends of the Recent Past
Madhav Grover & Shivani Agarwal
SADF WORKING PAPER 17 September 2019 Issue n° 13 ISSN 2506-8202
Avenue des Arts 19 1210 Brussels [email protected] www.sadf.eu
Abstract:
India is a crucial player in South Asia; its trade with neighbouring
countries is the major driver of growth in the region. The study
examines the role of India in expanding trade relations within the
South Asian region. The goal of this study is to investigate how
India’s individual relations with other countries of the South Asian
Association for Regional Cooperation can enhance growth of the
region. The focus is on exports, imports, trade balance, and major
goods exchanged between India and individual countries, based on
the latest data (2013-19). The study then analyses the hurdles that
India faces in expanding trade. The discussion further dwells into
potential areas wherein opportunities can be created to enhance the
trade. The study concludes with a comparison between the South
Asian Free Trade Agreement (SAFTA) and the ASEAN Free Trade
Agreement (AFTA), focusing on how the former can draw lessons
from the latter.
Keywords: SAARC, India, Trade, ASEAN, challenges, SAFTA,
AFTA, exports, imports, regional integration.
Madhav Grover is a Research Assistant, Centre for New Economics Studies in the O.P. Jindal Global University [email protected] Shivani Agarwal is a Research Analyst, Centre for New Economics Studies in the O.P. Jindal Global University [email protected] Research Field: Economics
Page 2
_______________________
SADF Working Paper N. 13
2
1. Introduction
From the world’s early explorers to 21st century geopolitics, South Asia1 has always been a
significant part of the world’s activities. With a population of 1,914,870,576 (The World Bank,
2019), it is home to 24.81% (The World Bank, 2019) of the world’s population. Not only
demography but also history, politics, economy, culture and geography make it a significant
region of the world. It continues to hold the top spot as the world's fastest-growing region -
with growth set to 7.0 per cent in 2019, and estimated to 7.1 per cent in 2020 and 2021 (The
World Bank, 2019).
The World Bank reported that ‘South Asia has regained its lead as the fastest growing region
in the world, supported by recovery in India’ (The World Bank , 2018). India's trade in goods
with South Asian countries accounts for $19 billion, potentially reaching $62 billion soon (The
World Bank , 2018). India is geographically located as the epicentre of trade between the
various South Asian Association Regional Cooperation (SAARC) countries. It holds immense
influence in the region due to its political, economic and military relevance. Shared land or sea
borders, dependence as regards connectivity, huge trade quantum, and close political
affiliations make India an indispensable player in the region.
SAARC was founded in Dhaka, Bangladesh in 1985 and is headquartered in Kathmandu. It
was created to promote economic and regional integration. The combined Gross Domestic
Product (GDP Nominal) of these regional economies is US$ 3.586 trillion; a population of
about 1.891 billion is involved (The World Bank, 2019). The share of the SAARC region in
Global GDP also increased from 3.2% in 2013 to 3.7% in 2018. India is the largest economy
in SAARC and the largest trading partner of both Nepal, Bhutan and Sri Lanka. It contributes
with roughly 75%-80% of SAARC region’s GDP (and is followed by Pakistan and
Bangladesh).
1 Countries: India, Bangladesh, Bhutan, Nepal, Sri Lanka, Maldives, Pakistan and Afghanistan
Page 3
_______________________
SADF Working Paper N. 13
3
The region presents varying levels of openness as regards to trade. The smaller economies of
Bhutan and Maldives are more open in terms of trade than larger economies such as India and
Pakistan.
This study consists of a study on external trade relations between India and the various SAARC
nations (namely Afghanistan, Bangladesh, Bhutan, the Maldives, Nepal, Pakistan, and Sri
Lanka). The study examines questions such as:
• What is India’s role in trade with its neighbours?
• What role can India play in maximising trade potentials among SAARC nations?
• What are the challenges in and solutions for enhancing trade integration in the region?
• What can SAARC learn for ASEAN in terms of improving trade and India’s role in
said trade?
Part I of the study provides a basic understanding of SAARC as an organisation and of India’s
crucial role in it. Part II builds context as regards the quantity and quality of trade India
entertains with individual SAARC nations so as to underline the crucial role played by India in
the region. There is an analysis of trade trends over the years (2013-19) as regards exports,
imports, trade balance, and major goods exchanged between India and several individual
countries. Part III addresses various key challenges faced by SAARC and the options present
to develop potential trade opportunities. An insight is undertaken into the industries or products
which offer good opportunities to enhance economic ties. Part IV includes an analysis of the
free trade agreement itself and concerns involving the same – namely through a comparison
with its counterpart in South East Asia.
2. Trading relations (EXIM Bank, 2014)
This section delves into India’s trade relations within South Asia to underline the crucial role
India plays in the region. The section elaborates on both the quality and quantity of trade
between India and various countries based on the latest available data.
Page 4
_______________________
SADF Working Paper N. 13
4
SAARC’s trade is undertaken along the lines laid by the South Asian Free Trade Agreement
(SAFTA) (signed in 2004). However, over the years intra-regional trade between these
countries’ only accounts for 5% of the region’s total formal trade (The World Bank, 2018). The
south Asian region has made some progress over the years as regards its integration within the
global economy – however, not as regards international integration within the region itself.
Trading patterns show that while Bhutan and Nepal traded mostly with other SAARC nations,
India, Bangladesh, Pakistan, the Maldives and Afghanistan mostly traded outside SAARC (The
World Bank, 2018). Some countries within SAARC engage in much more trade with Western
nations than with closer, regional partners. Several amongst these countries export very little
and largely only to larger economies such as India; this is especially the case in Nepal and
Bhutan. There are also problems related to informal trade, underdeveloped transit and
transportation facilities, and others which will be looked upon in later sections of the study.
Trading patterns also show that total trade between India and SAARC countries has
consistently increased from 2013-14 to 2018-19 - as shown in Table 1. India's trade commodity
basket to/from South Asia is extensive, with various commodities both exported and imported.
India's exports in 2018-19 largely consisted of engineering products such as transportation,
metals and machinery, textiles, mineral and agricultural products. Other major exports include
coffee, tea, sugar, animal feed, vegetable fruits, nuts and cereals. Total exports from India to
the region were worth US$ 25,348.82 million in 2018-19 - an increase in 9.73% from the year
before yet representing only 7.681% of India’s total exports. India's imports consisted of
agricultural products, textiles, and engineering products - namely ships, boats and floating
structures; fruits and nuts, clothing articles, mineral fuels, iron and steel and coffee and tea in
the same year. Other major imports include plastics, rubber products, chemical products,
vehicles, and wood products (Ministry of Commerce, 2017). India’s total imports from the
region were worth US$ 4,363.02 million - an increase in 36.23% from the year before yet
representing only 1.3218% of India’s total imports.
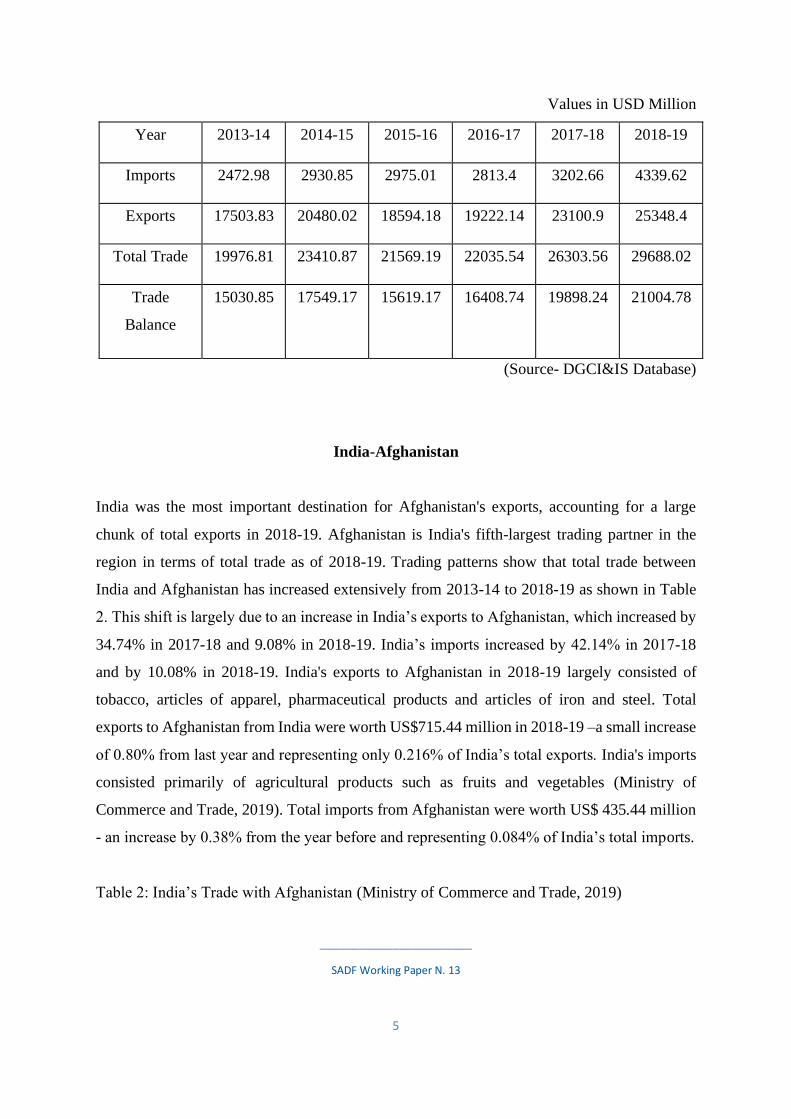
Table 1: India’s Trade with South Asia (Ministry of Commerce and Trade, 2019)
Page 5
_______________________
SADF Working Paper N. 13
5
Values in USD Million
Year 2013-14 2014-15 2015-16 2016-17 2017-18 2018-19
Imports 2472.98 2930.85 2975.01 2813.4 3202.66 4339.62
Exports 17503.83 20480.02 18594.18 19222.14 23100.9 25348.4
Total Trade 19976.81 23410.87 21569.19 22035.54 26303.56 29688.02
Trade
Balance
15030.85 17549.17 15619.17 16408.74 19898.24 21004.78
(Source- DGCI&IS Database)
India-Afghanistan
India was the most important destination for Afghanistan's exports, accounting for a large
chunk of total exports in 2018-19. Afghanistan is India's fifth-largest trading partner in the
region in terms of total trade as of 2018-19. Trading patterns show that total trade between
India and Afghanistan has increased extensively from 2013-14 to 2018-19 as shown in Table
2. This shift is largely due to an increase in India’s exports to Afghanistan, which increased by
34.74% in 2017-18 and 9.08% in 2018-19. India’s imports increased by 42.14% in 2017-18
and by 10.08% in 2018-19. India's exports to Afghanistan in 2018-19 largely consisted of
tobacco, articles of apparel, pharmaceutical products and articles of iron and steel. Total
exports to Afghanistan from India were worth US$715.44 million in 2018-19 –a small increase
of 0.80% from last year and representing only 0.216% of India’s total exports. India's imports
consisted primarily of agricultural products such as fruits and vegetables (Ministry of
Commerce and Trade, 2019). Total imports from Afghanistan were worth US$ 435.44 million
- an increase by 0.38% from the year before and representing 0.084% of India’s total imports.
Table 2: India’s Trade with Afghanistan (Ministry of Commerce and Trade, 2019)
Page 6
_______________________
SADF Working Paper N. 13
6
Values in USD Million
Year 2013-14 2014-15 2015-16 2016-17 2017-18 2018-19
Imports 208.77 261.91 307.90 292.90 433.78 435.44
Exports 474.33 422.56 526.60 506.34 709.75 714.44
Total Trade 683.11 684.47 834.50 799.24 1143.53 1150.89
Trade
Balance
265.57 160.65 218.70 213.44 275.97 280.00
(Source- DGCI&S Database)
India-Nepal
The total trade between India and Nepal has increased extensively from 2016-17 to 2018-19 as
shown in Table 3. This shift is largely due to an increase in India’s exports to Nepal-21.26% in
2017-18 and 17.40% in 2018-19. India’s imports decreased by 1.52% in 2017-18 and increased
by 14.86% in 2018-19. India’s exports to Nepal in 2018-19 largely consisted of mineral fuels,
iron and steel, vehicles other than railways, nuclear reactors, broilers, and plastic articles. Total
exports to Nepal from India were worth US$ 7,766.20 million in 2018-19, an increase of
17.44% from the year before yet representing only 2.35% of India’s total exports.
India’s imports from Nepal in the same year largely consisted of prepared foods and beverages,
spices, minerals and textiles (Ministry of Commerce and Trade, 2019). The total imports from
Nepal by India were worth US$ 508.14 million - an increase by 10.42% from the year before
yet representing only 0.098% of India’s total imports.
Table 3: India’s Trade with Nepal (Ministry of Commerce and Trade, 2019)
Values in USD Million
Page 7
_______________________
SADF Working Paper N. 13
7
(Source- DGCI&SDatabase)
India-Bhutan
Bhutan was India’s 6th largest trading partner in the region in the year 2018-19 as per total
trade. Trading patterns show that total trade between India and Bhutan increased from 2016-
17 to 2017-18 but then slightly decreased 2018-19, as shown in Table 4. This shift is largely
due to an increase in India’s exports to Bhutan - 7.23% in 2017-18 and 20.36% in 2018-19 -
while India’s imports increased by 22.80% in 2017-18 but declined by 2.24% in 2018-19.
India’s exports to Bhutan in 2018-19 largely consisted of iron and steel, mineral fuels, salts,
inorganic chemicals, vehicles other than railways and plastics. Total exports from India to
Bhutan were worth US$ 657.33 million in 2018-19 - an increase of 20.36% from the year
before yet representing only 0.191% of India’s total exports.
India’s imports from Bhutan in the same year largely consisted of iron and steel, mineral
fuels, salts, chemical compounds and electricity – this was due to various hydropower projects
in the country supplying renewable energy (Ministry of Commerce and Trade, 2019). Total
Year 2013-14 2014-15 2015-16 2016-17 2017-18 2018-19
Imports 529.93 639.91 470.59 445.15 438.38 503.51
Exports 3592.30 4558.77 3902.70 5453.59 6612.96 7763.60
Total Trade 4122.23 5198.68 4373.29 5898.72 7051.34 8267.11
Trade
Balance
3062.37 3918.86 3432.12 5008.46 6174.57 7260.09
Page 8
_______________________
SADF Working Paper N. 13
8
imports from Bhutan by India were worth US$ 370.96 million – a decrease by 1.86% from the
year before and representing 0.072% of India’s total imports.
Table 4: India’s Trade with Bhutan (Ministry of Commerce and Trade, 2019)
Values in USD Million
Year 2013-14 2014-15 2015-16 2016-17 2017-18 2018-19
Imports 152.17 149.87 281.17 307.82 377.79 369.53
Exports 355.60 333.94 468.95 509.30 546.12 657.33
Total Trade 507.77 483.81 750.22 817.10 924.11 1026.86
Trade
Balance
203.43 184.08 187.68 201.46 168.13 287.80
(Source- DGCI&S Database)
India-Bangladesh
Bangladesh was India’s largest trading partner as per total trade in 2018-19, as shown in Table
5. This shift is largely due to an increase in India's exports to Bangladesh – these increased
26.31% in 2017-18 and 6.96% in 2018-19 -and to India's imports declining by 2.29% in 2017-
18, then increasing extensively by 52.12% in 2018-19. India's exports to Bangladesh in 2018-
19 largely consisted of cotton, vehicles, mineral fuels, nuclear reactors, broilers, machinery,
cereals, plastics and iron and steel. Total exports from India to Bangladesh were worth US$
9.210.06 million in 2018-19 - an increase by 6.92% from the year before yet representing only
2.79% of India’s total exports.
India's imports in the same year consisted primarily of textiles, engineering products and
mineral products (Ministry of Commerce and Trade, 2019). Total imports by India from
Page 9
_______________________
SADF Working Paper N. 13
9
Bangladesh were worth US$ 1,044.80 million - an increase by 52.38% from the year before
and representing 0.203% of India’s total imports.
Table 5: India’s Trade with Bangladesh (Ministry of Commerce and Trade, 2019)
Values in USD Million
Year 2013-14 2014-15 2015-16 2016-17 2017-18 2018-19
Imports 484.34 621.37 725.15 701.68 685.65 1043.03
Exports 6166.48 6451.47 6034.94 6820.11 8614.35 9214.22
Total Trade 6651.31 7027.84 6726.04 7521.79 9299.99 10257.25
Trade
Balance
5682.63 5830.10 5307.79 6118.42 7928.70 8171.19
(Source- DGCI&S Database)
India-the Maldives
The Maldives was India’s smallest trading partner in 2018-19 as per total trade. However,
trading patterns reveal that total trade has extensively increased from 2016-17 to 2018-19, as
shown in table 6. This shift is largely due to an increase in India's exports increasing 9.71% in
2017-18 and 2.65% in 2018-19 and India's imports declining by 38.14% in 2017-18 and then
increasing extensively by 259.58% in 2018-19. India's exports to the Maldives in 2018-19
majorly consisted of salts, sulphur, pharmaceuticals, plastics, electric machinery and cereals.
Total exports from India were worth US$ 223.02 million in 2018-19 - an increase by 2.77%
from the year before yet representing only 0.067% of India’s total exports.
Page 10
_______________________
SADF Working Paper N. 13
10
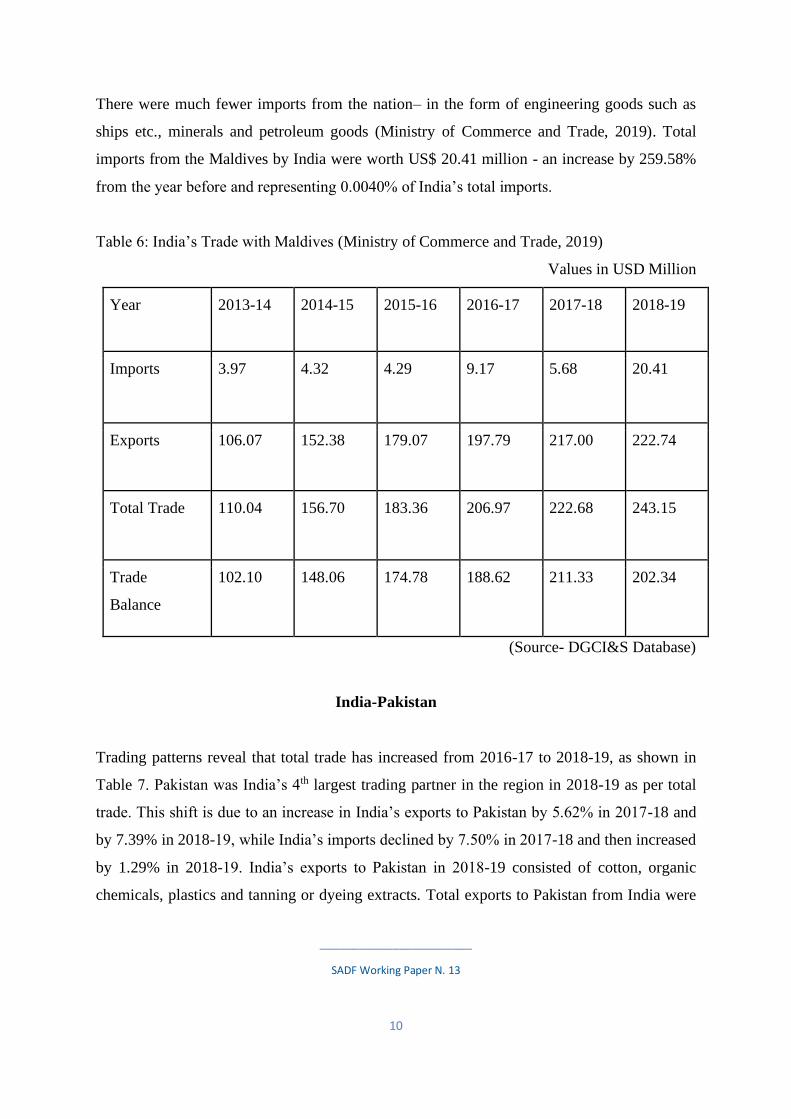
There were much fewer imports from the nation– in the form of engineering goods such as
ships etc., minerals and petroleum goods (Ministry of Commerce and Trade, 2019). Total
imports from the Maldives by India were worth US$ 20.41 million - an increase by 259.58%
from the year before and representing 0.0040% of India’s total imports.
Table 6: India’s Trade with Maldives (Ministry of Commerce and Trade, 2019)
Values in USD Million
Year 2013-14 2014-15 2015-16 2016-17 2017-18 2018-19
Imports 3.97 4.32 4.29 9.17 5.68 20.41
Exports 106.07 152.38 179.07 197.79 217.00 222.74
Total Trade 110.04 156.70 183.36 206.97 222.68 243.15
Trade
Balance
102.10 148.06 174.78 188.62 211.33 202.34
(Source- DGCI&S Database)
India-Pakistan
Trading patterns reveal that total trade has increased from 2016-17 to 2018-19, as shown in
Table 7. Pakistan was India’s 4th largest trading partner in the region in 2018-19 as per total
trade. This shift is due to an increase in India’s exports to Pakistan by 5.62% in 2017-18 and
by 7.39% in 2018-19, while India’s imports declined by 7.50% in 2017-18 and then increased
by 1.29% in 2018-19. India’s exports to Pakistan in 2018-19 consisted of cotton, organic
chemicals, plastics and tanning or dyeing extracts. Total exports to Pakistan from India were
Page 11
_______________________
SADF Working Paper N. 13
11
worth US$ 2,066.56 million in 2018-19 - an increase by 7.39% from the year before yet
representing only 0.626% of India’s total exports.
India’s imports from Pakistan included minerals, food products such as vegetables, salts, ores,
and slag and ash (Ministry of Commerce and Trade, 2019). Total imports from Pakistan by
India were worth US$ 494.87 million - an increase by 1.29% from the year before and
representing 0.096% of India’s total imports.
Table 7: India’s Trade with Pakistan (Ministry of Commerce and Trade, 2019)
Values in USD Million
Year 2013-14 2014-15 2015-16 2016-17 2017-18 2018-19
Imports 426.88 497.31 441.03 454.49 488.56 494.87
Exports 2064.89 1857.18 2171.17 1821.87 1924.28 2066.56
Total Trade 2701.18 2354.49 2612.20 2276.36 2412.83 2561.44
Trade
Balance
1847.42 1359.87 1730.15 1367.38 1435.72 1571.69
(Source- DGCI&S Database)
India-Sri Lanka
Trading patterns reveal that total trade between India and Sri Lanka has increased extensively
from 2017-18 to 2018-19, as shown in Table 8. This shift is largely due to an increase in India’s
exports to Sri Lanka by 14.40% in 2017-18 and 5.18% in 2018-19, while India’s imports
increased by 21.13% in 2017-18 and 10.41% in 2018-19. India’s exports to Sri Lanka in 2018-
19 largely consisted of engineering goods, minerals and plastics.
The total exports from India were worth US$ 4,710.21 million in 2018-19 - an increase by
5.22% from the year before yet representing only 1.42% of India’s total exports.
Page 12
_______________________
SADF Working Paper N. 13
12
India’s imports consisted primarily of food articles, vegetables, ships, boats etc., coffee, teas
and animal fodder (Ministry of Commerce and Trade, 2019). Total imports by India were worth
US$ 1,488.40 million - an increase by 92.64% from last year and representing 0.289% of
India’s total imports.
Table 8: India’s Trade with Sri Lanka (Ministry of Commerce and Trade, 2019)
Values in USD Million
Year 2013-14 2014-15 2015-16 2016-17 2017-18 2018-19
Imports 666.93 756.17 742.79 602.20 772.63 1472.83
Exports 4534.35 6703.72 5301.75 3913.15 4476.46 4708.50
Total Trade 5201.28 7459.89 6053.54 4515.35 5249.09 6181.33
Trade
Balance
3867.42 5947.55 4567.96 3310.95 3703.83 3235.67
(Source- DGCI&S Database)
Additional Information Box (Ministry of Commerce and Trade, 2019) (Chaturvedi, 2015)
(Kathuria, 2018)23:
2The Chabahar port is located in the Chabahar region in southern Iran, on the Gulf of Oman. The port is jointly operated by Iran and India and is Iran's only oceanic port. It is a major project for both India, Iran and Afghanistan as it helps with greater connectivity between India, Afghanistan and the rest of central Asia. 3The Indian Check Post Petropole is located 80 km from Kolkata in West Bengal near India-Bangladesh Border.
It is a state-of-the-art terminal building for cargo and passenger clearance.
Page 13
_______________________
SADF Working Paper N. 13
13
Connectivity between the two countries is the key mover of trade relations. Within South Asia as a whole,
connectivity remains a major concern for trade relations. India’s geographical extent makes it an
indispensable part of all trade routes and connectivity in general.
Trade routes include land, air and sea routes. Trade to Afghanistan primarily occurs through sea routes
involving other south Asian countries. Indian exports to the country are primarily transported through sea
and air due to the countries not sharing a land border - the only land route being through Pakistan.
Most imports from the nation were carried out by land routes, but there has been an increase in both sea
and air routes due to development of infrastructure. Afghanistan is the only country which doesn’t share
a land border with India and thus depends upon a third nation to carry out trade activities with that
nation. India and Afghanistan even signed a trilateral agreement with Iran, known as the Chabahar Port
project, to sustain a viable trade-transport corridor.
Bangladesh also has major trade outputs in the South-Asian region. Bangladesh majorly transports its
goods through land and sea. Most of its exports are transported through land via trucks and trains.
Imports to India also occurred majorly through land, followed by sea and air routes. The ICP Petropole
project is a landmark move by both countries intended to enhance trade through land via West Bengal in
India, expanding both imports and exports between the two nations.
Bhutan is a landlocked nation sharing most of its borders with India and trading mostly with that country.
Almost all Bhutan's trade occurs through its land border with India. The majority of Bhutan's imports is
routed through Jaigon’s LCS. The Maldives is an island nation; therefore, trade here only occurs through
sea and air routes. Most of the nation's trade occurs through sea routes and involves various SAARC
nations.
Nepal is a landlocked country trading mostly with India through land routes. Almost all of Nepal’s imports
and exports are routed via India towards other SAARC nations. Major ports for imports and exports
between India and Nepal are Raxaul, Nautanwa, Panitanki, Jogbani and Nepalgunj. Raxaul, Bihar in India
is the largest among these; it accounted in 2016-17 for 45% of total exports and 44% of total imports.
Pakistan routes its trade through all channels - land, sea and air routes. Trade through sea route in the
SAARC region is at present expanding. There have been disruptions in trade through the land route due
to tensions with neighbouring India. Yet trade is still predominantly carried out through land via the Attari-
Wagah border, followed by air and sea routes. Pakistan only allows the import of 138 items from India
through the Attari- Wagah route, making trade difficult1.
Sri Lanka is an island-nation, and trade occurs predominantly through sea and air routes. The majority of
India- Sri Lanka occurred via sea routes joining major ports in both countries. NhavaSeva, Sikka, Chennai,
Tuticorin and Mumbai are major ports of exports to Sri Lanka from India and Chennai, NhavaSeva,
Tuticorin and BrandixSEZ are main ports for imports.
Page 14
_______________________
SADF Working Paper N. 13
14
3.1 Challenges
There are various challenges hindering economic exchanges within the region. The growth of
Intra-SAARC trade has been facing challenges concerning increasing trade costs, restrictive
custom procedures, administrative and technical barriers, informal trade, supply constraints,
poor trade infrastructure and connectivity, and low level of trade finance and information.
The biggest challenge facing SAARC is high and increasing costs of trade between countries.
Very high transaction costs are caused by outdated and insufficient border procedures,
inadequate infrastructure, lack of reliable logistical services and absence of regional transport
and transit agreements. There has been progress in the ease of doing business but South Asia
still ranks high. There has been a consistent worsening of the situation in several countries
including Bangladesh, Nepal, Bhutan and Afghanistan. There is also a lack of competitiveness
involved (Giri, 2015).
Figure 1 (Kathuria, 2018): Average Intraregional and Interregional Trade Costs, 2010-15
Poor intra-regional connectivity and poor infrastructure are big issues which have made
the cost of trading across borders one of the highest in the world. The average level of trade
costs is 20 percent higher between country pairs in South Asia than between country pairs in
East Asia. It currently costs more to trade between some countries in South Asia than between
Page 15
_______________________
SADF Working Paper N. 13
15
these countries and, say, Brazil (Kathuria, 2018). Inadequate intra-regional transportation
networks of road, rail, air and waterways resulted in high trade costs in the SAARC region. For
landlocked countries such as Nepal, Bhutan, and Afghanistan, these costs are much higher.
India has played a significant role in connecting South Asian countries but has to increase its
scope and finish existing projects and also get new ones to overcome this challenge (Giri,
2015).
Despite trade liberalisation under the SAFTA, tariff barriers have reappeared in the form of
protectionist para tariffs. These are not under the purview of the phase out provisions of
SAFTA. Bangladesh, Pakistan, and Sri Lanka have high para-tariffs. In South Asia, protection
is greater in the case of imports from within the South Asia region than from the rest of the
world, as reflected in the overall trade restrictiveness index4 (Kathuria, 2018)/ Almost 35
percent of the value of intraregional trade in South Asia is subject to sensitive list tariffs; about
44 percent–45 percent of the imports from other SAFTA members fall under sensitive lists in
Bangladesh and Sri Lanka; over 39 percent of India’s exports to the region fall under the
sensitive lists of various partners (Kathuria, 2018). SAFTA does not provide a clear guideline
for phasing out these sensitive lists.
Box 1:
Non-Tariff Measures have quite often turned into non-tariff barriers as legitimate transactions
very burdensome to achieve. These have proven to be a strong restriction in access to markets.
For example, if border testing of imports takes inordinate amounts of time, it will become a
hurdle to seamless trade transactions and add to trade costs. For example (Kathuria, 2018),
4This index measures the uniform tariff equivalent of a country’s tariff and nontariff barriers that would generate
the same level of import value for the country in a given year.
The Sensitive List for Least Developing Countries is given under SAFTA. The list consists of all
trading items which are regarded as sensitive to the domestic industries of each nation. The
products listed in the sensitive list are protected from tariff reduction rules
Page 16
_______________________
SADF Working Paper N. 13
16
Pakistan only allows 138 items to be imported from India over the Attari–Wagah land route -
the only land port between the two countries despite their long, shared land border. This means
that bilateral trade is dominated by trade along sea routes, which is not necessarily the most
cost-effective for two countries. Bangladesh and India also impose some restrictions on imports
from each other at certain ports.
Another major challenge for regional trade is the predominance of informal trade5. The scope
of informal trade in the region exceeds or is at least comparable to that of formal flows in a lot
of areas. India is the largest and most centrally located country in the region, making it the
centre for all informal trade within SAARC. Informal trade also occurs through channels
involving third countries such as the UAE, Singapore, Malaysia etc. so as to obviate trade
restrictions. According to UNESCAP6, informal trade between SAARC and India amounts to
around $12 billion (2012)7. The main items of export from India through informal trade are
textiles (for Pakistan, Bhutan, Sri Lanka), live animals (for Myanmar), medicines and
cosmetics. The products are impacted by each country’s sensitive list. Textile, cigarettes,
liquor, and electronic items have been the main items of informal import into India. The factors
prompting informal trade are quick realisation of payment, absence of paperwork, and lack of
procedural delays (Taneja & Saini, n.d.). Strong ethnic ties, inadequate transport systems and
high transport costs have also led to informal trade between countries.
The effect of trade liberalisation and facilitation has been constrained by poor supply
capacities, especially in the low-development group of member countries. Specific attention
has been lacking as regards productive capacity-building and trade-related infrastructure,
which are essential for growth, structural transformation, creation of employment, and
enhancing intra-regional trade (Taneja & Saini, n.d.).
5Trade between two countries that should be included in the national income statistics but is not. 6United Nations Economic and Social Commission for Asia and the Pacific. (n.d.) Retrieved from
https://www.unescap.org
7United Nations Economics and Social Commission for Asia and the Pacific. (n.d.) Retrieved from
https://www.unescap.org
Page 17
_______________________
SADF Working Paper N. 13
17
Trade Financing Issues: sourcing trade finance for SAARC nations has been a major
impediment in magnifying trade outcomes. There is a need for establishing institutions focused
on SAARC nations so as to provide finance, credit and guarantee for cross-border trade among
these countries (Taneja & Saini, n.d.).
Box 2:
Dissemination of Information: There is a lack of trade information networks which
discourages trade opportunities. Manufacturers, traders, and financers all need to be informed
about the various policies, measures and restrictions involved in trading. Likewise, potential
areas of trade need to be emphasised by governments so as to encourage concerned
stakeholders in the private sector to grasp opportunities (Taneja & Saini, n.d.).
3.2 The road ahead
Trade relations between these countries can be immensely magnified. The extent of informal
trade points towards an immense potential market. The demands of each country vary and
require specific attention and research.
Trade potential: There should be a renewed focus on enhancing trade levels of identified
potential goods. Intra-regional SAARC trade needs to increase in relation to this region’s trade
with the world at large. A report from the Exim bank estimated that if all the identified
commodities are traded among SAARC members then full potential trade will increase by 33%
(EXIM Bank, 2014).
Role of the SDF: The SAARC Development Fund can be instrumental in enhancing trade within the
region. The funding of necessary large-scale infrastructure projects cannot be undertaken by
governments due to lack of fiscal space and resources. Existing projects are largely funded by PSUs
and Multilateral organisations such as the World Bank and ADB. The idea of SDF is intended to curb
the demand for private capital within SAARC and thus enhance trade.
Page 18
_______________________
SADF Working Paper N. 13
18
Afghanistan has the potential to increase exports of sesame seeds to India and to the SAARC
region. Afghanistan's capacity to export the product is more than the region's capacity to
import, which can drive down prices. India is the chief importer of the product in the region,
accounting for 92% of total imports. It mainly imports from Somalia, Pakistan and the UAE
and the commodity is not featured in India's sensitive list of LDCs. India has also been
refraining from sustaining trade with Pakistan; Afghanistan can thus expect enhanced
opportunities to trade with India through the SAFTA. Afghanistan can also potentially increase
its exports of cumin seeds to Sri Lanka, Bangladesh and Nepal, all of which are chief importers
of this product (EXIM Bank, 2014).
Nepal has the potential to increase trade in the SAARC region by enhancing exports and
bridging the trade deficit. Nepal can particularly look upon increasing export of carpets and
textile floor coverings to the SAARC region. Currently, imports from Nepal account for less
than 1% of the region’s global imports of this commodity; exports are also at present negligible.
Pakistan and India are major importers of the commodity - Pakistan imports mostly from the
USA and China, while India imports from Indonesia, the USA and China. Nepal has
preferential access to both these countries under the SAFTA and the commodity is not added
in the sensitive list of either country. Nepal can also enhance its export of paintings, drawings,
and art pieces to the SAARC region. Currently, imports from Nepal account for 0.5% of
SAARC's total imports of these commodities. India is the largest importer within SAARC and
mainly imports from the USA, Germany and China. Nepal has preferential access into Indian
markets and a geographical advantage for enhancing trade (EXIM Bank, 2014).
Bangladesh has tremendous potential for increasing two-way trade within the SAARC region.
Bangladesh can increase trade of bicycles across the region as it is already the area’s largest
exporter of the commodity, mainly exporting to the UK, Germany and Belgium. India is the
largest importer of the commodity in the region, mainly importing from China, Sri Lanka,
Taiwan and Brazil. Bangladesh can get preferential access to the Indian market under the
SAFTA- and the commodity is not featured on India's Sensitive List for LDCs. Bangladesh can
also increase exports of Rawhide and skins of bovine or equine animals to India and
Page 19
_______________________
SADF Working Paper N. 13
19
Pakistan. India is the largest importer of the product in the region and imports mainly from
Italy, Argentina, Thailand, Indonesia, and China (all carrying tariffs on trade). Bangladesh is
in turn a major exporter of the commodity, exporting to China, Italy and Thailand. Bangladesh
can look upon increasing trade of the commodity to several countries under the SAFTA’s
preferential status. Bangladesh can also look upon exporting footwear to India, which is a large
importer of the commodity in the region (EXIM Bank, 2014).
The Maldives has a trade potential to increase trade of tuna fish in the region with all SAARC
members under SAFTA’s preferential access to markets (EXIM Bank, 2014).
Pakistan has potential trade opportunities to increase exports and decrease the trade deficit.
Pakistan can increase exports of pearls, precious stones and metals to the region as India and
Bangladesh are both major importers of the commodity. India sources its imports from the
UAE, Hong Kong and Thailand and Bangladesh sources them from Singapore and India.
Pakistan can access this commodity market to increase its trade. Pakistan can also increase its
exports of sugar and refined sugar products to Sri Lanka and Bangladesh, although both
countries also feature the commodity in their respective sensitive lists (EXIM Bank, 2014).
Sri Lanka has tremendous trade opportunities in the SAARC region. The country is a middle-
income economy, and to reduce its trade deficit in the region it must increase its exports. The
nation is the second-largest exporter of printed books, newspaper, and pictures- only after
India which is the largest in this regard by a significant margin. Sri Lanka can also enhance
trade by increasing exports of festive, carnival and other entertainment art. India is the largest
importer of the commodity in the region and Sri Lanka has a great potential to satisfy this
demand. The commodities are not mentioned in the sensitive list of any SAARC country
(EXIM Bank, 2014).
India has a significant opportunity to increase trade with SAARC countries. The nation has the
potential to increase export of vegetable oils and fats to Bangladesh, which is one of the
largest importers of the commodity in the region. The nation also has the potential to increase
Page 20
_______________________
SADF Working Paper N. 13
20
exports of meat, fish and other seafood in the region. India has preferential access to
Bangladesh under SAFTA (EXIM Bank, 2014)
Box 3 (Sophon, 2018):
Education: Relations built in the education sector enable countries to build long-lasting
cultural associations, reap economic dividends and enable cross-cultural exchanges. India's
existing network of colleges and universities can be an attractive destination for students from
SAARC nations. The barriers regarding language and culture can be addressed through
inclusive policies and curriculums. The institutions in those Indian states closer to neighbouring
nations can become specific targets. These institutions need to encourage visits by academic
professionals from other nations to exchange best teaching practices, training exercises and
diversify dialogues within classrooms.
Energy: There is also a need to substantially improve the power infrastructure of member
states and fix the problem of acute power shortages hindering trade. This can be done by
improving upon Intra-SAARC investment cooperation to develop effective ways to transmit
electricity across borders - somewhat like India's arrangement with Bhutan and Nepal.
In Cambodia, as an illustration, a rise in demand for Indian-manufactured auto-rickshaws- as a
medium for app-based public transport systems -is gradually pushing more Indian auto-
manufacturers to increase their export share. With the use of ‘Pass-App' (as an Uber-style transport
app), there has been an increased demand for Indian auto-rickshaws for transport needs of city
residents across Cambodia, and Indian automobiles are fast replacing the ‘tuk-tuks' or e-rickshaws.
Page 21
_______________________
SADF Working Paper N. 13
21
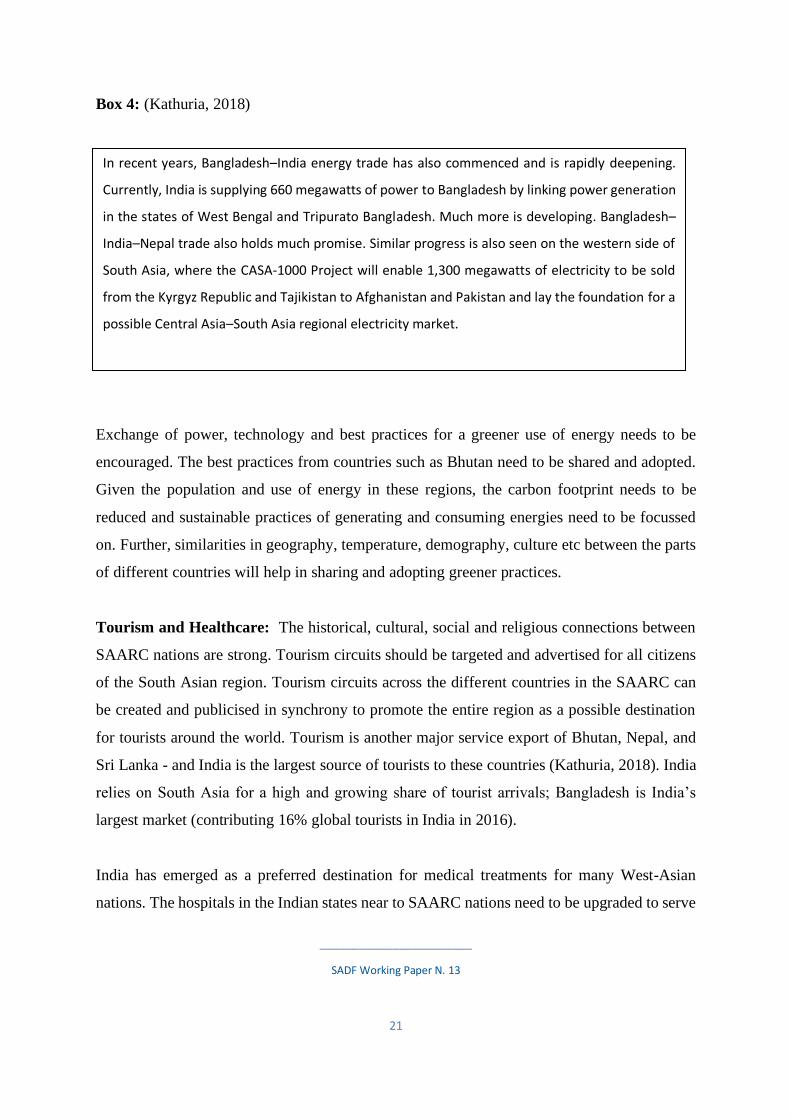
Box 4: (Kathuria, 2018)
Exchange of power, technology and best practices for a greener use of energy needs to be
encouraged. The best practices from countries such as Bhutan need to be shared and adopted.
Given the population and use of energy in these regions, the carbon footprint needs to be
reduced and sustainable practices of generating and consuming energies need to be focussed
on. Further, similarities in geography, temperature, demography, culture etc between the parts
of different countries will help in sharing and adopting greener practices.
Tourism and Healthcare: The historical, cultural, social and religious connections between
SAARC nations are strong. Tourism circuits should be targeted and advertised for all citizens
of the South Asian region. Tourism circuits across the different countries in the SAARC can
be created and publicised in synchrony to promote the entire region as a possible destination
for tourists around the world. Tourism is another major service export of Bhutan, Nepal, and
Sri Lanka - and India is the largest source of tourists to these countries (Kathuria, 2018). India
relies on South Asia for a high and growing share of tourist arrivals; Bangladesh is India’s
largest market (contributing 16% global tourists in India in 2016).
India has emerged as a preferred destination for medical treatments for many West-Asian
nations. The hospitals in the Indian states near to SAARC nations need to be upgraded to serve
In recent years, Bangladesh–India energy trade has also commenced and is rapidly deepening.
Currently, India is supplying 660 megawatts of power to Bangladesh by linking power generation
in the states of West Bengal and Tripurato Bangladesh. Much more is developing. Bangladesh–
India–Nepal trade also holds much promise. Similar progress is also seen on the western side of
South Asia, where the CASA-1000 Project will enable 1,300 megawatts of electricity to be sold
from the Kyrgyz Republic and Tajikistan to Afghanistan and Pakistan and lay the foundation for a
possible Central Asia–South Asia regional electricity market.
Page 22
_______________________
SADF Working Paper N. 13
22
the needs of these countries. Bangladesh alone accounts for the largest number of medical
tourists to India (165,000 patients or 35 percent of estimated total medical tourist arrivals) and
the largest share of medical tourism revenues (US$343 million, more than 50 percent of the
estimated medical tourism revenues) (Kathuria, 2018). Further, medical professionals can
extend their services through the training of professionals in other countries, telemedicine and
teaching in foreign institutions. Tourism is a priority sector for creating new employment and
deepening people to people ties.
Physical and non-physical infrastructure: As connectivity remains one of the key issues to
deal with, significant capital investment and deliberation are needed as regards upgrading
infrastructure. Air connectivity for example is a crucial way of impacting trade relations. The
efficiency of air travel services can impact trade in goods because the transport of high-value,
low-volume goods as well as trade in other services such as tourism, health care, and education
often depend on air travel services. Moreover, the efficiency of air travel for businesspeople
can also affect FDI, and, ultimately, trade in goods and services (Kathuria, 2018). Lessons can
be drawn from the liberalisation of India-Sri Lanka air connectivity.
Box 5: (Kathuria, 2018)
Eliminating information gaps and addressing inadequacies in border infrastructure and
cumbersome procedures can affect a lot of issues related to non-tariff measures. As suggested
From this context emerged the India–Sri Lanka air services liberalisation experience, which has
involved the progressive liberalisation of bilateral air connectivity. Today, Indians and Sri Lankans
enjoy direct connections between Colombo and at least12 Indian cities, with around 147 flights
per week. These multiple connections with India have allowed Sri Lanka to capitalise on the
widespread growth of the Indian middle class. By 2005, India had become the largest source of
foreign tourists in Sri Lanka, and this also played a part in the post–civil war spurt of growth in the
island country.
Page 23
_______________________
SADF Working Paper N. 13
23
by the report of the World Bank’s8 partners, South Asia could consider exploring a nontariff
barrier resolution mechanism to enhance transparency and nudge the official system so as to
settle NTM complaints more quickly. An online mechanism for reporting and monitoring
complaints - hosted by an institution with some monitoring and evaluation capacity - needs to
be installed to provide an easily accessible system.
There needs to be a proper information sharing channel within SAARC’s various stakeholders
in order to enhance potential trade. Governments can initiate information campaigns and
workshops intended to reduce information asymmetry with participation by the private sector.
The report suggests the example of spread awareness about the need for and procedures relating
to pest risk analysis (PRA) on agricultural products, including medicinal and aromatic plants,
to enable imports of such products into India.
Further there is a need to introduce electronic data interchange, risk management systems, and
single windows at more border points to enhance coordination and efficiency. So far, electronic
data interchange is operational only between India and Nepal on one corridor along Kolkata
towards the Nepal border (Jogbani and Raxaul), while coordinated risk management has been
introduced only at the Bangladesh–India border (Petrapole/Benapole) (Kathuria, 2018).
The problem of pervasive informal trade also must be addressed by strengthening existing trade
channels. SAARC countries should move towards improving border trade facilities and also
increase the number of commodities in those facilities so as to formalise/legalise existing trade.
SAARC countries should consider improving custom-related procedures at borders. Transit
rights should be granted to the region’s landlocked nations- i.e. Afghanistan, Nepal and Bhutan
- which would help improve upon trading connectivity. Infrastructure development on the
borders between the countries must be most seriously considered. Further initiatives such as
‘border haat’ between India and Bangladesh, which have proved to be useful, can be expanded.
8Kathuria, S. (2018). A Glass Half Full: The Promise of Regional Trade in South Asia. South Asia Development
Forum. Washington, DC: World Bank.
Page 24
_______________________
SADF Working Paper N. 13
24
Box 6: (Kathuria, 2018)
4.0 The saga of the Free Trade Agreement
It was in 1995 that the South Asian Preferential Trade agreement was signed with the aim of
promoting inter-regional trade. It was replaced by the South Asian Free Trade Agreement in
2006 to ease and facilitate trade between SAARC countries – and which contained a stipulated
timeline for tariff reductions.
Box 7: (Ahmed, n.d.)
Border Haats
Border Haats are local border markets organised across the India-Bangladesh border. The initiative
has proven to be beneficial beyond strictly financial dividends. Haats have created jobs for
transporters, labourers, and providers of ancillary services - and boosted their incomes. India and
Bangladesh have always seen the menace of informal and illegal trade; these were significantly
reduced by these border haats. In formalising informal trade and reducing smuggling, the haats
have contributed to peaceful environments and decreased the burden of strict policing.
Border haats help consumers in rural border regions by providing a wider variety of goods at
cheaper prices, goods for which there is inherent local demand-and-supply complementarities.
Social mixing is an important aspect of these border haats. It helps strengthening socio-economic
bonds between people across the borders.
Under the SAFTA, the Non-Least Developing Countries were to reduce their tariffs on intraregional
trade with fellow NLDCs in two phases: under Phase 1 (2006–2008), existing tariff rates above 20%
were to be reduced to 20% within 2 years, tariffs below 20% were to be reduced on a margin of
preference basis by 10% per year. Under Phase 2 (2008–2013), tariffs on intraregional trade were to
be reduced to 0%–5% within 5 years.
Least Developing Countries were also to reduce their tariffs on intraregional trade with SAARC
members in two phases: under Phase 1 (2006–2008), tariff rates above 30% were to be reduced to
30% within 2 years, and tariffs below 30% were to be reduced on a margin of preference basis by 5%
per year. Under Phase 2 (2008–2016), tariffs on intraregional trade were to be reduced to 0%–5%
within 8 years.
Page 25
_______________________
SADF Working Paper N. 13
25
The SAFTA has not been able to fulfil expectations. There have been many reasons for this
fact. The agreement lacks an explicit commitment to deal with the issue of non-tariff barriers.
Further, it is confined to goods alone – unlike most trade agreements around the world, which
are aimed at broader partnerships including services and investments. There are obvious
divergences in the strategic and political interests of SAARC member countries. There have
been concerns regarding the SAFTA’s utility in the event of increasing bilateral agreements
and preferential access both within and beyond SAARC. Such bilateral agreements do not pose
a constraint as long as the developments within SAFTA are growing at their own pace. India
has grown over the years not only as an emerging Asian economic power but also as a world
economic power (Weerakoon). India is looking towards integrating with South East Asian
economies through various mechanisms with ASEAN. The onus lies on India to steer the
movement forward - while the remaining SAARC members need to evaluate the advantages or
disadvantages of closely integrating with India’s fast expanding economy. Both the SAARC
and SAFTA can be compared to their counterparts, ASEAN and AFTA in South-East Asia.
Between 1992 and 2017, intraregional imports as a share of global imports within ASEAN
increased from 17 to 24 percent, and exports from 21 to 27 percent.
In South Asia, these shares remained largely stagnant since SAFTA came into effect - at 3
percent for intraregional imports and 6-7 percent for intraregional exports (Kathuria S. R.,
2019). Thus, we can say that the Association of South-East Asian Nations (ASEAN) has been
quite successful in bringing regional economic integration (through ASEAN Free Trade
Agreement) -and India too has progressively enhanced its association with South-East Asia
(through the ASEAN-India Free Trade Agreement or AIFTA9)
Box 8: (Ministry of Commerce and Trade, 2019)
9The Trade in Goods agreement and Trade in Service and Investment Agreement together form the ASEAN -
India Free Trade Area (AIFTA). Discussions began in 2003 in Bali, Indonesia; the former agreement was signed in
2009 while the latter was signed in 2014. The Trade in Goods Agreement came into effect on January 1, 2010,
and the Trade in Service and Investment Agreement came into effect on July 1, 2015.
Page 26
_______________________
SADF Working Paper N. 13
26
Though SAARC was established before the Association of South-East Asian Nations was, it
lacked strong guidance and leadership for implementing the envisaged goals. Further common
interest and common threats are the most important factors favouring regional integration.
ASEAN nations have successfully been able to keep political issues separate from economic
interests, while SAARC nations are yet to delink political and economic issues. Further, the
lack of political and leadership commitment in South Asia has been cause of slow
developments10. The limited role of public opinion along with a strong influence in decision
making by political and business lobbyists has slowed down the process even further. Also,
ASEAN followed a multilateral approach through successive agreements on goods, services,
investments at different levels so as to reach today’s stage deep integration. SAARC has on the
other hand been inefficient in implementing SAFTA- and even slower in liberalising services
and investments.
10 Within the SAARC, India has had several political and even military tensions with most nations. There have
been wars (with Pakistan), water disputes (with Bangladesh and Nepal), political tensions (with the Maldives,
Pakistan, Nepal, and Sri Lanka) which have negatively impacted trade and relations at different instances over
the years. In the ASEAN however, international engagement takes place through dialogue mechanisms coupled
with a non-interference policy in internal affairs. However, the ASEAN also suffers from maritime border issues
in the South China Sea (WitchayaneeOcha, Imbulagodage, Effect of ASEAN on SAARC: The Perspective of Trade,
RSU International Journal of College of Government, Vol 3 No. 1).
India’s trade with ASEAN has progressively increased (except in 2015-16).
Table 9: India- ASEAN Total Trade and Trade Balance (All values in Bn USD)
2013-14 2014-15 2015-16 2016-17 2017-18
Total Trade 74.41 76.53 65.06 71.57 81.33
Trade Balance -8.14 -12.9 -14.75 -9.65 -12.93
Page 27
_______________________
SADF Working Paper N. 13
27
There are various areas where SAFTA can learn from the AFTA so as to improve efficiency
and effectiveness. The AFTA has been able to bring about trade liberalisation by reducing
tariffs to a great extent. Further and on the other hand, the AFTA allows only a limited
sensitive list for the countries involved, while within the SAARC each country has many
products in this sensitive list - ranging from 6 to 45 percent of its imports from other South
Asian countries (Kathuria S. R., 2019). Bangladesh, Sri Lanka, and Nepal have the highest
share of sensitive imports from South Asia. Regarding dispute resolution mechanisms, the
AFTA allows member states access to multiple options for redressing injured parties, allowing
juridical flexibility, and following a more rule-based approach, which is clearer and more
transparent. Provisions under the SAFTA however are far more ambiguous and follow a more
negotiation-based approach.
Geographical proximity, young demography and fast-growing economies in both South Asia
and South-East Asia magnify the scope of diversifying and deepening trade and cultural ties.
India is an extremely crucial player in bringing these two regions closer, given its political and
military prowess amongst SAARC nations and the route of connection between SAARC and
ASEAN. Further, India’s policies need to follow a multi-pronged approach to address the issues
associated with both regions and also look forward to intertwining them on the basis of the
complementarities.
Box 9:
As regards both South Asia and South-East Asia, insufficient infrastructure has proven to be the
biggest hindrance for India. Inadequate physical infrastructure with lack of cargo and ship
handling equipment, tedious custom procedures, roads and ports congestions, and excessive
border procedures add to the costs of transactions. The policies for dealing with such problems
with one region will have positive impacts on related problems in the other region.
Page 28
_______________________
SADF Working Paper N. 13
28
Conclusion
The study thus emphasises the indispensable nature of the economic ties between India and
rest of the South Asia and focuses on how India can play a bigger role in the region’s further
economic integration. Each nation in South Asia shares an invaluable relation with India which
needs to be nurtured into stronger and deeper economic ties. Resources need to be invested in
country-and trade-specific primary research to find solutions for different stakeholders. Both
physical and non-physical infrastructure are crucial areas wherein countries need to deeply
cooperate to ensure seamless trade and transactions. Trade integration between ASEAN nations
- regardless of their differences – has much to inform South Asian nations. Agreements and
deals need to be executed in a mission mode to make sure both internal and external policy lags
carry only a minimum impact on business transactions. SAARC nations need to make sure that
their assets of demography and minerals make them the tower house of growth and
development.
Deeper and stronger economic relations would allow the region to grow at a higher pace. India,
given its share in the region’s economy, is the lynchpin to "promote the welfare of the people
of South Asia and to improve their quality of life"11.
11Article I: Objectives, SAARC Charter
Page 29
_______________________
SADF Working Paper N. 13
29
References
Ahmed, A. A. (n.d.). SAFTA: Progress, Challenges, Prospects. Next Steps to South Asian
Economic Union. SAARC
Chaturvedi, P. Z. (2015). SAARC geopolitics and trade: Missing intra-regional connectivity a
hindrance to further economic integration. South Asian Survey 22.1, 78-106
EXIM Bank. (2014). Potential for Enhancing Intra-SAARC Trade: A Brief Analysis.
Retrieved from Eximbankindia:
https://www.eximbankindia.in/Assets/Dynamic/PDF/Publication-
Resources/ResearchPapers/43file.pdf
Giri, P. (2015). "A Study and Analysis of Challenges, Achievements and Hurdles
Faced by SAARC Nations in Trade Integration and Growth. International Journal of
Engineering Technology, Management and Applied Sciences 3.1 , 204-215
Kathuria, S. (2018). A Glass Half Full: The Promise of Regional Trade in South Asia.
Washington DC: World Bank
Kathuria, S. R. (2019, February 14). How South Asia can become Free trade era? Retrieved
from World Bank Blogs: https://blogs.worldbank.org/endpovertyinsouthasia/how-
south-asia-can-become-free-trade-area
Ministry of Commerce and Trade. (2019, July 1). Retrieved from https://commerce-
app.gov.in/eidb/
Ministry of Commerce. (2017). India's Trade With South Asia In 2016-17. Retrieved from
Commerce.Gov.In:https://commerce.gov.in/writereaddata/uploadedfile/MOC_636477
306238949138_Trade_with_South_Asia_2016-17.pdf
Sophon, M. (2018, March 9). Tuk-tuk drivers are losing business to imported Indian
rickshaws M. Khmer Time
Taneja, N., & Saini, R. (n.d.). Informal Trade in South Asia. Next Steps to South Asia
Economic Union . South Asian Association for Regional Cooperation
The World Bank . (2018, April 04). Lifted by India, South Asia Regains Growth Lead, Still
Lags on Jobs. Retrieved from World Bank: https://worldbank.org/en/news/press-
release/2018/04/15/south-asia-focus-growth-lead-jobless-growth-create-more-jobs
The World Bank. (2018). South Asia Should Remove Trade Barriers For Mutual
Page 30
_______________________
SADF Working Paper N. 13
30
Economic Gains: New World Bank Report. Retrieved from World Bank:
https://www.worldbank.org/en/news/press-release/2018/09/24/south-asia-remove-
trade-barriers-mutual-economic-gains-report
The World Bank. (2019, April 5). The World Bank In South Asia. Retrieved from
https://www.worldbank.org/en/region/sar/overview
Weerakoon, D. (n.d.). SAFTA Current Status and Prospects. Retrieved from World Bank
Group: http://siteresources.worldbank.org/SOUTHASIAEXT/Resources/223546-
1192413140459/4281804-1192413178157/4281806-
1265938468438/BeyondSAFTAFeb2010Chapter3.pdf