2014 Education at a Glance 2014 OECD INDICATORS Education at a Glance 2014: OECD Indicators For more information on Education at a Glance 2014 and to access the full set of Indicators, visit www.oecd.org/edu/eag.htm. This work is published on the responsibility of the Secretary-General of the OECD. The opinions expressed and arguments employed herein do not necessarily reflect the official views of the Organisation or of the governments of its member countries. This document and any map included herein are without prejudice to the status of or sovereignty over any territory, to the delimitation of international frontiers and boundaries and to the name of any territory, city or area. You can copy, download or print OECD content for your own use, and you can include excerpts from OECD publications, databases and multimedia products in your own documents, presentations, blogs, websites and teaching materials, provided that suitable acknowledgement of OECD as source and copyright owner is given. All requests for public or commercial use and translation rights should be submitted to [email protected]. Requests for permission to photocopy portions of this material for public or commercial use shall be addressed directly to the Copyright Clearance Center (CCC) at [email protected]or the Centre français d’exploitation du droit de copie (CFC) at [email protected]. Indicator D3 How much are teachers paid? Please cite this Indicator as: OECD (2014), “Indicator D3: How much are teachers paid?”, in Education at a Glance 2014: OECD Indicators, OECD Publishing. http://dx.doi.org/10.1787/888933119815
Transcript
2014
Education at a Glance 2014OECD inDiCatOrs
Education at a Glance 2014: OECD IndicatorsFor more information on Education at a Glance 2014 and to access
the full set of Indicators, visit www.oecd.org/edu/eag.htm.
This work is published on the responsibility of the Secretary-General of the OECD. The opinions expressed and arguments employed herein do not necessarily reflect the official views of the Organisation or of the governments of its member countries.
This document and any map included herein are without prejudice to the status of or sovereignty over any territory, to the delimitation of international frontiers and boundaries and to the name of any territory, city or area.
You can copy, download or print OECD content for your own use, and you can include excerpts from OECD publications, databases and multimedia products in your own documents, presentations, blogs, websites and teaching materials, provided that suitable acknowledgement of OECD as source and copyright owner is given. All requests for public or commercial use and translation rights should be submitted to [email protected]. Requests for permission to photocopy portions of this material for public or commercial use shall be addressed directly to the Copyright Clearance Center (CCC) at [email protected] or the Centre français d’exploitation du droit de copie (CFC) at [email protected].
Indicator D3How much are teachers paid?
Please cite this Indicator as:
OECD (2014), “Indicator D3: How much are teachers paid?”, in Education at a Glance 2014: OECD Indicators, OECD Publishing.http://dx.doi.org/10.1787/888933119815
• On average across OECD countries, pre-primary teachers earn 80% of the salary of a tertiary-educated, 25-64 year-old full-time, full-year worker, primary-school teachers earn 85% of that benchmark, lower secondary teachers are paid 88%, and upper secondary teachers are paid 92% of that benchmark salary.
• The statutory salaries of teachers with 15 years of experience average USD 37 350 at the pre-primary level, USD 39 024 at the primary level, USD 40 570 at the lower secondary level, and USD 42 861 at the upper secondary level.
contextTeachers’ salaries represent the largest single cost in formal education and have a direct impact on the attractiveness of the teaching profession. They influence decisions to enrol in teacher education, become a teacher after graduation (as graduates’ career choices are associated with relative earnings in teaching and non-teaching occupations, and their likely growth over time), return to the teaching profession after a career interruption, and/or remain a teacher (as, in general, the higher the salaries, the fewer the people who choose to leave the profession) (OECD, 2005). Burgeoning national debt, spurred by governments’ responses to the financial crisis of late 2008, have put pressure on policy makers to reduce government expenditure – particularly on public payrolls. Since compensation and working conditions are important for attracting, developing and retaining skilled and high-quality teachers, policy makers should carefully consider teachers’ salaries as they try to ensure both quality teaching and sustainable education budgets (see Indicators B6 and B7).
other findings• In most OECD countries, teachers’ salaries increase with the level of education they teach. For
example, the salary of an upper secondary school teacher with 15 years of experience in Belgium, Denmark, Finland, Indonesia, Poland and Switzerland (for 11 years of experience) is at least 25% higher than that of a pre-primary school teacher with the same experience.
Chart D3.1. Teachers’ salaries relative to earnings for tertiary-educated workers aged 25-64 (2012)
Lower secondary teachers’ salaries, in public institutions
1 2 http://dx.doi.org/10.1787/888933119929
1.5
1.0
0.5
0.0
Ratio
Kor
ea
Spai
n1
Luxe
mbo
urg
Port
ugal
1
Turk
ey
New
Zea
land
1
Cana
da1
Finl
and
Ger
man
y
Engl
and
Aus
tral
ia
Gre
ece
Den
mar
k
OEC
D a
vera
geBe
lgiu
m (F
l.)
Fran
ce
Isra
el
Esto
nia
Pola
nd
Scot
land
Swed
en1
Belg
ium
(Fr.)
Net
herl
ands
Irel
and1
Slov
enia
Chi
le1
Nor
way
Uni
ted
Stat
es
Ital
y
Aus
tria
Czec
h R
epub
lic
Hun
gary
Slov
ak R
epub
lic
Notes: Teachers’ salaries either refer to actual salary, including bonuses and allowances, for teachers aged 25-64 or to statutory salary after 15 years of experience and minimum training. Please refer to Table D3.2 for details on the methodology.1. Year of reference 2011.Countries are ranked in descending order of the ratio of teachers’ salaries to earnings for full-time, full-year workers with tertiary education aged 25-64.Source: OECD. Table D3.2. See Annex 3 for notes (www.oecd.org/edu/eag.htm).
• Salaries at the top of the scale with minimum qualifications are, on average, 58%, 61%, 61% and 62% higher, respectively, than starting salaries in pre-primary, primary, lower secondary and upper secondary education, and the difference tends to be greatest when it takes many years to progress through the scale. In countries where it takes 30 years or more to reach the top of the salary scale, salaries at that level are an average of 80% higher than starting salaries.
• Teachers with maximum qualifications at the top of their salary scales are paid, on average, USD 48 937 at the pre-primary level, USD 50 984 at the primary level, USD 53 686 at the lower secondary level, and USD 55 119 at the upper secondary level. However, the salary premium for higher qualifications varies. In Israel, Mexico, Poland and Slovenia, for example, primary teachers who hold the maximum qualification earn at least 30% more than primary teachers with similar experience, but who hold the minimum qualification. However, in around one-third of countries with available data there is no difference.
• In 10 out of 24 countries with available data, the average annual salaries of upper secondary teachers, including bonuses and allowances, are at least 10% higher than statutory salaries for upper secondary teachers with 15 years of experience and minimum qualification.
trendsBetween 2000 and 2012, teachers’ salaries rose, in real terms, in all countries with available data, with the exception of France, Greece and Japan. However, in most countries, salaries increased less since 2005 than between 2000 and 2005 and the economic downturn in 2008 also had a direct impact on teachers’ salaries, which were either frozen or cut in some countries. As a consequence, the number of countries showing an increase in salaries, in real terms, between 2008 and 2012 shrinks to fewer than half of OECD countries.
chapter D The Learning Environment and Organisation of Schools
Teachers’ salaries are one component of teachers’ total compensation. Other benefits, such as regional allowances for teaching in remote areas, family allowances, reduced rates on public transport and tax allowances on the purchase of cultural materials, may also form part of teachers’ total remuneration. There are also large differences in taxation and social-benefits systems in OECD countries. All this should be borne in mind when comparing statutory salaries across countries.
Teachers’ salaries vary widely across countries. The salaries of lower secondary school teachers with 15 years of experience range from less than USD 15 000 in Estonia, Hungary, Indonesia and the Slovak Republic, to more than USD 60 000 in Germany, the Netherlands and Switzerland (for teachers with at least 11 years of experience) and exceed USD 100 000 in Luxembourg (Table D3.1 and Chart D3.2).
In most countries, teachers’ salaries increase with the level of education taught. In Belgium, Denmark, Hungary, Indonesia, the Netherlands, Poland and the Slovak Republic, upper secondary teachers with 15 years of experience earn between 20% and 30% more than pre-primary teachers with the same experience; they earn around 50% more in Finland and in Switzerland (for teachers with 11 years of experience). In Finland and the Slovak Republic, the difference is mainly explained by the gap between pre-primary and primary teachers’ salaries. In the Netherlands, the main difference is found between the primary and lower secondary level, whereas in Belgium, teachers’ salaries at the upper secondary level are significantly higher than at the other levels of education. In Denmark and Hungary, the main differences are found between upper secondary and lower secondary teachers’ salaries, while there is no difference between the salaries of lower secondary and primary teachers. In contrast, in Switzerland, teachers’ salaries increase consistently from pre-primary to upper secondary level. The differences between salaries at each level of education should be interpreted in light of the requirements to enter the teaching profession (see Indicator D6).
In Australia, Canada, Korea and Turkey, there is less than a 5% difference between salaries for upper secondary and pre-primary school teachers with 15 years of experience; in England, Greece, Portugal, Scotland and Slovenia, teachers receive the same salary irrespective of the level of education taught. This is also true in Estonia, Ireland and Japan at the primary, lower secondary and upper secondary levels. In Israel, there is a 13% difference between the salaries of an upper secondary teacher and a pre-primary teacher in favour of the latter. This difference is the result of the “New Horizon” reform, gradually implemented since 2008, that increased salaries for pre-primary, primary and lower secondary teachers. Another reform, launched in 2012, aims to raise salaries for upper secondary teachers. In Luxembourg, primary school teachers with 15 years of experience earned around 50% less than secondary teachers with the same amount of experience prior to a reform in 2009. Now, however, the difference between primary and secondary school teachers’ salaries is less than 10%.
Differences in teachers’ salaries at different education levels may influence how schools and school systems attract and retain teachers and may also influence the extent to which teachers move among education levels.
Minimum and maximum teachers’ salaries
Education systems face a challenge in recruiting high-quality graduates as teachers. Research evidence indicates that salaries and alternative employment opportunities are important influences on the attractiveness of teaching (Santiago, 2004). The starting salaries of teachers relative to other non-teaching occupations and the likely growth in earnings have a huge influence over a graduate’s decision to become a teacher. Countries that are looking to increase the supply of teachers, especially those with an ageing teacher workforce and/or a growing school-age population, might consider offering more attractive starting wages and career prospects. However, to ensure a well-qualified teaching workforce, efforts must be made not only to recruit and select only the most competent and qualified teachers, but also to retain effective teachers.
At the lower secondary level, new teachers entering the profession with the minimum qualification earn, on average, USD 30 735. This minimum salary ranges from below USD 15 000 in Brazil, Estonia, Hungary, Indonesia, Poland and the Slovak Republic, to more than USD 40 000 in Denmark, Germany, Luxembourg and Switzerland. For teachers at the top of the salary scale and with the maximum qualifications, salaries average USD 53 686. This maximum salary ranges from less than USD 20 000 in Estonia, Indonesia and the Slovak Republic, to USD 75 000 or more in Austria, Korea and Switzerland and more than USD 130 000 in Luxembourg.
D3
How much are teachers paid? – InDIcator D3 chapter D
Box D3.1. How teachers’ salaries are related to student performance
Findings from the 2012 OECD Programme for International Students Assessment (PISA) suggest that high-performing systems tend to prioritise higher salaries for teachers, especially in high-income countries. Among countries and economies whose per capita GDP is more that USD 20 000, including most OECD countries, systems that pay teachers more (i.e. higher teachers’ salaries relative to national income per capita) tend to perform better in mathematics. The correlation between these two factors across 33 high-income countries and economies is 0.30, and the correlation is 0.40 across 32 high-income countries and economies, excluding Qatar. In contrast, across countries and economies and economies whose GDP is less than USD 20 000, a system’s overall academic performance is unrelated to its teachers’ salaries, possibly signalling that a host of resources (material infrastructure, instructional materials, transportation, etc.) also need to be improved until they reach a certain level, after which improvements in material resources no longer benefit student performance, but improvements in human resources (through higher teachers’ salaries, for example) do.
Most countries with starting salaries below the OECD average also show lower maximum salaries. At the lower secondary level, the exceptions are France, Japan, Korea and Mexico, where starting salaries are at least 5% lower than the OECD average, but maximum salaries are significantly higher. In Scotland, although starting salaries are almost 10% below the OECD average, maximum salaries are within the OECD average. The opposite is true for Denmark and Finland, where starting salaries are at least 10% higher than the OECD average while maximum salaries are around 5% or more lower than the OECD average. In Australia and Norway, starting salaries are at least
Chart D3.a. Teachers’ salaries and mathematics performance
Mathematics performance (score points)
80 160 200 22040 12020 10060 140 180
Notes: Teachers’ salaries relative to per capita GDP refers to the weighted average of upper and lower secondary school teachers. �e average is computed by weighting teachers’ salaries for upper and lower secondary school according to the respective 15-year-old students’ enrolment (for countries and economies with available information on both the upper and lower secondary levels).Only countries and economies with available data are shown.1. A non-significant relationship (p > 0.10) is shown by the dotted line.2. A significant relationship (p < 0.10) is shown by the solid line.Source: OECD (2013), PISA 2012 Results: What Makes Schools Successful? (Volume IV): Resources, Policies and Practices, PISA , OECD Publishing.
650
600
550
500
450
400
350
300
Teachers’ salaries relative to per capita GDP (%)
Countries/economies with per capita GDP less than USD 20 000Fitted line for these countries1
Countries/economies with per capita GDP over USD 20 000Fitted line for these countries2
R² = 0.05
R² = 0.09Netherlands
Canada
Italy Portugal
Germany
IrelandUnited States
New Zealand
Estonia
HungarySpain
Slovak Republic
Australia
France
Finland
Belgium Korea
United Kingdom
SloveniaAustria
Japan
PolandNorway
Israel
Chile
Denmark
Sweden
Iceland
Czech Republic
Greece Luxembourg
Tunisia
Peru
Latvia Croatia
UruguayBulgaria
Colombia
�ailand
Jordan
Lithuania
Malaysia
Montenegro
Shanghai-China
SingaporeHong Kong-China
Qatar
Romania
IndonesiaArgentina
Macao-China
1 2 http://dx.doi.org/10.1787/888932957403
chapter D The Learning Environment and Organisation of Schools
10% above the OECD average but maximum salaries are within the OECD average. In Sweden, the starting salaries are within the OECD average, but the maximum salaries are around 25% lower than the OECD average. (Chart D3.2 and Table D3.6, available on line).
A number of countries have relatively flat salary scales. For example, the difference between minimum and maximum salaries is less than 30% in the Czech Republic, in Denmark at the pre-primary, primary and lower secondary levels, in Turkey at the lower and upper secondary levels, and in Finland, Norway and Sweden at the pre-primary level.
Weak financial incentives may make it more difficult to retain teachers as teachers approach the peak of their earnings. However, there may be some benefits to compressed pay scales. It is often argued, for example, that organisations in which there are smaller differences in salaries among employees enjoy more trust, freer flows of information and more collegiality among co-workers.
In contrast, maximum salaries are at least double the starting salaries in Austria, Chile, Israel and Korea at all levels of education, in the French community of Belgium at pre-primary, primary and lower secondary levels, in France at lower and upper secondary levels, in Hungary at upper secondary level, in Japan at primary and secondary levels, and in Poland at pre-primary and primary levels. Maximum salaries are more than three times higher than starting salaries in Mexico at pre-primary, primary and lower secondary levels (Chart D3.2 and Table D3.6, available on line).
1 2 http://dx.doi.org/10.1787/888933119948
Chart D3.2. Lower secondary teachers’ salaries at different points in their careers (2012)Annual statutory teachers’ salaries, in public institutions, in equivalent USD converted using PPPs
140 000
120 000
100 000
80 000
60 000
40 000
20 000
0
Equivalent USD converted using PPPs
Luxe
mbo
urg
Ger
man
ySw
itze
rlan
d1, 2
Den
mar
kSp
ain
Net
herl
ands
Aus
tral
iaCa
nada
Uni
ted
Stat
es3
Irel
and
Finl
and
Nor
way
Aus
tria
Belg
ium
(Fl.)
2
Belg
ium
(Fr.)
4
Swed
en2,
3, 5
OEC
D a
vera
geIt
aly
Fran
ce6
New
Zea
land
Port
ugal
Kor
ea2
Engl
and
Scot
land
Japa
nSl
oven
iaTu
rkey
Icel
and
Mex
ico
Isra
elG
reec
eC
hile
Czec
h R
epub
lic2
Pola
ndEs
toni
aH
unga
ry3
Slov
ak R
epub
licBr
azil
Indo
nesi
a2
1. Salaries after 11 years of experience, instead of 15 years.2. Salaries at top of scale and minimum training, instead of maximum qualifications.3. Actual base salaries.4. Salaries of teachers with typical qualification instead of minimum. 5. Year of reference 2011.6. Includes average bonuses for overtime hours.Countries are ranked in descending order of starting salaries for lower secondary teachers with minimum training. Source: OECD. Table D3.1, and Table D3.6, available on line. See Annex 3 for notes (www.oecd.org/edu/eag.htm).
Starting salary and minimum trainingSalary after 15 years of experience and minimum training Salary at top of scale and maximum quali�cations
D3
How much are teachers paid? – InDIcator D3 chapter D
The salary premium for a higher level of qualification, at the top of the salary scale, also varies across countries. At the lower secondary level, while there is no difference between salaries at the top of the scale for teachers with minimum and maximum qualifications in 10 of 32 countries with data for both, teachers at the top of the scale holding the maximum qualifications in the French community of Belgium, France, Israel, Norway and Slovenia earn at least 25% more than teachers with the same experience, but with minimum training. This salary gap is as wide as 57% in Mexico. A similar picture is seen at the upper secondary level (Table D3.1 and Table D3.6, available on line).
When considering the salary structure for teachers, it is important to remember that not all teachers reach the top of the salary scale, and that only few of them hold the maximum qualification. For example, in Greece and Italy, less than 5% of all teachers were at the top of the salary scale in 2012 and in France the proportion of teachers holding the maximum qualifications at the lower secondary level accounts for only 5% of all teachers.
Teaching experience and salary scales
Salary structures define the salaries paid to teachers at different points in their careers. Deferred compensation, which rewards employees for staying in organisations or professions and for meeting established performance criteria, is also used in teachers’ salary structures. OECD data on teachers’ salaries are limited to information on statutory salaries at four points of the salary scale: starting salaries, salaries after 10 years of service, salaries after 15 years of experience, and salaries at the top of the scale. The salaries discussed here are those of teachers who have the minimum required training. As mentioned above, further qualifications can lead to wage increases in some countries.
In OECD countries, teachers’ salaries rise during the course of a career, although the rate of change differs across countries. Statutory salaries for lower secondary school teachers with 10 and 15 years of experience are, respectively, 24% and 35% higher, on average, than starting salaries. Furthermore, salaries at the top of the scale, which is reached after an average of 24 years of experience, are 61% higher, on average, than starting salaries. In Hungary, Israel, Italy, Korea and Spain, lower secondary school teachers reach the top of the salary scale only after 35 or more years of service; in Greece, the top of the scale is reached after 45 years of service. In contrast, lower secondary school teachers in Australia, Denmark, Estonia, New Zealand and Scotland reach the highest step on the salary scale within six to nine years (Tables D3.1 and D3.3).
While salary increases are gradual in around half of the 31 OECD countries with relevant data, in the remaining countries, salary scales include steps of uneven size.
Statutory salaries per hour of net teaching time
The average statutory salary per teaching hour after 15 years of experience is USD 50 for primary school teachers, USD 59 for lower secondary teachers, and USD 68 for upper secondary teachers in general education. Chile, the Czech Republic (primary level), Estonia, Hungary, Indonesia, Mexico (primary and lower secondary levels), Poland (primary level) and the Slovak Republic show the lowest salaries per teaching hour: less than USD 30. In contrast, salaries per teaching hour are USD 90 or more in Belgium, Denmark, Japan, and Korea at the upper secondary level and in Germany and the Netherlands at the lower and upper secondary levels. They exceed USD 120 in Luxembourg at all education levels (Table D3.3).
As secondary school teachers are required to teach fewer hours than primary school teachers, their salaries per teaching hour are usually higher than those of teachers at lower levels of education, even in countries where statutory salaries are similar (see Indicator D4). On average across OECD countries, upper secondary teachers’ salaries per teaching hour exceed those of primary teachers by 32%. In Scotland, there is no difference, while in Denmark, upper secondary teachers earn double the salary of primary teachers per teaching hour (Table D3.3).
However, the difference in salaries between primary and secondary teachers may disappear when comparing salaries per hour of working time. In Portugal, for example, there is a 23% difference in salaries per teaching hour between primary and upper secondary teachers, even though statutory salaries and total working time are actually the same at these levels. The difference is explained by the fact that primary teachers spend more time in teaching activities than upper secondary teachers do (see Table D4.1).
Trends since 2000
Comparing salaries in 2000 and 2012, teachers’ salaries increased overall in real terms in most countries with available data. Notable exceptions are France, Greece and Japan, where there was a decline of around 10% in teachers’ salaries in real terms during that period. In the Czech Republic, Estonia and Turkey (primary and upper secondary), salaries increased by at least 50% over this period (Table D3.5).
chapter D The Learning Environment and Organisation of Schools
However, between 2005 and 2012, only slightly more than half of OECD countries with available data show an increase in their salaries in real terms and in most countries, salaries increased less since 2005 than between 2000 and 2005. The exceptions to this pattern are the French community of Belgium (secondary levels), Denmark (primary and lower secondary levels), Estonia, Israel and Mexico (primary and lower secondary levels) and New Zealand, where most of the increase in teachers’ salaries occurred after 2005. In Poland, salaries also increased since 2005 by at least 20% at all levels of education. This is the result of a government programme from 2007 that aimed to increase teachers’ salaries successively between 2008 and 2012. The government reform was implemented to improve the quality of education by providing financial incentives to attract high-quality teachers.
In contrast, in Greece and Hungary, salaries decreased by at least 20% since 2005 (Chart D3.3). However, these decreases occurred largely between 2008 and 2012. This reflects the impact of the economic downturn in 2008 on teachers’ salaries, which were either frozen or cut in these countries between 2008 and 2012 (Box D3.2). The number of countries showing an increase in salaries, in real terms, between 2008 and 2012 shrinks to fewer than half of OECD countries. In England, Estonia, Scotland and Spain, salaries fell by at least 5% between 2008 and 2012 and by at least 10% in the Czech Republic over this period.
1 2 http://dx.doi.org/10.1787/888933119967
Chart D3.3. Change in lower secondary teachers’ salaries (2000, 2005, 2012)Index of change between 2000 and 2012 (2005 = 100, constant prices),
for teachers with 15 years of experience and minimum training
140
130
120
110
100
90
80
70
60
50
Index of change2005 = 100
Esto
nia
Pola
nd
Isra
el
Den
mar
k1
Irel
and
Luxe
mbo
urg
Nor
way
Mex
ico
New
Zea
land
Aus
tral
ia
Slov
enia
Swed
en2,
3
Belg
ium
(Fr.)
Czec
h R
epub
lic4
Aus
tria
Belg
ium
(Fl.)
Swit
zerl
and5
OEC
D a
vera
ge
Finl
and
Uni
ted
Stat
es3
Icel
and
Ital
y
Kor
ea
Fran
ce
Spai
n
Engl
and
Scot
land
Japa
n
Port
ugal
Gre
ece
Hun
gary
3
2012 2000
1. Break in time series following methodological changes in 2009. 2. Year of reference 2011 instead of 2012.3. Actual base salaries.4. Break in time series following methodological changes in 2012.5. Salaries after 11 years of experience. Countries are ranked in descending order of the index of change, between 2005 and 2012, in the salaries of lower secondary teachers with 15 years of experience.Source: OECD. Table D3.5. See Annex 3 for notes (www.oecd.org/edu/eag.htm).
The above analysis on trends in salaries is based on teachers with 15 years of experience (a proxy for mid-career teachers); however, teachers at certain stages of their career may experience more rapid pay increases than teachers at another stage of their career. For example, some countries that have been experiencing teachers’ shortages may implement targeted policies to improve the attractiveness of the profession by increasing the salaries of beginning teachers (OECD, 2005). In France, for example, starting teachers received an increase in pay in 2010 and 2011.
D3
How much are teachers paid? – InDIcator D3 chapter D
The financial and economic crisis that hit the world economy in the last months of 2008 significantly affected the salaries for civil servants and public sector workers in general. The pressure to trim government spending in order to reduce national debt has resulted in cuts in teachers’ and other civil-servants’ salaries in a growing number of countries. On average across OECD countries with available data, teachers’ salaries decreased, for the first time since 2000, by around 5% at all levels of education between 2009 and 2012.
Teachers’ salaries were, for example, significantly affected by the crisis in England, Estonia, Greece, Hungary, Ireland, Italy, Portugal, Scotland and Spain. In Estonia, minimum teachers’ salaries were cut back to their 2008 levels in 2010 and were frozen at that level. In Greece, various reductions in teachers’ benefits and allowances affected teachers’ salaries in 2010, 2011 and 2012. As a result, gross salaries fell by around 25%, in real terms, between 2009 and 2012. In addition, Greek teachers also saw their net salaries shrink as a tax for solidarity was created. This tax increased the level of taxation on teachers’ already reduced gross salary; and the insurance coverage paid by teachers is still calculated based on their earlier, higher salaries. In Hungary, the 13th month of salary (a supplemental bonus that was paid to all employees) was suspended in 2009. Although a compensatory bonus was paid to all public-sector employees whose wages where under a certain threshold, the base salary of teachers was still considerably affected. In 2012, the continued decrease in teachers’ salaries is due to a reduction in additional payments, such as for extra teaching lessons. These additional payments were a significant component of teachers’ total compensation, paid above base salaries. In 2012 these payments decreased to a lesser extent at the lower secondary level and to a greater extent at the upper secondary level.
In Spain, all civil servants saw their salaries reduced in July 2010. The extent of the decrease depended on the annual amount earned but it affected both the base salary and bonuses. In Ireland, teachers’ salaries were reduced as of 1 January 2010 as part of a public service-wide reduction in pay. In addition, teachers who entered the profession after 1 January 2011 are paid according to a new salary scale that is 10% lower than the salary scale that applied to those previously recruited. In Portugal in 2011, using a method defined in a new law and as part of a reform package, salaries higher than EUR 1 500 were reduced. They fell again in 2012 as civil servants were paid salaries covering 12 months, not 14 months, as had previously been the case. In England, teachers’ salaries were frozen between 2011 and 2012 at all levels of education, followed by a below-inflation increase of 1% in the following year for the public sector as a whole, all due to the financial crisis.
Chart D3.b. Change in teachers’ salaries in OECD countries (2005-12)OECD average, for countries with data for all reference years, of the index of change for teachers
with 15 years of experience and minimum training (2005 = 100, constant prices)
1 2 http://dx.doi.org/10.1787/888933119986
107
106
105
104
103
102
101
100
99
Index of change 2005 = 100
Source: OECD. Table D3.5. See Annex 3 for notes (www.oecd.org/edu/eag.htm).
In most countries, similar increases and decreases in teachers’ salaries were seen at the primary, lower secondary and upper secondary levels. However, in Israel and Luxembourg, they increased significantly more at the primary than at the secondary level between 2005 and 2012. In both Israel and Luxembourg, the difference in the index of change between primary and secondary school teachers’ salaries is due to reforms that aimed to increase primary teachers’ salaries. In Israel, this is largely the result of the gradual implementation of the “New Horizon” reform in primary and lower secondary schools, begun in 2008, following an agreement between the education authorities and the Israeli Teachers Union (for primary and lower secondary education). This reform includes higher teacher pay in exchange for more working hours (see Indicator D4). In 2012, 88% of full-time equivalent teachers in primary education, 33% in lower secondary education and 71% in pre-primary education were included in the reform. The same year, the Israeli government negotiated a similar programme for upper secondary schools with the union of secondary school teachers. As the implementation of these reforms continues, salaries at the lower and upper secondary levels are also expected to increase significantly.
As teachers were in a three-year pay settlement, the pay freeze was applied later for teachers than for other public-sector workers. Similarly, the Scottish Negotiating Committee for Teachers (SNCT) agreed to freeze teachers’ pay from April 2011 until March 2013. While teachers in Scotland are not classified as civil servants, this agreement mirrored the freezes applied to the pay of civil servants in Scotland. In Italy, teachers’ salaries were frozen from 2011. This salary freeze affected all civil servants, including teachers, and was introduced in response to the international economic situation and in order to meet the public finance targets set by the EU.
The economic downturn may also have an influence on the supply of teachers. In general, when the general economy is weak, and there is high unemployment among graduates and low graduate earnings, teaching might seem to be a more attractive job choice than other occupations (OECD, 2005).
Box D3.3. Additional payments: Incentives and allowances
In addition to basic pay scales, school systems increasingly use schemes that offer additional payments or other rewards for teachers. Together with the starting salary, these payments may influence a person’s decision to enter or remain in the teaching profession. While data on the amount of payment were not yet collected, there is information on the additional payments available and on the level at which the decision to award such payments is taken (Tables D3.7a, b, c and d, available on line; as well as Annex 3, available at www.oecd.org/edu/eag.htm).
Additional payments are most often awarded for particular responsibilities or working conditions, such as teaching in more disadvantaged schools, particularly those located in very poor neighbourhoods or those with a large proportion of students whose language is not the language of instruction. These schools often have difficulties attracting teachers and are more likely to have less-experienced teachers (OECD, 2005). Most countries provide additional payments for handling management responsibilities in addition to teaching duties and around two-third of OECD countries offer these supplemental payments that are paid every year. Around two-third of the countries provide additional payments for teaching in more disadvantaged areas. Half of the OECD countries provide additional payments for special activities, e.g. sports and drama clubs, and teaching students with special education needs in regular schools.
Additional payments based on teachers’ qualifications, training and performance are also common in OECD countries. The most common types of payments reward an initial education qualification and/or a level of teacher certification and training that is higher than the minimum requirement. Around 80% of the countries make these payments available, with about two-third of them offering both types of payments. Moreover, among the OECD countries with available data, 21 countries offer an additional payment to teachers for outstanding performance. In 17 of these countries, the decision to award the additional payments is made by the school principal.
Half of all OECD countries offer additional payments based on teachers’ demographic characteristics (family status or age), and most of these are annual payments.
D3
How much are teachers paid? – InDIcator D3 chapter D
Box D3.4. Actual average salaries, by age group and gender
In general, the actual salaries of teachers aged 25-64 average USD 38 253 at pre-primary level, USD 41 300 at primary level, USD 43 374 at lower secondary level, and USD 47 165 at upper secondary level. The pattern of salary increases within the level of education is similar for different age groups within the age range of 25-64 year-olds and for both men and women.
The actual salaries of older teachers (those aged 55-64) are, on average, 31% (pre-primary), 33% (primary), 35% (lower secondary) and 38% (upper secondary) higher than actual salaries of younger teachers (those aged 25-34).
When teachers’ salaries compared to tertiary-educated, full-time, full-year 25-64 year-old workers are disaggregated by age, the ratio differs among age groups. Relative teachers’ salaries are higher among the youngest adults (25-34 year-olds) than for the older age groups. The ratio among teachers aged 25-34 is at least 4 percentage points (upper secondary) and up to 8 percentage points (pre-primary) greater than the ratio among teachers aged 55-64. The higher ratio among the youngest adults compared to other age groups indicates the attractiveness of entering the teaching profession. However, this ratio shrinks as teachers age, indicating that teachers’ salaries may evolve at a slower rate than for other workers and that the salaries of other similarly educated professionals are more attractive as the work force ages.
A comparison of the actual salaries of male and female teachers shows that female teachers earn on average slightly more than male teachers at the pre-primary level and slightly less at the primary, lower secondary and upper secondary levels. The difference in actual salaries between the genders, however, is less than 3%.
…
Actual average salaries
Statutory salaries as reported by most of the countries in this indicator must be distinguished from actual expenditures on wages by governments and from teachers’ actual average salaries, which are influenced by factors such as the levels of experience of the teaching force and the prevalence of bonuses and allowances in the compensation system.
Bonuses and allowances can represent a significant addition to basic salaries. In the Slovak Republic, for example, most teachers receive bonuses, such as personal valuations/appraisals, on a monthly basis. Depending on the financial resources of the school and the evaluation of individual teachers, teachers’ average salaries in that country, including these bonuses, can be double the base statutory salary.
The comparison of actual annual salaries of all teachers aged 25-64 with statutory salaries for teachers with 15 years of experience shows that in Chile, Estonia (primary and secondary levels), France (upper secondary level), Hungary (primary and secondary levels), Iceland (upper secondary level), Israel (secondary levels), Norway (primary and lower secondary levels) and Poland (pre-primary, primary and lower secondary levels), average actual salaries, including bonuses and allowances, are at least 20% higher than statutory salaries for teachers with 15 years of experience. In contrast, in the French Community of Belgium (upper secondary level), Greece, Luxembourg (pre-primary and primary levels), the Netherlands and Scotland, average actual salaries of teachers aged 25-64 are at least 5% lower than statutory salaries for teachers with 15 years of experience (Tables D3.1 and D3.4).
In some countries, average actual teachers’ salaries vary more across education levels than statutory salaries for teachers with 15 years of experience. In the Czech Republic, England, Finland and Norway, the gap between average actual salaries of upper secondary teachers and average actual salaries of pre-primary teachers is at least 10 percentage points greater than the difference in their statutory salaries. In France, there is an almost 30% gap in actual salaries between pre-primary and upper secondary teachers’ salaries, but only a 10% gap in statutory salaries between these two groups of teachers. In Israel, statutory salaries of upper secondary teachers are more than 10% lower than statutory salaries of pre-primary teachers, but the opposite is true when looking at actual average salaries: upper secondary teachers earn, on average, almost 10% more than pre-primary teachers. In Poland and Norway, there is a difference of around 15% between average actual salaries at the pre-primary and primary levels, despite similar statutory salaries at these levels. The opposite is true for teachers’ salaries at primary and upper secondary levels in Poland, with similar actual salaries but a difference of almost 15% in statutory salaries. The variety of bonuses available for different levels of education partly explains these differences (see Annex 3, available at www.oecd.org/edu/eag.htm).
chapter D The Learning Environment and Organisation of Schools
Teachers’ salaries relative to earnings for tertiary-educated workers The propensity of young people to undertake teacher training, as well as of graduates from teacher-training programmes to enter or stay in the profession, will be influenced by the salaries of teachers relative to those of other occupations requiring similar levels of qualifications and by likely salary increases. In all OECD countries, a tertiary qualification is required to become a teacher (see Indicator D6), so the likely alternative to teacher education is another tertiary education programme. Thus, to interpret salary levels in different countries and reflect comparative labour-market conditions, teachers’ salaries are compared to those of other similarly-educated professionals: 25-64 year-old full-time, full-year workers with a tertiary education.
Pre-primary teachers’ salaries amount to 80% of full-time, full-year earnings, on average, for 25-64 year-olds with tertiary education, primary teachers earn 85% of that benchmark salary, lower secondary teachers are paid 88%, and upper secondary teachers earn 92% of that benchmark salary. At this latter level, teachers in 12 of the 32 countries with available data earn as much or more than workers with tertiary education. Relative salaries for teachers are highest in Korea, Luxembourg (lower and upper secondary levels), Portugal and Spain, where teachers’ salaries are at least 20% higher than those of comparably educated workers. The lowest relative teachers’ salaries, compared to the salaries of other professionals with comparable education, are found in the Czech Republic and Hungary for pre-primary school teachers and in the Slovak Republic at all levels of education, where teachers’ salaries are, on average, less than 50% of what a full-time, full-year worker with a tertiary education earns (Table D3.2 and Chart D3.1).
definitionsActual salaries for teachers aged 25-64 refer to the annual average earnings received by full-time teachers aged 25-64, before taxes. It includes work-related payments such as annual bonuses, result-related bonuses, extra pay for holidays and sick-leave pay. Income from other sources, such as government social transfers, investment income, and any other income that is not directly related to their profession, are not included.
An adjustment to base salary is defined as any difference in salary between what a particular teacher actually receives for work performed at school and the amount that he or she would expect to receive on the basis of experience (i.e. number of years in the teaching profession). Adjustments may be temporary or permanent, and they can effectively move a teacher off the scale and to a different salary scale or to a higher step on the same salary scale.
Earnings for workers with tertiary education are average earnings for full-time, full-year workers aged 25-64 with an education at ISCED 5A/5B/6 level. The relative salary indicator is calculated for the latest year with available earnings data. For countries in which teachers’ salaries and workers’ earnings information are not available for the same year (e.g. Belgium, the Czech Republic, France, Italy, the Netherlands, Norway and Sweden), the indicator is adjusted for inflation using the deflators for private consumption. Reference statistics for earnings for workers with tertiary education are provided in Annex 3.
Salaries after 15 years of experience refer to the scheduled annual salary of a full-time classroom teacher with the minimum training necessary to be fully qualified plus 15 years of experience.
Starting salaries refer to the average scheduled gross salary per year for a full-time teacher with the minimum training necessary to be fully qualified at the beginning of the teaching career; maximum salaries refers to the maximum annual salary (top of the salary scale) for a full-time classroom teacher with the maximum qualifications recognised for compensation.
Statutory salaries refer to scheduled salaries according to official pay scales. The salaries reported are gross (total sum paid by the employer) less the employer’s contribution to social security and pension, according to existing salary scales. Salaries are “before tax”, i.e. before deductions for income tax. In Table D3.3, salary per hour of net contact time divides a teacher’s annual statutory salary by the annual net teaching time in hours (see Table D4.1).
Larger gender differences are shown in the ratio of teachers’ salaries to earnings for tertiary-educated workers aged 25-64. On average across all levels of education, male teachers aged 25-64 earn less than 85% of the salary of a tertiary-educated, 25-64 year-old full time, full-year male worker. Female teachers aged 25-64 are paid more than 85% (pre-primary level) to up to 103% (upper secondary level) of that benchmark salary. This higher ratio among female teachers reflects the persisting gender gap in earnings in the labour market, but not for the teaching profession, making the teaching profession particularly attractive to women, compared to other professions (Tables D3.2 and D3.4).
D3
How much are teachers paid? – InDIcator D3 chapter D
methodologyData on statutory teachers’ salaries and bonuses are derived from the 2013 OECD-INES Survey on Teachers and the Curriculum. Data refer to the school year 2011-12 and are reported in accordance with formal policies for public institutions.
Data on teachers’ salary at upper secondary level refer only to general programmes.
Measuring the statutory salary of a full-time teacher relative to the number of hours per year that a teacher is required to spend teaching does not adjust salaries for the amount of time that teachers spend in various other teaching-related activities. Since the proportion of teachers’ working time spent teaching varies across OECD countries, statutory salaries per hour of net teaching time must be interpreted with caution (see Indicator D4). However, it can provide an estimate of the cost of the actual time teachers spend in the classroom.
Gross teachers’ salaries were converted using PPPs for private consumption from the OECD National Accounts database. Prior to the 2012 edition of Education at a Glance, salaries used to be converted using PPPs for GDP. As a consequence, teachers’ salaries in USD (Table D3.1) are not directly comparable with the figures published prior to the 2012 edition of Education at a Glance. Information on trends in teachers’ salaries can be found in Table D3.5. As a complement to Table D3.1, which presents teachers’ salaries in equivalent USD, converted using PPPs, a table with teachers’ salaries in national currency is included in Annex 2. The period of reference for teachers’ salaries is from 1 July 2011 to 30 June 2012. The reference date for PPPs is 2011-12.
For calculation of changes in teachers’ salaries (Table D3.5), the deflator for private consumption is used to convert salaries to 2005 prices.
The ratio of teachers’ salaries to earnings for full-time, full-year workers with tertiary education aged 25-64 is calculated using the annual average salaries (including bonuses and allowances) for teachers aged 25-64, for countries with available data (Table D3.4). For other countries, the ratio is calculated using the statutory salaries of teachers with 15 years of experience and the minimum required training. The methodology used for each country is provided in Table D3.2.
Notes on definitions and methodologies for each country are provided in Annex 3, available at www.oecd.org/edu/eag.htm.
Note regarding data from Israel
The statistical data for Israel are supplied by and are under the responsibility of the relevant Israeli authorities. The use of such data by the OECD is without prejudice to the status of the Golan Heights, East Jerusalem and Israeli settlements in the West Bank under the terms of international law.
ReferencesOECD (2013), PISA 2012 Results: What Makes Schools Successful? (Volume IV): Resources, Policies and Practices, PISA, OECD Publishing, Paris, http://dx.doi.org/10.1787/9789264201156-en.
OECD (2012), Education at a Glance 2012: OECD Indicators, OECD Publishing, Paris, http://dx.doi.org/10.1787/eag-2012-en.
Santiago, P. (2004), “The labour market for teachers”, in G. Johnes and J. Johnes (eds), International Handbook on the Economics of Education, Edward Elgar, Cheltenham.
tables of indicator d31 2 http://dx.doi.org/10.1787/888933119815
Table D3.1 Teachers’ statutory salaries at different points in their careers (2012)
Table D3.2 Teachers’ salaries relative to earnings for full-time, full-year workers with tertiary education (2012)
Table D3.3 Comparison of teachers’ statutory salaries (2012)
Table D3.4 Average actual teachers’ salaries (2012)
Table D3.5 Trends in teachers’ salaries between 2000 and 2012 …
Table D3.1. [1/2] Teachers’ statutory salaries at different points in their careers (2012)Annual salaries in public institutions, in equivalent USD converted using PPPs for private consumption
Pre-primary education Primary education
Starting salary,
minimum training
Salary after 10 years of experience, minimum training
Salary after 15 years of experience, minimum training
Salary at top of scale,
minimum training
Starting salary,
minimum training
Salary after 10 years of experience, minimum training
Salary after 15 years of experience, minimum training
1. Salaries of teachers with typical qualification instead of minimum. Please refer to Annex 3 for salaries of teachers with minimum qualification. 2. Includes kindergarten teachers only for pre-primary education.3. Includes average bonuses for overtime hours for lower and upper secondary teachers. 4. Actual base salaries.5. Year of reference 2011.6. Salaries after 11 years of experience for columns 2, 6, 10 and 14.Sources: OECD. Argentina, China, Colombia, India, Indonesia, Saudi Arabia, South Africa: UNESCO Institute for Statistics. See Annex 3 for notes (www.oecd.org/edu/eag.htm).Please refer to the Reader’s Guide for information concerning the symbols replacing missing data.1 2 http://dx.doi.org/10.1787/888933119834
chapter D The Learning Environment and Organisation of Schools
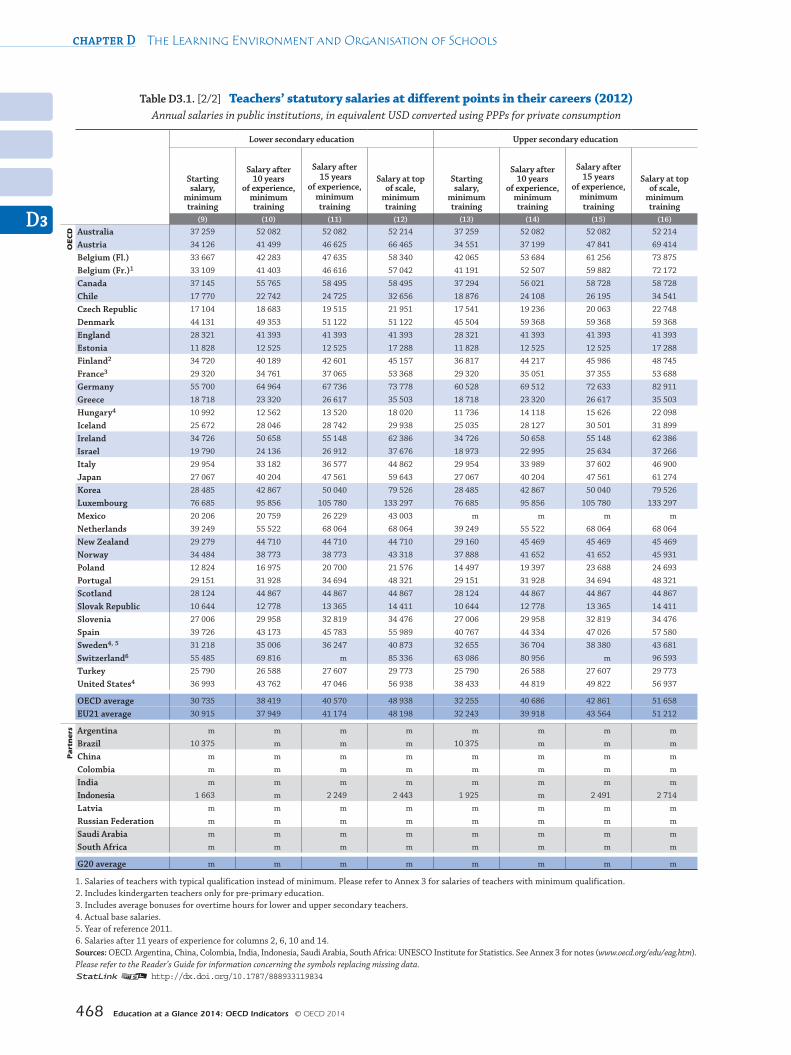
Table D3.1. [2/2] Teachers’ statutory salaries at different points in their careers (2012)Annual salaries in public institutions, in equivalent USD converted using PPPs for private consumption
1. Salaries of teachers with typical qualification instead of minimum. Please refer to Annex 3 for salaries of teachers with minimum qualification. 2. Includes kindergarten teachers only for pre-primary education.3. Includes average bonuses for overtime hours for lower and upper secondary teachers. 4. Actual base salaries.5. Year of reference 2011.6. Salaries after 11 years of experience for columns 2, 6, 10 and 14.Sources: OECD. Argentina, China, Colombia, India, Indonesia, Saudi Arabia, South Africa: UNESCO Institute for Statistics. See Annex 3 for notes (www.oecd.org/edu/eag.htm).Please refer to the Reader’s Guide for information concerning the symbols replacing missing data.1 2 http://dx.doi.org/10.1787/888933119834
D3
How much are teachers paid? – InDIcator D3 chapter D
Table D3.2. Teachers’ salaries relative to earnings for full-time, full-year workers with tertiary education (2012)Ratio of salary, by age group and gender
Method1 Year of reference
25-64 year-olds
Pre-primary education
Primary education
Lower secondary education
Upper secondary education
(1) (2) (3) (4) (5) (6)
oecd Australia Actual 2012 0.89 0.93 0.93 0.93
Austria Statutory 2012 0.55 0.55 0.60 0.61
Belgium (Fl.)2 Actual 2012 0.88 0.89 0.87 1.13Belgium (Fr.)2 Actual 2012 0.82 0.82 0.82 1.01Canada Statutory 2011 1.05 1.05 1.05 1.06 Chile Actual 2011 0.73 0.73 0.73 0.77 Czech Republic Actual 2012 0.46 0.54 0.54 0.58Denmark Actual 2012 0.83 0.92 0.92 1.06England3 Actual 2012 0.86 0.86 0.95 0.95 Estonia Actual 2012 0.61 0.84 0.84 0.84 Finland4 Actual 2012 0.65 0.89 0.97 1.09France Actual 2012 0.73 0.72 0.86 0.95Germany Actual 2012 m 0.88 0.97 1.05 Greece Actual 2012 0.89 0.89 0.93 0.93 Hungary Actual 2012 0.47 0.53 0.53 0.59Iceland m m m m m mIreland Statutory 2011 m 0.81 0.81 0.81 Israel Actual 2012 0.80 0.87 0.85 0.88 Italy Actual 2012 0.60 0.60 0.65 0.69Japan m m m m m mKorea Statutory 2012 1.32 1.36 1.36 1.36 Luxembourg Actual 2012 1.11 1.11 1.26 1.26 Mexico m m m m m mNetherlands Actual 2012 0.69 0.69 0.82 0.82New Zealand Actual 2011 m 1.04 1.06 1.09Norway Actual 2012 0.63 0.71 0.71 0.76 Poland Actual 2012 0.71 0.82 0.83 0.82Portugal Statutory 2011 1.23 1.23 1.23 1.23Scotland3, 5 Actual 2012 0.83 0.83 0.83 0.83 Slovak Republic Statutory 2012 0.35 0.43 0.43 0.43 Slovenia Statutory 2012 0.79 0.79 0.79 0.79Spain Statutory 2011 1.20 1.20 1.32 1.35Sweden6 Actual 2011 0.75 0.82 0.82 0.87 Switzerland m m m m m mTurkey Statutory 2012 1.09 1.09 1.13 1.13United States Actual 2012 0.65 0.67 0.68 0.70
OECD average 0.80 0.85 0.88 0.92EU21 average 0.76 0.81 0.85 0.90
part
ners Argentina m m m m m m
Brazil m m m m m mChina m m m m m mColombia m m m m m mIndia m m m m m mIndonesia m m m m m mLatvia m m m m m mRussian Federation m m m m m mSaudi Arabia m m m m m mSouth Africa m m m m m m
G20 average m m m m
Note: Columns showing teachers’ salaries relative to earnings for full-time, full-year workers with tertiary education, broken down by age groups and gender (i.e. columns 7-30) are available for consultation on line (see StatLink below).1. The “Actual” method refers to the ratio of average actual salary, including bonuses and allowances, for teachers aged 25-64 to earnings for full-time, full-year workers with tertiary education aged 25-64. The “Statutory” method refers to the ratio of teachers’ statutory salary after 15 years of experience and minimum training (regardless of age) to earnings for full-time, full-year workers with tertiary education aged 25-64.2. Data on earnings for full-time, full-year workers with tertiary education refer to Belgium.3. Data on earnings for full-time, full-year workers with tertiary education refer to the United Kingdom.4. Includes kindergarten teachers only for pre-primary education.5. Includes all teachers, irrespective of their age.6. Average actual teachers’ salaries, not including bonuses and allowances.Sources: OECD. Argentina, China, Colombia, India, Indonesia, Saudi Arabia, South Africa: UNESCO Institute for Statistics. See Annex 3 for notes (www.oecd.org/edu/eag.htm).Please refer to the Reader’s Guide for information concerning the symbols replacing missing data.1 2 http://dx.doi.org/10.1787/888933119853
chapter D The Learning Environment and Organisation of Schools
Table D3.3. Comparison of teachers’ statutory salaries (2012)Ratio of salaries at different points of teaching experience, with minimum training and salary per hour
in USD converted using PPPs for private consumption
Ratio of salary at top of scale to starting salary
Years from starting to top salary (lower
secondary education)
Salary per hour of net contact (teaching) time after 15 years of experience
United States2 1.70 1.62 1.54 1.48 m 41 43 46 1.14
OECD average 1.58 1.61 1.61 1.62 24 50 59 68 1.32
EU21 average 1.52 1.55 1.56 1.59 25 52 62 71 1.36
part
ners Argentina3 m m m m 25 m m m m
Brazil m m m m m m m m m
China m m m m m m m m m
Colombia m m m m m m m m m
India m m m m m m m m m
Indonesia 1.44 1.44 1.47 1.41 32 2 3 3 2.16
Latvia m m m m m m m m m
Russian Federation m m m m m m m m m
Saudi Arabia m m m m m m m m m
South Africa m m m m m m m m m
G20 average m m m m m m m m m
1. Includes kindergarten teachers only for pre-primary education.2. Actual base salaries. 3. Year of reference 2011.Sources: OECD. Argentina, China, Colombia, India, Indonesia, Saudi Arabia, South Africa: UNESCO Institute for Statistics. See Annex 3 for notes (www.oecd.org/edu/eag.htm).Please refer to the Reader’s Guide for information concerning the symbols replacing missing data.1 2 http://dx.doi.org/10.1787/888933119872
D3
How much are teachers paid? – InDIcator D3 chapter D
Note: Columns showing average actual teachers’ salaries, broken down by age groups and gender (i.e. columns 5-28), are available for consultation on line (see StatLink below).1. Includes kindergarten teachers only for pre-primary education.2. Year of reference 2011.3. Includes all teachers, irrespective of their age.4. Average actual teachers’ salaries, not including bonuses and allowances.5. Average actual teachers’ salaries for all teachers, irrespective of the level of education they teach.Sources: OECD. Argentina, China, Colombia, India, Indonesia, Saudi Arabia, South Africa: UNESCO Institute for Statistics. See Annex 3 for notes (www.oecd.org/edu/eag.htm).Please refer to the Reader’s Guide for information concerning the symbols replacing missing data.1 2 http://dx.doi.org/10.1787/888933119891
chapter D The Learning Environment and Organisation of Schools
Table D3.5. Trends in teachers’ salaries between 2000 and 2012Index of change between 2000 and 2012 in statutory teachers’ salaries after 15 years of experience and minimum training (2005 = 100),
by level of education, converted to constant prices using deflators for private consumption
Norway m 100 104 108 109 m 100 104 108 109 m 100 106 110 110Poland m 100 116 120 123 m 100 115 118 121 m 100 113 117 120Portugal 87 100 109 111 93 87 100 109 111 93 87 100 109 111 93Scotland 82 100 99 97 93 82 100 99 97 93 82 100 99 97 93Slovak Republic m m m m m m m m m m m m m m mSlovenia m 100 108 107 104 m 100 108 107 104 m 100 108 107 104Spain 95 100 107 101 97 92 100 106 99 95 96 100 106 99 95Sweden3 94 100 m 103 m 92 100 m 104 m 91 100 m 102 m
Brazil m m m m m m m m m m m m m m mChina m m m m m m m m m m m m m m mColombia m m m m m m m m m m m m m m mIndia m m m m m m m m m m m m m m mIndonesia m m m m m m m m m m m m m m mLatvia m m m m m m m m m m m m m m mRussian Federation m m m m m m m m m m m m m m mSaudi Arabia m m m m m m m m m m m m m m mSouth Africa m m m m m m m m m m m m m m m
G20 average m m m m m m m m m m m m m m m
Note: Years 2006, 2007, 2008, 2009 (i.e. columns 3-6, 12-15, 21-24) are available for consultation on line (see StatLink below).1. Break in time series following methodological changes in 2012.2. Break in time series following methodological changes in 2009.3. Actual base salaries.4. Salaries after 11 years of experience.Sources: OECD. Argentina, China, Colombia, India, Indonesia, Saudi Arabia, South Africa: UNESCO Institute for Statistics. See Annex 3 for notes (www.oecd.org/edu/eag.htm).Please refer to the Reader’s Guide for information concerning the symbols replacing missing data.1 2 http://dx.doi.org/10.1787/888933119910