Knowledge and Management of Aquatic Ecosystems (2013) 411, 08 http://www.kmae-journal.org c ONEMA, 2013 DOI: 10.1051/kmae/2013075 Indicator value of lotic water mites (Acari: Hydrachnidia) and their use in macroinvertebrate-based indices for water quality assessment purposes F.P. Miccoli (1) , P. Lombardo (1,2) , , B. Cicolani (1) Received April 7, 2013 Revised July 15, 2013 Accepted August 20, 2013 ABSTRACT Key-words: water mites, biotic indices, water quality The Water Framework Directive (WFD) of the European Union includes benthic macroinvertebrates for the ecological assessment of running wa- ters. The invertebrate-based Star-ICMi index, adopted in 2010, does not include Hydrachnidia (water mites) in its complex formulation. However, Hydrachnidia are associated with many environmental variables and may be useful for stream ecological characterization. We have therefore as- sessed the bioindicator value of Hydrachnidia in streams of central Italy, and the ability of two mite-containing (the PTH and the newly formulated PTH fam indices) and four mite-excluding biotic indices (Star-ICMi, BMWP, ASPT, and IBE) to characterize 216 sites ranging from semipristine to im- pacted. Mite bioindicator value was high at family level. Index reliabil- ity was consistently low for the PTH and ASPT indices. Distribution of mite families across quality classes (QCs) was fully separated only for the PTH fam index. QC assignment remained reliable at high index values (i.e., at high ecological status) for the PTH fam and BMWP indices, while logarith- mic correlations between the PTH fam and the other indices suggest that the latter may misrepresent sites in high, good, and moderate ecologi- cal status sensu WFD. Further studies on the PTH fam index are warranted in light of its simplicity, high reliability, and low sampling and taxonomic identification effort. RÉSUMÉ Valeur d’indicateur des acariens d’eau courante (Acari : Hydrachnidia) et leur utilisation dans les indices macro-invertébrés pour l’évaluation de la qualité de l’eau Mots-clés : acariens aquatiques, indices biotiques, qualité de l’eau La Directive Cadre sur l’Eau (DCE) de l’Union européenne comprend les macroin- vertébrés benthiques pour l’évaluation écologique des eaux courantes. L’indice invertébré Star-ICMi, adopté en 2010, ne comprend pas les Hydrachnidia (hydra- cariens) dans sa formulation complexe. Cependant, les Hydrachnidia sont asso- ciés à de nombreuses variables environnementales et peuvent être utiles pour la caractérisation écologique des cours d’eau. Nous avons donc évalué la valeur de bioindicateurs des Hydrachnidia dans les ruisseaux du centre de l’Italie, et la capa- cité des deux indices prenant en compte les acariens (les indices PTH et PTH fam nouvellement formulé) et de quatre indices biotiques ne prenant pas en compte les acariens (Star-ICMi, BMWP, ASPT, et BIE) pour caractériser 216 sites allant de (1) Department of Civil, Architectural and Environmental Engineering (DICEAA) - M. Giustini Ecology Lab; Coppito Science Center; University of L’Aquila; via Vetoio 20 - Coppito; 67100 L’Aquila, Italy (2) Limno Consulting; via Bedollo 303, 00124 Rome, Italy Corresponding author: [email protected]; [email protected]Article published by EDP Sciences
The Water Framework Directive (WFD) of the European Union includesbenthic macroinvertebrates for the ecological assessment of running wa-ters. The invertebrate-based Star-ICMi index, adopted in 2010, does notinclude Hydrachnidia (water mites) in its complex formulation. However,Hydrachnidia are associated with many environmental variables and maybe useful for stream ecological characterization. We have therefore as-sessed the bioindicator value of Hydrachnidia in streams of central Italy,and the ability of two mite-containing (the PTH and the newly formulatedPTHfam indices) and four mite-excluding biotic indices (Star-ICMi, BMWP,ASPT, and IBE) to characterize 216 sites ranging from semipristine to im-pacted. Mite bioindicator value was high at family level. Index reliabil-ity was consistently low for the PTH and ASPT indices. Distribution ofmite families across quality classes (QCs) was fully separated only for thePTHfam index. QC assignment remained reliable at high index values (i.e.,at high ecological status) for the PTHfam and BMWP indices, while logarith-mic correlations between the PTHfam and the other indices suggest thatthe latter may misrepresent sites in high, good, and moderate ecologi-cal status sensu WFD. Further studies on the PTHfam index are warrantedin light of its simplicity, high reliability, and low sampling and taxonomicidentification effort.
RÉSUMÉ
Valeur d’indicateur des acariens d’eau courante (Acari : Hydrachnidia) et leur utilisationdans les indices macro-invertébrés pour l’évaluation de la qualité de l’eau
Mots-clés :acariensaquatiques,indicesbiotiques,qualité de l’eau
La Directive Cadre sur l’Eau (DCE) de l’Union européenne comprend les macroin-vertébrés benthiques pour l’évaluation écologique des eaux courantes. L’indiceinvertébré Star-ICMi, adopté en 2010, ne comprend pas les Hydrachnidia (hydra-cariens) dans sa formulation complexe. Cependant, les Hydrachnidia sont asso-ciés à de nombreuses variables environnementales et peuvent être utiles pour lacaractérisation écologique des cours d’eau. Nous avons donc évalué la valeur debioindicateurs des Hydrachnidia dans les ruisseaux du centre de l’Italie, et la capa-cité des deux indices prenant en compte les acariens (les indices PTH et PTHfam
nouvellement formulé) et de quatre indices biotiques ne prenant pas en compteles acariens (Star-ICMi, BMWP, ASPT, et BIE) pour caractériser 216 sites allant de
(1) Department of Civil, Architectural and Environmental Engineering (DICEAA) - M. Giustini Ecology Lab;Coppito Science Center; University of L’Aquila; via Vetoio 20 - Coppito; 67100 L’Aquila, Italy(2) Limno Consulting; via Bedollo 303, 00124 Rome, Italy� Corresponding author: [email protected]; [email protected]
semipristine à pollués. La valeur bioindicatrice des hydracariens est élevée au ni-veau de la famille. La fiabilité de l’indice était toujours faible pour les indices PTHet ASPT. La répartition des familles d’acariens dans toutes les classes de qualité(QCs) a été entièrement réalisée seulement pour l’indice PTHfam. L’affectation QCest restée fiable à des valeurs d’indice élevé (c’est-à-dire, très bon état écologique)pour les indices de PTHfam et BMWP, tandis que les corrélations logarithmiquesentre le PTHfam et les autres indices donnent à penser que celui-ci peut mal es-timer les sites en très bon, bon et état écologique modéré sensu DCE. D’autresétudes sur l’indice PTHfam sont justifiées en raison de sa simplicité, sa grandefiabilité et d’un faible effort d’échantillonnage et d’identification taxonomique.
INTRODUCTION
The economical and technological development of the European Union (EU) has led to in-creased stress and deterioration on Europe’s aquatic ecosystems. Ever-increasing water useand pollution, human modifications of watercourse hydrography, removal of riparian vegeta-tion, and human-driven changes in land use have brought about the loss of aquatic biodiver-sity (Allan and Flecker, 1993; Allan, 2004; Suriano et al., 2011).The identification of reliable indicators of environmental quality is a key theme in appliedecological research. Limnologists are developing monitoring strategies based on biologicalindicators and indices that synthetically express ecosystem structure and functioning, whileseparating human-derived impacts from natural variability. One of the main difficulties en-countered in developing environmental indices is the selection of appropriate indicators thatreflect ecosystem complexity in the simplest, most synthetic terms.The EU’s Water Framework Directive (WFD), an all-encompassing program for monitoring,evaluating, and improving the ecological status of Europe’s aquatic ecosystems, bases itsdefinition of ecological status on ecological research. The basic principle of the WFD is thatwater resources need to fulfill as many environmental functions as possible without sacri-ficing their long-term sustainability and accessibility. The WFD has therefore abandoned theold-fashioned concept of ecosystem protection through the establishment of isolated naturereserves specifically targeting faunal and floristic conservation. Instead, the WFD’s scope isthe protection and improvement of the ecological status of all aquatic ecosystems from de-terioration, thus promoting a long-term sustainable use of water resources (EU, 2000).While the main goal of the WFD remains EU-wide, the development and (inter)calibrationof the necessary monitoring and evaluation methods have been delegated to the individualMember States (MSs), whose initial task was the identification of the biological parametersthat best describe the ecological status of surface waters. For running waters, such biologi-cal parameters include macrophytes, benthic diatoms, fish, and benthic macroinvertebrates(Johnson et al., 2006). Each parameter is described by a numerical index expressed as theratio between the observed ecological quality and a reference condition, defined as the eco-logical status expected in the absence (or with the lowest degree) of human disturbance. Thenumerical values of all such indices are therefore expressed as Ecological Quality Ratios, orEQRs (Buffagni et al., 2005) (Figure 1).Reference sites have been or are being identified and EQR metrics have been (are being) cal-culated for each biological parameter, for each ecosystem type and for each hydroecoregion(Buffagni et al., 2007). The STAR-ICMi index has been adopted eventually for stream assess-ments based on benthic macroinvertebrates (Buffagni and Furse, 2006). Benthic macroinver-tebrates are widely used in biotic indices (e.g. Dallas, 2012).The observation of the close relationship between water mite ecology and environmentalconditions and the consequent argument for water mites as environmental bioindicators dateback to the early 20th century (Walter, 1924; Viets, 1936). Such early arguments are sup-ported by more recent observations in lotic and lentic systems (Schwoerbel, 1964; Biesiadka
Figure 1The five quality classes (QCs) defined by the Water Framework Directive (WFD) on the basis of theecological quality ratio (EQR), for Europe’s aquatic ecosystems. EQRs are defined for each area andecosystem type on the basis of the least impacted localities in the area. High-quality sites are thosefor which EQR ≈1, i.e., for which the observed conditions depart only little from reference conditions.According to the WFD, ecological status is acceptable for sites classifed in “high” or “good” ecologicalstatus (QCs I and II, respectively), while sites in “poor” to “moderate” status (QCs III–V) need to bebrought up to acceptable ecological status through the implementation of ad hoc restoration plans.Terminology and color coding according to EC (2000).
and Kowalik, 1991; Cicolani and Di Sabatino, 1991; Gerecke and Schwoerbel, 1991; Smitand van der Hammen, 1992; Growns, 2001; Dohet et al., 2008; Cicolani et al., 2009; Davieset al., 2010; Quiroga et al., 2010; Cîmpean, 2010). These studies have pointed out that watermites become scarce already in moderately polluted waters and tend to disappear altogetherat highly impacted sites (e.g., urban or industrial discharge points) where other macroinverte-brates can still be found (Davies et al., 2010; Alvial et al., 2013). Furthermore, sensitive taxatend to be replaced with tolerant taxa at sites with highly modified habitats (e.g., concrete-covered banks) (Gerecke and Schwoerbel, 1991; van der Hammen and Smit, 1996; Growns,2001). Water mite assemblages can be effective environmental indicators also because ofthe network of interactions with the rest of the benthic community on which mites dependto successfully complete their complex life cycle that includes distinct phases of parasitism,phoresy, predation, and competition (Proctor and Pritchard, 1989; Di Sabatino et al., 2008;Smit and Gerecke, 2010).Despite sharing these characteristics with other macroinvertebrates, water mites are rarelyutilized as bioindicators of pollution or disturbance (Resh and McElravy, 1993; Dohet et al.,2008). In the rare cases of inclusion in studies of invertebrate–environment associations andinvertebrate-based indices of environmental quality, water mites are typically treated as asingle taxonomic unit (“Hydrachnidia”: e.g., Barber and Kevern, 1973; Pardo and Armitage,1997; Kubošová et al., 2010; Alvial et al., 2013); however, water mites have been altogetherexcluded from the WFD list of biological parameters (Smit and Gerecke, 2010).The main scopes of our work are 1. an assessment of water mite value as bioindicators basedon an analysis of abundance and diversity as related to varied levels of pollution, and 2. theproposal of a numerical index of water quality for running-water ecosystems that includeswater mites at family level.
MATERIALS AND METHODS
> SAMPLE COLLECTION AND STUDY AREA
The investigation is based on a total of 216 quantitative samples of lotic benthic macroin-vertebrates collected with a Surber sampler (mesh size 0.47 mm), mainly in riffle habitats.Sampling sites were never above 1000 m a.s.l. Samples cover a 25-year period (1986–2011)and were collected year-long in ice-free conditions at 81 locations distributed over 34 streams
in five administrative Regions in south-central Italy (Figure 2). Each site was visited 1–6 times;multiple visits (typically carried out within specific monitoring programs) were separated by atleast two months. This area includes the Apennines that form a continuous NW–SE watershedridge separating Adriatic from Thyrrhenic catchments. The Corno Grande peak (2912 m a.s.l.)of the Gran Sasso massif in Abruzzo is also the highest peak south of the Alps. Such high-altitude areas have an alpine climate. Much of the Gran Sasso massif and adjacent montaneareas are organized in protected National and Regional Parks and Nature Reserves with mini-mal to nonexistent human presence. Most streams in this area are relatively short and presenta gradient from torrential in the montane headwater to river-like in the lowlands; the latter arecharacterized by dense human populations and extensive urban, agricultural, and industrialland use. Most streams and rivers follow a general W–E course with final discharge into theAdriatic Sea. Such environmental and demographic characteristics lead to sampling locali-ties distributed over a wide range of human impact and stream/river ecological status withina relatively small geographical area.Sample collection and processing were carried out by the same laboratory, guaranteeingconsistent methods and minimizing sampling variability. Samples were transported in coolersto the laboratory where they were immediately fixed in 75% ethilic alcohol. Hydrachnidiawere fixed in Koenike solution following Di Sabatino et al. (2000). Macroinvertebrates were
identified at the stereomicroscope at species to family level. A total of 17823 individuals m−2
distributed over 116 families were found. Water mites comprised 16 families and 77 taxa, 74 ofwhich identified at species level and 3 at genus level. A family-based Coleman rarefactioncurve (Figure 3) revealed that 95% and 99% of the observed 116 families were accountedfor after 34 and 90 samples, respectively, indicating that the grand total of 216 samples wasmore than adequate for the investigation. No singletons or doubletons (families representedby only one or two individuals, respectively) were observed. Minimum and maximum mitedensity per sample and per family were 3 and 800 individuals m−2 of substrate, respectively.Hydrachnidia have been the focus of a detailed quantitative analysis aimed at finding a re-lationship between the water mite taxocoenosis and local water quality; the latter has beenevaluated by means of six macroinvertebrate-based biotic indices: STAR-ICMi, BMWP, ASPT,IBE, PTH, and the newly proposed index PTHfam.
> DESCRIPTION OF BIOTIC INDICES
We included six macroinvertebrate-based indices that directly relate to biotic (water) quality.The Star-ICMi index (Buffagni et al., 2008) is the pan-European standardized index for WFDimplementation, and has recently (2010) been officially adopted by Italy for the same pur-pose. The BMWP and ASPT indices are based on taxon-specific tolerance scores and havewidespread use in a number of countries since their introduction in the 1980s; however, wa-ter mites are now excluded from index calculations after inclusion (as “Hydrachnidia”) in theoriginal formulations. The IBE index is the index used in Italy before the adoption of the WFD-compliant Star-ICMi index. The PTH index has been utilized only once previously (Miccoliet al., 2006), but is the first index to focus on water mites along with other important taxa.Finally, we propose a new index, the PTHfam, which has been derived from the PTH but isbased on a finer taxonomic resolution.STAR-ICMi. The STAndardization of River Classifications – Intercalibration Multimetric Index(Buffagni et al., 2008, and references therein) integrates six different metrics:
• total number of observed families;• number of plecopteran, trichopteran, and ephemeropteran families (EPT index);• average score per taxon (ASPT index, as ASPT–2: Bennett et al., 2011);• Shannon-Wiener diversity index H′ calculated with natural logarithms;• 1 – relative abundance of gastropods, oligochaetes, and dipterans (1 – GOLD);
• the base-10 logarithm of the total abundance of selected families of ephemeropterans,plecopterans, trichopterans, and dipterans, corrected with a +1 constant to produce azero-to-∞ scale [log (sel EPTD + 1)].
These six metrics aim at expressing a synthetic information on the tolerance to disturbedconditions, the structure (richness, diversity) and the abundance–habitat relationship of themacroinvertebrate community. To this end, the STAR-ICMi index assigns different weights tothe six metrics in an attempt to balance the three aspects that define the ecological conditionof the community as outlined above: the number of families, the EPT index, and the Shannon-Wiener index describe the structure of the community; the ASPT index describes the taxon-specific degree of tolerance to pollution; and the 1–GOLD and log (sel EPTD + 1) metricsdescribe the abundance–habitat relationship of the macroinvertebrate community.BMWP. THE BMWP index (Biological Monitoring Working Party: Alba-Tercedor et al., 1988)is based on taxonomic resolution at family level, with a score that represents each family’ssensitivity or tolerance to pollution or disturbance sensu latu. Scores vary from 1 to 10, with10 representing the highest sensitivity or lowest tolerance to pollution/disturbance. The totalor site score is given by the sum of all the family-specific scores at the site. The BMWP indexhas been subsequently standardized following regional or national surveys, and score thresh-olds have been established to define the five QCs according to WFD guidelines (Figure 1).ASPT. The ASPT index (Average Score Per Taxon: Armitage et al., 1983) is obtained by di-viding the BMWP index value by the number of observed families, which renders the indexindependent of taxonomic richness. The ASPT index also appears to be less site-specificand less sensitive to seasonal variations in macroinvertebrate community structure than theBMWP from which it is derived. Typically, ASPT values > 6 are indicative of unimpacted wa-ters, while index values < 4 identify highly impacted sites (Mandaville, 2002).IBE. The Indice Biotico Esteso (or Extended Biotic Index: Ghetti, 1997) had been the officialItalian index until the adoption of the WFD-compliant Star-ICMi in 2010. The IBE index quan-tifies the effect of physico-chemical water quality on benthic macroinvertebrates that spendat least part of their life cycle in lotic ecosystems and identifies five QCs, from I (minimallyimpacted) to V (highly impacted).PTH. The PTH index (Miccoli et al., 2006) is based on the presence/absence of Plecoptera,Trichoptera and Hydrachnidia. The choice of such groups is based on their sensitivity to envi-ronmental stress and their high degree of ecological specialization. Each group contributes tothe PTH score differently, according to its “ecological value” and contribution to communityfunctionality. The combination of the presence/absence of these three groups gives scoresfrom zero (no plecoptera, trichoptera, or hydrachnidia found) to 6 (simultaneous presence ofthe three groups), for a total of seven possible QCs. The three worst quality classes havebeen lumped into one (QC V) for the purposes of this study. The PTH index was originallydeveloped to evaluate the water quality of spring ecosystems.PTHfam. This newly proposed index is the total number of plecopteran, trichopteran, and hy-drachnidian families found at a site. This index is a reelaboration of the PTH index at a finertaxonomic level, and is the first benthic macroinvertebrate index to include water mites at fam-ily level. The PTHfam index identifies five QCs based on semiquantitative mite, plecopteran,and trichopteran distribution patterns relative to general stream ecological status; on otherindices; and on our expert judgment (Table I). The full rationale for the choice of QC-specificPTHfam values is not reported here for the sake of conciseness, but the strictly quantitativeverification is.
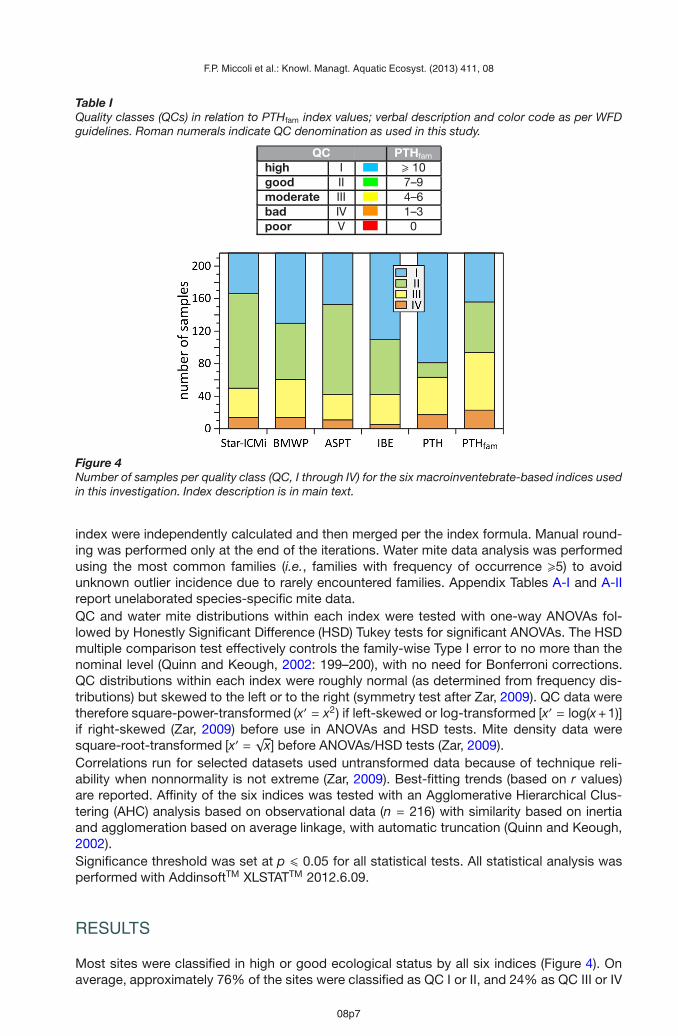
Table IQuality classes (QCs) in relation to PTHfam index values; verbal description and color code as per WFDguidelines. Roman numerals indicate QC denomination as used in this study.
QC PTHfam
high I � 10good II 7–9moderate III 4–6bad IV 1–3poor V 0
Figure 4Number of samples per quality class (QC, I through IV) for the six macroinventebrate-based indices usedin this investigation. Index description is in main text.
index were independently calculated and then merged per the index formula. Manual round-ing was performed only at the end of the iterations. Water mite data analysis was performedusing the most common families (i.e., families with frequency of occurrence �5) to avoidunknown outlier incidence due to rarely encountered families. Appendix Tables A-I and A-IIreport unelaborated species-specific mite data.QC and water mite distributions within each index were tested with one-way ANOVAs fol-lowed by Honestly Significant Difference (HSD) Tukey tests for significant ANOVAs. The HSDmultiple comparison test effectively controls the family-wise Type I error to no more than thenominal level (Quinn and Keough, 2002: 199–200), with no need for Bonferroni corrections.QC distributions within each index were roughly normal (as determined from frequency dis-tributions) but skewed to the left or to the right (symmetry test after Zar, 2009). QC data weretherefore square-power-transformed (x′ = x2) if left-skewed or log-transformed [x′ = log(x +1)]if right-skewed (Zar, 2009) before use in ANOVAs and HSD tests. Mite density data weresquare-root-transformed [x′ =
√x] before ANOVAs/HSD tests (Zar, 2009).
Correlations run for selected datasets used untransformed data because of technique reli-ability when nonnormality is not extreme (Zar, 2009). Best-fitting trends (based on r values)are reported. Affinity of the six indices was tested with an Agglomerative Hierarchical Clus-tering (AHC) analysis based on observational data (n = 216) with similarity based on inertiaand agglomeration based on average linkage, with automatic truncation (Quinn and Keough,2002).Significance threshold was set at p � 0.05 for all statistical tests. All statistical analysis wasperformed with AddinsoftTM XLSTATTM 2012.6.09.
RESULTS
Most sites were classified in high or good ecological status by all six indices (Figure 4). Onaverage, approximately 76% of the sites were classified as QC I or II, and 24% as QC III or IV
Table IIResults of the skewness test (Zar, 2009) of QC distribution within each of the six tested indices, for whichmaximum right skewness (i.e., frequency distribution with an elongated right tail and therefore accumu-lation of observational data to the left of the average value) is
√b1 = (n − 2) /
√n − 1 = 14.59 (n = 216),
maximum left skewness (i.e., frequency distribution with an elongated left tail and accumulation of datato the right of the average value) is −√b1 = -14.59, and symmetry is for
Table IIIProportions of water mite density, number of species, and number of families (based on numbers per m−2
of substrate, as % of respective totals) in QCs I + II and III + IV according to the six indices, based onthe total of the 216 samples collected.
densityindices summary statistics
QC Star-ICMi BMWP ASPT IBE PTH PTHfam min max avg std errI + II 78.3 80.2 76.5 88.0 72.3 78.0 72.3 88.0 78.9 2.1III + IV 21.7 19.8 23.5 12.0 27.7 22.0 12.0 27.7 21.1 2.1
number of speciesindices summary statistics
QC Star-ICMi BMWP ASPT IBE PTH PTHfam min max avg std errI + II 80.2 81.5 83.0 86.9 72.5 72.5 72.5 86.9 79.4 2.4III + IV 19.8 18.5 17.0 13.1 27.5 27.5 13.1 27.5 20.6 2.4
number of familiesindices summary statistics
QC Star-ICMi BMWP ASPT IBE PTH PTHfam min max avg std errI + II 80.9 79.3 83.6 86.2 76.1 70.4 70.4 86.2 79.4 2.3III + IV 19.1 20.7 16.4 13.8 23.9 29.6 13.8 29.6 20.6 2.3
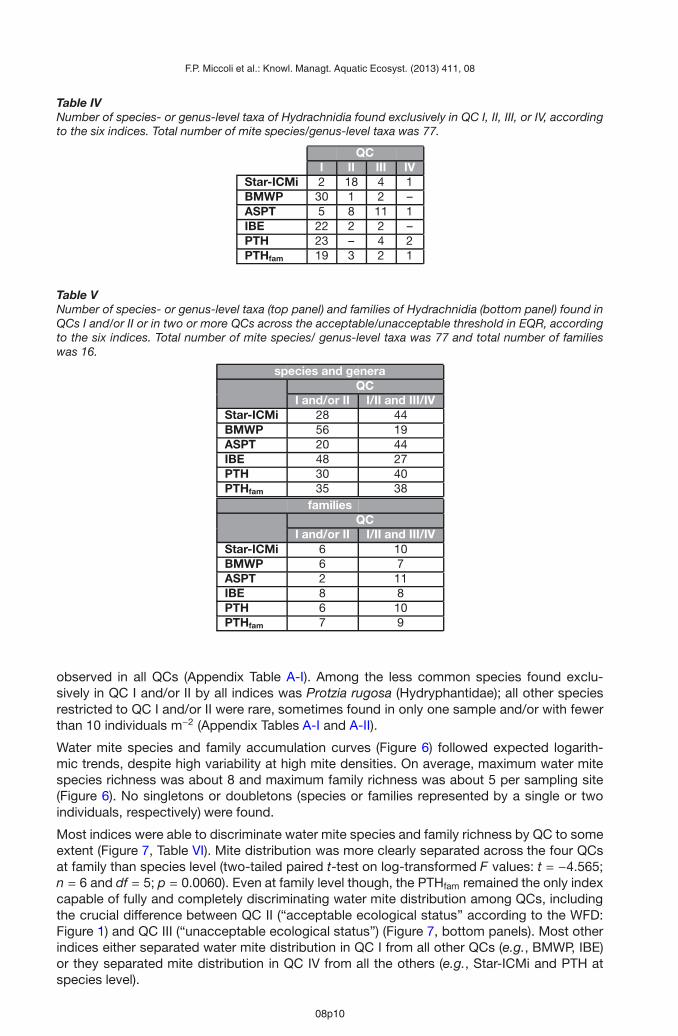
(standard error = 2.1; n = 6). Our survey did not find any site in poor ecological status (QC V).QC separation was complete and highly significant for all indices (one-way, type I ANOVAsfor each index, performed on square-power- or log-transformed data to correct for skewness:F = 371.469−7026.712, df = 3.212 and p < 0.0001 for all; complete HSD separation atp < 0.0001 for all). Frequency distribution was almost symmetrical for the BMWP index and,to a lesser extent, for the PTHfam and IBE indices, while distribution for the remaining indiceswas relatively asymmetrical (Table II). The slightly asymmetrical distribution for the BMWPand PTHfam indices was right-skewed, while the more markedly asymmetrical distributionsfor the other indices were left-skewed, with accumulation of distribution data to the right ofthe average value (i.e., average >median) (Table II).On average, ∼70–88% of water mite density, number of species, and number of families werefound in QC I and II (Table III, Figure 5). Mite distribution in QCs I and II was consistentlylowest for the PTH index and highest for the IBE index, with mite distribution in QC I + II forthe other indices at intermediate levels (Table III). Water mite representativeness in QC I + IItended to increase with decreasing taxonomic resolution for the ASPT index, and to decreasewith decreasing taxonomic resolution for the PTHfam index, while no pattern was discerniblefor the remaining indices (Table III).The majority of QC-exclusive species- or genus-level taxa (hereafter “species”) of Hydrach-nidia were found in QC I or II across the six indices (Table IV and Appendix Table A-I). Most
Figure 5Distribution (as percent of corresponding totals) of water mite density, number of species, and numberof families across the four observed QCs (I–IV) for the six indices.
of the QC-exclusive mite species tended to be placed in QC I by most indices, except by theStar-ICMi and ASPT indices. Approximately 1/4 (ASPT) to 3/4 (BMWP) of mite species werefound in QC I and/or II (Table V). The percentage of mite species found across the accept-able/unacceptable threshold for ecological status sensu the WFD (i.e., species found in QC Iand/or II and in QC III and/or IV) ranged from ∼25% (BMWP) to ∼57% (Star-ICMi and ASPT)(Table V). The pattern was similar for mite families, with ∼12% (ASPT) to ∼50% (IBE) of themite families found in QC I and/or II, and ∼44% (BMWP) to ∼69% (ASPT) of mite familiesfound in QC I/II and QC III/IV (Table V).Distribution of the most common species of Hydrachnidia, such as Feltria zschokkei (Feltri-idae), Atractides nodipalpis, A. pennatus, Hygrobates fluvialitis (Hygrobatiidae), and Leber-tia sparsicapillata (Lebertiidae) was unrelated to stream QC, with presence of these taxa
Table IVNumber of species- or genus-level taxa of Hydrachnidia found exclusively in QC I, II, III, or IV, accordingto the six indices. Total number of mite species/genus-level taxa was 77.
Table VNumber of species- or genus-level taxa (top panel) and families of Hydrachnidia (bottom panel) found inQCs I and/or II or in two or more QCs across the acceptable/unacceptable threshold in EQR, accordingto the six indices. Total number of mite species/ genus-level taxa was 77 and total number of familieswas 16.
species and generaQC
I and/or II I/II and III/IVStar-ICMi 28 44BMWP 56 19ASPT 20 44IBE 48 27PTH 30 40PTHfam 35 38
familiesQC
I and/or II I/II and III/IVStar-ICMi 6 10BMWP 6 7ASPT 2 11IBE 8 8PTH 6 10PTHfam 7 9
observed in all QCs (Appendix Table A-I). Among the less common species found exclu-sively in QC I and/or II by all indices was Protzia rugosa (Hydryphantidae); all other speciesrestricted to QC I and/or II were rare, sometimes found in only one sample and/or with fewerthan 10 individuals m−2 (Appendix Tables A-I and A-II).
Water mite species and family accumulation curves (Figure 6) followed expected logarith-mic trends, despite high variability at high mite densities. On average, maximum water mitespecies richness was about 8 and maximum family richness was about 5 per sampling site(Figure 6). No singletons or doubletons (species or families represented by a single or twoindividuals, respectively) were found.
Most indices were able to discriminate water mite species and family richness by QC to someextent (Figure 7, Table VI). Mite distribution was more clearly separated across the four QCsat family than species level (two-tailed paired t-test on log-transformed F values: t = −4.565;n = 6 and df = 5; p = 0.0060). Even at family level though, the PTHfam remained the only indexcapable of fully and completely discriminating water mite distribution among QCs, includingthe crucial difference between QC II (“acceptable ecological status” according to the WFD:Figure 1) and QC III (“unacceptable ecological status”) (Figure 7, bottom panels). Most otherindices either separated water mite distribution in QC I from all other QCs (e.g., BMWP, IBE)or they separated mite distribution in QC IV from all the others (e.g., Star-ICMi and PTH atspecies level).
Figure 6Number of water mite species (top) and families (bottom) in relation to mite density, by sampling site(n = 216 and df = 214 for each). Correlations were performed on untransformed data.
Best fits between the PTHfam and the other indices were linear for the BMWP and logarithmicfor the remaining indices (Figure 8), though the linear relationship was almost as descriptivefor the IBE (rlinear = 0.711). The “flattening” of the logarithmic trend occurred at PTHfam ≈ 4–5for all logarithmic relationships (Figure 8), i.e., it included PTHfam values for QCs I, II, and III(Table I).An agglomerative hierarchical cluster (AHC) analysis similarly identified the ASPT and PTHindices as separate from the group formed by the Star-ICMi, IBE, BMWP, and PTHfam in-dices (Figure 9). In particular, the newly proposed PTHfam was closest to the BMWP indexand secondarily to the IBE index, while the WFD-accepted Star-ICMi index resulted relativelyseparated from the core of the most similar indices (Figure 9).
DISCUSSION
Hydrachnidia and index distribution across quality classes (QCs) were generally concordant,with most sites classified as QC I or II (WFD classes of “high” and “good” ecological status,both above the acceptability threshold: Table I) and most of Hydrachnidia found in such QCs(Tables III–V; Figures 4–5), suggesting a high potential of water mites as bioindicators of unim-pacted lotic sites (Growns, 2001; Cicolani et al., 2009; Davies et al., 2010; Smith et al., 2010).However, the overall poor performance of the PTH index (Figures 7–9), based on simple,
Figure 7Average (± standard error) water mite species (top) and families (bottom) by QC (I–IV) according toeach of the six indices, using sampling sites as replicates. Different letters indicate significantly differentaverage values (p � 0.05) within each panel according to a posteriori Tukey HSD multiple tests followingsignificant one-way, type I ANOVAs. Complete ANOVA results are reported in Table VI.
Table VIResults of the one-way ANOVAs relative to Figure 7, performed on square-root-transformed count data;df = 3, 212 for each test.
direct presence/absence of Hydrachnidia as a group (Miccoli et al., 2006) strongly suggeststhat inclusion of water mites as a single group is not suitable for ecological status assess-ment in lotic systems beyond the stream head as the PTH index was originally designed forand applied in spring habitats (Miccoli et al., 2006). Such a consideration is sensible, as mosttaxa of Hydrachnidia in spring habitats would be roughly equivalent as bioindicators of unim-pacted habitats, while water mites encountered along a stream course include a mixture ofimpact-sensitive and impact-tolerant taxa (Appendix Table A-I).Bioindicator value for Hydrachnidia appears to be limited also as density, as density-basedspecies and family accumulation curves tended to flatten at ∼8 and ∼5 species or familiesrespectively when density reached ~200 individuals m−2 (Figure 6), indicating that further in-creases in density do not lead to increased mite diversity. Dense populations of common mitespecies, such as F. zschokkei, A. nodipalpis, A. pennatus, L. sparsicapillata, and especially
Figure 8Correlations between the PTHfam and the other five indices considered in this study. Best-fit curve isreported for each correlation. Correlations were run on untransformed data; n = 216 for each.
the widespread H. fluvialitis, were found across the whole range of QCs (Appendix Table A-I),strongly suggesting that mite density as such should be discarded as a metric to assessstream ecological status. Basic biological metrics such as abundance and density were foundto be unreliable as descriptors of river ecological status also elsewhere (Thiébaut et al., 2006;Lewin et al., 2013).
Most impact-sensitive species of Hydrachnidia were uncommon to very rare (AppendixTable A-I), probably also reflecting their dependence on a restricted ensemble of semiaquatic
Figure 9Agglomerative hierarchical clustering (AHC) for the six indices, performed on observational data (indexvalues) with similarity based on inertia and agglomeration method based on average linkage, with auto-matic truncation. The horizontal dashed line represents the AHC-calculated point of separation of thethree main groups of indices (ASPT; PTH; and Star-ICMi–IBE–BMWP–PTHfam).
insects (which may be impact-sensitive themselves) to complete their complex life cy-cle (Di Sabatino et al., 2000). Only one mite species as such (P. rugosa) was sufficientlyimpact-sensitive and relatively common to potentially serve as a direct bioindicator (AppendixTable A-I), further suggesting that the inherently difficult identification of water mites at specieslevel for the purpose of WFD-compliant monitoring and assessment may not be worth theeffort.
Distribution of mites in QC I + II (or across the WFD “acceptability” threshold) was similarat species and family level (Table V), and species- and family-based patterns in the distri-bution of Hydrachnidia also were similar (Figure 5), suggesting that these taxonomic levelsare potentially roughly equivalent for bioindication purposes. A clearer separation of averagenumber of mite families than species across QCs (Figure 7, Table VI, and p < 0.0001 forthe paired t-test for family-vs.-species based F values) further suggests that inclusion of Hy-drachnidia in biotic indices may be more reliable at family than species level, without the needfor time-consuming and laborious identification at species level, which often can be carriedout reliably only by highly specialized taxonomists.
Regardless of inclusion or exclusion of Hydrachnidia in their formulations, all indices discrim-inated between QCs (p < 0.0001 for all index-specific one-way ANOVAs and related HSDtests). All indices were also highly correlated with one another (p < 0.0001 for pairwise linearcorrelations; detailed results not shown), indicating that their general behavior as descriptorsof stream ecological status is roughly equivalent. The quantitatively/statistically tested behav-ior of the PTHfam index generally similar to the other indices (Figures 4, 5, 7) indicates that ouroriginal choice of PTHfam-based QCs (Table I), based on semiquantitative observations, wascorrect and reliable.
Frequency distribution of index values was quasi symmetrical only for the BMWP, the PTHfam,and to a lesser extent, the IBE indices, while distribution for the remaining indices (Star-ICMi,ASPT and PTH) was left-skewed (Table II), indicating that the latter indices tend to inflateand possibly misidentify QCs at high index values (i.e., QCs I, II, and possibly III). The Star-ICMi, ASPT, and PTH indices also had the highest degree of failure to assign mite familiesto either the QC I + II or the QC III + IV categories (number of families across the WFDacceptability threshold �10: Table V). Index ability to incorporate mite information at familylevel thus appears to be closely associated with ability to discern QCs in an unbiased fashion,with the less biased indices (those with quasi symmetrical distribution in Table II) also betterable to assign water mite families across fewer QCs (Table V).
The ASPT and PTH indices additionally failed to discriminate the distribution of Hydrachnidiaacross all QCs (nonsignificant ANOVAs or incomplete HSD separation in Figure 7). Such in-dices also stood apart according to the AHC analysis (Figure 9). Lewin et al. (2013) similarlyfound a general inability of the ASPT index to correctly identify reference sites in montane,(semi)pristine habitats, with an apparently excessively conservative behavior of the ASPT in-dex, both in absolute terms and relative to the BMWP index. The only index to clearly andunequivocally assign different numbers of mite families across QCs was the PTHfam (Figure 7),strongly suggesting that mite information for the purpose of water quality assessment is mostreliable when incorporated in this index. The second-best statistical separation of Hydrachni-dia families across QCs was for the Star-ICMi, which however failed to discriminate across theWFD acceptability threshold between QCs I/II and QCs III/IV (Figure 7), further supporting thebetter ability of the PTHfam index as a macroinvertebrate-based descriptor of stream ecologi-cal status. Lyche Solheim et al. (2013) similarly found the highest sensitivity for simple indices,and only an intermediate ability for a relatively complex multi-metric index based on benthicmacroinvertebrates to describe ecological (trophic) status in lake ecosystems, suggesting alimited power of overly integrative indices for monitoring purposes.
The PTHfam-BMWP correlation was the only linear one (Figure 8), reflecting the quasi sym-metrical index value distributions of these two indices (Table II). All other correlations with thePTHfam index were logarithmic, indicating that such indices become increasingly less sensi-tive to changes in benthic macroinvertebrate community structure as the ecological statusimproves toward (semi)pristine conditions. In fact, such indices behave like any logarithm-based indices, including the widely used Shannon-Wiener index of diversity H′, which Testiet al. (2009) found incapable of discerning any change in ecological status along the increas-ingly impacted head-to-mouth course of a ∼120-km river in central Italy. In contrast, theinvertebrate-based IBE and a macrophyte-based index indicated decreasing ecological sta-tus as the river gradually entered the human-populated lowlands. Thiébaut et al. (2006) simi-larly found a presence/absence index based on sensitive macroinvertebrate taxa as the mostreliable metric to describe river ecological status in northeastern France, while all logarithm-based diversity indices (including the H′ index) resulted unreliable. Rossaro et al. (2011) alsofound the lowest correlation scores for the H′ and a weighted H′ index among nine benthicmacroinvertebrate indices, as well as with physico-chemical variables, applied to northernItalian lakes. May (2011) strongly argued against the use of the Shannon-Wiener and otherlogarithm-based biotic indices on the grounds of their mathematical properties, which lead toasymptotic flattening at high values. Based on Figures 7 and 8, the assignment of samplingsites in QCs I, II, and/or III (PTHfam � 4–5: Table I) by the Star-ICMi, ASPT, IBE, and PTH in-dices may be questionable. Accordingly, the AHC analysis identified the PTHfam and BMWPindices as the most similar, while the WFD-accepted Star-ICMi index remained at the marginof the group of the four most similar and reliable indices (Figure 9).
Its quantitative structure and ecological basis place the newly proposed PTHfam index in thegroup of mathematically simple metrics based on incidence data (presence/absence), suchas the EPT index based on the taxonomic richness of disturbance-sensitive ephemeropteran,plecopteran, and trichopteran insects (Barbour et al., 1992). The debate over which measure –incidence or abundance – should provide the basis for general-purpose biological indices isstill open (e.g., Maurer and McGill, 2011). Abundance-based indices may be more complete,but they give greater weight to common taxa (Washington, 1984; Maurer and McGill, 2011).As our mite taxocoenosis analysis also indicates (Appendix Tables A-I and A-II), common taxausually have the lowest value as potential bioindicators while less common taxa are more typ-ically associated with specific habitats. By giving the basic same weight to common and raretaxa, incidence-based indices may thus be more effective when a bioassessment of ecolog-ical status is needed. In fact, taxonomic richness as such or organized in a numerical indexhas been found to be among the most reliable metrics to describe riverine ecological status(Thiébaut et al., 2006; Lewin et al., 2013). Mjelde et al. (2013) similarly found that macrophyteabundance or abundance-based indices to assess lake ecological status performed less wellthan otherwise identical presence/absence-based metrics, further supporting the hypothesis
that incidence-based metrics may be a more reliable tool to monitor the ecological status offreshwater ecosystems. Virtually all aspects of our quantitative analysis indeed suggest thatthe incidence-based PTHfam index is the most robust and reliable among those tested for thepurpose of macroinvertebrate-based rapid bioassessment of lotic ecosystems.Our analysis demonstrates that relatively simple indices such as the BMWP and the newlyproposed PTHfam perform better and more reliably than the WFD-compliant Star-ICMi index,which is additionally based on a labor-intensive sampling design and data reduction. TheBMWP and PTHfam indices also are capable of detecting subtle changes in stream condi-tion at high and good ecological status, potentially serving as sentinel indices at the onset ofecological deterioration. Furthermore, the PTHfam is the only index truly capable of discern-ing mite patterns across the whole range of QCs (Figure 7). The PTHfam has the additionaladvantage over the BMWP in its simplicity of sampling and straightforward, simple formu-lation without the need for region- or ecosystem-specific tolerance scores (e.g., Artemiadouand Lazaridou, 2005). Because of the derivation of the PTHfam from the montane spring PTHindex (Miccoli et al., 2006) and an apparent inability of the BMWP index to correctly identifyreference sites at high altitude (1200 m a.s.l.: Lewin et al., 2013), we urge further explorationsinto the applicability of the PTHfam index to a wider range of stream ecosystem types.In conclusion, we advocate the inclusion of Hydrachnidia at family level in the formulation ofbiotic indices and support the adoption of simple and user-friendly indices for WFD-compliantbioassessment of lotic ecosystems. Though further cross-validation is needed, also includingsite-specific data on physico-chemical variables, we believe that the newly proposed PTHfam
has a high potential for use in WFD-compliant and other rapid bioassessments of streamecological status.
ACKNOWLEDGEMENTS
This study was funded by the Italian Ministry for the Environment and Protection of NaturalResources (project PR 348-UAQ) and the Sirente-Velino Regional Park. Profound thanks goto Dr. Antonio Di Sabatino and two anonymous referees for their constructive criticism on anearlier version of this paper, and to Ms. Tamar M. Rein (UC-Davis PD, California, USA) whokindly checked the MS for language.
REFERENCES
Alba-Tercedor J. and Sanchez-Ortega A., 1988. Un metodo rapido y simple para evaluar la calidadbiologica de las aguas corrientes basado en el de Hellawell (1978). Limnetica, 4, 51–56.
Allan J.D., 2004. Landscape and riverscapes: The influence of land use on stream ecosystems. Annu.Rev. Ecol. Evol. Syst., 35, 257–284.
Allan J.D. and Flecker A.S., 1993. Biodiversity conservation in running waters. BioScience, 43, 32–43.
Alvial I.E., Orth K., Durán B.C., Álvarez E. and Squeo F.A., 2013. Importance of geochemical factorsin determining distribution patterns of aquatic invertebrates in mountain streams south of theAtacama Desert, Chile. Hydrobiologia, 709, 11–25.
Armitage P.D., Moss D., Wright J.F. and Furse M.T., 1983. The performance of a new biological waterquality scores system based on macroinvertebrates over a wide range of unpolluted running-watersites. Water Res., 17, 333–347.
Artemiadou V. and Lazaridou M., 2005. Evaluation score and interpretation index for the ecologicalquality of running waters in central and northern Hellas. Environ. Monit. Assess., 110, 1–40.
Bennett C., Owen R., Birk S., Buffagni A., Erba S., Mengin N., Murray-Bligh J., Ofenböck G., Pardo I.,van de Bund W., Wagner F. and Wasson J.-G., 2011. Bringing European river quality into line: anexercise to intercalibrate macro-invertebrate classification methods. Hydrobiologia, 667, 31–48.
Biesiadka E. and Kowalik W., 1991. Water mites (Hydracarina) as indicators of trophy and pollutionin lakes. In: Dusbábek F. and Bukva V. (eds.), Modern Acarology, Academia Prague and SPBAcademic Publishing BV, The Hague, Vol. 1, 475–481.
Buffagni A. and Furse M., 2006. Intercalibration and comparison – major results and conclusions fromthe STAR project. Hydrobiologia, 566, 357–364.
Buffagni A., Erba S., Birk S., Cazzola M., Feld C., Ofenböck T., Murray-Bligh J., Furse M.T., ClarkeR., Hering D., Soszka H. and van de Bund W., 2005. Towards European inter-calibration for theWater Framework Directive: Procedures and examples for different river types from the E.C. projectSTAR. 11th STAR deliverable. STAR Contract No: EVK1-CT 2001-00089. Quaderni Ist. Ric. Acque123, Rome (Italy), IRSA, 460 p.
Buffagni A., Erba S., Aquilano G., Armanini D.G., Beccari C., Casalegno C., Cazzola M., Demartini D.,Gavazzi N., Kemp J.L., Mirolo N. and Rusconi M., 2007. Macroinvertebrati acquatici e Direttiva2000/60/EC (WFD). IRSA-CNR Notiziario dei Metodi Analitici, 1, 116 p.
Buffagni A., Erba S., Mignuoli C., Scanu G., Sollazzo C. and Pagnotta R., 2008. Criteri per la selezionedi siti di riferimento fluviali per la Direttiva 2000/60/CE. Quaderni CNR-IRSA, 1/2008, 2–22.
Cicolani B. and Di Sabatino A., 1991. Sensitivity of water mites to water pollution. In: Dusbábek F.and Bukva V. (eds.), Modern Acarology, Academia Prague and SPB Academic Publishing BV, TheHague, Vol. 1, 465–474.
Cicolani B., Miccoli F.P., Di Sabatino A., Giustini M. and Lombardo P., 2009. The value of watermites (Hydrachnidia) as indicators of biodiversity and stream ecological status: an example fromAbruzzo, central Italy. In: Abstracts Book “A Cruise through Nice Waters – ASLO Aquatic SciencesMeeting”. Nice, France, 25–30 January 2009, p. 51.
Cîmpean M.-D., 2010. Taxonomical and ecological study of water mite communities (Acari,Hydrachnidia) from the River Somežul Mic catchment area and their role as indicators of waterquality. English summary of PhD Dissertation, Babež-Bolyai University, Cluj-Napoca, Romania,31 p.
Dallas H.F., 2012. Ecological status assessment in mediterranean rivers: complexities and challengesin developing tools for assessing ecological status and defining reference conditions. In press atHydrobiologia, DOI: 10.1007/s10750-012-1305-8.
Davies P.J., Wight I.A., Findlay S.J., Jonasson O.J. and Burgin S., 2010. Impact of urban developmentof aquatic macroinvertebrates in south eastern Australia: degradation of in-stream habitats andcomparison with non urban streams. Aquat. Ecol., 44, 685–700.
Di Sabatino A., Gereke R. and Martin P., 2000. The biology and ecology of lotic water mites(Hydrachnidia). Freshw. Biol., 44, 47–62.
Di Sabatino A., Smit H., Gerecke R., Goldschmidt T., Matsumoto N. and Cicolani B., 2008. Global diver-sity of water mites (Acari; Hydrachnidia; Arachnida) in freshwater. Hydrobiologia, 595, 303−315.
Dohet A., Ector L., Cauchie H.M. and Hoffmann L., 2008. Identification of benthic invertebrate anddiatom indicator taxa that distinguish different stream types as well as degraded from referenceconditions in Luxembourg. Anim. Biol., 58, 419–472.
EU, 2000. Directive 2000/60/EC of the European Parliament and of the Council of 23 October 2000establishing a framework for Community action in the field of water policy. Official Journal of theEuropean Communities, L327, 1–72.
Gerecke R. and Schwoerbel J., 1991. Water quality and water mites (Acari, Actinedida) in the upperDanube Region. In: Dusbábek F. and Bukva V. (eds.), Modern Acarology, Academia, Prague andSPB Publishing BV, The Hague, Vol. 1, 483–491.
Ghetti P.F., 1997. I macroinvertebrati nel controllo della qualità di ambienti di acque correnti. IndiceBiotico Esteso (IBE). Manuale di applicazione. Provincia Autonoma di Trento, Trento, Italy, 222 p.
Growns J.E., 2001. Aquatic mites as bioindicators, with an Australian example. In: Halliday R.B.,Walter D.E., Proctor H.C., Norton R.A. and Calloff M.J. (eds.), Acarology, Proceedings of the 10thInternational Congress, CSIRO Publishing, Melbourne, 136–141.
Johnson R.K., Hering D., Furse M.T. and Verdonschot P.F.M., 2006. Indicators of ecological change:comparison of the early response of four organism groups to stress gradients. Hydrobiologia, 566,139–152.
Kubošová K., Brabec K., Jarkovský J. and Syrovátka V., 2010. Selection of indicative taxa for riverhabitats: a case study on benthic macroinvertebrates using indicator species analysis and therandom forest methods. Hydrobiologia, 651, 101–114.
Lewin I., Czerniawska-Kusza I., Szoszkiewicz K., Ławniczak A.E. and Jusik S., 2013. Biological indicesapplied to benthic macroinvertebrates at reference conditions of mountain streams in two ecore-gions (Poland, the Slovak Republic). Hydrobiologia, 709, 183–200.
Lyche Solheim A., Feld C.K., Birk S., Phillips G., Carvalho L., Morabito G., Mischke U., Willby N.,Søndergaard M., Hellsten S., Kolada A., Mjelde M., Böhmer J., Miler O., Pusch M.T., Argillier C.,Jeppesen E., Lauridsen T.L. and Poikane S., 2013. Ecological status assessment of Europeanlakes: a comparison of metrics for phytoplankton, macrophytes, benthic invertebrates and fish.Hydrobiologia, 704, 57–74.
Mandaville S.M., 2002. Benthic Macroinvertebrates in Freshwaters- Taxa Tolerance Values, Metrics, andProtocols. Soil & Water Conservation Society of Metro Halifax (Project H-1), 128 p.
Maurer B.A. and McGill B.J., 2011. Measurement of species diversity. In: Biological Diversity – Frontiersin Measurement and Assessment, In: Magurran A. E. and McGill B.J. (eds.), Oxford UniversityPress, Oxford, UK, pp. 55–65.
May R.M., 2011. Foreword. In: Biological Diversity – Frontiers in Measurement and Assessment, In:Magurran A.E. and McGill B.J. (eds.), Oxford University Press, Oxford, UK, pp. XV–XVII.
Miccoli F.P., Giustini M., Bruni P., Vignini P., Pescosolido M., Cicolani B. and Di Sabatino A., 2006.La biodiversità e la qualità ambientale delle sorgenti dei Monti della Laga (Parco Nazionale GranSasso – Laga, Appennino centrale). Atti del XXXVI Congresso della Società Italiana di Biogeografia,93.
Mjelde M., Hellsten S. and Ecke F., 2013. A water level drawdown index for aquatic macrophytes inNordic lakes. Hydrobiologia, 704, 141–151.
Pardo I. and Armitage P.D., 1997. Species assemblages as descriptors of mesohabitats. Hydrobiologia,344, 111–128.
Proctor H. and Pritchard G., 1989. Neglected predators: water mites (Acari: Parasitengona:Hydrachnellae) in freshwater communities. J.N. Am. Benthol. Soc., 8, 100–111.
Quinn G.P. and Keough M.J., 2002. Experimental Design and Data Analysis for Biologists. CambridgeUniversity Press, Cambridge, UK, 537 p.
Quiroga C.R., Vallania A. and Rosso De Ferradás B.E., 2010. Structure and distribution of Hydrachnidia(Parasitengona-Acari) in the sub-basin of the Grande River (Superior Basin of Quinto River, SanLuis-Argentina). Acta Limnol. Brasil., 22, 287−294.
Resh V.H. and McElravy E.P., 1993. Contemporary quantitative approaches to biomonitoring using ben-thic invertebrates. In: Rosenberg D.M. and Resh V.H. (eds.), Freshwater Biomonitoring and BenthicMacroinvertebrates, Chapman and Hall, New York, 159–194.
Rossaro B., Boggero A., Lods Crozet B., Free G., Lencioni V. and Marziali L., 2011. A comparisonof different biotic indices based on benthic macro-invertebrates in Italian lakes. J. Limnol., 70,109−122.
Schwoerbel J., 1964. Die Wassermilben (Hydrachnellae und Limnohalacaridae) als Indikatoren einerbiozönotischen gliederung von Breg und Brigach sowie der obersten Donau. Arch. Hydrobiol.,Suppl. 27, 1, 386–417.
Smit H. and Gerecke R., 2010. A checklist of the water mites of France (Acari: Hydrachnidia). Acarologia,50, 21–91.
Smit H. and van der Hammen H., 1992. Water mites as indicators of natural aquatic ecosystem of thecoastal dunes of the Netherlands and northwestern France. Hydrobiologia, 231, 51–64.
Smith I.M., Cook D.R. and Smith B.P., 2010. Water mites (Hydrachnidiae) and other arachnids. In:Thorp J.H. and Covich A.P. (eds.), Ecology and Classification of North American FreshwaterInvertebrates, 3rd edn. Academic Press / Elsevier, Amsterdam, NL & San Diego, CA, 485–586.
Suriano M.T., Fonseca-Gessner A.A., Roque F.O. and Froehlich C.G., 2011. Choice of macroinverte-brate metrics to evaluate stream conditions in Atlantic Forest, Brazil. Environ. Monit. Assess., 175,87−101.
Testi A., Bisceglie S., Guidotti S. and Fanelli G., 2009. Detecting river environmental quality through plantand macroinvertebrate bioindicators in the Aniene River (central Italy). Aquat. Ecol., 43, 477–486.
Thiébaut G., Tixier G., Guérold F. and Muller S., 2006. Comparison of different biological indices for theassessment of river quality: application to the upper River Moselle (France). Hydrobiologia, 570,159–164.
van der Hammen H. and Smit H., 1996. The water mites (Acari: Hydrachnidia) of streams in TheNetherlands: distribution and ecological aspects on a regional scale. Neth. J. Aquat. Ecol., 30,175–185.
Viets K., 1936. Wassermilben oder Hydracarina (Hydrachnellae und Halacaridae). In: Dahl F. (ed.),Tierwelt Deutschlands. G. Fischer, Jena, 31, 10–288; 32, 289–574.
Walter C., 1924. Neue Hydracarinen aus Unterfranken. Zool. Anz., 59 (3-4), 105–108.
Washington H.G., 1984. Diversity, biotic and similarity indices – a review with special relevance toaquatic ecosystems. Water Res., 18, 653–694.
Zar J.H., 2009. Biostatistical Analysis, 5th edn. Pearson / Prentice Hall, Upper Saddle River, NJ, 944 p.