Report author: Daniel James, research and analysis officer, Service Support and Improvement Team: [email protected], 0208 227 5040. Indicators for Community Safety Partnership Performance Call Over - May 2014 Crime Indicator Performance RAG Rating Direction of Travel (Performance) Summary report on page 1 MOPAC 7: Violence with Injury RED 17 2 MOPAC 7: Personal Robbery GREEN 18 3 MOPAC 7: Residential Burglary GREEN 19 4 MOPAC 7: Criminal Damage AMBER 20 5 MOPAC 7: Theft from the Person GREEN 21 6 MOPAC7: Theft of Motor Vehicle GREEN 22 7 MOPAC7: Theft from Motor Vehicle GREEN 23 Domestic Violence Indicator Performance RAG Rating Direction of Travel (Performance) Summary report on page 8 Domestic Violence Offences GREY 24 9 MARAC: Number of repeat referrals GREEN 25 10 IDAP (Probation): No. of B&D residents on the programme GREEN 26 11 IDAP (Probation): Total successfully completing the programme GREEN 27 12 The number of sexual offences including rape GREY 28 Youth Offending (Barking and Dagenham) Indicator Performance RAG Rating Direction of Travel (Performance) Summary report on page 13 Serious Youth Violence GREEN 29
Transcript
Report author: Daniel James, research and analysis officer, Service Support and Improvement Team: [email protected], 0208 227 5040.
Indicators for Community Safety Partnership Performance Call Over - May 2014Crime
Indicator Performance RAG Rating
Direction of Travel (Performance)
Summary report on page
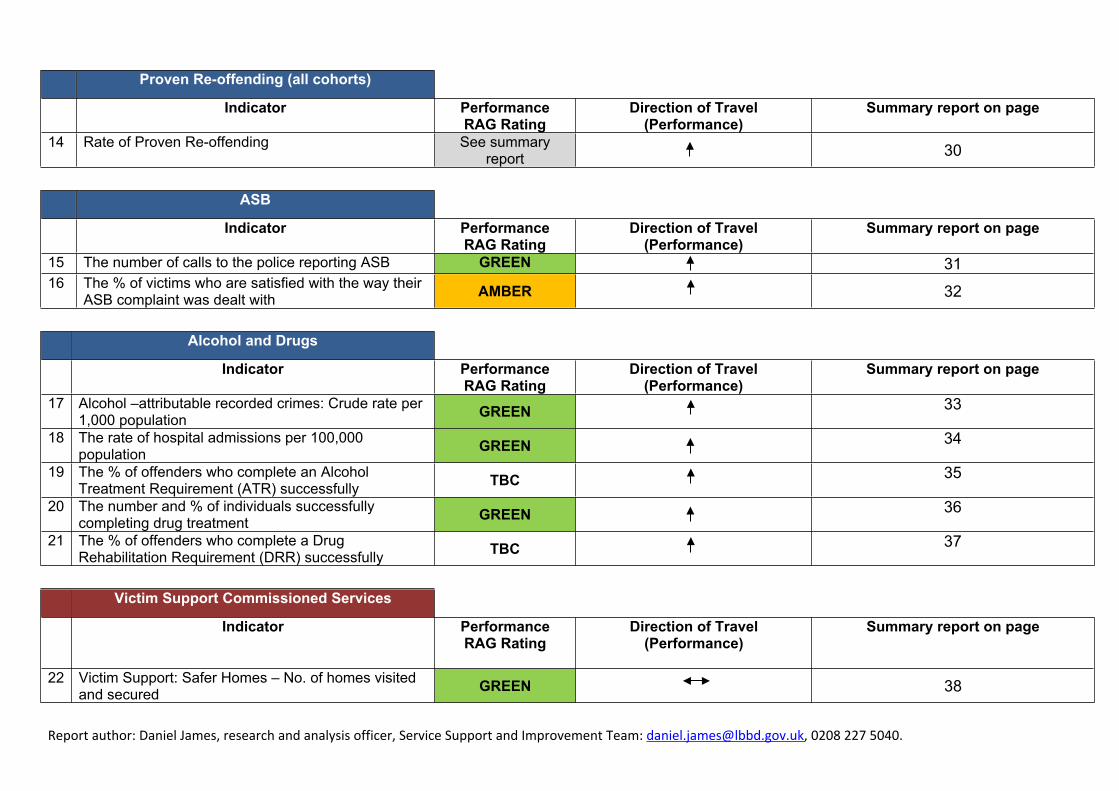
1 MOPAC 7: Violence with Injury RED 172 MOPAC 7: Personal Robbery GREEN 183 MOPAC 7: Residential Burglary GREEN 194 MOPAC 7: Criminal Damage AMBER 205 MOPAC 7: Theft from the Person GREEN 216 MOPAC7: Theft of Motor Vehicle GREEN 227 MOPAC7: Theft from Motor Vehicle GREEN 23
Domestic Violence
Indicator Performance RAG Rating
Direction of Travel(Performance)
Summary report on page
8 Domestic Violence Offences GREY 249 MARAC: Number of repeat referrals GREEN 2510 IDAP (Probation): No. of B&D residents on the
programme GREEN 2611 IDAP (Probation): Total successfully completing the
programme GREEN 2712 The number of sexual offences including rape GREY 28
Interpretation of what an injury is: Injury now includes pain regardless of whether it is visible or lasting pain this will now be recorded as ABH - thus putting it in VWI. This is a change in MPS Interpretation regarding crime classification
Year to date 138 296% change from previous year +6% +14%
Rolling 12 month fig 1,701 1,730
Per 1,000 Res (rolling 12
month)8.926 9.079
Rank (MET / MSG)
28of32 / 12of15
29of32 / 12of15
Apr May Jun Jul Aug Sep Oct Nov Dec Jan Feb Mar80
180
2014/15
2013/14
Performance Overview
RAG Rating: R
Recorded violence with injury crime has continued to increase YTD at May 2014 there were 37 more violence with injury crimes reported compared to May 2013 (up 14%). In comparison the average across the MET is up 17%.
Actions to Sustain or Improve Performance
The rise in Domestic Violence offences is impacting on the Violence with Injury figures. MOPAC 7 group have tasked a piece of analysis on this area separating out VWI offences those taking place in public spaces and those that are taking place in non public spaces. Analysis is currently being undertaken and results will help to inform partnership responses.
Benchmarking We are currently ranked 29 out of 32 CSP across the Metropolitan Police Force with 9.079 crimes per 1,000 residents compared to the Metropolitan Police force average of 7.235 per 1,000 residents. Our positioning amongst our Most Similar Group (MSG) remains unchanged (12/15 or 3rd highest) and therefore above the MSG average of 7.508 per 1,000 residents.
Personal Robbery will not include crimes such as theft from a person e.g. bag dipping. There has to be that threat of violence present.
Apr-14 May-14 Jun-14 Jul-14 Aug-14 Sep-14 Oct-14 Nov-14 Dec-14 Jan-15 Feb-15 Mar-15Month 32 30Year to date 32 62% change from previous year -14% -25%
Rolling 12 month fig for use below
487 471
Per 1,000 Res 2.556 2.472Rank (MET / MSG)
14of32 / 14of15
14of32 / 14of15
Apr May Jun Jul Aug Sep Oct Nov Dec Jan Feb Mar20
40
60
80
2014/15
2013/14
Performance Overview
RAG Rating: G
YTD at May 2014 there was 62 personal robbery offences reported. This is 21 fewer offences reported compared to the same period last year (-25%). In comparison the MET average was -24%.
Actions to Sustain or Improve Performance
Recent arrest and conviction of a male for a series of 18 robberies and snatches in the Barking area around bus stops has contributed to continued reduction
BenchmarkingCurrently the borough is 14 out of the 15 areas in our most similar group with 2.472 crimes per 1,000 residents. This has remained unchanged for the most part of the previous financial year. Barking and Dagenham are considerably above the average for our Most Similar Group (1.283 per 1,000 residents). However, the borough is below the Metropolitan Police force average (3.049 per 1,000 populations). Barking and Dagenham are currently ranked 14 out of the 32 CSPs in the Metropolitan Police Force.
Report author: Daniel James, research and analysis officer, Service Support and Improvement Team: [email protected], 0208 227 5040.
Community Safety & Public Protection Services / Crime, Justice & Communities Portfolio May 2014MOPAC 7: Residential Burglary Source: IQuanta
Definition Entering any residential building as a trespasser with the intent to steal or cause unlawful damage.
How this indicator
works
As described
What good looks like
Good performance would be achieving a lower number of residential burglaries and a higher number of attempted burglaries which indicates that homes in the borough are becoming secure.
2014/15 Target:
Reduction on last years figures
Why this indicator is
important
Serious Acquisitive Crime is a CSP priority and residential burglary makes up a section of SAC
History with this
indicator
2013/14: 1,470 Offences (-20%) 21.10 per 1,000 residents2012/13: 1,835 Offences (+7%) 26.334 per 1,000 residents2011/12: 1,710 Offences (+9%) 24.54 per 1,000 residents2010/11: 1,573 Offences
Any issues to consider
This would exclude areas such as commercial property, sheds, outbuildings etc. Residential burglary typically increases in the winter months November to March showing a strong correlation with shortening of daylight hours.
Apr-14 May-14 Jun-14 Jul-14 Aug-14 Sep-14 Oct-14 Nov-14 Dec-14 Jan-15 Feb-15 Mar-15Month 83 90Year to date 83 173% change from last year -45% -40%
Rolling 12 month fig 1,402 1,355
Per 1,000 HH 20.120 19.45Rank (MET / MSG)
28of32 / 14of15
27of32 / 14of15
Performance Overview
RAG Rating: G
YTD in May 2014 there was a decrease of 115 offences reported (-40%) compared to the same period in the previous year. The MET average over the same period was -18%.
Actions to Sustain or Improve Performance
Proactive and High Visible patrols concentrating on the RM8 postcode linked in with cross border work with Redbridge has seen significant reductions.
The recent identification of a Romanian male from a series of 18 offences where blood was left at the scene of burglaries around North London and Home Counties (6 in B+D) - remanded in custody
The arrest of a Romanian male who was re-entering the country at Gatwick who was wanted for numerous offences across NE London - remanded in custody In both the above offences conspiracy evidence is now being put together to look at potential associates
BenchmarkingBarking and Dagenham now has the 2nd highest amount of residential burglary offences out of our most similar group with 19.45 per 1,000 residents (15/15). The average for the most similar group is 11.42 per 1,000 residents. Looking across the Metropolitan police force Barking and Dagenham now has the 6th highest rate per 1,000 population for residential burglary (27/32). The MET average is 16.26 per 1,000 residents. This is a significant improvement on previous performance where we where the highest in both the MSG and the MET.
Report author: Daniel James, research and analysis officer, Service Support and Improvement Team: [email protected], 0208 227 5040.
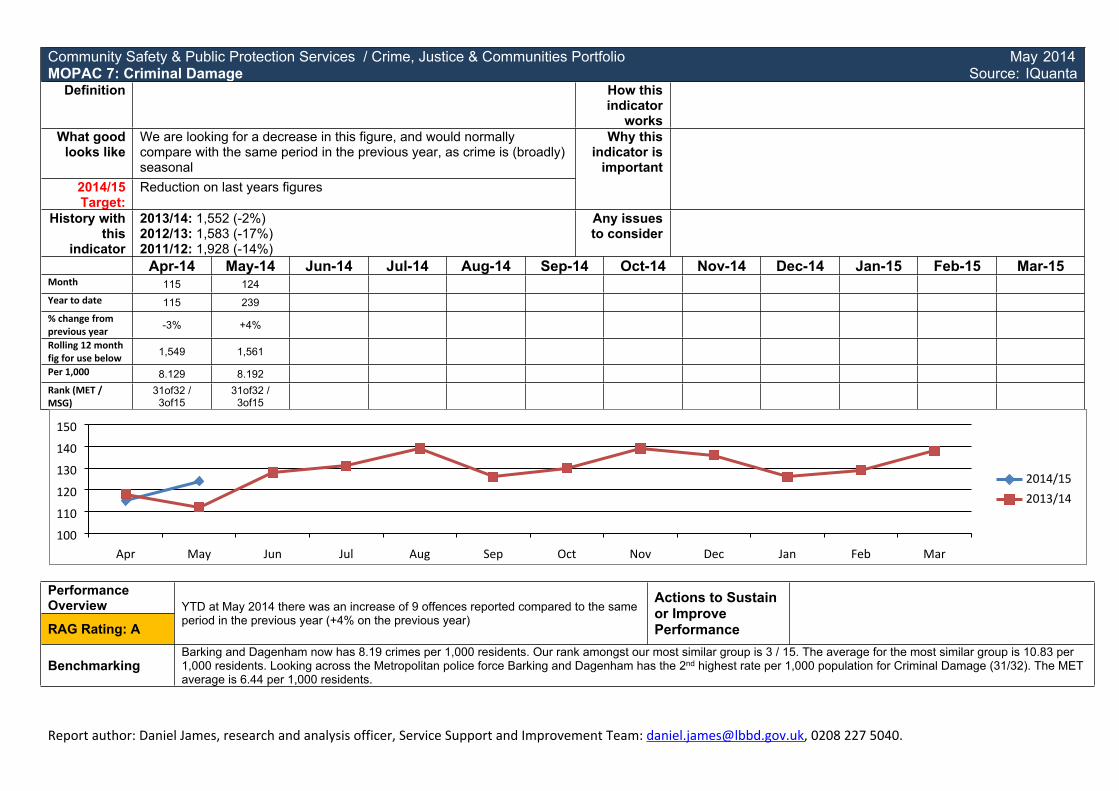
Community Safety & Public Protection Services / Crime, Justice & Communities Portfolio May 2014MOPAC 7: Criminal Damage Source: IQuanta
Definition How this indicator
worksWhat good
looks likeWe are looking for a decrease in this figure, and would normally compare with the same period in the previous year, as crime is (broadly) seasonal
Apr-14 May-14 Jun-14 Jul-14 Aug-14 Sep-14 Oct-14 Nov-14 Dec-14 Jan-15 Feb-15 Mar-15Month 115 124Year to date 115 239% change from previous year
-3% +4%
Rolling 12 month fig for use below
1,549 1,561
Per 1,000 8.129 8.192Rank (MET / MSG)
31of32 / 3of15
31of32 / 3of15
Apr May Jun Jul Aug Sep Oct Nov Dec Jan Feb Mar100
110
120
130
140
150
2014/15
2013/14
Performance Overview
RAG Rating: AYTD at May 2014 there was an increase of 9 offences reported compared to the same period in the previous year (+4% on the previous year)
Actions to Sustain or Improve Performance
BenchmarkingBarking and Dagenham now has 8.19 crimes per 1,000 residents. Our rank amongst our most similar group is 3 / 15. The average for the most similar group is 10.83 per 1,000 residents. Looking across the Metropolitan police force Barking and Dagenham has the 2nd highest rate per 1,000 population for Criminal Damage (31/32). The MET average is 6.44 per 1,000 residents.
Report author: Daniel James, research and analysis officer, Service Support and Improvement Team: [email protected], 0208 227 5040.
Community Safety & Public Protection Services / Crime, Justice & Communities Portfolio May 2014MOPAC 7: Theft from the person Source: IQuanta
Definition How this indicator
worksWhat good
looks likeWe are looking for a decrease in this figure, and would normally compare with the same period in the previous year, as crime is (broadly) seasonal
2014/15 Target:
Reduction on last years figures
Why this indicator is
important
History with this
indicator
Any issues to consider
Apr-14 May-14 Jun-14 Jul-14 Aug-14 Sep-14 Oct-14 Nov-14 Dec-14 Jan-15 Feb-15 Mar-15Month 25 22Year to date 25 47% change from previous year
-36% -30%
Rolling 12 month fig for use below
335 329
Per 1,000 1.758 1.726Rank (MET / MSG)
9of32 / 13of15
9of32 / 13of15
Apr May Jun Jul Aug Sep Oct Nov Dec Jan Feb Mar0
10
20
30
40
2014/15
2013/14
Performance Overview
RAG Rating: GYTD at May 2014 there was a decrease of 20 offences reported compared to the same period in the previous year (-30% on the previous year)
Actions to Sustain or Improve Performance
Benchmarking Barking and Dagenham has 1.72 crimes per 1,000 residents. Our rank amongst our most similar group is 13 / 15. The average for the most similar group is 4.84 per 1,000 residents. Looking across the Metropolitan police force Barking and Dagenham is ranked (9/32). The MET average is 1.24 per 1,000 residents.
Report author: Daniel James, research and analysis officer, Service Support and Improvement Team: [email protected], 0208 227 5040.
Community Safety & Public Protection Services / Crime, Justice & Communities Portfolio May 2014MOPAC 7: Theft of Motor Vehicle Source: IQuanta
Definition This is when a Motor Vehicle is taken without consent from the owner or a lawful authority.
How this indicator
works
As described
What good looks like
We are looking for a decrease in this figure, and would normally compare with the same period in the previous year, as crime is (broadly) seasonal
2014/15 Target:
5% Decrease from previous year
Why this indicator is
important
Serious Acquisitive Crime is a CSP priority and theft of a motor vehicle makes up a section of SAC
History with this indicator
2013/14: 773 offences (-5%), 4.06 crimes per 1,000 residents2012/13: 811 Offences (-21%) 4.336 crimes per 1,000 residents.2011/12: 1,106 Offences (-3%) 5.92crimes per 1,000 residents.2010/11: 1,146 Offences.
Any issues to consider
Apr-14 May-14 Jun-14 Jul-14 Aug-14 Sep-14 Oct-14 Nov-14 Dec-14 Jan-15 Feb-15 Mar-15Month 64 64Year to date 64 128% change from last year
-18% -18%
Rolling 12 month total 759 745
Per 1,000 Res 3.983 3.910
Rank (MET / MSG)
32of32 / 15of15
32of32 / 15/15
Apr May Jun Jul Aug Sep Oct Nov Dec Jan Feb Mar45
65
85
2014/15
2013/14
Performance Overview
RAG Rating: G
YTD at May 2014 there was 128 offences reported. This is a 18% decrease (down 28 offences) on the offences reported in the same period last year.
Actions to Sustain or Improve Performance
This is being monitored closely. Awareness raising campaigns are taking place across the borough in targeted areas. The focus is burglary but will include advice on removing valuables or keeping goods out of sight when leaving your vehicle.
Benchmarking B&D rate per 1,000 population = 3.91, MET average = 2.54, MSG average = 1.76. This places B&D at 32of32 in the MET and 15 of 15 in our Most Similar Group
Report author: Daniel James, research and analysis officer, Service Support and Improvement Team: [email protected], 0208 227 5040.
Community Safety & Public Protection Services / Crime, Justice & Communities Portfolio May 2014MOPAC 7: Theft from a Motor Vehicle Source: IQuanta
Definition The number of thefts from a motor vehicle. This includes thefts of removable items both inside and on the outside of the vehicle. Examples include but are not limited to, theft of radios, sat nav’s, handbags / bags, petro / diesel siphoning, exhausts, alloy wheels, theft of number plates and badges from vehicles.
How this indicator works
As described. These are published monthly on IQuanta. Below shows the monthly and accumulative year to date figure.
What good looks like
We are looking for a decrease in this figure, and would normally compare with the same period in the previous year, as crime is (broadly) seasonal
2014/15 Target:
Reduction on last years figures
Why this indicator is
important
Theft from a Motor Vehicle has increased during 2013/14 and is affecting our performance under serious acquisitive crime. A one page performance summary on this crime type was requested by the Police and Community Safety to keep track of the situation.
History with this indicator
2013/14: 1,595 offences (-4%), 8.37 per 1,000 residents (22of32 / 14of15)2012/13: 1,659 offences (0%) 8.87 per 1,000 residents (20 of 32 / 14 of 15)2011/12: 1,655 offences (-3.4%)2010/11: 1,714 offences
Any issues to consider
Apr-14 May-14 Jun-14 Jul-14 Aug-14 Sep-14 Oct-14 Nov-14 Dec-14 Jan-15 Feb-15 Mar-15Month 113 107Year to date 113 220% change from last year -30% -31%Rolling 12 month fig for use below 1,546 1,494Rate Per 1,000 residents 8.113 7.840Rank (MET / MSG)
21of32 / 14of15
21of32 / 14of15
Apr May Jun Jul Aug Sep Oct Nov Dec Jan Feb Mar80
100
120
140
160
180
2014/15
2013/14
Performance Overview
RAG Rating: G
YTD at May 2014 there was 220 offences reported. This is a 31% decrease (down 101 offences) on the offences reported in the same period last year. In comparison the average across the Metropolitan Police Service is -14% at May 2014.
Actions to Sustain or Improve Performance
Culmination of a long running decoy car operation in London Road Car Park led to the arrest of an offender who was charged with a series of 20 offences
Benchmarking B&D rate per 1,000 population = 7.84, MET average = 7.528, MSG average = 5.328. This places B&D at 21of32 in the MET and 14 of 15 in our Most Similar Group
Report author: Daniel James, research and analysis officer, Service Support and Improvement Team: [email protected], 0208 227 5040.
Community Safety & Public Protection Services / Crime, Justice & Communities Portfolio May 2014Domestic Violence Source: Local Police Figures
Definition
Any incident of threatening behaviour, violence, or abuse (psychological, physical, sexual, financial or emotional) between adults who are or have been intimate partners or family, regardless of gender.
How this indicator works
Simple monthly and YTD count of offences reported. Rate per 1,000 residents is used to compare against other areas. For the rate per 1,000 population we use rolling 12 month figures against the 2011 Census figure for all individuals residing in the borough (187,029). This is consistent with Iquanta.
What good looks like
For monitoring. DV is likely to be an under reported crime. An increase in offences could show that more people recognise domestic abuse as a crime and report it rather than the situation getting worse.
2013/14 Target:
Generally an increase in crimes reported is considered a good thing. If crimes reported is going down it should prompt services to ask ‘what are we not doing?’
Why this indicator is important
DV was a Community Safety Partnership priority for 2012/13
History of this indicator
2013/14: 1,991 Offences, 10.65 crimes per 1,000 residents2012/13: 1,588 Offences, 8.49 crimes per 1,000 resident2011/12: 1,706 Offences 2010/11: 1,790 Offences
Any issues to consider
Potential under reporting of crimes to the Police. Since Summer 13 the age of the victim changed so that offences involving 17 year olds within the family or in relationships were included within the figures.
Apr-14 May-14 Jun-14 Jul-14 Aug-14 Sep-14 Oct-14 Nov-14 Dec-14 Jan-15 Feb-15 Mar-15Month 172 109Year to date 172 281Rolling 12 months (for use below)
2,023 2,046
Rate per 1,000 10.82 10.94
Rank (MET Police) 32 of 32 32 of 32
Performance Overview
RAG Rating: None
There were 23 more crimes of DV reported in May 2014 compared to May 2013 (+ 16.3%).
Using YTD totals there was an increase of 55 crimes reported between April 2014 to May 2014 compared to April 2013 to May 2013 (281 vs 336 or +19.6%)
Actions to Sustain or Improve Performance
Partnership responses include: Operation Dauntless which is an MPS wide response to improving performance in this area Improved our emergency response times to Domestic Abuse Calls Positive action regarding suspects who are at the scene or have recently left the scene is being monitored as
there is a correlation between successful detection against time to arrest We are piloting a new Crime Advisor (Detective Sergeant) working within a Emergency Response Patrol
Team 24/7 IDVA Support ensuring victims are supported through court process ( victim attrition long standing issue in
B+D) As of 1/4 we are able to use restorative approach for youth VWI where appropriate. Each team is being
enhanced with a rolling programme of attachments for ERPT officers being attached to the Community Safety Unit for a month a time, with the ambition to expose all officers to seeing enhanced victim care and investigative process.
Children’s services have appointed a DV coordinator. A young person’s IDVAS and a children’s IDVAS posts are now in place as part of the IDVAS contract
Benchmarking
% Change compared to same time in the previous year (YTD at May 14 vs YTD at May 13): B&D = Up by 19.6% London average =up by 20.0% *Rate per 1,000 Residents (rolling 12 months): B&D = 10.94, Metropolitan Police Average = 7.09, this places B&D 32 / 32 or the highest in London.
Report author: Daniel James, research and analysis officer, Service Support and Improvement Team: [email protected], 0208 227 5040.
Community Safety & Public Protection Services / Crime, Justice & Communities Portfolio May 2014 MARAC: Number of repeat referrals to MARAC Source: MARAC
Definition If domestic abuse continues after the first MARAC then they can be re referred and have their situation re examined.
How this indicator
works
As described
What good looks like
We would be looking for lower numbers compared to previous months and previous years.
Referral activity has to be considered alongside Domestic Violence Offences reported to the police.
Apr-14 May-14 Jun-14 Jul-14 Aug-14 Sep-14 Oct-14 Nov-14 Dec-14 Jan-15 Feb-15 Mar-15Month 0 9Year to Date 0 9
Apr May Jun Jul Aug Sep Oct Nov Dec Jan Feb Mar0
5
10
15
2014/15
2013/14
Performance Overview
RAG Rating: G
At May 2014 there were 9 repeat referrals to MARAC. This works out as 20% of all MARAC referrals for the month which is within the 28-40% range recommended by CAADA.
Please note there was no MARAC meeting in April 2014.
Actions to Sustain or Improve Performance
Previous performance was discussed at a MARAC Steering group meeting with Coordinated Action Against Domestic Abuse (CAADA). CAADA stated that although there has been an increase from the previous year the level of repeat referrals is seen as healthy and within the limits they would have expected.
Benchmarking Some benchmarking data is available from CAADA on the level of repeat referrals to MARAC. The latest data is for 1st April 2013 – 31st March 2014 where there averages for London, our Most Similar Group (MSG) and national was 19%, 25% and 24% respectively.
Report author: Daniel James, research and analysis officer, Service Support and Improvement Team: [email protected], 0208 227 5040.
Community Safety & Public Protection Services / Crime, Justice & Communities Portfolio May 2014 Total number of Barking and Dagenham Residents on the Programme - Integrated Domestic Abuse Programme (IDAP) Source: Probation (Emma Eddy)
Definition IDAP is a group work programme for men who have abused their wives, partners or ex-partners and is a court order.
How this indicator
works
As described
What good looks like
We would be looking for the number of residents on the programme to decrease in line with a decrease in the amount of domestic violence incidents.
2013/14 Target: This is the first full year monitoring this programme. Future targets will be to see improvements year on year in the number and % successfully completing the programme.
Why this indicator is
important
History with this
indicator
N/A Any issues to consider
Figures are currently taken as a snapshot of the caseload at that particular time. The figures therefore only reflect those currently active on the caseload when the report was run for that month.
DATA Apr-13 May-13 Jun-13 Jul-13 Aug-13 Sep-13 Oct-13 Nov-13 Dec-13 Jan-14 Feb-14 Mar-14Number currently on programme
68 30 22 28
Apr May Jun Jul Aug Sep Oct Nov Dec Jan Feb Mar0
20
40
60
80
2013/14
Performance Overview
RAG Rating: G
At March 2014 there were a total of 28 Barking and Dagenham Offenders active on DV programme.
Figures are produced quarterly hence 2013/14 figures are shown here. Qtr 1 figures for 2014/15 will be included in June’s data which is available in late July 2014.
Actions to Sustain or Improve Performance
Figures provided by probation are a snapshot of the active caseload. It is difficult to get total number of individuals who have been on the programme for the year.
Report author: Daniel James, research and analysis officer, Service Support and Improvement Team: [email protected], 0208 227 5040.
Community Safety & Public Protection Services / Crime, Justice & Communities Portfolio March 2014 Total Successfully Completing Programme of Total Discharges - Integrated Domestic Abuse Programme (IDAP) Source: Probation (Emma Eddy)
Definition The amount of people that have been discharged from their IDAP and the amount of those that successfully completed their course
How this indicator
works
As described.
What good looks like
We would be looking for an increased majority of successful completions on discharge.
2013/14 Target: This is the first full year monitoring this programme. Future targets will be to see improvements year on year in the number and % successfully completing the programme.
Why this indicator is
important
History with this
indicator
N/A Any issues to consider
Figures are currently taken as a snapshot of the caseload at that particular time. The figures therefore only reflect those currently active on the caseload when the report was run for that month.
This is the first year of monitoring this programme.
For a period of time from November 2013 Probation stopped running IDAP. During this time two other ‘Local Domestic Violence Groups’ were run and the figures have been used to populate the later months. At March 2014 a total of 8 individuals have successfully completed Local Domestic Violence Perpetrator programmes.
Actions to Sustain or Improve Performance
Benchmarking N/A - Figures are produced quarterly hence 2013/14 figures are shown here. Qtr 1 figures for 2014/15 will be included in June’s data which is available in late July 2014.
Report author: Daniel James, research and analysis officer, Service Support and Improvement Team: [email protected], 0208 227 5040.
Community Safety & Public Protection Services / Crime, Justice & Communities Portfolio May 2014The number of Sexual offences Including Rape Source: IQuanta
Definition All offences of rape, sexual activity involving a child under 13, sexual assault, causing sexual activity without consent, sexual activity with a person with a mental disorder, abuse of children through prostitution, pornography or trafficking.
How this indicator works
Only offences reported to the police within the period are counted.
What good looks like
Achieving a lower number of offences than in 2010/11 (263) Reducing our ranking from 3rd highest in the most similar group (MSG) 13/15.
2013/14 Targets
Generally an increase in crimes reported is considered a good thing. If crimes reported is going down it should prompt services to ask ‘what are we not doing?’
Why this indicator is important
The Strategic Assessment highlighted an increase in sexual offences in 2009 /2010. Sexual offences have increased in Barking and Dagenham with a higher number of reports compared with the London average.
History with this indicator
2013/14: 292 Offences (+16%), 1.53 per 1,000 residents. MSG 10/15, MET 22/322012/13: 252 Offenses (-8%) 1.35 per 1000 residents. MSG 11/152011/12: 274 Offences (+7%), 1.47 per 1,000 residents MSG = 12/152010/11: 263 Sexual Offences, MSG = 3rd Highest (baseline) = 13/15
Any issues to consider
Offences could have taken place some weeks, months or even years before being reported to the Police.
YTD at May 2014 there have been 60 sexual offences reported in the Borough. This is an increase of 18 offences (+43%) on the same period in the previous year. The London average is up 17%.
Actions to Sustain or Improve Performance
Increases in sexual offences reported are being attributed to national media coverage of sexual abuse and more victims coming forward to report crimes. This is reflected in the increases seen across London in addition to a sharp rise in calls to the NSPCC24 hour advice line.
BenchmarkingAt May 2014 Barking & Dagenham had 1.62 sexual offences per 1,000 residents and is ranked (25/32) in London. Against our Most Similar Group (MSG) Barking and Dagenham is ranked 10 of 15. Our MSG average is 1.391 per 1000 residents and the Metropolitan Police force average is 1.373.
Report author: Daniel James, research and analysis officer, Service Support and Improvement Team: [email protected], 0208 227 5040.
Community Safety & Public Protection Services / Crime, Justice & Communities Portfolio May 2014 Serious Youth Violence (Barking & Dagenham) Source: Local Police Figures
Definition Serious Youth Violence is defined by the MPS as 'Any offence of most serious violence or weapon enabled crime, where the victim is aged 1-19.'
How this indicator
works
We use the following formula using the latest rolling 12 month figures and the 2011 Census figure for individuals aged 1-19 in the borough (55,021).
What good looks like
We are looking for a decrease in this figure, and would normally compare with the same period in the previous year, as crime is (broadly) seasonal.
2014/15 Target: Reduction on last years figures
Why this indicator is
important
Serious Youth Violence (SYV) is a CSP priority. The 2011 Strategic Assessment showed that it constitutes the next most significant element of the violence that occurs, after Domestic Violence. Analysis of robberies shows that it is part of a growing pattern of gang-related violence.
History with this indicator
2013/14: 176 offences (+21%), 2.73 crimes per 1,000 residents2012/13: 145 offences, (-40%), 2.64 crimes per 1,000 residents2011/12: 236 offences (+14%), 2010/11: 207 offences, 3.76 per 1,000 residents
Any issues to consider
The good performance in 2012/13 needs to be considered against current comparisons to the previous year.
Apr-14 May-14 Jun-14 Jul-14 Aug-14 Sep-14 Oct-14 Nov-14 Dec-14 Jan-15 Feb-15 Mar-15Month 12 11Year to date 12 33% change compared to previous year
+20% -26%
Rolling 12 months (for use below)
178 168
Rate per 1,000 Res (1-19 yrs) 3.24 3.05
Rank (MET) 12 of 32 17 of 32
Apr May Jun Jul Aug Sep Oct Nov Dec Jan Feb Mar0
20
40
2014/15
2013/14
Performance Overview
RAG Rating: G
Using YTD figures (176 at May 2014) there has been an overall decrease of 8 SYV incidents reported (-26%) on the 23 reported at the same period last year. The London average is -7%. The average number of offences for London is 31.
Actions to Sustain or Improve Performance
Consideration needs to be given to our good performance in 2012/13.
Benchmarking% Change compared to same time in the previous year (using YTD figures): B&D = Down by 26%, London average = Down by 7%Rate per 1,000 Residents: B&D = 3.05 This places B&D 17 / 32 in the London Rankings
Report author: Daniel James, research and analysis officer, Service Support and Improvement Team: [email protected], 0208 227 5040.
Community Safety & Public Protection Services / Crime, Justice & Communities Portfolio May 2014 Rate of Proven Re-offending (All cohorts) Source: www.gov.uk
Definition Proven re-offending is defined as any offence committed in a one year follow up period where the offender has received a court conviction, caution, reprimand or warning.
How this indicator
works
The Ministry of Justice’s methodology tracks the proven re-offending rate of the identified offenders over a one year period. Offenders are defined as all offenders in any one year who received a caution (for adults), a final warning or reprimand (for juveniles), a non-custodial conviction, or were discharged from custody. A proven re-offence is defined as committing an offence or receiving a court conviction, caution, or reprimand in a one year follow-up period. Following this one year period, a further six months is allowed for cases to progress through the courts. This means that the latest data refers to a cohort that originally offended at least 18 months ago.
What good looks like
We are looking for consistent decreases in this figure over time.
2014/15 Target: Decrease on last years figures
Why this indicator is
important
Reducing re-offending is a CSP priority.
History with this indicator
The first release of these figures was produced in October 2011. The figures for the latest cohort (July 2011 to June 2012) were released in April 2014.
Any issues to consider
From October 2014 it will not be possible to produce drug misusing and PPO breakdowns. The latest reports unfortunately do not have these breakdowns. PPO will be replaced with IOM and the MOJ will no longer be able to produce drug misusing offending data as DIP no longer exists in a number of areas. The latest figures at a borough level are presented below and were released in April 2014.
Performance overview Overall for adults and Juveniles combined the Cohort size continues to decrease. However, the % of offenders who reoffend has not changed at 28%. We are getting closer to the England and Wales reoffending rate of 26.9% which is positive but still shows some room for improvement.
All adults & Juveniles Adults only Drug misusers PPO (All ages) YOS (Juveniles only)Latest cohort identified between July 2011–June 2012 & tracked for 18 months (released April 2014)
Report author: Daniel James, research and analysis officer, Service Support and Improvement Team: [email protected], 0208 227 5040.
Community Safety & Public Protection Services / Crime, Justice & Communities Portfolio May 2014 The number of calls to the Police reporting Anti-social Behaviour Source: Local Police
Definition Anti social behaviour includes Abandoned Vehicles, Vehicle Nuisance, Rowdy/Inconsiderate Behaviour, Rowdy/Nuisance Neighbours, Malicious/ Nuisance Communications, Street Drinking, Prostitution Related Behaviour, Noise, Begging.
How this indicator works
As defined, it is a count of all calls reported to the police.
What good looks like
Ideally we would see a year on year reduction in ASB calls reported to the Police.
2013/14 Target TBC
Why this indicator is important
ASB is a CSP priority and the police generally receive the highest amount of calls for ASB in the bough.
History with this indicator
2013/14: 7,541 calls (-2.8% on previous year)2012/13: 7,717 calls (-18% on previous year)2011/12: 9,455 calls
Apr May Jun Jul Aug Sep Oct Nov Dec Jan Feb Mar400
500
600
700
800
900
1000
2014/15
2013/14
Performance Overview
RAG Rate: G
YTD at May 2014 there have been 1,066 calls to the police reporting Anti-Social Behaviour. This is a decrease of 11% on the same period last year (1,183)
Actions to Sustain or Improve Performance
Maintain current action to sustain good performance.
Report author: Daniel James, research and analysis officer, Service Support and Improvement Team: [email protected], 0208 227 5040.
Community Safety & Public Protection Services / Crime, Justice & Communities Portfolio May 2014 The number and % of victims who were satisfied with the way their ASB complaint was dealt with Source: Council ASB Team – Katherine Gilcreest
Definition Anti social behaviour includes Abandoned Vehicles, Vehicle Nuisance, Rowdy/Inconsiderate Behaviour, Rowdy/Nuisance Neighbours, Malicious/ Nuisance Communications, Street Drinking, Prostitution Related Behaviour, Noise, Begging.
How this indicator works
What good looks like
Ideally we would see a year on year reduction in ASB calls reported to the Police.
2014/15 Target For monitoring
Why this indicator is important
ASB is a CSP priority and the police generally receive the highest amount of calls for ASB in the bough.
History with this indicator 2013/14: 20 surveys returned, 19 satisfied (95%)
YTD at May 2014 there have been 2 ASB Satisfaction surveys returned to the council ASB team. 1 of which have been satisfied with the way their ASB complaint was dealt with (50%). The other was neither satisfied or dissatisfied.
Actions to Sustain or Improve Performance
Maintain current action to sustain good performance.
Report author: Daniel James, research and analysis officer, Service Support and Improvement Team: [email protected], 0208 227 5040.
Community Safety & Public Protection Services / Crime, Justice & Communities Portfolio May 2014 Alcohol Attributable recorded crimes: Crude rate per 1,000 population Source: LAPE
Definition
A crude rate of alcohol recorded crimes per 1,000 populations. This indicator is calculated using the former UK Prime Minister’s Strategy Units alcohol-attributable fractions2 and applying them to the total number of recorded crimes. The alcohol-attributable fractions were taken from the Home Office New English and Welsh Arrestee Drug Abuse Monitoring System arrestee survey (1999-2001) and were based on urine tests of arrestees.
How this indicator works
The crime types used in the calculation are: Violence against the person, Sexual offences, Robbery, Burglary, Theft of a motor vehicle, Theft from a motor vehicle.
Numerators were multiplied by the relevant alcohol-attributable fraction to obtain the number of alcohol-attributable crimes, and results presented as crude rates. For more information please see: http://www.lape.org.uk/downloads/Lape_guidance_and_methods.pdf
What good looks like
To achieve a lower rate per 1,000 populations than last year (12.98 crimes per 1000 population).
2012/13 Targets
Reduction on baseline
Why this indicator is important
Barking and Dagenham has the sixth highest rate of alcohol related crime and violent crime in the country and the fifth highest in London per 1,000 population (using 2009/10 figures). Substance misuse reoffending is a CSP priority in the borough.
History with this indicator
Barking and Dagenham: 2011/12 rate per 1,000 population = 12.982010/11 rate per 1,000 population = 13.912009/10 rate per 1,000 population = 15.372008/09 rate per 1,000 population = 15.43
Any issues to consider
Figures for this indicator are released annually from LAPE. The latest data available is for the 2012/13 period which was released in May 2014.
Barking and Dagenham Rate per 1,000 population London rate per 1,000 population
Performance Overview
RAG Rate: GBarking and Dagenham’s overall rate of alcohol-related recorded crime continues to fall and has dropped from 11.70 in 2011/12 to 10.53 in 2012/13.
Actions to Sustain or Improve Performance
Benchmarking 2012/13 performance (10.53) ranks Barking and Dagenham as the 10th highest in the country and is higher than the regional average of 9.02 and the England Average of 5.74Barking and Dagenham is has is ranked25 of 32 (or 9th highest) in London for alcohol related crime.
Report author: Daniel James, research and analysis officer, Service Support and Improvement Team: [email protected], 0208 227 5040.
Community Safety & Public Protection Services / Crime, Justice & Communities Portfolio May 2014 Alcohol related hospital admissions and rate per 100,000 population Source: LAPEDefinition People who have attended hospital in relation to alcohol related harm and
have stayed overnight and occupied a bed spaceHow this indicator works
Figures are counted and analysed by the Hospital Episode Statistics (HES).
What good looks like
Good performance would be to have fewer hospital admissions than the baseline.
2012/13 Targets
Reduction on baseline Why this indicator is important
Alcohol-attributable conditions has shown a 8% rise on the previous year (2010-11), resulting in a doubling over a decade. On a national level general health has decreased due to an increase in alcohol consumption since 2004.
History with this indicator
2011/12 = 3206 alcohol related hospital admissions (+7%)2010/11 = 2996 alcohol related hospital admissions (+12.3%) 2009/10 = 2667 alcohol related hospital admissions (+9.7%)2011/12= 2425 Rate per 100,000 population (+ 6%) 2010/11= 2287 Rate per 100,000 population (+12%) 2009/10= 2045 Rate per 100,000 population (+9%)
Any issues to consider
The lasted data available is for the full 2011/12 period and was released in August 2012
Provisional figures up to 2012/13 Qtr 4 were released in October 2013.
On average Barking and Dagenham has seen a 10% increase in alcohol-related admissions over the past 9 years (since 2002/3). In comparison the average for London and England was 12% and 10% respectively.
However, the official 2012/13 data shows the number of hospital admissions for the borough has starting to decrease 3048 (-5%) whilst the London average shows a 2.9% increase and the England average shows a 0.93% increase.
Actions to Sustain or Improve Performance
Maintain current activity which includes: Continued training of FY ½ junior doctors at fortnightly teaching
sessions, Continued training of 5 hospital Alcohol champions and the
development of multi agency care plans Improving communication with neighbouring hospitals including
Newham and Waltham Forest to improve referrals for B&D residents Further develop the tri borough approach to alcohol liaison work.
Benchmarking The end of 2012/13 results above places Barking and Dagenham as the borough with the 71 highest alcohol related admissions in England and the 13th highest in London which is an improvement on last year (52 highest and 7th highest respectively).
Report author: Daniel James, research and analysis officer, Service Support and Improvement Team: [email protected], 0208 227 5040.
Community Safety & Public Protection Services / Crime, Justice & Communities Portfolio May 2014The % of offenders who complete an ATR requirement successfully Source: Probation
Definition A successful completion of an Alcohol Treatment Requirement (ATR) as recorded on the Probation case management system. A successful completion is defined an ATR running its full course or has been revoked early by the court for good progress.
How this indicator works
Count of individuals successfully completing an ATR divided by the total number of individuals who had their ATR terminated.
What good looks like
Good performance is measured by achieving the set targets.
2014/15 Targets 24 individuals, 70% success rate
Why this indicator is important
This indicator is used by London Probation and the local Substance Misuse Strategy Team to monitor how well the current provision is working.
History with this indicator
2013/14: 33 individuals, 62% success rate across B&D and Havering (85% of target)2012/13: 20 individuals, 67%success rate (target 18 individuals, 70%)2011/12: 47 individuals, 70% success (Barking, Dagenham and Havering total)
Any issues to consider
With the Transforming Rehabilitation process and the transfer of cases across the National Probation Service (London) and the Community Rehabilitation Company (London), Probations reporting structures have significantly changed and was officially implemented on June 1st when they separated into the NPS and CRC. April and May 2014 reports should be available mid July 2014
With the Transforming Rehabilitation process and the transfer of cases across the National Probation Service (London) and the Community Rehabilitation Company (London), Probations reporting structures have significantly changed and was officially implemented on June 1st when they separated into the NPS and CRC.
April and May 2014 reports should be available mid July 2014
Actions to Sustain or Improve Performance
The Substance Misuse Strategy Team has worked with local treatment providers and probation to resolve any issues. Data has been provided which confirms that the borough level targets for Barking and Dagenham are on track to be achieved and therefore the area of poor performance is with Havering.
Local data shows year to date there have been a total of 20 ATR completions; with another 5 expected to complete by the end of March. This would put us in-line to meet the yearly target.
Report author: Daniel James, research and analysis officer, Service Support and Improvement Team: [email protected], 0208 227 5040.
Community Safety & Public Protection Services / Crime, Justice & Communities Portfolio May 2014 The % who successfully complete treatment for drug misuse Source: Substance Misuse Strategy Team
Definition
Successful completions are either classed as ‘Treatment Completed: drug free’, ‘Treatment Completed: alcohol free’ or ‘Treatment Completed: occasional user not heroin or crack’. The indicator measures the proportion of individuals who successfully completed treatment.
How this indicator works
This indicator measures the successful completion rate of those individuals who have entered into structured drug treatment in Barking and Dagenham.
What good looks like
The achievement of the yearly target is considered good performance. In 2012/13 there was a target of 65% completion rate.
2014/15 Targets 65% successful completion rate.
Why this indicator is important
The effectiveness of a treatment system is measured by the successful completions that it produces. Public Health England monitor areas on successful completions as a proportion of the overall case load. This ensures that areas are not holding on to a case load of clients for years.
History with this
indicator
2013/14 Barking and Dagenham 72% (286 397) 2012/13 Barking and Dagenham 71% (238 of 335) 2011/12 Barking and Dagenham 63% 2010/11 Barking and Dagenham 57%
The successful completion rate in Barking and Dagenham for April is very good and above the target and performing above the National average (42%) for all service users.
Actions to Sustain or Improve Performance
None
BenchmarkingBarking and Dagenham have the fourth highest successful completion rate for OCUs (63%) and the highest for all drug users (83%) out of the 33 London boroughs. Barking and Dagenham are performing in the top quartile (according to Quarter 4 DOMES report) for both opiate and non-opiate successful completions as a proportion of those in treatment.
Report author: Daniel James, research and analysis officer, Service Support and Improvement Team: [email protected], 0208 227 5040.
Community Safety & Public Protection Services / Crime, Justice & Communities Portfolio May 2014 The % of offenders who successfully complete a DRR (Probation) Source: Probation
Definition
The Drug Rehabilitation Requirement (DRR) is a court order designed to reduce offenders' abuse of drugs and their associated crimes. This indicator measures the percentage of offenders successful completing a DRR out of the total DRRs terminated within the period.
How this indicator works
This indicator measures the successful completion rate of those offenders on a Drug Rehabilitation Requirement (DRR)
What good looks like Good performance is measured by achieving the set target for 54.
2014/15 Targets 24 individuals (Barking and Dagenham only)
Why this indicator is important
Crime and substance abuse was identified as a priority area in the 2005 Crime and Disorder Audit and has continued to be an area of focus to date in the borough.
With the Transforming Rehabilitation process and the transfer of cases across the National Probation Service (London) and the Community Rehabilitation Company (London), Probations reporting structures have significantly changed and was officially implemented on June 1st when they separated into the NPS and CRC.
April and May 2014 reports should be available mid July 2014Apr-14 May-14 Jun-14 Jul-14 Aug-14 Sep-14 Oct-14 Nov-14 Dec-14 Jan-15 Feb-15 Mar-15
Terminations (month) Not available Not available
Successful terminations Not available Not available
Terminations YTD Not available Not available
Successful terminations
YTDNot available Not available
% Successful (YTD) Not available Not available
Performance Overview
RAG Rate: G
With the Transforming Rehabilitation process and the transfer of cases across the National Probation Service (London) and the Community Rehabilitation Company (London), Probations reporting structures have significantly changed and was officially implemented on June 1st when they separated into the NPS and CRC.
April and May 2014 reports should be available mid July 2014
Report author: Daniel James, research and analysis officer, Service Support and Improvement Team: [email protected], 0208 227 5040.
Community Safety & Public Protection Services / Crime, Justice & Communities Portfolio May 2014 Victim Support Number of Homes Visited and Secured Source: Victim Support
Definition Normally this is provided to the victims of burglaries. This involves visiting the home and providing measures to secure the property against burglary.
How this indicator
works
As described
What good looks like
The more homes that are visited the more properties that should be secure against burglary in the future.
2013/14 Target: Monitoring – Activity should reflect local trends in burglary figures
Why this indicator is
important
The number of homes visited and secured makes them less likely to be burgled or re-burgled.
History with this
indicator
2013/14: 9882012/13: 1,1172011/12: 1,200
Any issues to consider
The amount of work produced by the number carpenters employed by the Victims Support Safer Homes Scheme. The number of repeat call outs to premises shows how effective the scheme is.
Apr-14 May-14 Jun-14 Jul-14 Aug-14 Sep-14 Oct-14 Nov-14 Dec-14 Jan-15 Feb-15 Mar-15Month 40 64Year to Date 40 104
Apr May Jun Jul Aug Sep Oct Nov Dec Jan Feb Mar30
50
70
90
110
2014/15
2013/14
Performance Overview
RAG Rating: G
In May 2014 the service visited and secured 64 properties. This is in comparison to 105 in May 2013.
Using YTD totals the service has visited and secured 104 fewer properties compared to last year (104 vs 208). However, activity is in line with the decrease in residential burglaries (Down 115 offences or -40%).