Indicators of Health Status and Health Service Use for the Winnipeg Regional Health Authority March 2001 Manitoba Centre for Health Policy and Evaluation Department of Community Health Sciences Faculty of Medicine, University of Manitoba Norman Frohlich, PhD Randy Fransoo, MSc Noralou Roos, PhD
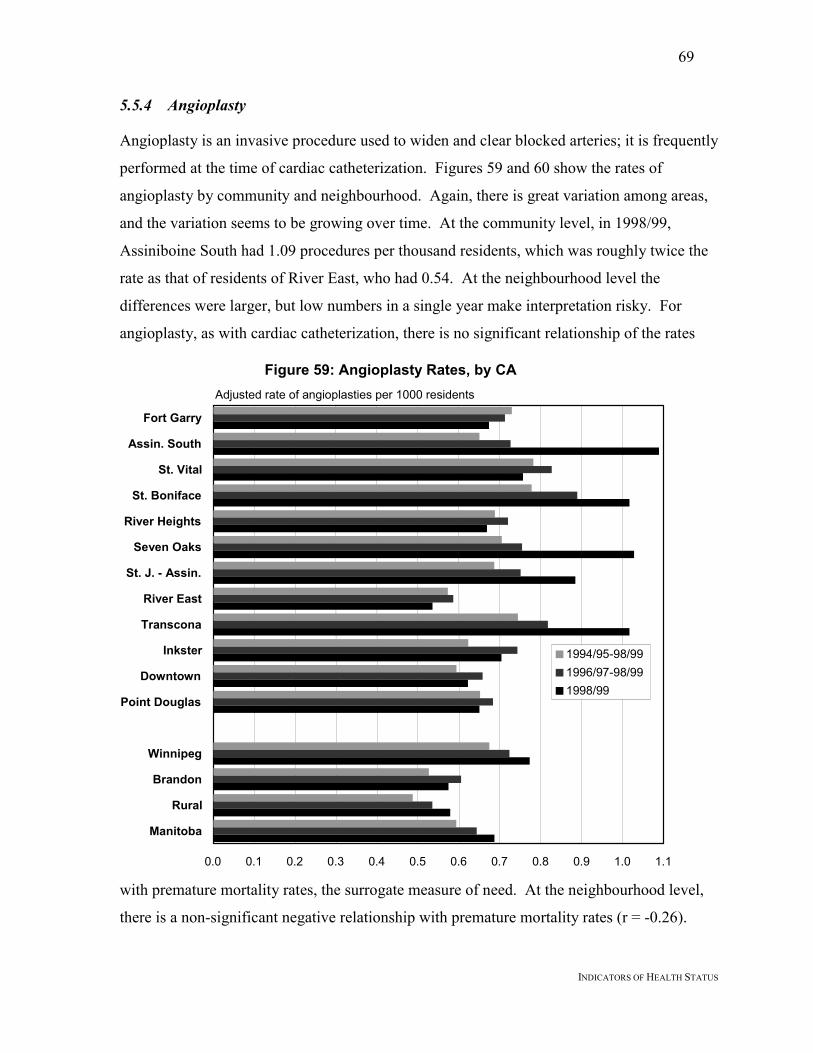
Transcript
Indicators of Health Statusand Health Service Use for theWinnipeg Regional Health Authority
March 2001
Manitoba Centre forHealth Policy and EvaluationDepartment of Community Health SciencesFaculty of Medicine, University of Manitoba
Norman Frohlich, PhDRandy Fransoo, MScNoralou Roos, PhD
i
ACKNOWLEDGEMENTS
Authors of a research report like this require the input and assistance of a great number ofpeople. We thank those listed below for their specific contributions, and others whose nameswe have inadvertently left off the list below. The usual disclaimer regarding our soleresponsibility applies especially since we have not been able to incorporate all suggestionsinto the current report.
For help in guiding and refining the main analyses, we thank our MCHPE colleaguesCharlyn Black, Patricia Martens, Marni Brownell, Sharon Bruce, Anita Kozyrskyj, CarolynDeCoster, Diane Watson, and Evelyn Shapiro. We also benefitted from input from others,including Dr. Blake McClarty (WRHA), Dr. Jan Trumble-Waddell (WRHA), Valerie Wiebe(WRHA) and Donna Turner (CancerCare Manitoba), among others.
For programming and technical assistance, we thank our team of Carmen Steinbach, LeonardMacWilliam, Charles Burchill, Randy Walld, David Friesen, Shelley Derksen, BogdanBogdanovic, and Pat Nicol.
We also thank our external reviewers for their comments: Ms. Maria Mathews (HealthServices Utilization and Review Commission of Saskatchewan), and Dr. Richard Stanwick(Medical Health Officer and Director of Research, Capital Health Region, Victoria, B.C.).
A report like this also requires the assistance of support staff, in this case, JanineHarasymchuk and Carole Ouelette. Finally, we thank the agencies which provided the datafor our analyses: Manitoba Health, the Vital Statistics Branch, and CancerCare Manitoba.
We acknowledge the Faculty of Medicine Health Research Ethics Board for their thoughtfulreview of this project. The Health Information Privacy Committee of Manitoba Health is keptinformed of all MCHPE deliverables for Manitoba Health. Strict policies and procedures toprotect the privacy and security of data have been followed in producing this report.
The results and conclusions are those of the authors and no official endorsement by ManitobaHealth was intended nor should be inferred. This report was prepared at the request ofManitoba Health as part of the contract between the University of Manitoba and ManitobaHealth.
ii
THE MANITOBA CENTRE FOR HEATH POLICY AND EVALUATION
The Manitoba Centre for Health Policy and Evaluation (MCHPE) is a unit within the
Department of Community Health Sciences, Faculty of Medicine, University of Manitoba.
MCHPE is active in health services research, evaluation and policy analysis, concentrating
on using the Manitoba Health database to describe and explain patterns of care and profiles
of health and illness.
Manitoba has one of the most complete, well-organized and useful databases in North
America. The database provides a comprehensive, longitudinal, population-based
administrative record of health care use in the province.
Members of MCHPE consult extensively with government officials, health care
administrators, and clinicians to develop a research agenda that is topical and relevant. This
strength, along with its rigorous academic standards and its exceptional database, uniquely
position MCHPE to contribute to improvements in the health policy process.
MCHPE undertakes several major research projects, such as this one, every
year under contract to Manitoba Health. In addition, MCHPE researchers secure major
funding through the competitive grants process. Widely published and internationally
recognized, they collaborate with a number of highly respected scientists from Canada, the
Table 1: Personal Care Home Beds and Populations, by Community, 1997/98 ..........................93
Table 2: Location of PCHs Chosen by Winnipeg Residents, Admitted 1993/94-1997/98 ..........94
LIST OF FIGURESFigure 1: Winnipeg’s 12 Community Areas (CAs) ........................................................................5Figure 2: Winnipeg’s 25 Neighbourhood Clusters (NCs) ..............................................................6Figure 3: Health Status of Winnipeg’s 12 Community Areas (CAs) ...........................................15Figure 4: Premature Mortality Rates, by CA,(1994-1998) ...........................................................16Figure 5: Health Status of Winnipeg’s 25 Neighbourhood Clusters (NCs)..................................18Figure 6: Premature Mortality Rates, by NC,(1994-1998) ...........................................................19Figure 7: Life Expectancy at Birth, by CA, 1998/99....................................................................21Figure 8: Life Expectancy at Birth, by NC, 1998/99....................................................................22Figure 9: Socioeconomic Factor Index (SEFI), by CHA, 1996....................................................24Figure 10: Socioeconomic Factor Index (SEFI), by NC, 1996.....................................................25Figure 11: Hypertension Treatment Prevalence, by CA...............................................................27Figure 12: Hypertension Treatment Prevalence, by NC...............................................................28Figure 13: Diabetes Treatment Prevalence, by CA ......................................................................29Figure 14: Diabetes Treatment Prevalence, by NC ......................................................................30Figure 15: Cancer Incidence Rates, by CA, 1993 – 1995.............................................................31Figure 16: Cancer Incidence Rates, by NC, 1993 – 1995.............................................................32Figure 17: Visit Rates to Physicians by CA, 1998/99 ..................................................................33Figure 18: Visit Rates to Physicians by NC, 1998/99 ..................................................................35Figure 19: Visit Rates to GP/FPs vs Premature Mortality by CA, 1998/99 .................................36Figure 20: Visit Rates to GP/FPs vs Premature Mortality by NC, 1998/99 .................................37Figure 21: Visit Rates to Specialists, by CA, 1998/99 .................................................................38Figure 22: Visit Rates to Specialists, by NC, 1998/99 .................................................................39Figure 23: Specialist Visit Rates vs Premature Mortality by CA, 1998/99 ..................................41Figure 24: Specialist Visit Rates vs Premature Mortality by NC, 1998/99 ..................................41Figure 25: Hospital Separation Rates, by CA, 1998/99................................................................42Figure 26: Hospital Separation Rates, by NC, 1998/99................................................................43Figure 27: Hospital Separation Rates vs Premature Mortality, by CA, 1998/99..........................44Figure 28: Hospital Separation Rates vs Premature Mortality, by NC, 1998/99..........................45Figure 29: Days of Hospital Care, by CA, 1998/99......................................................................46Figure 30: Days of Hospital Care, by NC, 1998/99......................................................................47Figure 31: Hospitals Used by Patients From Fort Garry ..............................................................49Figure 32: Hospitals Used by Patients From Assiniboine South..................................................49Figure 33: Hospitals Used by Patients From St. Vital ..................................................................49Figure 34: Hospitals Used by Patients From St. Boniface............................................................49Figure 35: Hospitals Used by Patients From River Heights .........................................................50Figure 36: Hospitals Used by Patients From Seven Oaks ............................................................50Figure 37: Hospitals Used by Patients From St. James – Assiniboia ...........................................50
vi
Figure 38: Hospitals Used by Patients From River East...............................................................50Figure 39: Hospitals Used by Patients From Transcona...............................................................51Figure 40: Hospitals Used by Patients From Inkster ....................................................................51Figure 41: Hospitals Used by Patients From Downtown..............................................................51Figure 42: Hospitals Used by Patients From Point Douglas.........................................................51Figure 43: Cases Using Intensive Care, by CA, 1994/95 – 1998/99 ............................................53Figure 44: Cases in Intensive Care, by NC, 1994/95 – 1998/99...................................................54Figure 45: Days in ICU, by CA, 1994/95 – 1998/99 ....................................................................55Figure 46: Days in Intensive Care, by NC, 1994/95 – 1998/99....................................................56Figure 47: CT Scan Rates, by CA, 1998/99..................................................................................57Figure 48: CT Scan Rates, by NC, 1998/99..................................................................................58Figure 49: Total CT Scan Rates vs Premature Mortality by CA, 1998/99 ...................................60Figure 50: Total CT Scan Rates vs Premature Mortality by NC, 1998/99 ...................................60Figure 51: MRI Scan Rates, by CA ..............................................................................................61Figure 52: MRI Scan Rates, by NC ..............................................................................................62Figure 53: Cardiac Catheterization Rates, by CA.........................................................................64Figure 54: Cardiac Catheterization Rates, by NC.........................................................................65Figure 55: Cardiac Catheterization Rates vs Premature Mortality
by CA, 1994/95 – 1998/99.................................................................................................67Figure 56: Cardiac Catheterization Rates vs Premature Mortality by CA, 1998/99 ....................67Figure 57: Cardiac Catheterization Rates vs Premature Mortality,
by NC, 1994/95 – 1998/99.................................................................................................68Figure 58: Cardiac Catheterization Rates vs Premature Mortality, by NC, 1998/99 ...................68Figure 59: Angioplasty Rates, by CA...........................................................................................69Figure 60: Angioplasty Rates, by NC...........................................................................................71Figure 61: Angioplasty Rates vs Premature Mortality by CA, 1994/95 – 1998/99......................72Figure 62: Angioplasty Rates vs Premature Mortality by NC, 1998/99.......................................72Figure 63: Coronary Artery Bypass Surgery Rates, by CA..........................................................73Figure 64: Coronary Artery Bypass Surgery Rates, by NC..........................................................74Figure 65: Coronary Artery Bypass Surgery vs Premature Mortality,
by CA, 1994/95 – 1998/99.................................................................................................75Figure 66: Coronary Artery Bypass Surgery vs Premature Mortality, by CA, 1998/99 ..............75Figure 67: Cataract Surgery Rates, by CA, 1998/99 ....................................................................76Figure 68: Cataract Surgery Rates, by NC, 1998/99 ....................................................................77Figure 69: Cataract Surgery Rates vs Premature Mortality by CA, 1998/99 ...............................78Figure 70: Cataract Surgery Rates vs Premature Mortality by NC, 1998/99 ...............................78Figure 71: Hip Replacement Rates, by CA...................................................................................79Figure 72: Hip Replacement Rates, by NC...................................................................................80Figure 73: Knee Replacement Rates, by CA ................................................................................81Figure 74: Knee Replacement Rates, by NC ................................................................................82Figure 75: Rate of Caesarean Sections, by CA.............................................................................83Figure 76: Rate of Caesarean Sections, by NC.............................................................................85Figure 77: Hysterectomy Rates, by CA ........................................................................................86Figure 78: Hysterectomy Rates, by NC ........................................................................................87Figure 79: Tonsillectomy and/or Adenoidectomy Rates, by CA..................................................88Figure 80: Tonsillectomy and/or Adenoidectomy Rates, by NC..................................................89
vii
Figure 81: Cholecystectomy Rates, by CA...................................................................................90Figure 82: Cholecystectomy Rates, by NC...................................................................................91Figure 83: Residents in PCH, by CA, 1997/98.............................................................................95Figure 84: Residents in PCH, by NC, 1997/98.............................................................................96Figure 85: Admissions to PCH, by CA, 1993/94 – 1997/98 ........................................................97Figure 86: Admissions to PCH, by NC, 1993/94 – 1997/98 ........................................................98Figure 87: Waiting Times for PCH Admission, by CA, 1997/98.................................................99Figure 88: Waiting Times for PCH Admission, by NC, 1997/98...............................................100Figure 89: Childhood Immunization Rates, by CA ....................................................................102Figure 90: Childhood Immunization Rates, by NC ....................................................................103Figure 91: Cervical Cancer Screening Rates, by CA..................................................................104Figure 92: Cervical Cancer Screening Rates, by NC..................................................................105Figure 93: Breast Cancer Screening Rates, by CA.....................................................................106Figure 94: Breast Cancer Screening Rates, by NC.....................................................................107
INDICATORS OF HEALTH STATUS
EXECUTIVE SUMMARY
This report provides information on the health status and health service use of the population
of the Winnipeg Health Region as baseline information for the recently formed Winnipeg
Regional Health Authority (WRHA). Administratively, the Winnipeg Region is divided into
12 Community Areas (CA) and further into 25 Neighbourhood Clusters (NC). Our analyses
match these definitions to ensure consistency. It is hoped that the data will prove useful in
the management of existing and proposed services, and provide a benchmark against which
the effects of future changes can be compared.
Most analyses for this report were based on information from fiscal year 1998/99. However,
for some analyses, three-year (1996/97 – 1998/99) and five-year periods (1994/95 – 1998/99)
were also used. These multi-year values provide more reliable estimates and allow for the
examination of trends in the data.
The report addresses the distribution of services across the various areas of the city with
emphasis on the extent to which service use in the areas corresponds to the health status of
the populations in the areas.
Finding a measure of health status that is independent of health care service use is a difficult
problem that has bedeviled many health policy analysts. It is generally acknowledged that no
perfect measure exists. Nevertheless, one measure has come to be recognized as an
acceptable approximation.
The Premature Mortality Rate (PMR) tells us how many people die before reaching age 75.
Though strictly a mortality measure, the premature mortality rate is highly correlated with
morbidity indicators (measures of ‘sickness’ rather than death). So areas where populations
have higher premature mortality rates tend to report poorer general health status, more
chronic diseases, and more sickness. As a result, the premature mortality rate has been called
the best single indicator of health status capturing the need for health care. We use the
premature mortality rate throughout the report as our surrogate measure for poor health
status, and hence, indirectly, as a measure of need for health care services.
2
INDICATORS OF HEALTH STATUS
Data on the prevalence of chronic diseases, which are also indicators of poor health, tend to
confirm the utility of using premature mortality as a surrogate measure for poor health status.
There is a clear and strong relationship between premature mortality rates and several
indicators of disease prevalence. Premature mortality rates are also highly correlated with
our index of socioeconomic status: the Socioeconomic Factor Index (SEFI). This is
consistent with a large body of research showing that those in lower socioeconomic groups
have poorer health status.
Using the premature mortality rate as a metric, it is clear that the Winnipeg Regional Health
Authority provides health care services to areas in which the health status of the residents are
very different. The premature mortality rates for residents of the 12 communities varies by
more than a factor of two from the healthiest (Fort Garry) to the least healthy (Point
Douglas). But even within some of the communities there are major differences in premature
mortality rates. Sub-dividing the communities into the 25 neighbourhoods allows one to
identify distinct areas with very different rates of premature mortality, and different
utilization rates of various health care services. The most dramatic example of the insight
gained by the subdivision of communities can be found by looking at Inkster. That
community, having the third highest premature mortality rate, is divided into two
neighbourhoods: Inkster East and West. Inkster East has the third highest premature
mortality rate among the 25 neighbourhoods, while Inkster West has the second lowest rate!
They are obviously populated by individuals with very different characteristics. Planning for
the delivery of services could benefit from taking those differences into account.
We find, as might be expected, that the use of many services is higher in areas with
populations of poorer health status. For other services, however, this is not the case. The use
of most basic services, such as visits to general & family practitioners, and most measures of
hospital use (separations and days) are closely related to need as measured by premature
mortality. On the other hand, the use of specialist physicians is not positively related to this
measure of need. Indeed, there seems to be no relationship between specialist visit rates and
premature mortality rates.
3
INDICATORS OF HEALTH STATUS
A set of anomalous findings is a group of negative relationships between premature mortality
rates and the use of a variety of high profile procedures. MRI scans, angioplasty, coronary
artery bypass surgery, hip replacement, and knee replacement rates are all higher in areas
with areas that are healthier as measured by premature mortality rates. Recent increases in
the number of these services performed have not, in general, brought utilization closer into
line with premature mortality. Rather, increased volumes have simply increased the
differences among the areas, leading to greater variation in utilization rates that are not
related to our measure of need. There are, apparently, impediments in the system which lead
individuals from areas with poorer health to use these procedures less frequently. On the
other hand, no such negative relationships were found between premature mortality rates and
rates of coronary catheterization or cataract surgery.
There is wide variation in the utilization rates of personal care homes across areas. Access to
personal care homes appears to be positively related to poor health status as indicated by
premature mortality rates, but waiting times seem to show no systematic relationship to need.
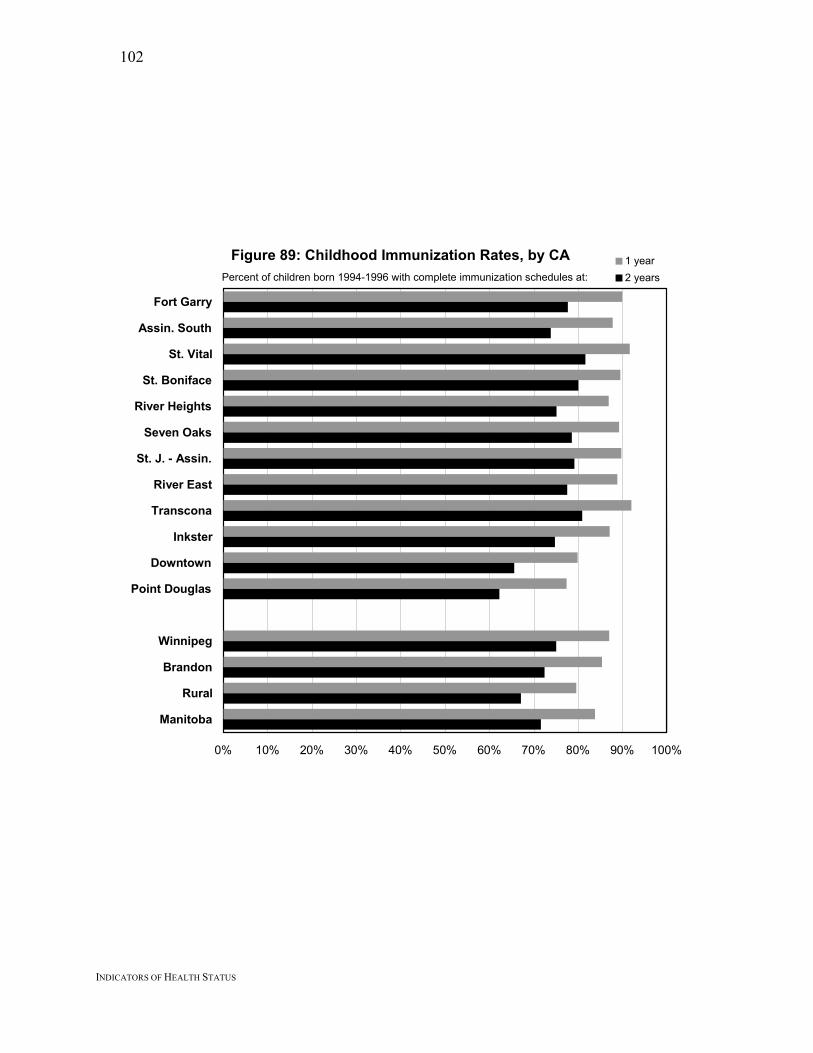
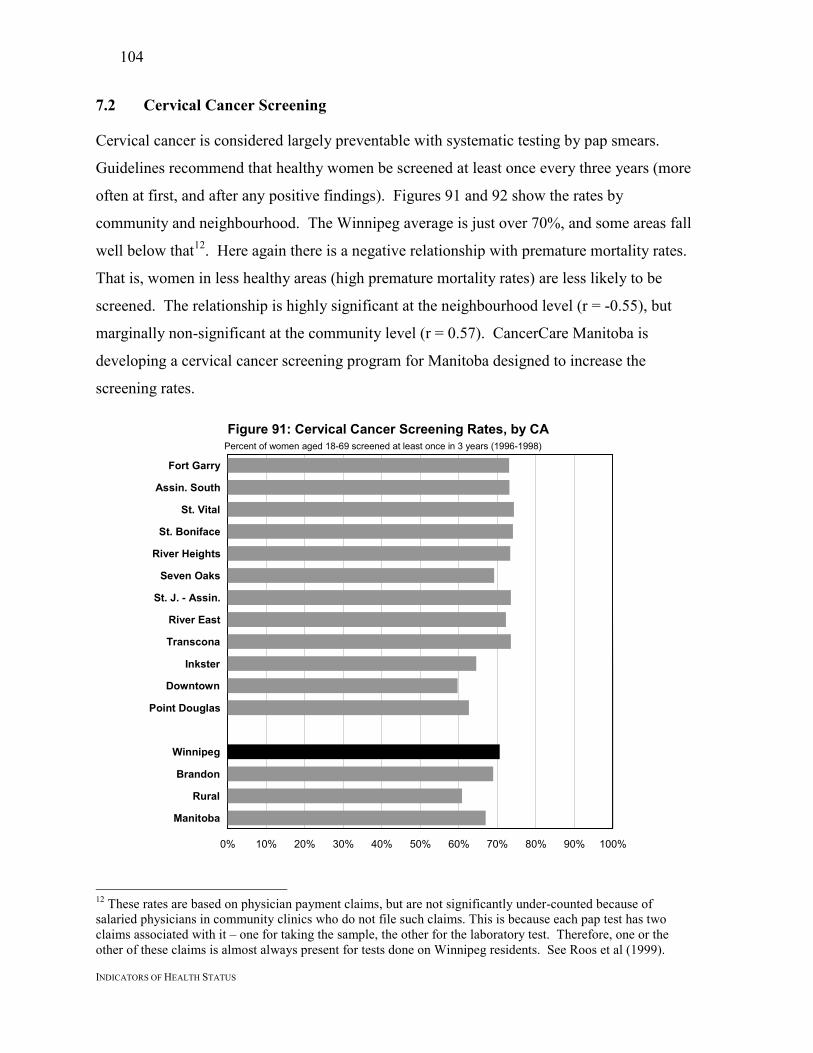
Preventative services provide the most uniform and discouraging picture. In all three service
areas examined: childhood immunization rates, cervical cancer screening rates, and breast
cancer screening rates; residents of the healthier areas (as measured by premature mortality)
used the services more than did residents from areas with less healthy populations.
In summary, it appears that basic services are being provided in accordance with need as
measured by our best indicator of population health status: premature mortality rates.
However, a variety of high profile and preventative services do not conform to that pattern.
An examination of the causes of these anomalies with an eye to how they might be addressed
would serve to bring the full range of services closer in alignment with the health care needs
of the Winnipeg population.
4
INDICATORS OF HEALTH STATUS
1. INTRODUCTION
1.1 Objective
The purpose of this report is to provide information on the health status and health service
use of the population of the Winnipeg Health Region. It largely mirrors MCHPE’s previous
report for the rural Regional Health Authorities (see Black et al., 1999), but provides more
detailed information for Winnipeg by dividing it into its 12 Community Areas and further
into their 25 sub-divisions, called Neighbourhood Clusters. The report provides baseline
information for the recently formed Winnipeg Regional Health Authority, and should be
useful in the management of existing and proposed services. The results also provide a
benchmark against which the effects of future program changes can be compared.
1.2 The Winnipeg Regional Health Authority (WRHA)
The WRHA was officially formed on December 1, 1999, as a result of the amalgamation of
the former Winnipeg Hospital Authority and the Winnipeg Community and Long Term Care
Authority. The WRHA is responsible for the health of the Winnipeg population, and for
providing health care in Winnipeg, to both Winnipeggers and non-Winnipeg residents.
Figure 1 shows a map of Winnipeg and the 12 communities into which the city has been
divided; descriptions of the boundaries of these areas are found in Appendix 2. Ten of the 12
communities have been further sub-divided into smaller neighbourhoods to capture some of
the diversity within the communities. The neighbourhoods are shown in Figure 2.
1A St J - Assin. W1B St J - Assin. E2 Assiniboine S
3A Fort Garry N3B Fort Garry S4A St. Vital North4B St. Vital South5A St. Boniface W5B St. Boniface E6 Transcona
7A River East S7B River East W7C River East E7D River East N8A Seven Oaks W8B Seven Oaks E8C Seven Oaks N9A Inkster West9B Inkster East
10A Pt Douglas N10B Pt Douglas S11A Downtown W11B Downtown E12A River Hghts W12B River Hghts E
7
INDICATORS OF HEALTH STATUS
1.3 POPULIS
The mission of the Manitoba Centre for Health Policy and Evaluation (MCHPE) is to provide
accurate and timely information to health care decision makers, analysts and providers, so
they can offer services which are efficient and effective in improving the health of
Manitobans. As part of its responsibilities, MCHPE has developed the Population Health
Information System (POPULIS). This system is designed to facilitate the examination of the
relationships between the health of the population and health care service use.
Historically, allocations for health care services have been made in response to demands
based on population growth, increases in intensity of use, technological imperatives and
political pressure. As a result, there has been no systematic plan to match the availability of
facilities or the number and specialties of physicians and their locations to the health needs of
populations. It has been difficult to arrange such plans because assessments of medical care
typically focus on the clinical outcomes of individual treatments and on the quality of care
delivered by specific providers and/or institutions, rather than on the health of populations.
MCHPE developed POPULIS in the hope of facilitating rational decision making and,
ultimately, shifting discussions from a focus on the demand for health care to the demand for
health.
POPULIS focuses first and foremost on the health of the population as the starting point for
making sense of all other information. POPULIS makes it possible to compare the health
status of residents of different areas, as well as the supply and utilization of health care
resources (hospitals, physicians, personal care homes, etc.). Because people often travel for
care, local supply and availability do not necessarily determine use patterns. Therefore,
POPULIS tracks all use by residents of a given geographical area, regardless of where the
use occurred. This population-based approach describes the total utilization profile of all
residents of each region, rather than examining care provided by ‘in-area’ providers or
facilities. POPULIS also links data from census files to describe socioeconomic status,
which has long been related to health outcomes and need for health care. In general, the
lower the socioeconomic status, the poorer the health status and the greater the need for
8
INDICATORS OF HEALTH STATUS
health care. So, for example, lower levels of education or higher levels of unemployment are
usually associated with poorer health status for the population of that area.
1.4 Comparative Information
POPULIS provides decision-makers and the public with information to assess and respond to
questions such as:
• How healthy are the residents of the various areas? How much variation is there
within these areas?
• Are high-risk populations poorly served by the health care system or do they have
poor health outcomes despite high use patterns?
• Are utilization patterns related to need?
This report starts with a comparative analysis of the health status of Winnipeg residents, by
communities and neighbourhoods. This is followed by a closer examination of specific
indicators of service usage, presented as a series of graphs. The comparative information in
this report includes a broad variety of measures encompassing the major service sectors.
The Winnipeg Regional Health Authority (WRHA) has already completed a thorough survey
and demographic analysis that can serve as a reference for those interested in the underlying
demographics of the city (WRHA, 2000). Accordingly, we have not duplicated their effort
here.
The major focus of this report is on providing a comprehensive set of indicators, rather than
on extensive analysis or statistical testing for patterns. Whenever possible, we used
statistical techniques to identify values that are significantly different (i.e. unlikely to be due
to chance) from the Winnipeg average, using 95% confidence intervals. That means that
differences have a 95% chance of being due to real underlying causes rather than random
variation. Rates significantly above or below the Winnipeg average referred to in the graphs
are marked with an asterisk (*). Because small numbers of some events produce highly
variable rates from year to year, rates that appear much higher or lower than the average
9
INDICATORS OF HEALTH STATUS
sometimes do not have an asterisk beside them. This may reflect the small population used
to calculate the rate, so the difference does not meet statistical significance.
We have focused on graphical presentation of indicators, with less emphasis on detailed
interpretation of these graphs. For each indicator, we have provided some background about
why the indicator is important, an explanation as to how it was calculated, and some
discussion about how to interpret differences. We note a number of significant differences in
use and health status, and with a few exceptions, we have not attempted to provide a
comprehensive explanation of these differences. Not only would such an attempt go well
beyond the mandate of this study, but we also believe that much of this interpretation should
be based on an understanding of a variety of local circumstances.
Finally, it should be borne in mind that our indicators are averages and that each area
contains individuals with a range of health statuses and utilization levels. For example, not
everybody in a ‘poor-health’ area has poor health. Nevertheless, the averages reflect the
overall patterns for residents of each area.
10
INDICATORS OF HEALTH STATUS
2. METHODS
Information for all indicators is provided at the Community Area (CA) and Neighbourhood
Cluster (NC) levels. All residents of Winnipeg (see Appendix 2 for definition) were included
in the analyses. Complete details of the methods used are found in Appendix 1.
Most analyses for this report were based on information from fiscal year 1998/99. However,
for some analyses involving relatively infrequent events, three-year (1996/97 – 1998/99) and
five-year periods (1994/95 – 1998/99) were also used. These multi-year values provide more
reliable estimates, and allow for the examination of trends in the data.
Virtually all utilization rates shown in this report have been age and sex adjusted, to account
for the different demographics of the various sub-areas of Winnipeg. Areas with more
elderly residents would be expected to have higher utilization rates, so the adjustment is done
to account for these differences. As a result, rate differences among areas cannot be
attributed to differences in population characteristics. This adjustment also accounts for
general population aging, so the increasing number of procedures (over time) reported in
several sections cannot be attributed to population aging. Confidence intervals (95%,
adjusted for multiple comparisons) were used to determine whether any area’s adjusted rate
was statistically different from the Winnipeg average. Even though statistical difference
does not necessarily imply medical or practical significance, it remains important because
differences which do not meet an acceptable level of statistical significance may not be ‘real’
differences at all (that is, they may be due to chance).
For most indicators, data are presented in pairs of graphs: first at the community level (12),
then at the neighbourhood level (25). In addition to the bar graphs, we also present scatter-
graphs of some indicators against premature mortality rates, to see whether services are being
provided in accordance with this strong though imperfect indicator of need. These serve as
illustrations of the extent to which groups having poorer health receive more services.
However, it is important to remember that the areas analyzed are so large that they do not
11
INDICATORS OF HEALTH STATUS
represent homogeneous groups. Hence, the relationships identified are only of average
scores of all individuals in the area.
We are conscious of tradeoffs which must be made in moving between analyses at the
community and neighbourhood levels. The latter are smaller, more homogeneous and more
numerous than the former. Their homogeneity and larger number give analyses using them
more statistical power than analyses at the community level. On that account, one might pay
more attention to the trends identified in the neighbourhood analyses. On the other hand, for
relatively infrequent procedures, the populations of the neighbourhoods may be so small that
small numbers of procedures per neighbourhood may wash out statistical significance. In
most cases reported here there is agreement between the analyses at the two levels, but some
attention to cases in which they differ may be warranted.
We use the premature mortality rate as a surrogate measure of need for health care services
(see below). The discussion for each indicator includes comment on the nature and strength
of the relationship between that measure and the premature mortality rate. We used the
Spearman’s rank order correlation coefficients for all analyses (Appendix 3). We chose this
non-parametric test primarily because premature mortality rates are not randomly distributed.
The correlation coefficient ‘r’ is a number ranging from +1 to –1, and indicates how much of
the variation in – say – physician visits can be accounted for by premature mortality. The
statistic is a measure of how close the rankings of the areas are on the two measures. For
example, suppose we wanted to compare premature mortality rates and physician visit rates
across communities. We would rank the communities in order of their premature mortality
rates, from a ‘1’ for the community with the lowest rate, to a ‘12’ for the area with the
highest rate. We would also rank the communities according to their physician visit rates,
from ‘1’ for the area with the lowest visit rate, up to 12 for the area with the highest visit rate.
If the two lists corresponded perfectly, the correlation would be 1. A value of 1 for the
statistic would mean that the higher the premature mortality rate the greater the number of
visits and that the relationship is perfect. That is, if r = 1, we say that all the variation in
visits is accounted for by premature mortality. A correlation coefficient of 0.7 would mean
12
INDICATORS OF HEALTH STATUS
that there was still a strong positive relationship between the two, but some of the community
rankings on premature mortality do not quite fit with their ranking on visits. If there is no
relationship between the rankings, then the statistic would be zero. The statistic takes on
negative values if the relationship between the rankings is inverted; that is, if areas with
higher premature mortality rates had lower visit rates.
For simplicity and ease of reading, we note the ‘r’ values for all correlations (which tell us
about the strength of the relationship), but not the ‘p’ values (which tell us about the level of
statistical significance). Relationships which reach at least the p<0.05 level are referred to as
‘significant,’ having less than a 5% probability of being due to chance. Those which do not
meet that level of statistical significance are referred to as ‘not significant’.
Appendix 3 provides a complete listing of correlation coefficients and statistical significance.
13
INDICATORS OF HEALTH STATUS
3. HEALTH STATUS AND NEED FOR HEALTH CARE
3.1 Conceptual Background
Tracking the way in which services are provided to various groups, especially society’s most
vulnerable groups - those with the worst health status - is critical. The elderly and those of
lower socioeconomic status are examples of vulnerable groups at high risk for poor health.
We would expect them to be among the heaviest users of health care services. Other
examples of vulnerable groups might include specific ethnic groups and the very young.
Monitoring the relative allocations of health care resources to high-need groups permits
tracking the impact of health reform on equity in the delivery of care. A system could be
said to have become less equitable if those groups with the poorest health become relatively
more disadvantaged.
Birch et al (1993) argue that the allocation of health care resources based on relative need for
care involves two different elements: equity and efficiency. It is a question of equity that
those suffering poor health receive more treatment. But there is also a question of efficiency
involved when one talks about allocating care on the basis of need. A very sick person may
be able to benefit less from a given treatment than someone in slightly better health. So,
efficiency and equity can conflict. In general, we know little about the effectiveness of
specific health care interventions on different groups in a population. To know this we
would require information about each group’s capacity to benefit, and about the relative
efficiency of various treatment alternatives (particularly if non-health care alternatives are
considered).
Given these considerations, defining “need” is at best problematic. However, following
Birch et al (1993), the concept of relative distribution is central; we can ask the question: “Do
those groups in poorest health receive more care than those groups in better health?” While
such standards for need do not directly address the question of effectiveness, the evidence is
strong that those in poor health have more conditions for which health care can offer
prevention, relief from pain, a supportive environment, and palliation of symptoms.
14
INDICATORS OF HEALTH STATUS
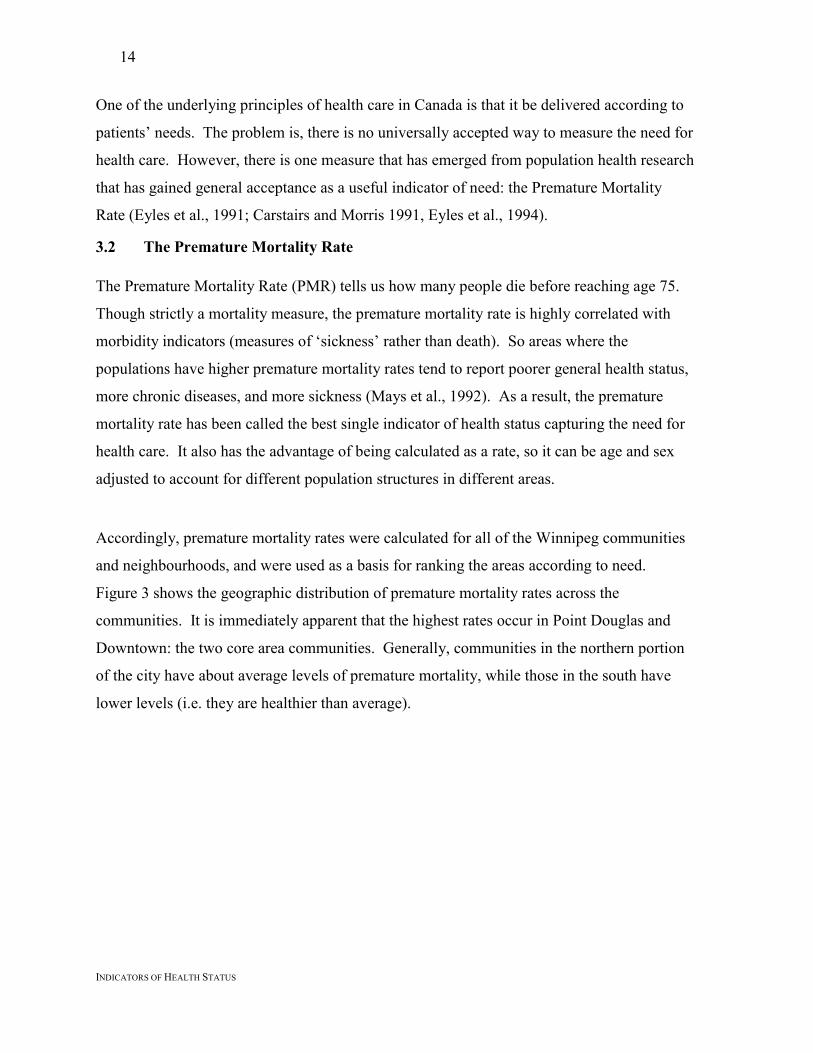
One of the underlying principles of health care in Canada is that it be delivered according to
patients’ needs. The problem is, there is no universally accepted way to measure the need for
health care. However, there is one measure that has emerged from population health research
that has gained general acceptance as a useful indicator of need: the Premature Mortality
Rate (Eyles et al., 1991; Carstairs and Morris 1991, Eyles et al., 1994).
3.2 The Premature Mortality Rate
The Premature Mortality Rate (PMR) tells us how many people die before reaching age 75.
Though strictly a mortality measure, the premature mortality rate is highly correlated with
morbidity indicators (measures of ‘sickness’ rather than death). So areas where the
populations have higher premature mortality rates tend to report poorer general health status,
more chronic diseases, and more sickness (Mays et al., 1992). As a result, the premature
mortality rate has been called the best single indicator of health status capturing the need for
health care. It also has the advantage of being calculated as a rate, so it can be age and sex
adjusted to account for different population structures in different areas.
Accordingly, premature mortality rates were calculated for all of the Winnipeg communities
and neighbourhoods, and were used as a basis for ranking the areas according to need.
Figure 3 shows the geographic distribution of premature mortality rates across the
communities. It is immediately apparent that the highest rates occur in Point Douglas and
Downtown: the two core area communities. Generally, communities in the northern portion
of the city have about average levels of premature mortality, while those in the south have
lower levels (i.e. they are healthier than average).
15
INDICATORS OF HEALTH STATUS
Fort Garry
Assiniboine South
St. Vital
St. BonifaceRiverHghts
Seven Oaks
St. James–Assiniboia
River East
Transcona
Inkster Point Douglas
Downtown
Figure 3: Health Status of Winnipeg’s 12 Community Areas (CAs)
Low
High
Premature Mortality Rates
Average
Fort Garry 2.3Assin. South 2.4St. Vital 2.9St. Boniface 3.0River Heights 3.0Seven Oaks 3.1St. J. - Assin. 3.2River East 3.2Transcona 3.3Inkster 3.6Downtown 4.8Point Douglas 5.0
16
INDICATORS OF HEALTH STATUS
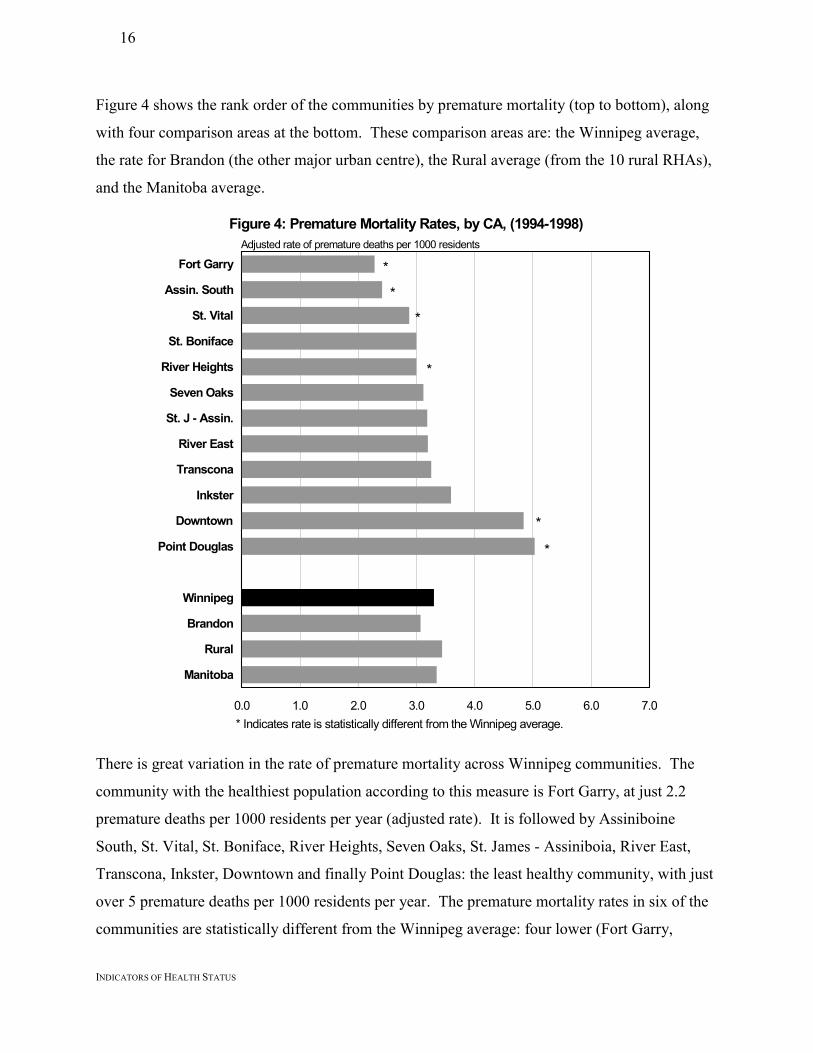
Figure 4 shows the rank order of the communities by premature mortality (top to bottom), along
with four comparison areas at the bottom. These comparison areas are: the Winnipeg average,
the rate for Brandon (the other major urban centre), the Rural average (from the 10 rural RHAs),
and the Manitoba average.
Figure 4: Premature Mortality Rates, by CA, (1994-1998)
0.0 1.0 2.0 3.0 4.0 5.0 6.0 7.0
Fort Garry
Assin. South
St. Vital
St. Boniface
River Heights
Seven Oaks
St. J - Assin.
River East
Transcona
Inkster
Downtown
Point Douglas
Winnipeg
Brandon
Rural
Manitoba
*
*
*
*
*
*
* Indicates rate is statistically different from the Winnipeg average.
Adjusted rate of premature deaths per 1000 residents
There is great variation in the rate of premature mortality across Winnipeg communities. The
community with the healthiest population according to this measure is Fort Garry, at just 2.2
premature deaths per 1000 residents per year (adjusted rate). It is followed by Assiniboine
South, St. Vital, St. Boniface, River Heights, Seven Oaks, St. James - Assiniboia, River East,
Transcona, Inkster, Downtown and finally Point Douglas: the least healthy community, with just
over 5 premature deaths per 1000 residents per year. The premature mortality rates in six of the
communities are statistically different from the Winnipeg average: four lower (Fort Garry,
17
INDICATORS OF HEALTH STATUS
Assiniboine South, St. Vital and River Heights) and two higher (Downtown and Point Douglas).
(Although River Heights and St. Boniface have almost identical premature mortality rates, River
Heights has more residents, so it’s difference is statistically significant, while that for St.
Boniface is not.) Premature mortality rates for the remaining communities are not statistically
different from the Winnipeg average. The difference between Fort Garry and Point Douglas
(the areas with the lowest and highest premature mortality rates) is greater than a factor of two,
which emphasizes the wide range of health status within the city.
The ranking of communities according to premature mortality used in Figure 4 is used in all
subsequent community graphs in this report, to assist with the understanding and interpretation
of the data. In general, if health service use corresponds to need (as measured by premature
mortality rates), then the areas listed near the top of the figure should have the lowest levels of
use and those at the bottom, the highest. Moreover, there should be a gradual increase as one
moves from the more healthy to the less healthy areas. Accordingly, Fort Garry and
Assiniboine South at the top of the figures should generally have lower rates, corresponding to
short bars, while communities at the bottom of the graph, Downtown and Point Douglas, should
have the longest bars for most services. The reader can thus readily determine from the shape of
the graph whether services are provided roughly according to this measure of need. Consistent
ordering also makes it easier to locate any given area in each graph.
Figure 5 shows the geographic distribution of premature mortality among the 25
neighbourhoods. A comparison of Figure 5 with Figure 3 helps explain why we thought it was
important to divide the communities into the smaller neighbourhoods for the purposes of
analysis. Nine of the 25 neighbourhoods have premature mortality rates categorized differently
from that of the larger communities in which they are located. St. Boniface East, Inkster West,
Downtown West and St. James - Assiniboia West have lower premature mortality rates than the
communities in which they are located, while River Heights East, St. Vital North, St. James -
Assiniboia East, River East South and Inkster East have higher rates than their communities.
The most dramatic finding emerging from this segmentation is the community of Inkster, which
has average premature mortality, but is divided into two neighbourhoods (Inkster East and
West)
18
INDICATORS OF HEALTH STATUS
Figure 5: Health Status of Winnipeg’s 25 Neighbourhood Clusters (NCs)
Low
High
8C
2
3B
4B
7D
5B
1B 61A
8A
3A
8B
7C
12A
7B
4A
9B
9A
11A 11B
7A
10A
5A
12B
10B
Premature Mortality Rates
3B Fort Garry S 2.15
3A Fort Garry N 2.432 Assiniboine S 2.41
4B St. Vital South 2.60
4A St. Vital North 3.14
5B St. Boniface E 2.70
5A St. Boniface W 3.50
12A River Hghts W 2.59
12B River Hghts E 3.85
8A Seven Oaks W 2.97
8C Seven Oaks N 3.038B Seven Oaks E 3.31
1A St J - Assin. W 2.56
1B St J - Assin. E 3.91
7D River East N 2.33
7C River East E 2.84
7B River East W 3.09
7A River East S 4.20
6 Transcona 3.26
9A Inkster West 2.23
9B Inkster East 4.7611A Downtown W 3.73
11B Downtown E 6.11
10A Pt Douglas N 4.11
10B Pt Douglas S 6.85
Average
19
INDICATORS OF HEALTH STATUS
which have respectively below and above average premature mortality rates. The same is
true for the community of St. James - Assiniboia: its West community has below average
premature mortality, while St. James - Assiniboia East has above average premature
mortality.
Figure 6 shows the Neighbourhood Clusters (NCs) ranked by premature mortality rates,
while still preserving the overall community rankings. Therefore, the first pair of
neighbourhoods (Fort Garry South and North) are those that make up the most healthy
community (Fort Garry), and the last pair of neighbourhoods (Point Douglas North and
South) are those that make up the least healthy community (Point Douglas). This ordering of
neighbourhoods within communities shows the variations within and between communities.
At the neighbourhood level, there is even more variation in premature mortality rates than
among communities: the range is from 2.15 in Fort Garry South to 6.9 in Point Douglas
South – a more than threefold variation. Furthermore, the heterogeneity of the
neighbourhoods within communities is also evident. While this report cannot explain
differences of this sort, appreciating their existence is important in understanding how other
indicators of health status and service use vary. Differences of this magnitude, besides being
statistically significant, are also substantively important in terms of health service planning.
The large differences in premature mortality are likely to correspond to differences in health
status and, consequently, to differences in need for health care services. From a planning
perspective, this provides evidence regarding where services might best be targeted. This
underlines the utility of dividing the communities into their finer component neighbourhoods.
20
INDICATORS OF HEALTH STATUS
Figure 6: Premature Mortality Rates, by NC, (1994-1998)
0.0 1.0 2.0 3.0 4.0 5.0 6.0 7.0
Fort Garry S (3B)
Fort Garry N (3A)
Assiniboine S (2)
St. Vital South (4B)
St. Vital North (4A)
St. Boniface E (5B)
St. Boniface W (5A)
River Hghts W (12A)
River Hghts E (12B)
Seven Oaks W (8A)
Seven Oaks N (8C)
Seven Oaks E (8B)
St J - Assin. W (1A)
St J - Assin. E (1B)
River East N (7D)
River East E (7C)
River East W (7B)
River East S (7A)
Transcona (6)
Inkster West (9A)
Inkster East (9B)
Downtown W (11A)
Downtown E (11B)
Pt Douglas N (10A)
Pt Douglas S (10B)
Winnipeg
*
**
*
*
*
**
*
*
*
*
**
* Indicates rate is statistically different from the Winnipeg average.
Adjusted rate of premature deaths per 1000 residents
21
INDICATORS OF HEALTH STATUS
3.3 Life Expectancy
Perhaps the most commonly used measure of health status of a population is life expectancy,
typically expressed as the expected number of years of life at birth. We have calculated life
expectancy values by gender for each of the Winnipeg areas, and these are shown in Figures
7 and 8. On average, women live longer than men, but there is more variation among men
than women. The most remarkable observation is in Inkster West, where men live
considerably longer than men from any other neighbourhood. Among communities, the most
long lived populations of both men and women reside in Fort Garry, with average life
expectancies of 80 and 83.9 years respectively. The shortest lived reside in Point Douglas,
with life expectancies of 72.2 and 78.8 years respectively. Among neighbourhoods, the
longest lived men are found in Inkster West with an average life expectancy of 82.7 years,
while the longest lived women are from River East N (average 84.3 years). The least healthy
Figure 7: Life Expectancy at Birth, by CA, 1998/99
0 10 20 30 40 50 60 70 80 90
Fort Garry
Assin. South
St. Vital
St. Boniface
River Heights
Seven Oaks
St. J - Assin.
River East
Transcona
Inkster
Downtown
Point Douglas
Winnipeg
Brandon
Rural
Manitoba
MaleFemale
Expected length of life in years
22
INDICATORS OF HEALTH STATUS
neighbourhood for both genders in terms of life expectancy is Pt Douglas S with averages of
67.5 years for men and 75.7 for women. In terms of the difference between genders within
an area, the community with the least difference is Assiniboine South, where women live on
average 3.2 years longer than men, and the highest difference is in Downtown, where women
live 6.8 years longer than men. Among neighbourhoods, Inkster West has the least
Figure 8: Life Expectancy at Birth, by NC, 1998/99
0 10 20 30 40 50 60 70 80 90
Fort Garry S (3B)
Fort Garry N (3A)
Assiniboine S (2)
St. Vital South (4B)
St. Vital North (4A)
St. Boniface E (5B)
St. Boniface W (5A)
River Hghts W (12A)
River Hghts E (12B)
Seven Oaks W (8A)
Seven Oaks N (8C)
Seven Oaks E (8B)
St J - Assin. W (1A)
St J - Assin. E (1B)
River East N (7D)
River East E (7C)
River East W (7B)
River East S (7A)
Transcona (6)
Inkster West (9A)
Inkster East (9B)
Downtown W (11A)
Downtown E (11B)
Pt Douglas N (10A)
Pt Douglas S (10B)
Winnipeg
MaleFemaleExpected length of life in years
23
INDICATORS OF HEALTH STATUS
difference, with men living on average only one year less than women, while the most
different is Inkster East, where women live on average 8.4 years longer than men.
Remarkably, these two neighbourhoods are in the same community (Inkster). This wide
divergence in the relative health of men and women across two neighbourhoods within the
same community has implications for the targeting of services and further emphasizes the
importance of separating the larger communities into neighbourhoods.
3.4 Socioeconomic Factor Index (SEFI)
A consistently strong, positive relationship between socioeconomic status and health status
has been demonstrated around the world, including in Canada: those in lower status groups
generally have poorer health. MCHPE has developed a composite measure to track
socioeconomic risk in Manitoba: the SocioEconomic Factor Index, shown in Figures 9 and
10. It uses factor analysis to combine data from the Canadian Census, including education
levels, unemployment rates, and family characteristics (see Appendix 1 for details). It is
expressed on a standardized scale, with the Manitoba average stated as 0. High values
correspond to areas that have higher levels of unemployment, lower levels of education,
higher levels of single parent families, and low female workforce participation. Low (and
negative) values indicate better socioeconomic status. Not surprisingly, the communities
which have the lowest SEFI scores (Assiniboine South at –0.76 and Fort Garry at –0.62) also
have the lowest premature mortality rates.
The areas with the highest premature mortality rates, Downtown and Point Douglas, have the
highest SEFI scores: 1.06 and 1.41. Figure 9 demonstrates the very close relationship
between SEFI levels and premature mortality, with the SEFI scores rising (in general) as
premature mortality rises from the top to the bottom of the graph. Figure 10, however, shows
the remarkable differences among the neighbourhoods on their SEFI scores, both within and
between communities.1 Here, as with premature mortality, the difference between the best
and worst off neighbourhoods is larger than between the corresponding communities. The
lowest SEFI is in River East North, at -0.97; the highest in Point Douglas South, 2.53, for a 1 Recall that neighbourhoods are not listed strictly in order of their premature mortality rates, and so SEFIscores do not increase uniformly as one moves down Figure 10. The order used illustrates the variation in SEFIvalues for neighbourhoods within each community.
24
INDICATORS OF HEALTH STATUS
range of 3.49, or 1.6 times the range between communities. Moreover, as with premature
mortality rates, the community of Inkster decomposes into two neighbourhoods with very
different SEFI scores. Inkster East has an above average SEFI of 1.21 while Inkster West is
below average at –0.41.
It is not surprising that there is a strong positive relationship between SEFI values and
premature mortality rates. At the community and neighbourhood levels, the correlations are
0.98 and 0.96, respectively. Most analyses reported here correlate premature mortality with
utilization measures. When the utilization measures are correlated with SEFI values, the
Figure 9: Socioeconomic Factor Index (SEFI), by CHA, 1996
-1.5 -1.0 -0.5 0.0 0.5 1.0 1.5
Fort Garry
Assin. South
St. Vital
St. Boniface
River Heights
Seven Oaks
St. J - Assin.
River East
Transcona
Inkster
Downtown
Point Douglas
Winnipeg
Brandon
Rural
Manitoba
Values on standardized scale; negative values indicate low risk (i.e. high SES)
25
INDICATORS OF HEALTH STATUS
Figure 10: Socioeconomic Factor Index (SEFI), by NC, 1996
-1.5 -1.0 -0.5 0.0 0.5 1.0 1.5 2.0 2.5 3.0
Fort Garry S (3B)
Fort Garry N (3A)
Assiniboine S (2)
St. Vital South (4B)
St. Vital North (4A)
St. Boniface E (5B)
St. Boniface W (5A)
River Hghts W (12A)
River Hghts E (12B)
Seven Oaks W (8A)
Seven Oaks N (8C)
Seven Oaks E (8B)
St J - Assin. W (1A)
St J - Assin. E (1B)
River East N (7D)
River East E (7C)
River East W (7B)
River East S (7A)
Transcona (6)
Inkster West (9A)
Inkster East (9B)
Downtown W (11A)
Downtown E (11B)
Pt Douglas N (10A)
Pt Douglas S (10B)
Winnipeg
Values on standardized scale; negative values indicate low risk (i.e. high SES)
results are essentially the same. Consequently, we report only the relationships between
premature mortality and utilization rates.
26
INDICATORS OF HEALTH STATUS
3.5 Chronic Diseases
Another basic measure of health status is the prevalence of disease. As our population ages,
chronic diseases play a larger role in health and health care. People are living longer, and so
there are increasing numbers of people living with chronic conditions (i.e. the prevalence of
these diseases is increasing). The administrative data used by MCHPE cannot always
directly determine who has a given condition, but it reliably reports who receives treatment
for those conditions. Therefore, we call these measures Treatment Prevalence values: they
indicate the rates at which residents of each area receive treatment for the given condition2.
These measures have been validated with survey results and clinical measures.
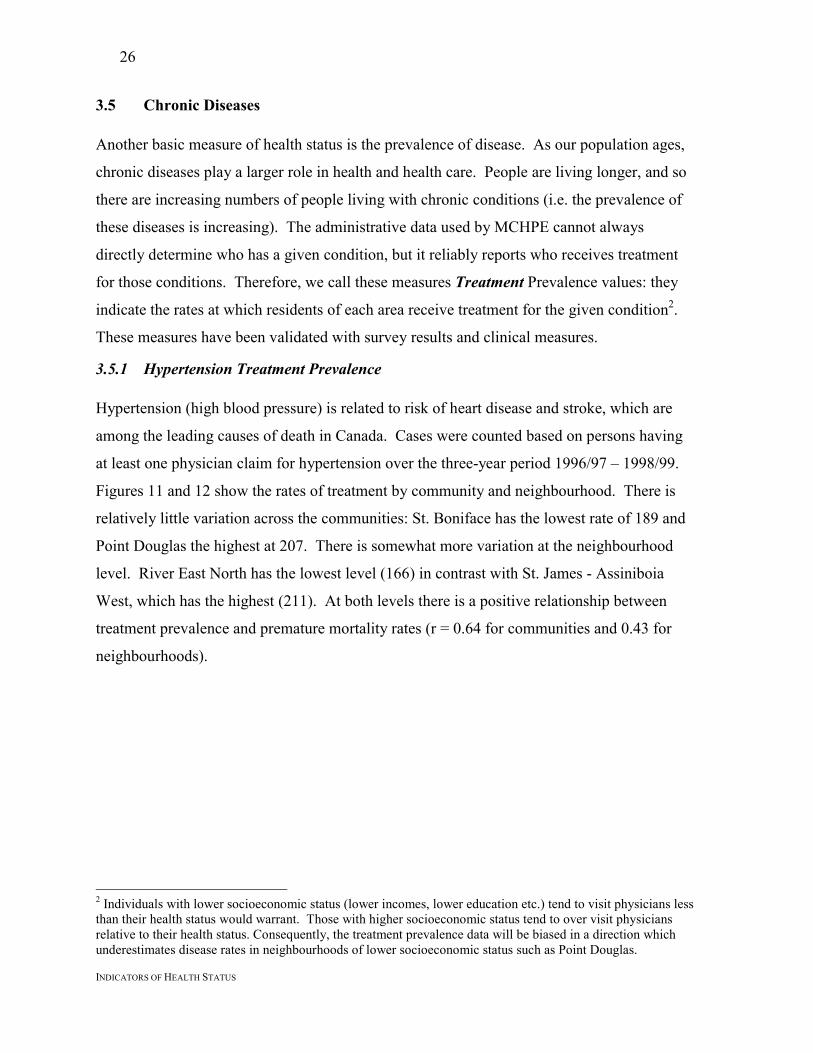
3.5.1 Hypertension Treatment Prevalence
Hypertension (high blood pressure) is related to risk of heart disease and stroke, which are
among the leading causes of death in Canada. Cases were counted based on persons having
at least one physician claim for hypertension over the three-year period 1996/97 – 1998/99.
Figures 11 and 12 show the rates of treatment by community and neighbourhood. There is
relatively little variation across the communities: St. Boniface has the lowest rate of 189 and
Point Douglas the highest at 207. There is somewhat more variation at the neighbourhood
level. River East North has the lowest level (166) in contrast with St. James - Assiniboia
West, which has the highest (211). At both levels there is a positive relationship between
treatment prevalence and premature mortality rates (r = 0.64 for communities and 0.43 for
neighbourhoods).
2 Individuals with lower socioeconomic status (lower incomes, lower education etc.) tend to visit physicians lessthan their health status would warrant. Those with higher socioeconomic status tend to over visit physiciansrelative to their health status. Consequently, the treatment prevalence data will be biased in a direction whichunderestimates disease rates in neighbourhoods of lower socioeconomic status such as Point Douglas.
27
INDICATORS OF HEALTH STATUS
This positive relationship between hypertension treatment prevalence and premature
mortality is consistent with the hypotheses that the premature mortality rate is associated
with poor health and that the medical system is detecting and treating this particular
condition. In the absence of hard data on the actual prevalence of the condition rather than
the treatment, we are unable to judge whether the strength of the response of the system is at
the appropriate level.
Figure 11: Hypertension Treatment Prevalence, by CA
0 25 50 75 100 125 150 175 200 225
Fort Garry
Assin. South
St. Vital
St. Boniface
River Heights
Seven Oaks
St. J. - Assin.
River East
Transcona
Inkster
Downtown
Point Douglas
Winnipeg
Brandon
Rural
Manitoba
Adjusted treatment prevalence per 1000 residents, 1996/97 - 1998/99
*
*
*
*
* Indicates rate is statistically different from the Winnipeg average.
28
INDICATORS OF HEALTH STATUS
Figure 12: Hypertension Treatment Prevalence, by NC
0 25 50 75 100 125 150 175 200 225
Fort Garry S (3B)
Fort Garry N (3A)
Assiniboine S (2)
St. Vital South (4B)
St. Vital North (4A)
St. Boniface E (5B)
St. Boniface W (5A)
River Hghts W (12A)
River Hghts E (12B)
Seven Oaks W (8A)
Seven Oaks N (8C)
Seven Oaks E (8B)
St J - Assin. W (1A)
St J - Assin. E (1B)
River East N (7D)
River East E (7C)
River East W (7B)
River East S (7A)
Transcona (6)
Inkster West (9A)
Inkster East (9B)
Downtown W (11A)
Downtown E (11B)
Pt Douglas N (10A)
Pt Douglas S (10B)
Winnipeg
Adjusted treatment prevalence per 1000 residents, 1996/97 - 1998/99
* Indicates rate is statistically different from the Winnipeg average.
*
**
*
*
**
*
29
INDICATORS OF HEALTH STATUS
3.5.2 Diabetes Mellitus
Diabetes mellitus is a chronic metabolic disease that must be carefully managed to avoid
serious deleterious consequences. Diabetes is becoming considerably more common,
particularly among Aboriginal peoples. For this analysis, diabetics were defined as those
with at least two physician visits, or at least one hospitalization, with a diagnosis of diabetes
(Type I or II), in the three-year period 1996/97 – 1998/993. Hence this measure, as with
hypertension, is a measure of treatment prevalence. Figures 13 and 14 show the rates by
community and neighbourhood. There is great variation across areas, and the rates are highly
significantly associated with premature mortality rates at both the neighbourhood and
community levels (r = 0.77 and 0.94). The community level variation ranges from a low of
38.5 in Assiniboine South to a high of 71 in Point Douglas. The neighbourhood variations
3 There may be differences in the severity of the cases which enter our definition via physician visits versushospitalization. Those differences are not explored in this report, but may be of interest for future study.
In the case of cancer, defining prevalence is complicated by a number of factors. Therefore,
we analyzed the Incidence rate: the rate at which new cases of cancer are being reported.
These results were derived from information provided by the Manitoba Cancer Treatment
and Research Foundation in 1996 (thus the data is ‘older’ than other analyses in this report).
Since cancer is a legally notifiable disease, the registry is considered highly accurate.
Figures 15 and 16 show that there is significant variation in cancer incidence rates across
areas. Fort Garry has the lowest incidence (4.6) of all communities, while Point Douglas has
the highest (6.1). Again the variation at the neighbourhood level is higher: from 3.6 in
Inkster West to 6.3 in River Heights East. The relationship with premature mortality rates is
significant at the neighbourhood level (r = 0.68), but not at the community level (r = 0.42).
Figure 15: Cancer Incidence Rates by CA, 1993/94 - 1995/96
0 1 2 3 4 5 6 7
Fort Garry
Assin. South
St. Vital
St. Boniface
River Heights
Seven Oaks
St. J. - Assin.
River East
Transcona
Inkster
Downtown
Point Douglas
Winnipeg
Brandon
Rural
Manitoba
*
*
*
*
* Indicates rate is statistically different from the Winnipeg average.
Adjusted rate of new cancer cases reported (excluding non-malignant skin cancer)
Revised 2001-07-12
32
INDICATORS OF HEALTH STATUS
Figure 16: Cancer Incidence Rates by NC, 1993/94 - 1995/96
0 1 2 3 4 5 6 7
Fort Garry S (3B)
Fort Garry N (3A)
Assiniboine S (2)
St. Vital South (4B)
St. Vital North (4A)
St. Boniface E (5B)
St. Boniface W (5A)
River Hghts W (12A)
River Hghts E (12B)
Seven Oaks W (8A)
Seven Oaks N (8C)
Seven Oaks E (8B)
St J - Assin. W (1A)
St J - Assin. E (1B)
River East N (7D)
River East E (7C)
River East W (7B)
River East S (7A)
Transcona (6)
Inkster West (9A)
Inkster East (9B)
Downtown W (11A)
Downtown E (11B)
Pt Douglas N (10A)
Pt Douglas S (10B)
Winnipeg
* Indicates rate is statistically different from the Winnipeg average.
*
*
*
*
*
*Adjusted rate of new cancer cases reported (excluding non-malignant skin cancer)
Revised 2001-07-12
33
INDICATORS OF HEALTH STATUS
4. PHYSICIAN SERVICES
4.1 Visit Rates to Physicians
A visit to a physician often represents the entry point to the healthcare system. It frequently
leads to follow-up visits, diagnostic tests, consultations with specialists or surgeons, or
hospitalization. Figures 17 and 18 show the rates of ambulatory visits to General and Family
Figure 17: Visit Rates to Physicians, by CA, 1998/99
3.07
3.40
3.56
3.59
3.31
3.50
3.43
3.24
3.64
3.50
4.14
4.45
3.54
3.86
3.65
3.60
1.44
1.46
1.36
1.39
1.79
1.64
1.42
1.52
1.21
1.41
1.57
1.37
1.49
0.91
0.55
1.09
0 1 2 3 4 5 6 7
Fort Garry
Assin. South
St. Vital
St. Boniface
River Heights
Seven Oaks
St. J - Assin.
River East
Transcona
Inkster
Downtown
Point Douglas
Winnipeg
Brandon
Rural
Manitoba
GP/FP SpecialistAdjusted rate of physician visits per resident
Statistical differences from Wpg avg: 'a' for GP/FPs, 'b' for Specialists, 'c' for total
a,c
a,c
b,c
b
a,b
b,c
a,b,c
a,c
a,b,c
b,c
a,b,c
a,b,c
34
INDICATORS OF HEALTH STATUS
Practitioners (GP/FPs) and Specialists4. Ambulatory visits include visits to physician offices,
hospital outpatient clinics and emergency rooms5, home visits, etc – everything except visits
to hospital inpatients. Again, we focus on the use of services according to the area of
residence of the patient, not the location of the physician. In Figure 17, the bars generally get
longer as one moves from the top to the bottom of the figure. This indicates that residents
from areas with less healthy populations, on average, tend to make more physician visits.
4 Specialists include all physicians reimbursed by Manitoba Health as practising in a field other than General orFamily Practice. Therefore, all Pediatricians, Internists and Surgeons are included.5 The Manitoba Health physician claims data contain Emergency Room claims for HSC and St. Bonifacehospitals only, which together provide approximately 50% of all Winnipeg ER visits. The missing ER visits(from the community hospitals) comprise approximately 4% of all physician visits, thus would not significantlyaffect the patterns seen.
35
INDICATORS OF HEALTH STATUS
Figure 18: Visit Rates to Physicians, by NC, 1998/99
GP/FP SpecialistAdjusted rate of physician visits per resident
Statistical differences from Wpg avg: 'a' for GP/FPs, 'b' for Specialists, 'c' for total
a,b,c
a,b,c
a,c
a,b,c
a
b,c
a,c
a,b
b,c
a,b,c
a,b,c
b,c
a,c
a,cb,c
a,b,c
a,b,c
a,b,c
a,c
a,b,c
a,c
a,c
36
INDICATORS OF HEALTH STATUS
The relationship between premature mortality and visit rates can be examined more explicitly
by looking at the data in a different way. Figures 19 and 20 are scatter graphs of visit rates to
GP/FPs only, versus premature mortality rates, by community and neighbourhood. Each
point on the scatter graph represents one geographical area: its position on the horizontal axis
corresponds to its premature mortality rate, and its position on the vertical axis corresponds
to its visit rate to GP/FPs. If there were a positive relationship between these two measures
we would expect residents from areas with higher levels of premature mortality to make
more visits. Hence the points should rise as one moves from left to right on the graph, and
that is in fact what is shown: areas with poorer health have higher average visit rates. The
straight line represents the linear tendency within the data (the regression line). The
relationship is highly statistically significant at the neighbourhood (NC) level (r = 0.74), and
significant at the community level (r = 0.64).
Figure 19: Visit Rates to GP/FPs vs. Premature Mortality by CA, 1998/99
0
1
2
3
4
5
6
0.0 1.0 2.0 3.0 4.0 5.0 6.0
Premature Mortality Rate (PMR)
Adj
uste
d Ph
ysic
ian
Visi
ts p
er R
esid
ent
37
INDICATORS OF HEALTH STATUS
4.2 Visits to Specialist Physicians
Specialist physicians provide ambulatory visits that can be categorized as two types,
determined by whether the visit was a consultation6 or not. A consultation occurs when a
physician requests the opinion of a specialist due to the complexity, obscurity or seriousness
of the condition. The consultation is usually a one-time visit to the specialist, after which
follow-up visits may be provided by the specialist or another physician, but are not normally
considered consultations. Therefore, the consultation rate reflects imputed conditions that a
physician has deemed to require specialist care. The consultation rates may over or under-
6 In Manitoba, a ‘consultation’ has a specific definition, and is associated with a unique service code and ahigher fee. Overall, approximately 16% of visits to specialists are billed as consultations, though that proportionvaries significantly by specialty.
Figure 20: Visit Rates to GP/FPs vs. Premature Mortalityby NC, 1998/99
0
1
2
3
4
5
6
0.0 1.0 2.0 3.0 4.0 5.0 6.0 7.0 8.0
Premature Mortality Rate (PMR)
Adj
uste
d Ph
ysic
ian
Visi
ts p
er R
esid
ent
38
INDICATORS OF HEALTH STATUS
estimate the prevalence of the relevant conditions. The rate of non-consult visits to
specialists, on the other hand, includes the use of specialists without necessarily contacting a
GP/FP before each visit (these visits can be initiated by the specialist or the patient). Most
non-consultative visits to specialists (55%) are to Pediatricians and Internists, fields which
both contain “General Specialists” as well as sub-specialists.7
Figures 21 and 22 illustrate that there is considerable variation in visit rates to specialists –
with River Heights residents having a rate almost 50% higher than that of Transcona
residents, even though Transcona residents have slightly poorer average health status.
7 Services provided by sub-specialist pediatricians are known to be under-represented in the claims database.However, most of these specialists are hospital-based, so we believe that relatively few ambulatory visits aremissed because of this limitation.
Figure 21: Visit Rates to Specialists, by CA, 1998/99
1.20
1.19
1.12
1.16
1.54
1.40
1.16
1.29
0.98
1.21
1.34
1.15
1.25
0.69
0.38
0.87
0.24
0.26
0.24
0.23
0.25
0.24
0.26
0.23
0.23
0.21
0.23
0.22
0.24
0.22
0.17
0.21
0.0 0.2 0.4 0.6 0.8 1.0 1.2 1.4 1.6 1.8 2.0
Fort Garry
Assin. South
St. Vital
St. Boniface
River Heights
Seven Oaks
St. J - Assin.
River East
Transcona
Inkster
Downtown
Point Douglas
Winnipeg
Brandon
Rural
Manitoba
Non-Consult ConsultAdjusted rate of visits to specialist physicians, per resident
Statistical differences from Wpg avg: 'a' for Non-Consults, 'b' for Consults, 'c' for total
a
b
a,c
a,c
a,b,c
a,c
a,b,c
a
a,c
b,c
a,b,c
a,b,c
39
INDICATORS OF HEALTH STATUS
The largest component of the difference comes from non-consultative visits, which show no
relationship with premature mortality rates (r = -0.06 for communities, 0.24 for
Figure 22: Visit Rates to Specialists, by NC, 1998/99
1.231.16
1.19
1.041.20
1.101.29
1.541.53
1.271.08
1.50
1.121.20
1.231.19
1.381.25
0.98
1.171.21
1.281.42
1.211.02
1.25
0.240.23
0.26
0.230.24
0.230.23
0.250.25
0.220.20
0.25
0.270.26
0.220.23
0.240.23
0.23
0.190.22
0.210.24
0.220.22
0.24
0.0 0.2 0.4 0.6 0.8 1.0 1.2 1.4 1.6 1.8 2.0
Fort Garry S (3B)
Fort Garry N (3A)
Assiniboine S (2)
St. Vital South (4B)
St. Vital North (4A)
St. Boniface E (5B)
St. Boniface W (5A)
River Hghts W (12A)
River Hghts E (12B)
Seven Oaks W (8A)
Seven Oaks N (8C)
Seven Oaks E (8B)
St J - Assin. W (1A)
St J - Assin. E (1B)
River East N (7D)
River East E (7C)
River East W (7B)
River East S (7A)
Transcona (6)
Inkster West (9A)
Inkster East (9B)
Downtown W (11A)
Downtown E (11B)
Pt Douglas N (10A)
Pt Douglas S (10B)
Winnipeg
Non-Consult ConsultAdjusted rate of visits to specialist physicians, per resident
Statistical differences from Wpg avg: 'a' for Non-Consults, 'b' for Consults, 'c' for total
a,c
b
a,c
a,c
a,b,ca,c
bb,c
a,b,c
a,b,c
b
a,c
b,c
a,c
b
ba,c
b
a,b,c
40
INDICATORS OF HEALTH STATUS
neighbourhoods). Consultations have a mixed pattern: there is no relationship at the
neighbourhood level (r = -0.08) but a significant negative relationship at the community level
(r = -0.75). That is, residents of the less healthy communities have lower consult rates to
specialists, the opposite of what one might expect.
The total visit rates to specialists (consults and non-consults) are not related to premature
mortality rates. This means that specialist visits are not well targeted to areas with less
healthy residents. When one looks at the scatter plots of specialist visits versus premature
mortality (Figures 23 & 24), this lack of targeting is clear. There is no relationship between
premature mortality rates and total visits to specialists at either the community or
neighbourhood level (r = -0.18 for communities and 0.20 for neighbourhoods). There is
substantial variation in rates, but no trend toward higher rates for less healthy areas. Indeed,
as noted above, the variation in rates across areas is around 50% at both levels, and areas
with populations of similar health status exhibit very different rates.8
8 The visit rates patterns in Figure 21 are total visits, and so reflect repeat visits by individuals who make morethan one visit. However, the pattern of visits when repeat visits are removed is very similar. Those two visitpatterns show a very strong relationship (Pearson’s r = 0.91 for CAs and 0.96 for NCs). Therefore, the reportedvisit patterns are not distorted by including repeat visits by residents.
41
INDICATORS OF HEALTH STATUS
Figure 24: Specialist Visit Rates vs. Premature Mortality by NC, 1998/99
0.0
0.2
0.4
0.6
0.8
1.0
1.2
1.4
1.6
1.8
2.0
0.0 1.0 2.0 3.0 4.0 5.0 6.0 7.0 8.0
Premature Mortality Rate (PMR)
Adj
uste
d Vi
sit R
ate
to S
peci
alis
ts (N
on-c
onsu
lt +
Con
sults
)
Figure 23: Specialist Visit Rates vs. Premature Mortality by CA, 1998/99
0.0
0.2
0.4
0.6
0.8
1.0
1.2
1.4
1.6
1.8
2.0
0.0 1.0 2.0 3.0 4.0 5.0 6.0
Premature Mortality Rate (PMR)
Adj
uste
d Vi
sit R
ate
to S
peci
alis
ts (N
on-c
onsu
lt +
Con
sults
)
42
INDICATORS OF HEALTH STATUS
5. HOSPITAL SERVICES
The amount of care provided by hospitals depends primarily on two factors: the number of
patients treated, and the length of stay of each patient. Therefore, it is important to examine
both the frequency of use and the number of days used.
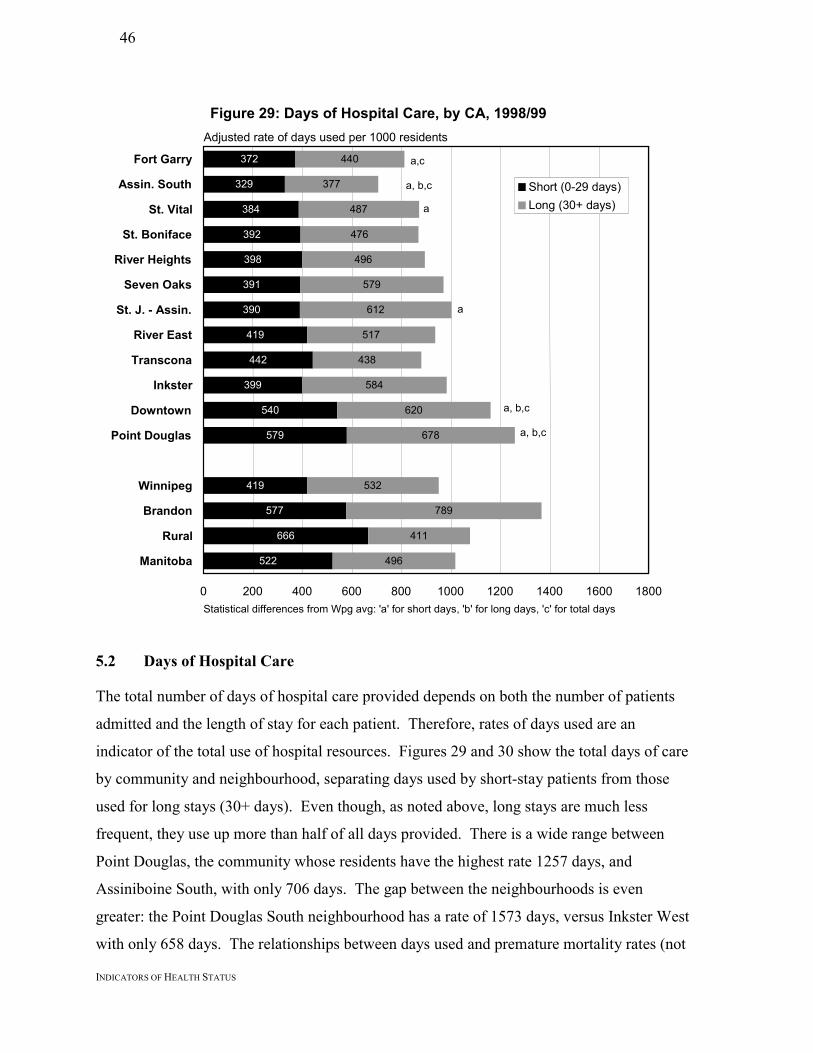
5.1 Frequency of Hospitalization
Figures 25 and 26 show the hospitalization rates for the communities and neighbourhoods.
This includes both short- and long-stay patients (outpatient surgery cases are included with
short-stay patients). These represent the frequency of hospitalization for all residents, not the
number of individuals hospitalized (thus one resident hospitalized 3 times in the year counts
as 3 hospitalizations). The hospitalization rates for residents of the communities range from
Figure 25: Hospital Separation Rates, by CA, 1998/99
119
112
123
120
119
122
131
135
131
121
139
152
128
145
196
155
5.7
5.0
5.9
5.9
6.5
6.5
6.7
6.5
6.1
6.4
9.0
8.1
6.6
7.5
5.5
6.2
0 25 50 75 100 125 150 175 200 225
Fort Garry
Assin. South
St. Vital
St. Boniface
River Heights
Seven Oaks
St. J. - Assin.
River East
Transcona
Inkster
Downtown
Point Douglas
Winnipeg
Brandon
Rural
Manitoba
Short (0-29 days)Long (30+ days)
Adjusted rate of separations per 1000 residents
Statistical differences from Wpg avg: 'a' for short stays, 'b' for long stays, 'c' for total stays
a,c
a,b,c
a,c
a,b,c
a,c
a,c
a,c
a,b,c
43
INDICATORS OF HEALTH STATUS
117 in Assiniboine South to 161 in Point Douglas. There is much greater range in the
neighbourhoods: from 108 in Inkster West to 185 in Point Douglas South. Long stay patients
(30+ days) account for relatively few hospital admissions as compared to short stay patients
(0-29 days). Therefore, as demonstrated below, long stay patients account for a larger
proportion of total hospital days.
Figure 26: Hospital Separation Rates, by NC, 1998/99
117
120
112
116
132
119
125
117
121
115
122
127
126
137
115
139
128
152
131
104
141
127
155
142
174
128
5.75.5
5.0
4.3
7.1
5.56.6
5.6
7.8
6.83.7
6.8
5.97.4
8.78.0
6.6
11.1
7.2
10.97.4
8.0
3.9
6.1
8.05.7
0 25 50 75 100 125 150 175 200 225
Fort Garry S (3B)
Fort Garry N (3A)
Assiniboine S (2)
St. Vital South (4B)
St. Vital North (4A)
St. Boniface E (5B)
St. Boniface W (5A)
River Hghts W (12A)
River Hghts E (12B)
Seven Oaks W (8A)
Seven Oaks N (8C)
Seven Oaks E (8B)
St J - Assin. W (1A)
St J - Assin. E (1B)
River East N (7D)
River East E (7C)
River East W (7B)
River East S (7A)
Transcona (6)
Inkster West (9A)
Inkster East (9B)
Downtown W (11A)
Downtown E (11B)
Pt Douglas N (10A)
Pt Douglas S (10B)
Winnipeg
Short (0-29 days)Long (30+ days)
Adjusted rate of separations per 1000 residents
Statistical differences from Wpg avg: 'a' for short stays, 'b' for long stays, 'c' for total stays
a,b,ca,c
a,b,c
a,ca,c
a,c
a,c
a,c
a,c
a,c
a,c
a,b,c
a,b,c
a,c
44
INDICATORS OF HEALTH STATUS
Figures 27 and 28 are scatter-plots that show there is a strong positive relationship between
total hospitalization rates and premature mortality rates: the less healthy areas have higher
hospitalization rates as evidenced by the up-sloping line. It is worth noting that the
dispersion of rates is much lower in these scatter plots than in the plot of visits to specialists
(Figures 23 and 24, noted above). Hospitalizations do not seem to show as much random
variation: i.e. distance from the average trend line. Consequently, they appear to be more
closely tied to our surrogate measure of need. This relationship is highly significant at both
the community and neighbourhood levels (r = 0.81 and 0.83, respectively). Within the total,
both the short- and long-stay separation rates are significantly related to premature mortality
rates, at both the community and neighbourhood levels (r > 0.65 for all four relationships).
Figure 27: Hospital Separation Rates vs Premature Mortalityby CA, 1998/99
0
20
40
60
80
100
120
140
160
180
0.0 1.0 2.0 3.0 4.0 5.0 6.0
Premature Mortality Rate (PMR)
Adj
uste
d R
ate
of H
ospi
taliz
atio
ns
45
INDICATORS OF HEALTH STATUS
Figure 28: Hospital Separation Rates vs Premature Mortality by NC, 1998/99
0
20
40
60
80
100
120
140
160
180
200
0.0 1.0 2.0 3.0 4.0 5.0 6.0 7.0 8.0
Premature Mortality Rate (PMR)
Adj
uste
d H
ospi
taliz
atio
n R
ate
46
INDICATORS OF HEALTH STATUS
5.2 Days of Hospital Care
The total number of days of hospital care provided depends on both the number of patients
admitted and the length of stay for each patient. Therefore, rates of days used are an
indicator of the total use of hospital resources. Figures 29 and 30 show the total days of care
by community and neighbourhood, separating days used by short-stay patients from those
used for long stays (30+ days). Even though, as noted above, long stays are much less
frequent, they use up more than half of all days provided. There is a wide range between
Point Douglas, the community whose residents have the highest rate 1257 days, and
Assiniboine South, with only 706 days. The gap between the neighbourhoods is even
greater: the Point Douglas South neighbourhood has a rate of 1573 days, versus Inkster West
with only 658 days. The relationships between days used and premature mortality rates (not
Figure 29: Days of Hospital Care, by CA, 1998/99
372
329
384
392
398
391
390
419
442
399
540
579
419
577
666
522
440
377
487
476
496
579
612
517
438
584
620
678
532
789
411
496
0 200 400 600 800 1000 1200 1400 1600 1800
Fort Garry
Assin. South
St. Vital
St. Boniface
River Heights
Seven Oaks
St. J. - Assin.
River East
Transcona
Inkster
Downtown
Point Douglas
Winnipeg
Brandon
Rural
Manitoba
Short (0-29 days)Long (30+ days)
Adjusted rate of days used per 1000 residents
a,c
a, b,c
a, b,c
a
a
a, b,c
Statistical differences from Wpg avg: 'a' for short days, 'b' for long days, 'c' for total days
47
INDICATORS OF HEALTH STATUS
shown) are similar to those found for separations. There is a highly significant correlation
between total days and premature mortality rates (r = 0.85 for communities and 0.78 for
neighbourhoods); a highly significant relationship between days used for short stays and
premature mortality rates (r = 0.90 and 0.89), and a significant relationship between days
used for long stays and premature mortality rates (r = 0.73 for communities and 0.64 for
neighbourhoods). So hospital day use, at both community and neighbourhood area levels, is
related to this measure of need.Figure 30: Days of Hospital Care, by NC, 1998/99
356
382
329
343
423
388
435
378
432
379
337
410
373
417
356
417
404
497
442
301
495
466
626
509
730
419
417
437
377
410
563
386
556
411
628
585
403
622
479
737
632
844
406
570
438
357
699
474
795
685
843
532
0 200 400 600 800 1000 1200 1400 1600 1800
Fort Garry S (3B)
Fort Garry N (3A)
Assiniboine S (2)
St. Vital South (4B)
St. Vital North (4A)
St. Boniface E (5B)
St. Boniface W (5A)
River Hghts W (12A)
River Hghts E (12B)
Seven Oaks W (8A)
Seven Oaks N (8C)
Seven Oaks E (8B)
St J - Assin. W (1A)
St J - Assin. E (1B)
River East N (7D)
River East E (7C)
River East W (7B)
River East S (7A)
Transcona (6)
Inkster West (9A)
Inkster East (9B)
Downtown W (11A)
Downtown E (11B)
Pt Douglas N (10A)
Pt Douglas S (10B)
Winnipeg
Short (0-29 days)Long (30+ days)
Adjusted rate of days used per 1000 residents
a,b,c
a,c
a,b,c
a
a
ab,c
b,c
b,c
Statistical differences from Wpg avg: 'a' for short days, 'b' for long days, 'c' for total days
c
48
INDICATORS OF HEALTH STATUS
5.3 Location of Hospitalizations
In which hospitals do each area’s residents spend most of their hospital days? The following
series of pie charts, Figures 31 – 42, show where residents of each community spent their
hospital days. For this analysis, we looked only at the 7 hospitals in Winnipeg (which
provided more than 94% of all hospitalizations of Winnipeg residents). In each graph, the
hospitals appear in the same (descending) order of days provided for all Winnipeg residents,
clockwise from the top: Health Sciences Centre, St.Boniface, Grace, Seven Oaks, Victoria,
Concordia, and Misericordia (since in fiscal year 1998/99, the Misericordia was still
functioning as an acute care hospital). For each community, the hospital providing the most
days is shown in black; the second most in dark grey, the third in medium grey, and all others
in light grey.
It appears that the community hospitals are serving their catchment areas: Victoria hospital
provides the plurality of days for residents of Fort Garry; the Grace for St. James - Assiniboia
and Assiniboine South; Concordia for River East and Transcona; and Seven Oaks for
residents of Seven Oaks and Point Douglas. Pluralities in the communities with either no
community hospital or in close proximity to a teaching hospital (St. Boniface, St. Vital, River
Heights, Inkster, and Downtown) favour one of the teaching hospitals most often.
49
INDICATORS OF HEALTH STATUS
Figure 33: Hospitals Used by Patients From St. Vital
HSC
St.BGrace
7 Oaks
Vic
Conc Mis
Figure 34: Hospitals Used by Patients From St. Boniface
HSC
St.B
Grace
7 Oaks
Vic
Conc
Mis
Figure 31: Hospitals Used by Patients From Fort Garry
HSC
St.B
Grace
7 Oaks
Mis
Vic
Conc
Figure 32: Hospitals Used by Patients From Assiniboine South
HSC
St.B
Grace
7 Oaks
Vic
ConcMis
50
INDICATORS OF HEALTH STATUS
Figure 36: Hospitals Used by Patients From Seven Oaks
HSC
St.B
Grace
7 Oaks
Conc MisVic
Figure 35: Hospitals Used by Patients From River Heights
HSC
St.B
Grace
7 Oaks
Vic
Conc
Mis
Figure 38: Hospitals Used by Patients From River East
HSC
St.B
Grace7 OaksVic
Conc
Mis
Figure 37: Hospitals Used by Patients From St.James -
Assiniboia
HSC
St.B
Grace
7 Oaks
Vic
ConcMis
51
INDICATORS OF HEALTH STATUS
Figure 39: Hospitals Used by Patients From Transcona
HSC
St.B
Grace
7 Oaks
Vic
Conc
Mis
Figure 40: Hospitals Used by Patients From Inkster
HSC
St.BGrace
7 Oaks
Vic
ConcMis
Figure 41: Hospitals Used by Patients From Downtown
HSC
St.B
Grace
7 Oaks
Vic
Conc
Mis
Figure 42: Hospitals Used by Patients From Point Douglas
HSC
St.B
Grace
7 Oaks
Vic
Conc Mis
52
INDICATORS OF HEALTH STATUS
5.4 Intensive Care Units
Hospital care operates on a continuum of acuity and resource intensity. Intensive care units
(ICUs) are at the top of the resource intensity scale with regard to both equipment and
nursing hours. Patients are admitted to ICUs when that level of care is thought to offer a
significant improvement in mortality, as compared with remaining on another ward. Does
the population’s use of Intensive Care Units (ICUs) match the pattern seen for total
hospitalizations? This section separates hospitals into three categories: first, the two teaching
hospitals, which care for the most severe cases; second, the Winnipeg community hospitals,
which are frequently used for cardiac care; and third Brandon General Hospital, which is
unique in functioning as a secondary regional centre. Since admission to ICU is relatively
rare, we present results based on 5 years of data (1994/95 – 1998/99).
5.4.1 Frequency of ICU use
Figures 43 and 44 show the patterns of ICU separations by community and neighbourhood.
There is a highly significant positive correlation between premature mortality rates and
frequency of ICU use (over 5 years, r = 0.80 for communities, and 0.86 for neighbourhoods).
Among the communities, Downtown has the highest five-year rate (9.0), while Assiniboine
South has the lowest (6.8). Among the neighbourhoods, Downtown East is the highest
(10.5), while Inkster West is the lowest (5.8). Winnipeg rates are higher than Brandon rates
and much higher than Rural rates.
53
INDICATORS OF HEALTH STATUS
Figure 43: Cases Using Intensive Care, by CA, 1994/95 - 98/99
3.3
2.9
4.8
6.2
4.4
3.7
2.8
4.1
4.5
4.7
6.1
5.4
4.4
1.5
3.2
3.8
4.0
3.9
2.5
1.0
3.3
3.6
5.0
3.7
4.1
2.9
2.9
3.4
3.4
2.2
4.4
0.7 0.5
0.4
0 1 2 3 4 5 6 7 8 9 10 11
Fort Garry
Assin. South
St. Vital
St. Boniface
River Heights
Seven Oaks
St. J. - Assin.
River East
Transcona
Inkster
Downtown
Point Douglas
Winnipeg
Brandon
Rural
Manitoba
Winnipeg TeachingWinnipeg CommunityBrandon
Adjusted rate of ICU cases per 1000 residents
* Indicates total rate is statistically different from Winnipeg average.
*
*
*
54
INDICATORS OF HEALTH STATUS
Figure 44: Cases Using Intensive Care, by NC, 1994/95 - 1998/99
3.4
3.2
2.9
3.9
5.5
5.6
7.1
4.2
4.9
3.6
3.6
3.8
2.4
3.4
3.5
3.7
3.8
5.4
4.5
3.8
5.7
5.0
7.4
4.4
4.1
3.8
3.9
2.7
2.3
1.2
0.9
3.5
3.0
3.3
2.9
3.8
4.9
5.1
3.1
3.4
3.7
4.0
4.1
2.0
3.4
2.8
3.1
3.4
6.9
4.6
3.3
3.5
0 1 2 3 4 5 6 7 8 9 10 11
Fort Garry S (3B)
Fort Garry N (3A)
Assiniboine S (2)
St. Vital South (4B)
St. Vital North (4A)
St. Boniface E (5B)
St. Boniface W (5A)
River Hghts W (12A)
River Hghts E (12B)
Seven Oaks W (8A)
Seven Oaks N (8C)
Seven Oaks E (8B)
St J - Assin. W (1A)
St J - Assin. E (1B)
River East N (7D)
River East E (7C)
River East W (7B)
River East S (7A)
Transcona (6)
Inkster West (9A)
Inkster East (9B)
Downtown W (11A)
Downtown E (11B)
Pt Douglas N (10A)
Pt Douglas S (10B)
Winnipeg
Winnipeg TeachingWinnipeg Community
Adjusted rate of ICU cases per 1000 residents
*
*
**
*
*
*
* Indicates total rate is statistically different from the Winnipeg average.
55
INDICATORS OF HEALTH STATUS
5.4.2 Days of ICU Use
Figures 45 and 46 show the patterns of use of days in ICU, by community and
neighbourhood. Again, 5-year rates are shown. The pattern of days used in ICU also track
premature mortality rates at significant levels. Over 5 years, r = 0.70 for communities and
0.62 for neighbourhoods. The Downtown community is the highest user in this category
(43.1), and St. Boniface is the lowest user (27.9). Among the neighbourhoods, Point Douglas
South has the highest rate of use (50.8) and Seven Oaks North the lowest (24.6), with the
difference being over a factor of two. Here again, Winnipeg rates are higher than Brandon
and Rural rates.
Figure 45: Days in ICU, by CA, 1994/95 - 98/99
18.6
14.6
20.3
24.4
23.1
20.4
14.4
21.0
19.8
25.2
33.4
27.7
21.9
18.7
20.0
15.9
14.7
9.6
3.5
13.5
10.6
18.9
14.8
18.6
10.6
9.7
11.4
12.7
8.2
14.17.7
2.5
1.4
1.9
0 5 10 15 20 25 30 35 40 45 50
Fort Garry
Assin. South
St. Vital
St. Boniface
River Heights
Seven Oaks
St. J. - Assin.
River East
Transcona
Inkster
Downtown
Point Douglas
Winnipeg
Brandon
Rural
Manitoba
Winnipeg TeachingWinnipeg CommunityBrandon
*
*
*
Adjusted rate of days used per 1000 residents
* Indicates total rate is statistically different from Winnipeg average.
56
INDICATORS OF HEALTH STATUS
Figure 46: Days in Intensive Care, by NC, 1994/95 - 1998/99
22
14
15
16
24
22
26
21
27
23
17
18
11
19
14
19
21
26
20
19
35
27
41
21
39
22
16.7
15.2
14.7
11.2
8.9
4.0
3.2
12.3
15.3
9.8
8.1
11.2
18.3
20.0
12.2
14.7
14.5
15.3
18.6
9.8
10.8
9.3
10.1
10.7
12.7
13.0
0 10 20 30 40 50 60
Fort Garry S (3B)
Fort Garry N (3A)
Assiniboine S (2)
St. Vital South (4B)
St. Vital North (4A)
St. Boniface E (5B)
St. Boniface W (5A)
River Hghts W (12A)
River Hghts E (12B)
Seven Oaks W (8A)
Seven Oaks N (8C)
Seven Oaks E (8B)
St J - Assin. W (1A)
St J - Assin. E (1B)
River East N (7D)
River East E (7C)
River East W (7B)
River East S (7A)
Transcona (6)
Inkster West (9A)
Inkster East (9B)
Downtown W (11A)
Downtown E (11B)
Pt Douglas N (10A)
Pt Douglas S (10B)
Winnipeg
Winnipeg TeachingWinnipeg Community*
*
Adjusted rate of days used in ICU per 1000 residents
57
INDICATORS OF HEALTH STATUS
5.5 High Profile Services
This section examines a number of high profile diagnostic tests and surgical procedures. Use
of these services is often cited in media reports as key indicators of the performance of the
health care system. Most of them can only be provided upon recommendation of a specialist
physician. Is the delivery of these services needs driven? Do residents of areas with less
healthy populations areas have higher use of these tests and procedures?
5.5.1 Computerized Tomography (CT) Scans
CT scans are a key diagnostic procedure for examination of internal body structures. All
urban hospitals are equipped with CT scanners, with HSC and St. Boniface each having two
units. Records for CT usage only became comprehensive in 1998/99, so past years cannot be
analyzed (outpatients at community hospitals were not recorded before that time). Figures 47
and 48 show the utilization patterns for CT scans by community and neighbourhood in
1998/99. The relationships with premature mortality rates are mixed: there is a significant
Figure 47: CT Scan Rates, by CA, 1998/99
36.7
39.2
42.6
43.2
40.0
42.1
38.1
44.9
47.2
39.4
42.1
47.7
41.9
37.0
33.2
38.3
7.1
6.8
9.7
9.2
7.2
6.6
7.2
10.2
11.2
6.0
7.0
8.5
8.1
10.6
2.8
6.1
0 10 20 30 40 50 60 70
Fort Garry
Assin. South
St. Vital
St. Boniface
River Heights
Seven Oaks
St. J. - Assin.
River East
Transcona
Inkster
Downtown
Point Douglas
Winnipeg
Brandon
Rural
Manitoba
Outpatient InpatientAdjusted rates of CT scans per 1000 residents
* Indicates total rate is statistically different from Winnipeg average.
*
**
*
*
58
INDICATORS OF HEALTH STATUS
relationship at the neighbourhood level (r = 0.61), but a relationship that falls short of
significance at the community level (r = 0.46). But because only one complete year of data
Figure 48: CT Scan Rates, by NC, 1998/99
3539
39
4044
4342
3844
3835
45
3839
4143
4648
47
3443
3748
4554
6.47.8
6.8
8.610.6
8.810.3
7.27.4
5.89.0
6.9
7.37.3
10.49.2
10.411.7
11.2
5.56.7
6.47.8
8.88.5
42 8.1
0 10 20 30 40 50 60 70
Fort Garry S (3B)
Fort Garry N (3A)
Assiniboine S (2)
St. Vital South (4B)
St. Vital North (4A)
St. Boniface E (5B)
St. Boniface W (5A)
River Hghts W (12A)
River Hghts E (12B)
Seven Oaks W (8A)
Seven Oaks N (8C)
Seven Oaks E (8B)
St J - Assin. W (1A)
St J - Assin. E (1B)
River East N (7D)
River East E (7C)
River East W (7B)
River East S (7A)
Transcona (6)
Inkster West (9A)
Inkster East (9B)
Downtown W (11A)
Downtown E (11B)
Pt Douglas N (10A)
Pt Douglas S (10B)
Winnipeg
Outpatient InpatientAdjusted rates of CT scans per 1000 residents
* Indicates total rate is statistically different from the Winnipeg average.
*
*
**
**
*
*
59
INDICATORS OF HEALTH STATUS
was available for review, these associations should be interpreted with caution. More data
will be required to confirm these preliminary findings that seem to indicate a link between
our measure of health status and CT scan use.
A different look at the relationship between total CT scans and premature mortality adds a bit
of texture to the tentative picture we have drawn. The plots in Figures 49 and 50 show the
relationships directly. The slight upward slope of the lines reflects the positive relationship
between CT scan rates and premature mortality rates. Residents from the less healthy areas
have somewhat higher rates of scans. But it is also notable that many of the points (each
representing the utilization rate and premature mortality rate for one area) fall far off the line,
indicating that there is a good deal of variation in use across the areas, both at the community
and neighbourhood levels. So, for example, a glance at Figure 50 shows that
neighbourhoods with premature mortality rates around 3 per thousand vary in their CT Scan
Rates by roughly 25%. One has the third highest rate while one the third lowest. The
variation is even greater at the neighbourhood level than at the community level.
60
INDICATORS OF HEALTH STATUS
Figure 49: Total CT Scan Rates vs Premature Mortalityby CA, 1998/99
0
10
20
30
40
50
60
70
0.0 1.0 2.0 3.0 4.0 5.0 6.0
Premature Mortality Rate
Adj
uste
d C
T Sc
an R
ate
Figure 50: Total CT Scan Rates vs Premature Mortalityby NC, 1998/99
0
10
20
30
40
50
60
70
0.0 1.0 2.0 3.0 4.0 5.0 6.0 7.0 8.0
Premature Mortality Rate
Adj
uste
d C
T Sc
an R
ate
61
INDICATORS OF HEALTH STATUS
5.5.2 Magnetic Resonance Imaging (MRI) Scans
MRI scans, like CT scans, are an imaging technique used for examination of internal body
structures. There was only one MRI facility in the province (at St. Boniface Hospital) until
October 1998, when a second facility was established at HSC. Data from the HSC facility
are not yet available in electronic form, so Figures 51 and 52 show results from fiscal year
1997/98 and earlier. The frequency of MRI scans increased substantially in the 5-year
period. The figures reveal a negative relationship with premature mortality rates: the
healthier areas have higher MRI scan rates (r = -0.42 for neighbourhoods, -0.78 for
communities).
Figure 51: MRI Scan Rates by CA
0 2 4 6 8 10 12
Fort Garry
Assin. South
St. Vital
St. Boniface
River Heights
Seven Oaks
St. J. - Assin.
River East
Transcona
Inkster
Downtown
Point Douglas
Winnipeg
Brandon
Rural
Manitoba
1993/94 - 1997/981995/96 - 1997/981997/98
Adjusted MRI scan rates per 1000 residents
*
* * *
* * ** * *
*
* ** *** *
* Indicates rate is statistically different from the Winnipeg average.
Revised 2001-07-12
62
INDICATORS OF HEALTH STATUS
One confounding factor in analyzing the relationship between premature mortality rates and
some of these high profile services (including MRI), is use of specialist physicians. MRI
scans, like many of these services, cannot be ordered or performed by GP/FPs. Only
specialists can order them. Since, as observed above, residents of less healthy areas do not
Figure 52: MRI Scan Rates by NC
0 2 4 6 8 10 12
Fort Garry S (3B)
Fort Garry N (3A)
Assiniboine S (2)
St. Vital South (4B)
St. Vital North (4A)
St. Boniface E (5B)
St. Boniface W (5A)
River Hghts W (12A)
River Hghts E (12B)
Seven Oaks W (8A)
Seven Oaks N (8C)
Seven Oaks E (8B)
St J - Assin. W (1A)
St J - Assin. E (1B)
River East N (7D)
River East E (7C)
River East W (7B)
River East S (7A)
Transcona (6)
Inkster West (9A)
Inkster East (9B)
Downtown W (11A)
Downtown E (11B)
Pt Douglas N (10A)
Pt Douglas S (10B)
Winnipeg
1993/94 - 1997/981995/96 - 1997/981997/98
Adjusted MRI scan rates per 1000 residents
* Indicates rate is statistically different from the Winnipeg average.
*
* **
*
***
***
*
*
Revised 2001-07-12
63
INDICATORS OF HEALTH STATUS
have the higher visit rates to specialists one might expect, it is perhaps not surprising that the
relationship between MRI scan rates and premature mortality rates is not positive. However,
that observation does not explain why the relationship is strong in the opposite direction:
with the residents from healthier areas getting greater use of MRIs.
The obvious outlier in use of MRIs in Figure 52 is the neighbourhood of St. Boniface West
(which contains St. Boniface hospital). It has an MRI scan rate which was persistently
almost double the Winnipeg average. It’s impossible to know exactly why this anomaly
exists, but potential explanations include geographical proximity, which increases the
chances of nearby residents being called to use a cancelled appointment, as well as local
physician practise patterns.
64
INDICATORS OF HEALTH STATUS
5.5.3 Cardiac Catheterization
Cardiac catheterization is a diagnostic procedure used to examine coronary arteries to
determine whether medical or surgical interventions are required. Figures 53 and 54 reveal
significant variations in these rates across both communities and neighbourhoods. At the
community level, in 1998/99, they range from a low of 2.63 in Inkster to a high of 3.86 in
Assiniboine South, a difference of 47%. Moreover, the relationship appears to be inversely
related to premature mortality, though it does not reach statistical significance (r = -0.41). At
the neighbourhood level the range is even greater, going from 1.77 in River East North to
4.17 in Seven Oaks North, a more than two-fold difference. At this level, though, the rates
seem to show no relationship with premature mortality rates (r = -0.01).
Figure 53: Cardiac Catheterization Rates, by CA
0.0 0.5 1.0 1.5 2.0 2.5 3.0 3.5 4.0 4.5
Fort Garry
Assin. South
St. Vital
St. Boniface
River Heights
Seven Oaks
St. J. - Assin.
River East
Transcona
Inkster
Downtown
Point Douglas
Winnipeg
Brandon
Rural
Manitoba
1994/95-98/991996/97-98/991998/99
* Indicates rate is statistically different from the Winnipeg average.
Adjusted rate of catheterizations per 1000 residents
**
*
65
INDICATORS OF HEALTH STATUS
Figure 54: Cardiac Catheterization Rates, by NC
0.0 0.5 1.0 1.5 2.0 2.5 3.0 3.5 4.0 4.5
Fort Garry S (3B)
Fort Garry N (3A)
Assiniboine S (2)
St. Vital South (4B)
St. Vital North (4A)
St. Boniface E (5B)
St. Boniface W (5A)
River Hghts W (12A)
River Hghts E (12B)
Seven Oaks W (8A)
Seven Oaks N (8C)
Seven Oaks E (8B)
St J - Assin. W (1A)
St J - Assin. E (1B)
River East N (7D)
River East E (7C)
River East W (7B)
River East S (7A)
Transcona (6)
Inkster West (9A)
Inkster East (9B)
Downtown W (11A)
Downtown E (11B)
Pt Douglas N (10A)
Pt Douglas S (10B)
Winnipeg
1994/95-98/991996/97-98/991998/99
Adjusted rate of catheterizations per 1000 residents
66
INDICATORS OF HEALTH STATUS
Figures 55 through 58 show scatter plots of cardiac catheterization rates against premature
mortality rates, at both the community and neighbourhood level, using five-year (1994/95 –
1998/99) and single year (1998/99) rates. These figures show that the weak negative
relationships seen in the community level graphs (Figures 55 and 56) almost disappear at the
neighbourhood level (Figures 57 and 58). This is not particularly encouraging as an
indication of the matching of procedure to need inasmuch as one would expect consistently
higher rates of cardiac catheterization in areas of poorer health status.
In addition, the spread of points around the line is a graphic representation of the variation in
rates across both communities and neighbourhoods. A closer comparison of the 1998/99
rates to the five-year rates seems to indicate that the increased volume of the procedures has
not resulted in the usage pattern more closely reflecting need of area residents. There is more
dispersion in the most recent year, although some of that may be attributable to smaller
sample size.
67
INDICATORS OF HEALTH STATUS
Figure 55: Cardiac Catheterization Rates vs Premature Mortality by CA, 1994/95 - 1998/99
0.0
0.5
1.0
1.5
2.0
2.5
3.0
3.5
4.0
4.5
0.0 1.0 2.0 3.0 4.0 5.0 6.0
Premature Mortality Rates (PMR)
Adj
uste
d ra
te o
f Car
diac
Cat
hete
rizat
ions
Figure 56: Cardiac Catheterization Rates vs Premature Mortality by CA, 1998/99
0.0
0.5
1.0
1.5
2.0
2.5
3.0
3.5
4.0
4.5
0.0 1.0 2.0 3.0 4.0 5.0 6.0
Premature Mortality Rates (PMR)
Adj
uste
d ra
te o
f Car
diac
Cat
hete
rizat
ions
68
INDICATORS OF HEALTH STATUS
Figure 57: Cardiac Catheterization Rates vs Premature Mortality, by NC, 1994/95 - 1998/99
0.0
0.5
1.0
1.5
2.0
2.5
3.0
3.5
4.0
4.5
0.0 1.0 2.0 3.0 4.0 5.0 6.0 7.0 8.0
Premature Mortality Rate (PMR)
Adj
uste
d C
ardi
ac C
athe
teriz
atio
n R
ate
Figure 58: Cardiac Catheterization Rates vs Premature Mortality, by NC, 1998/99
0.0
0.5
1.0
1.5
2.0
2.5
3.0
3.5
4.0
4.5
0.0 1.0 2.0 3.0 4.0 5.0 6.0 7.0 8.0
Premature Mortality Rate (PMR)
Adj
uste
d C
ardi
ac C
athe
teriz
atio
n R
ate
69
INDICATORS OF HEALTH STATUS
5.5.4 Angioplasty
Angioplasty is an invasive procedure used to widen and clear blocked arteries; it is frequently
performed at the time of cardiac catheterization. Figures 59 and 60 show the rates of
angioplasty by community and neighbourhood. Again, there is great variation among areas,
and the variation seems to be growing over time. At the community level, in 1998/99,
Assiniboine South had 1.09 procedures per thousand residents, which was roughly twice the
rate as that of residents of River East, who had 0.54. At the neighbourhood level the
differences were larger, but low numbers in a single year make interpretation risky. For
angioplasty, as with cardiac catheterization, there is no significant relationship of the rates
with premature mortality rates, the surrogate measure of need. At the neighbourhood level,
there is a non-significant negative relationship with premature mortality rates (r = -0.26).
Figure 59: Angioplasty Rates, by CA
0.0 0.1 0.2 0.3 0.4 0.5 0.6 0.7 0.8 0.9 1.0 1.1
Fort Garry
Assin. South
St. Vital
St. Boniface
River Heights
Seven Oaks
St. J. - Assin.
River East
Transcona
Inkster
Downtown
Point Douglas
Winnipeg
Brandon
Rural
Manitoba
1994/95-98/991996/97-98/991998/99
Adjusted rate of angioplasties per 1000 residents
70
INDICATORS OF HEALTH STATUS
At the community level, the relationship is stronger, but still not statistically significant
(r = -0.50). Overall, and for most individual areas of Winnipeg, angioplasty rates are
increasing over time (recall that these are age-adjusted rates, so population aging does not
explain this increase). The increase in rates appears to be exacerbating the negative
relationship with premature mortality, but again small numbers for a single year make it
impossible to draw firm conclusions. These findings suggest that the increasing number of
angioplasties being done is not solving the problem: the rates did not increase for residents in
the least healthy areas.
Compounding this observation is the previously reported significant positive relationship
between the prevalence of hypertension and premature mortality rates. The fact that
treatment of a precursor condition to more serious heart disease and stroke is correlated with
premature mortality, while angioplasty and coronary bypass procedures are not (see below)
raises the question of possible impediments to treatment for those more serious conditions. It
may be that some population characteristics associated with high premature mortality rates,
such as lower socioeconomic status, pose barriers to use of some high profile procedures. It
may also be that specialists act as gatekeepers to these procedures, and we have previously
shown that residents of areas with poorer health have lower than expected use of specialists.
Our data, (which are limited by the low numbers of the procedure in some neighbourhoods)
do not allow us to make definitive statements on this account, but they do raise the question.
Figures 61 and 62 illustrate the relationships at the community level.
71
INDICATORS OF HEALTH STATUS
Figure 60: Angioplasty Rates, by NC
0.0 0.1 0.2 0.3 0.4 0.5 0.6 0.7 0.8 0.9 1.0 1.1
Fort Garry S (3B)
Fort Garry N (3A)
Assiniboine S (2)
St. Vital South (4B)
St. Vital North (4A)
St. Boniface E (5B)
St. Boniface W (5A)
River Hghts W (12A)
River Hghts E (12B)
Seven Oaks W (8A)
Seven Oaks N (8C)
Seven Oaks E (8B)
St J - Assin. W (1A)
St J - Assin. E (1B)
River East N (7D)
River East E (7C)
River East W (7B)
River East S (7A)
Transcona (6)
Inkster West (9A)
Inkster East (9B)
Downtown W (11A)
Downtown E (11B)
Pt Douglas N (10A)
Pt Douglas S (10B)
Winnipeg
1994/95-98/991996/97-98/991998/99
Adjusted rate of angioplasties per 1000 residents
72
INDICATORS OF HE
Figure 61: Angioplasty Rates vs Premature Mortality
by CA, 1994/95 - 1998/99
0.0
0.1
0.2
0.3
0.4
0.5
0.6
0.7
0.8
0.9
1.0
1.1
1.2
0.0 1.0 2.0 3.0 4.0 5.0 6.0
Premature Mortality Rate
Adj
uste
d A
ngio
plas
ty R
ate
per 1
000
Res
iden
ts
Figure 62: Angioplasty Rates vs Premature Mortality
ALTH STATUS
by CA, 1998/99
0.0
0.1
0.2
0.3
0.4
0.5
0.6
0.7
0.8
0.9
1.0
1.1
1.2
0.0 1.0 2.0 3.0 4.0 5.0 6.0
Premature Mortality Rate
Adj
uste
d A
ngio
plas
ty R
ate
per 1
000
Res
iden
ts
73
INDICATORS OF HEALTH STATUS
5.5.5 Coronary Artery Bypass Surgery
Bypass surgery is a procedure performed when coronary arteries are irreversibly blocked.
Figures 63 and 64 show the bypass surgery rates for the communities and neighbourhoods.
As with the previous two coronary procedures examined, there is considerable variation in
bypass surgery rates. The range in 1998/99 is from a rate of 0.71 in the River East
community to 1.20 in Seven Oaks, two areas of very similar premature mortality rates. At
the neighbourhood level the variation is even more striking. Seven Oaks North has a rate of
2.38 while Inkster West’s rate is only 0.44, though the relative infrequency of the procedure
in a single year makes over-interpretation of this 5-fold difference risky. But even using the
five-year average, the difference between the two areas is quite large: 1.21 vs. 0.49.
Figure 63: Coronary Artery Bypass Surgery Rates, by CA
Sources:Bed numbers from Manitoba Health Annual Statistics at end of fiscal year 1997/98.Beds assigned to areas by MCHPE, based on postal code.Population data from MCHPE population registry.
94
INDICATORS OF HEALTH STATUS
Table 2: Location of PCH’s Chosen by Winnipeg Residents, Admitted 1993/94 - 1997/98
Utilization analyses based on where PCH residents are currently living would essentially
replicate the distribution of beds (i.e. the residents are where the beds are). Therefore, the
following analyses were calculated according to where PCH residents used to live, at 6
months prior to assessment. By focussing on the area of previous residence, we can examine
patterns of PCH access and use by area, and compare the rates with each other and with
premature mortality.
6.2.1 Residents in PCH
Figures 83 and 84 show the number of persons residing in Personal Care Homes in 1997/98
by communities and neighbourhoods of previous residence. There is substantial variation in
the rates of institutionalization of the elderly from across the different communities. Fort
Garry has the lowest rate (100) and Inkster the highest (147). At the neighbourhood level
there are more significant differences in rates of institutionalization. The lowest rate is found
for former residents of Inkster West: only 41 seniors per 1000 in Inkster West were in
personal care homes. In Seven Oaks North, 212 of every 1000 seniors found themselves in
personal care homes: a remarkable five-fold difference. Moreover, the rates are significantly
Figure 83: Residents in PCH, by CA, 1997/98
0 25 50 75 100 125 150 175 200 225
Fort Garry
Assin. South
St. Vital
St. Boniface
River Heights
Seven Oaks
St. J. - Assin.
River East
Transcona
Inkster
Downtown
Point Douglas
Winnipeg
Brandon
Rural
Manitoba
Adjusted rate of persons in PCHs, per 1000 residents aged 75+
* Indicates rate statistically different from the Winnipeg average.
*
*
*
96
INDICATORS OF HEALTH STATUS
correlated with premature mortality (r = 0.47 for neighbourhoods and 0.75 for communities).
Virtually identical results were seen for days of care (not shown; r = 0.44 and 0.71).
Figure 84: Residents in PCH, by NC, 1997/98
0 25 50 75 100 125 150 175 200 225
Fort Garry S (3B)
Fort Garry N (3A)
Assiniboine S (2)
St. Vital South (4B)
St. Vital North (4A)
St. Boniface E (5B)
St. Boniface W (5A)
River Hghts W (12A)
River Hghts E (12B)
Seven Oaks W (8A)
Seven Oaks N (8C)
Seven Oaks E (8B)
St J - Assin. W (1A)
St J - Assin. E (1B)
River East N (7D)
River East E (7C)
River East W (7B)
River East S (7A)
Transcona (6)
Inkster West (9A)
Inkster East (9B)
Downtown W (11A)
Downtown E (11B)
Pt Douglas N (10A)
Pt Douglas S (10B)
Winnipeg
Adjusted rate of persons in PCHs, per 1000 residents aged 75+
* Indicates rate statistically different from the Winnipeg average.
*
**
*
*
*
*
*
97
INDICATORS OF HEALTH STATUS
6.2.2 Admissions to PCH
Figures 85 and 86 show rates of admission to PCH. These represent how many people from
each area entered PCHs (anywhere in Manitoba) each year, again according to where they
lived prior to being admitted to a PCH. Since admission is relatively infrequent, we
combined 5 years of data to provide reliable rates10. There is a moderate amount of variation
in these rates at the community level: Fort Garry has the lowest rate of 22.4, while River East
is the highest at 29.8. The relationship with premature mortality rates is positive, but just
below statistical significance (r = 0.56).
10 The admission rates shown in this report are slightly lower than those found in previous MCHPE reportsbecause an error in our computer programming has been found. These new ‘corrected’ rates are approximately5-6% lower than previous results.
Figure 85: Admissions to PCH, by CA, 1993/94 - 1997/98
0 5 10 15 20 25 30 35 40 45 50
Fort Garry
Assin. South
St. Vital
St. Boniface
River Heights
Seven Oaks
St. J. - Assin.
River East
Transcona
Inkster
Downtown
Point Douglas
Winnipeg
Brandon
Rural
Manitoba
Adjusted rate of admissions to PCH, per 1000 residents aged 75+
* Indicates rate statistically different from the Winnipeg average.
*
*
*
98
INDICATORS OF HEALTH STATUS
At the neighbourhood level, the variation is much greater. Inkster West has a low admission
rate of 6.3 while the rate in River East is 48.2. This is almost an 8-fold difference and stands
out strikingly in the figure. The neighbourhood-level relationship with premature mortality
rates is not statistically significant (r = 0.32).
Figure 86: Admissions to PCH, by NC, 1993/94 - 1997/98
0 5 10 15 20 25 30 35 40 45 50
Fort Garry S (3B)
Fort Garry N (3A)
Assiniboine S (2)
St. Vital South (4B)
St. Vital North (4A)
St. Boniface E (5B)
St. Boniface W (5A)
River Hghts W (12A)
River Hghts E (12B)
Seven Oaks W (8A)
Seven Oaks N (8C)
Seven Oaks E (8B)
St J - Assin. W (1A)
St J - Assin. E (1B)
River East N (7D)
River East E (7C)
River East W (7B)
River East S (7A)
Transcona (6)
Inkster West (9A)
Inkster East (9B)
Downtown W (11A)
Downtown E (11B)
Pt Douglas N (10A)
Pt Douglas S (10B)
Winnipeg
Adjusted rate of admissions to PCH, per 1000 residents aged 75+
* Indicates rate statistically different from the Winnipeg average.
**
*
*
*
*
*
99
INDICATORS OF HEALTH STATUS
6.2.3 Waiting Times for PCH Admission
Figures 87 and 88 show the median waiting times for PCH admission. ‘Median’ means that
half of the people had shorter waiting times, and half had longer. (We used the median rather
than the mean because the mean is skewed by long-wait outliers.) There is great variation in
these rates: median waits vary from a low of 72 days in the Downtown community to 168
days in Inkster. The Downtown West neighbourhood has the shortest wait at 69 days, and
Inkster East the longest at 173 (a more than 2-fold difference). Notably, within the Inkster
community Inkster West has one of the shortest waiting periods in the city (74 days) in
contrast to its neighbouring area, Inkster East. There is no significant relationship between
waiting times and premature mortality rates at either level; the correlations are r = 0.27 for
neighbourhoods and 0.14 for communities. Waiting times can be substantially affected by
personal decisions of the resident, most obviously about location of placement
geographically, and ethnic/dietary requirements. Since these analyses were based on
1997/98 data, they reflect circumstances just prior to a number of recent policy changes for
PCH placement, and significant increases in the number of PCH beds.
Figure 87: Waiting times for PCH Admission, by CA, 1997/98
0 20 40 60 80 100 120 140 160 180
Fort Garry
Assin. South
St. Vital
St. Boniface
River Heights
Seven Oaks
St. J. - Assin.
River East
Transcona
Inkster
Downtown
Point Douglas
Winnipeg
Brandon
Rural
Manitoba
Median waiting time for PCH placement (days)
100
INDICATORS OF HEALTH STATUS
Figure 88: Waiting times for PCH admission, by NC, 1997/98
0 20 40 60 80 100 120 140 160 180
Fort Garry S (3B)
Fort Garry N (3A)
Assiniboine S (2)
St. Vital South (4B)
St. Vital North (4A)
St. Boniface E (5B)
St. Boniface W (5A)
River Hghts W (12A)
River Hghts E (12B)
Seven Oaks W (8A)
Seven Oaks N (8C)
Seven Oaks E (8B)
St J - Assin. W (1A)
St J - Assin. E (1B)
River East N (7D)
River East E (7C)
River East W (7B)
River East S (7A)
Transcona (6)
Inkster West (9A)
Inkster East (9B)
Downtown W (11A)
Downtown E (11B)
Pt Douglas N (10A)
Pt Douglas S (10B)
Winnipeg
Median waiting time for PCH placement (days)
101
INDICATORS OF HEALTH STATUS
7. PREVENTIVE SERVICES
While most of our health care system (and therefore most of this report) focuses on
treatments for illnesses already contracted, there is growing effort focussing on prevention.
This section presents data for some common preventive services whose benefits are
substantial.
7.1 Childhood Immunizations
In conjunction with other provinces, Manitoba has developed immunization guidelines for
children. Figures 89 and 90 show the percentage of children with complete immunization
schedules at 1 and 2 years of age11. The variation in these rates is somewhat less than
observed in many of the other conditions and treatments reviewed above. Nevertheless, the
differences are still substantive. At the community level, for example, only 62% of the two
year olds are fully immunized in Point Douglas in contrast with 82% in St. Vital. At the
neighbourhood level the rates vary from 56% in Point Douglas South to 85% in River East
North. Moreover, there are highly significant negative relationships with premature
mortality rates at the neighbourhood level, for both 1 and 2 year olds (r = -0.67 for 1 year
olds and -0.60 for 2 year olds). The relationships at the community level are also negative,
but not statistically significant (r = -0.47 and –0.39 for 1 and 2 year olds respectively). Since
populations in areas of high premature mortality rates generally have poorer health status,
these negative relationships raise policy issues of what might account for the lower rates, and
how they might be raised.
11 Immunization rates were derived from the Manitoba Immunization Monitoring System, which includesvaccinations delivered by physicians and public health nurses. These data are known to be highly reliable forWinnipeg residents.
102
INDICATORS OF HEALTH STATUS
Figure 89: Childhood Immunization Rates, by CA
0% 10% 20% 30% 40% 50% 60% 70% 80% 90% 100%
Fort Garry
Assin. South
St. Vital
St. Boniface
River Heights
Seven Oaks
St. J. - Assin.
River East
Transcona
Inkster
Downtown
Point Douglas
Winnipeg
Brandon
Rural
Manitoba
1 year2 yearsPercent of children born 1994-1996 with complete immunization schedules at:
103
INDICATORS OF HEALTH STATUS
Figure 90: Childhood Immunization Rates, by NC
0% 10% 20% 30% 40% 50% 60% 70% 80% 90% 100%
Fort Garry S (3B)
Fort Garry N (3A)
Assiniboine S (2)
St. Vital South (4B)
St. Vital North (4A)
St. Boniface E (5B)
St. Boniface W (5A)
River Hghts W (12A)
River Hghts E (12B)
Seven Oaks W (8A)
Seven Oaks N (8C)
Seven Oaks E (8B)
St J - Assin. W (1A)
St J - Assin. E (1B)
River East N (7D)
River East E (7C)
River East W (7B)
River East S (7A)
Transcona (6)
Inkster West (9A)
Inkster East (9B)
Downtown W (11A)
Downtown E (11B)
Pt Douglas N (10A)
Pt Douglas S (10B)
Winnipeg
1 yr2 yrPercent of Children born 1994-1996 with complete immunization schedules at:
104
INDICATORS OF HEALTH STATUS
7.2 Cervical Cancer Screening
Cervical cancer is considered largely preventable with systematic testing by pap smears.
Guidelines recommend that healthy women be screened at least once every three years (more
often at first, and after any positive findings). Figures 91 and 92 show the rates by
community and neighbourhood. The Winnipeg average is just over 70%, and some areas fall
well below that12. Here again there is a negative relationship with premature mortality rates.
That is, women in less healthy areas (high premature mortality rates) are less likely to be
screened. The relationship is highly significant at the neighbourhood level (r = -0.55), but
marginally non-significant at the community level (r = 0.57). CancerCare Manitoba is
developing a cervical cancer screening program for Manitoba designed to increase the
screening rates.
12 These rates are based on physician payment claims, but are not significantly under-counted because ofsalaried physicians in community clinics who do not file such claims. This is because each pap test has twoclaims associated with it – one for taking the sample, the other for the laboratory test. Therefore, one or theother of these claims is almost always present for tests done on Winnipeg residents. See Roos et al (1999).
Figure 91: Cervical Cancer Screening Rates, by CA
0% 10% 20% 30% 40% 50% 60% 70% 80% 90% 100%
Fort Garry
Assin. South
St. Vital
St. Boniface
River Heights
Seven Oaks
St. J. - Assin.
River East
Transcona
Inkster
Downtown
Point Douglas
Winnipeg
Brandon
Rural
Manitoba
Percent of women aged 18-69 screened at least once in 3 years (1996-1998)
105
INDICATORS OF HEALTH STATUS
Figure 92: Cervical Cancer Screening Rates, by NC
0% 10% 20% 30% 40% 50% 60% 70% 80% 90% 100%
Fort Garry S (3B)
Fort Garry N (3A)
Assiniboine S (2)
St. Vital South (4B)
St. Vital North (4A)
St. Boniface E (5B)
St. Boniface W (5A)
River Hghts W (12A)
River Hghts E (12B)
Seven Oaks W (8A)
Seven Oaks N (8C)
Seven Oaks E (8B)
St J - Assin. W (1A)
St J - Assin. E (1B)
River East N (7D)
River East E (7C)
River East W (7B)
River East S (7A)
Transcona (6)
Inkster West (9A)
Inkster East (9B)
Downtown W (11A)
Downtown E (11B)
Pt Douglas N (10A)
Pt Douglas S (10B)
Winnipeg
Percent of women aged 18-69 screened at least once in 3 years (1996-1998)
106
INDICATORS OF HEALTH STATUS
7.3 Breast Cancer Screening
Breast cancer rates have increased substantially in the past 20 years. Breast cancer screening
(using mammograms) is recommended every two years for women between 50 and 69 years
of age, although there are reports that question the added benefit of mammograms over well-
conducted self-examinations. However, given the uncertainty of the frequency and
carefulness of self-examinations, mammography is a major contributor to the detection of
breast tumours. Figures 93 and 94 show the rates of mammography for women between 50
and 69 years of age. Again the overall level of coverage is quite low: the Winnipeg average
is just 53%. A few areas fall under 50%, and the highest level is only a bit over 60%. As
with other preventative services, there is a significant negative relationship with premature
mortality rates (r = -0.65 for neighbourhoods and –0.79 for communities), so the areas with
populations in poorer health seem to make less use of this service. However, Manitoba has a
systematic breast cancer screening program which should increase rates in all areas.
Figure 93: Breast Cancer Screening Rates, by CA
0% 10% 20% 30% 40% 50% 60% 70% 80% 90% 100%
Fort Garry
Assin. South
St. Vital
St. Boniface
River Heights
Seven Oaks
St. J. - Assin.
River East
Transcona
Inkster
Downtown
Point Douglas
Winnipeg
Brandon
Rural
Manitoba
Percent of women aged 50-69 getting at least one mammogram in 1997 or 1998
107
INDICATORS OF HEALTH STATUS
Figure 94: Breast Cancer Screening Rates, by NC
0% 10% 20% 30% 40% 50% 60% 70% 80% 90% 100%
Fort Garry S (3B)
Fort Garry N (3A)
Assiniboine S (2)
St. Vital South (4B)
St. Vital North (4A)
St. Boniface E (5B)
St. Boniface W (5A)
River Hghts W (12A)
River Hghts E (12B)
Seven Oaks W (8A)
Seven Oaks N (8C)
Seven Oaks E (8B)
St J - Assin. W (1A)
St J - Assin. E (1B)
River East N (7D)
River East E (7C)
River East W (7B)
River East S (7A)
Transcona (6)
Inkster West (9A)
Inkster East (9B)
Downtown W (11A)
Downtown E (11B)
Pt Douglas N (10A)
Pt Douglas S (10B)
Winnipeg
Percent of women aged 50-69 with at least one mammogram in 1997 or 1998
108
INDICATORS OF HEALTH STATUS
8. CONCLUSIONS
There is a remarkable range of health status in the Winnipeg area. The premature mortality
rates for residents of the 12 areas varies by more than a factor of two from the healthiest (Fort
Garry) to the least healthy (Point Douglas). But even within the 12 areas there are major
differences in premature mortality rates. Division of Winnipeg into the 25 neighbourhoods
allows one to identify distinct areas with very different rates of premature mortality, and
different rates of use of various health care services. The most dramatic example of the
insight gained by the subdivision of communities can be found by looking at Inkster. That
community, having the third highest premature mortality rate, decomposes into Inkster East
and Inkster West. The former had the third highest premature mortality rate among the 25
neighbourhoods, while the latter had the second lowest rate! They are obviously populated by
individuals with very different characteristics. Planning for the delivery of services could
benefit from taking those differences into account.
It is a presumption of this study that the need for health care services can be represented,
approximately, by the premature mortality rate of a population. The higher the premature
mortality rate of the residents of an area, the higher one would expect them to utilize various
health care services. By that standard, the use of basic services, such as visit rates to
generalist physicians, and most measures of hospital use (separations and days) is closely
related to need. On the other hand, the use of specialist physicians is not positively related to
this measure of need. Indeed, there seems to be no relationship between specialist visit rates
and premature mortality rates.
A set of disconcerting findings is a set of negative relationships between the premature
mortality rates of residents in the areas and their use of a variety of high profile procedures.
MRI scans, Angioplasty, Coronary Artery Bypass Surgery Rates, Hip Replacement Rates,
and Knee Replacements all show utilization rates that are in the direction opposite to need as
measured by premature mortality. In general, residents from areas with less healthy
populations receive fewer of these procedures than residents from areas with healthier
populations. Moreover, recent increases in the volume of these procedures have not
109
INDICATORS OF HEALTH STATUS
alleviated the problem. There are, apparently, impediments in the system which result in
residents from poorer health areas having lower rates of these procedures. No relationships
were found between premature mortality rates and rates of Coronary Catheterization or
Cataract Surgery.
Access to Personal Care Homes, on the other hand, appears to be positively related to poor
health status, as indicated by premature mortality rates, and the waiting times are
independent of premature mortality rates.
Preventative services provide the most uniform and discouraging picture. In all three service
areas examined (Childhood Immunization Rates, Cervical Cancer Screening Rates, and
Breast Cancer Screening Rates), there was a strong negative relationship between premature
mortality rates and the rate at which they availed themselves of these services.
In summary, it appears that basic services are being provided in accordance with need as
measured by premature mortality rates, but that a variety of high profile and preventative
services do not conform to that pattern. An examination of the causes of these anomalies
with an eye to how they might be addressed might serve to bring the full range of services
closer in alignment with need.
110
INDICATORS OF HEALTH STATUS
REFERENCES
Birch S, Eyles J, Hurley J, Hutchinson B, Chamber S. A needs-based approach to resourceallocation in health care. Can Pub Pol. 1993; 19(1): 68-85.
Black C, Peterson S, Mansfield J, Thliveris M. Patterns of Tonsillectomy in Manitoba 1989-1993; Analyses to support the Tonsillectomy Review Panel of the Clinical Guidelines andAnalysis Program. Winnipeg, MB: Manitoba Centre for Health Policy and Evaluation andThe College of Physicians and Surgeons of Manitoba; 1996.
Black C, Roos NP, Fransoo R, Martens P. Comparative Indicators of Population Health andHealth Care Use for Manitoba’s Regional Health Authorities, A POPULIS Project.Winnipeg, MB: Manitoba Centre for Health Policy and Evaluation; 1999.
Brownell M, Martens P, Kozyrskyj A, Fergusson P, Lerfald J, Mayer T, Derksen S, FriesenD. Assessing the Health of Children in Manitoba: A Population-Based Study. Winnipeg,MB: Manitoba Centre for Health Policy and Evaluation; 2001.
Carstairs V, Morris R. Deprivation and Health in Scotland. Aberdeen, Scotland; AberdeenUniversity Press; 1991.
Eyles J, Birch S, Chambers J, Hurley J, Hutchinson B. A needs-based methodology forallocating health care resources in Ontario, Canada: Development and an application. SocSci Med. 1991; 33(4): 489-500.
Eyles J, Birch S, Chambers S. Fair shares for the zone: allocating health-care resources forthe native populations of the Sioux Lookout zone, Northern Ontario. Can Geo. 1994; 38(2):134-150.
Mays N, Chinn S, Ho KM. Interregional variations in measures of health from the Healthand Lifestyle Survey and their relation with indicators of health care need in England.Epidemiol Comm Health. 1992:46 (1): 38-47.
Roos LL, Traverse D, Turner D. Delivering prevention: The role of public programs indelivering care to high-risk populations. Med Care. 1999;37(Suppl)(6):JS264-JS278.
Tataryn DJ, Roos NP, Black C. Utilization of Physician Resources. Volume 1: KeyFindings; Volume II: Methods and Tables. Winnipeg, MB: Manitoba Centre for HealthPolicy and Evaluation; 1994.
High ProfileCardiac Cath 5 yr -0.50 0.095 -0.15 0.472Cardiac Cath 3 yr -0.44 0.152 0.11 0.614Cardiac Cath 98/99 -0.41 0.183 -0.01 0.951
Angioplasty 5 yr -0.50 0.101 -0.26 0.205Angioplasty 3 yr -0.29 0.354 0.07 0.748Angioplasty 98/99 -0.43 0.159 -0.27 0.196
Revised 2001-07-12
122
INDICATORS OF HEALTH STATUS
CA Level (12) r p
NC Level (25) r p
Bypass 5 yr -0.61 0.036 -0.07 0.734Bypass 3 yr -0.47 0.124 0.10 0.645Bypass 98/99 0.05 0.880 0.22 0.298
Total Cataracts -0.533 0.074 0.242 0.244Cataracts - Public 0.305 0.335 0.631 0.001Cataracts - Private -0.814 0.001 -0.177 0.398
Hip Replace 5 yr -0.78 0.003 0.05 0.804Hip Replace 3 yr -0.67 0.017 0.03 0.893Hip Replace 98/99 -0.76 0.004 0.01 0.980
Knee 5 yr -0.29 0.366 -0.13 0.524Knee 3 yr -0.36 0.255 -0.12 0.555Knee 98/99 -0.34 0.276 -0.20 0.342
DiscretionaryC-Section 5 yr 0.14 0.665 -0.08 0.690C-Section 3 yr -0.23 0.471 -0.15 0.467C-Section 98/99 -0.62 0.031 -0.35 0.089
Hysterectomy 5 yr 0.06 0.846 -0.33 0.111Hysterectomy 3 yr -0.04 0.897 -0.33 0.107Hysterectomy 98/99 -0.29 0.354 -0.26 0.208
Tonsillectomy 5 yr -0.14 0.689 0.05 0.807Tonsillectomy 3 yr -0.16 0.631 -0.07 0.741Tonsillectomy 98/99 0.15 0.670 0.00 0.985
Cholecystectomy 5 yr 0.88 0.000 0.30 0.152Cholecystectomy 3 yr 0.60 0.051 0.23 0.272Cholecystectomy 98/99 0.50 0.117 0.21 0.314
Personal Care HomePCH Residents 0.75 0.005 0.47 0.019PCH Admissions 0.56 0.059 0.32 0.118Waiting Time 0.14 0.665 0.27 0.198
PreventiveImmunizations - 1 yr -0.47 0.124 -0.67 0.000Immunizations - 2 yr -0.39 0.208 -0.60 0.002Cervical Cancer Screen -0.57 0.051 -0.55 0.005Breast Cancer Screen -0.79 0.002 -0.65 0.000
Revised 2001-07-12
123
INDICATORS OF HEALTH STATUS
MCHPE REPORT LISTMCHPE REPORT LISTMCHPE REPORT LISTMCHPE REPORT LIST
The Impact of Influenza-Like Illness on the Winnipeg Health Care System: Is an EarlyThe Impact of Influenza-Like Illness on the Winnipeg Health Care System: Is an EarlyThe Impact of Influenza-Like Illness on the Winnipeg Health Care System: Is an EarlyThe Impact of Influenza-Like Illness on the Winnipeg Health Care System: Is an EarlyWarning System Possible?,Warning System Possible?,Warning System Possible?,Warning System Possible?, by Verena H Menec, PhD, Charlyn Black, MD, ScD, LeonardMacWilliam, MSc, MNRM, Fred Aoki, MD, Sandra Peterson, MSc, David Friesen, BSc (March2001)
Assessing the Health of Children in Manitoba: A Population-Based Study, Assessing the Health of Children in Manitoba: A Population-Based Study, Assessing the Health of Children in Manitoba: A Population-Based Study, Assessing the Health of Children in Manitoba: A Population-Based Study, by MarniBrownell, PhD, Patricia Martens, PhD, Anita Kozyrskyj, PhD, Patricia Fergusson, PhD,Jennifer Lerfald, BSc, Teresa Mayer, Shelley Derksen, MSc, David Friesen, BSc (February2001)
A Description of the Use of Insured Health Care Services by Income AssistanceA Description of the Use of Insured Health Care Services by Income AssistanceA Description of the Use of Insured Health Care Services by Income AssistanceA Description of the Use of Insured Health Care Services by Income AssistanceRecipients in the Province of Manitoba: A Pilot Study. Recipients of Income AssistanceRecipients in the Province of Manitoba: A Pilot Study. Recipients of Income AssistanceRecipients in the Province of Manitoba: A Pilot Study. Recipients of Income AssistanceRecipients in the Province of Manitoba: A Pilot Study. Recipients of Income Assistancefor Mental Health Disability, for Mental Health Disability, for Mental Health Disability, for Mental Health Disability, by Cam Mustard, ScD, Shelley Derksen, MSc, Anita Kozyrskyj,BSc (Pharm), PhD (December 2000)
Considering the Health Care Needs of Children Living in Households Receiving IncomeConsidering the Health Care Needs of Children Living in Households Receiving IncomeConsidering the Health Care Needs of Children Living in Households Receiving IncomeConsidering the Health Care Needs of Children Living in Households Receiving IncomeAssistance in Manitoba: Family Services and Manitoba Health Pilot Project, Assistance in Manitoba: Family Services and Manitoba Health Pilot Project, Assistance in Manitoba: Family Services and Manitoba Health Pilot Project, Assistance in Manitoba: Family Services and Manitoba Health Pilot Project, by Anita LKozyrskyj, BSc (Pharm), PhD, Cam Mustard, ScD, Shelley Derksen, MSc (December 2000)
Using the Manitoba Hospital Management Information System: Comparing AverageUsing the Manitoba Hospital Management Information System: Comparing AverageUsing the Manitoba Hospital Management Information System: Comparing AverageUsing the Manitoba Hospital Management Information System: Comparing AverageCost Per Weighted Case and Financial Ratios of Manitoba Hospitals (1997/98)Cost Per Weighted Case and Financial Ratios of Manitoba Hospitals (1997/98)Cost Per Weighted Case and Financial Ratios of Manitoba Hospitals (1997/98)Cost Per Weighted Case and Financial Ratios of Manitoba Hospitals (1997/98), by GregFinlayson, BA, CAE, Noralou Roos, PhD, Philip Jacobs, D Phil, CMA, Diane Watson, PhD,MBA (January 2001)
Waiting Times for Surgery: 1997/98 and 1998/99 UpdateWaiting Times for Surgery: 1997/98 and 1998/99 UpdateWaiting Times for Surgery: 1997/98 and 1998/99 UpdateWaiting Times for Surgery: 1997/98 and 1998/99 Update, by Carolyn DeCoster, RN, MBA,Leonard MacWilliam, MSc, MNRM, Randy Walld, BSc, BComm (November 2000)
Long-Stay Patients in Winnipeg Acute Care HospitalsLong-Stay Patients in Winnipeg Acute Care HospitalsLong-Stay Patients in Winnipeg Acute Care HospitalsLong-Stay Patients in Winnipeg Acute Care Hospitals, by Carolyn DeCoster, RN, MBA,Anita Kozyrskyj, BScPhm, PhD (September 2000)
Assessing the Performance of Rural and Northern Hospitals in Manitoba: A First Look,Assessing the Performance of Rural and Northern Hospitals in Manitoba: A First Look,Assessing the Performance of Rural and Northern Hospitals in Manitoba: A First Look,Assessing the Performance of Rural and Northern Hospitals in Manitoba: A First Look,by David Stewart, PhD, Charlyn Black, MD, ScD, Patricia Martens, PhD, Sandra Petersen,MSc, David Friesen, BSc (June 2000)
Defining Practice Populations for Primary Care: Methods and IssuesDefining Practice Populations for Primary Care: Methods and IssuesDefining Practice Populations for Primary Care: Methods and IssuesDefining Practice Populations for Primary Care: Methods and Issues, by Verena Menec,PhD, Charlyn Black, MD, ScD, Noralou Roos, PhD, Bogdan Bogdanovic, BComm, BA,Robert Reid, MD, PhD (February 2000).
Analysis of Patterns of Pharmaceutical Use in Manitoba, 1996: Key Findings AAnalysis of Patterns of Pharmaceutical Use in Manitoba, 1996: Key Findings AAnalysis of Patterns of Pharmaceutical Use in Manitoba, 1996: Key Findings AAnalysis of Patterns of Pharmaceutical Use in Manitoba, 1996: Key Findings APOPULIS Project, by POPULIS Project, by POPULIS Project, by POPULIS Project, by Colleen Metge, BSc (Pharm), PhD, Charlyn Black, MD, ScD, SandraPeterson, MSc, Anita Kozyrskyj, BSc (Pharm), MSc, Noralou Roos, PhD, BogdanBogdanovich, Bcomm, BA, (December 1999)
Seasonal Patterns in Winnipeg Hospital UseSeasonal Patterns in Winnipeg Hospital UseSeasonal Patterns in Winnipeg Hospital UseSeasonal Patterns in Winnipeg Hospital Use, by Verena Menec, PhD, Noralou Roos,PhD, Deborah Nowicki, MSc, Leonard MacWilliam, MSc, MNRM, Greg Finlayson, BA, CAE,Charlyn Black, MD, ScD (October 1999)
124
INDICATORS OF HEALTH STATUS
Hospital Case-Mix Costing Project: Using the Manitoba Management InformationHospital Case-Mix Costing Project: Using the Manitoba Management InformationHospital Case-Mix Costing Project: Using the Manitoba Management InformationHospital Case-Mix Costing Project: Using the Manitoba Management InformationSystem, A first stepSystem, A first stepSystem, A first stepSystem, A first step, by Greg Finlayson, BA, CAE, Deborah Nowicki, MSc, Noralou Roos,PhD, Marian Shanahan, RN, MA, Charlyn Black, MD, ScD (July 1999)
Measuring Morbidity in Populations: Performance of the Johns Hopkins AdjustedMeasuring Morbidity in Populations: Performance of the Johns Hopkins AdjustedMeasuring Morbidity in Populations: Performance of the Johns Hopkins AdjustedMeasuring Morbidity in Populations: Performance of the Johns Hopkins AdjustedClinical Group (ACG) Case-Mix Adjustment System in ManitobaClinical Group (ACG) Case-Mix Adjustment System in ManitobaClinical Group (ACG) Case-Mix Adjustment System in ManitobaClinical Group (ACG) Case-Mix Adjustment System in Manitoba, by Robert Reid, MD,PhD, Leonard MacWilliam, MSc, MNRM, Noralou Roos, PhD, Bogdan Bogdanovich,BComm, BA, Charlyn Black, MD, ScD (June 1999)
Comparative Indicators of Population Health and Health Care Use for Manitoba’sComparative Indicators of Population Health and Health Care Use for Manitoba’sComparative Indicators of Population Health and Health Care Use for Manitoba’sComparative Indicators of Population Health and Health Care Use for Manitoba’sRegional Health Authorities: A POPULIS Project, Regional Health Authorities: A POPULIS Project, Regional Health Authorities: A POPULIS Project, Regional Health Authorities: A POPULIS Project, by Charlyn Black, MD, ScD, NoralouRoos, PhD, Randy Fransoo, MSc, Patricia Martens, PhD (June 1999)
Cost List for Manitoba Health ServicesCost List for Manitoba Health ServicesCost List for Manitoba Health ServicesCost List for Manitoba Health Services, by Philip Jacobs, DPhil, CMA, Marian Shanahan,RN, MA, Noralou Roos, Phd, Michael Farnworth, MA (January 1999)
Monitoring the Winnipeg Hospital System: 1990/91 through 1996/97, Monitoring the Winnipeg Hospital System: 1990/91 through 1996/97, Monitoring the Winnipeg Hospital System: 1990/91 through 1996/97, Monitoring the Winnipeg Hospital System: 1990/91 through 1996/97, by MarniBrownell, PhD, Noralou Roos, PhD and Charles Burchill, BSc, MSc (February 1999)
Surgical Waiting Times in ManitobaSurgical Waiting Times in ManitobaSurgical Waiting Times in ManitobaSurgical Waiting Times in Manitoba, by Carolyn DeCoster, RN, MBA, K.C. Carriere, PhD,Sandra Peterson, MSc, Randy Walld, BSc, BComm. and Leonard MacWilliam, MSc, MNRM(June 1998)
A Needs-based Funding Methodology for Regional Health Authorities: A ProposedA Needs-based Funding Methodology for Regional Health Authorities: A ProposedA Needs-based Funding Methodology for Regional Health Authorities: A ProposedA Needs-based Funding Methodology for Regional Health Authorities: A ProposedFrameworkFrameworkFrameworkFramework, by Cam Mustard, ScD. and Shelley Derksen, MSc. (October 1997)
Interprovincial Comparisons of Health Care ExpendituresInterprovincial Comparisons of Health Care ExpendituresInterprovincial Comparisons of Health Care ExpendituresInterprovincial Comparisons of Health Care Expenditures, by Marian Shanahan, RN,MA and Cecile Gousseau, MBA (June 1997)
Issues in Developing Indicators for Needs-Based FundingIssues in Developing Indicators for Needs-Based FundingIssues in Developing Indicators for Needs-Based FundingIssues in Developing Indicators for Needs-Based Funding, by Norman Frohlich, PhDand KC Carriere, PhD (June 1997)
Issues in the Management of Specialist Physician Resources for ManitobaIssues in the Management of Specialist Physician Resources for ManitobaIssues in the Management of Specialist Physician Resources for ManitobaIssues in the Management of Specialist Physician Resources for Manitoba, by NoralouRoos, PhD, Randy Fransoo, MSc, Bogdan Bogdanovic, BComm, BA, David Friesen, BSc,Leonard MacWilliam, MSc, MNRM (June 1997)
A Project to Investigate Provincial Expenditures on Health Care to Manitobans AA Project to Investigate Provincial Expenditures on Health Care to Manitobans AA Project to Investigate Provincial Expenditures on Health Care to Manitobans AA Project to Investigate Provincial Expenditures on Health Care to Manitobans APOPULIS ProjectPOPULIS ProjectPOPULIS ProjectPOPULIS Project, by Marian Shanahan, RN, MA, Carmen Steinbach, Charles Burchill, BSc,MSc, David Friesen, BSc (June 1997)
Alternatives to Acute CareAlternatives to Acute CareAlternatives to Acute CareAlternatives to Acute Care, by Carolyn DeCoster, RN, MBA, Sandra Peterson, BSc, MScand Paul Kasian, MD (July 1996)
Needs-Based Planning for Manitoba’s Generalist PhysiciansNeeds-Based Planning for Manitoba’s Generalist PhysiciansNeeds-Based Planning for Manitoba’s Generalist PhysiciansNeeds-Based Planning for Manitoba’s Generalist Physicians, by Noralou Roos, PhD,Randy Fransoo, MSc, Bogdan Bogdanovic, BComm, BA, David Friesen, BSc, NormFrohlich, PhD, KC Carriere, PhD, David Patton, PhD and Ron Wall, BASc, MBA (June 1996)
Patterns of Tonsillectomy in Manitoba 1989-1993, Patterns of Tonsillectomy in Manitoba 1989-1993, Patterns of Tonsillectomy in Manitoba 1989-1993, Patterns of Tonsillectomy in Manitoba 1989-1993, by Charlyn Black, MD, ScD, SandraPeterson, MSc, John Mansfield, MBChB., FRCPC, Mary Thliveris, RN, BA (February 1996)
125
INDICATORS OF HEALTH STATUS
Monitoring the Winnipeg Hospital System: The Update Report 1993/1994Monitoring the Winnipeg Hospital System: The Update Report 1993/1994Monitoring the Winnipeg Hospital System: The Update Report 1993/1994Monitoring the Winnipeg Hospital System: The Update Report 1993/1994, by Marni D.Brownell, PhD and Noralou Roos, PhD (January 1996)
Socioeconomic Gradients in Mortality and the Use of Health Care Services atSocioeconomic Gradients in Mortality and the Use of Health Care Services atSocioeconomic Gradients in Mortality and the Use of Health Care Services atSocioeconomic Gradients in Mortality and the Use of Health Care Services atDifferent Stages in the Life CourseDifferent Stages in the Life CourseDifferent Stages in the Life CourseDifferent Stages in the Life Course, by Cam Mustard, ScD, Shelley Derksen, MSc, Jean-Marie Berthelot, Michael Wolfson, PhD, Leslie L. Roos, PhD and KC Carriere, PhD(December 1995)
A Report on the Health Status, Socio-Economic Risk and Health Care Use of theA Report on the Health Status, Socio-Economic Risk and Health Care Use of theA Report on the Health Status, Socio-Economic Risk and Health Care Use of theA Report on the Health Status, Socio-Economic Risk and Health Care Use of theManitoba Population 1992-93 and Overview of the 1990-91 to 1992-93 Findings,Manitoba Population 1992-93 and Overview of the 1990-91 to 1992-93 Findings,Manitoba Population 1992-93 and Overview of the 1990-91 to 1992-93 Findings,Manitoba Population 1992-93 and Overview of the 1990-91 to 1992-93 Findings, byNorman Frohlich, PhD, Trevor Markesteyn, PhD, Noralou Roos, PhD, KC Carriere, PhD,Charlyn Black, MD, ScD, Carolyn DeCoster, RN, MBA, Charles Burchill, BSc, MSc andLeonard MacWilliam, MSc, MNRM (December 1994)
Hospital Case Mix Costing Project 1991/92,Hospital Case Mix Costing Project 1991/92,Hospital Case Mix Costing Project 1991/92,Hospital Case Mix Costing Project 1991/92, Marian Shanahan, RN, MA, Michael Loyd,MA, Noralou Roos, PhD and Marni Brownell, PhD (December 1994)
Monitoring the Winnipeg Hospital System: The First Report 1990-1992Monitoring the Winnipeg Hospital System: The First Report 1990-1992Monitoring the Winnipeg Hospital System: The First Report 1990-1992Monitoring the Winnipeg Hospital System: The First Report 1990-1992, by NoralouRoos, PhD and Evelyn Shapiro, MA (July 1994)
The Utilization of Medical Services for Mental Health Disorders Manitoba: 1991-1992The Utilization of Medical Services for Mental Health Disorders Manitoba: 1991-1992The Utilization of Medical Services for Mental Health Disorders Manitoba: 1991-1992The Utilization of Medical Services for Mental Health Disorders Manitoba: 1991-1992,Douglas Tataryn, PhD, Cam Mustard, ScD and Shelley Derksen, MSc (July 1994)
Redirecting Care from Winnipeg Hospitals to Ten Large Rural Facilities: EstimatedRedirecting Care from Winnipeg Hospitals to Ten Large Rural Facilities: EstimatedRedirecting Care from Winnipeg Hospitals to Ten Large Rural Facilities: EstimatedRedirecting Care from Winnipeg Hospitals to Ten Large Rural Facilities: EstimatedNumber of Cases, Feasibility and ImplicationsNumber of Cases, Feasibility and ImplicationsNumber of Cases, Feasibility and ImplicationsNumber of Cases, Feasibility and Implications, by Charlyn Black, MD, ScD and Charles ABurchill, BSc, MSc (June 1994)
Utilization of Physician Resources, Volume II: Methods & TablesUtilization of Physician Resources, Volume II: Methods & TablesUtilization of Physician Resources, Volume II: Methods & TablesUtilization of Physician Resources, Volume II: Methods & Tables, by Douglas Tataryn,PhD, Noralou Roos, PhD and Charlyn Black, MD ScD (March 1994)
Utilization of Physician Resources, Volume I: Key FindingsUtilization of Physician Resources, Volume I: Key FindingsUtilization of Physician Resources, Volume I: Key FindingsUtilization of Physician Resources, Volume I: Key Findings, by Douglas Tataryn, PhD,Noralou Roos, PhD and Charlyn Black, MD, ScD (March 1994)
Estimating Per Diem costs for Manitoba Hospitals: A First StepEstimating Per Diem costs for Manitoba Hospitals: A First StepEstimating Per Diem costs for Manitoba Hospitals: A First StepEstimating Per Diem costs for Manitoba Hospitals: A First Step, by Ronald Wall, MASc,MBA, PEng, Carolyn DeCoster, RN, MBA, and Noralou Roos, PhD (February 1994)
Socio-Economic CharacteristicsSocio-Economic CharacteristicsSocio-Economic CharacteristicsSocio-Economic Characteristics, by Norman Frohlich, PhD. and Cam Mustard, ScD(January 1994)
Population Health: Health Status Indicators, Volume II: Methods & TablesPopulation Health: Health Status Indicators, Volume II: Methods & TablesPopulation Health: Health Status Indicators, Volume II: Methods & TablesPopulation Health: Health Status Indicators, Volume II: Methods & Tables, by MarshaCohen, MD, FRCPC and Leonard MacWilliam, MSc, MNRM (January 1994)
Population Health: Health Status Indicators, Volume I: Key FindingsPopulation Health: Health Status Indicators, Volume I: Key FindingsPopulation Health: Health Status Indicators, Volume I: Key FindingsPopulation Health: Health Status Indicators, Volume I: Key Findings, by Marsha Cohen,MD, FRCPC and Leonard MacWilliam, MSc, MNRM (January 1994)
Utilization of Hospital Resources, Volume II: Methods & TablesUtilization of Hospital Resources, Volume II: Methods & TablesUtilization of Hospital Resources, Volume II: Methods & TablesUtilization of Hospital Resources, Volume II: Methods & Tables, by Charlyn Black, MD,ScD, Noralou Roos, PhD and Charles Burchill, BSc, MSc (December 1993)
Utilization of Hospital Resources, Volume I: Key FindingsUtilization of Hospital Resources, Volume I: Key FindingsUtilization of Hospital Resources, Volume I: Key FindingsUtilization of Hospital Resources, Volume I: Key Findings, by Charlyn Black, MD, ScD,Noralou Roos, PhD and Charles Burchill, BSc, MSc (December 1993)
126
INDICATORS OF HEALTH STATUS
Assessing Quality of Care in Manitoba Personal Care Homes by Using AdministrativeAssessing Quality of Care in Manitoba Personal Care Homes by Using AdministrativeAssessing Quality of Care in Manitoba Personal Care Homes by Using AdministrativeAssessing Quality of Care in Manitoba Personal Care Homes by Using AdministrativeData to Monitor OutcomesData to Monitor OutcomesData to Monitor OutcomesData to Monitor Outcomes, by Evelyn Shapiro, MA and Robert B. Tate, MSc (November1993)
Utilization of Personal Care Home Resources, Volume II: Methods & TablesUtilization of Personal Care Home Resources, Volume II: Methods & TablesUtilization of Personal Care Home Resources, Volume II: Methods & TablesUtilization of Personal Care Home Resources, Volume II: Methods & Tables, byCarolyn DeCoster, RN, MBA, Noralou Roos, PhD and Bogdan Bogdanovic, BComm, BA(October 1993)
Utilization of Personal Care Home Resources, Volume I: Key FindingsUtilization of Personal Care Home Resources, Volume I: Key FindingsUtilization of Personal Care Home Resources, Volume I: Key FindingsUtilization of Personal Care Home Resources, Volume I: Key Findings, by CarolynDeCoster, RN, MBA, Noralou Roos, PhD. and Bogdan Bogdanovic, BComm, BA (October1993)
The Utilization of Prenatal Care and Relationship to Birthweight Outcome inThe Utilization of Prenatal Care and Relationship to Birthweight Outcome inThe Utilization of Prenatal Care and Relationship to Birthweight Outcome inThe Utilization of Prenatal Care and Relationship to Birthweight Outcome inWinnipeg, 1987-88Winnipeg, 1987-88Winnipeg, 1987-88Winnipeg, 1987-88, by Cam Mustard, ScD (January 1993)
An Assessment of How Efficiently Manitoba's Major Hospitals Discharge TheirAn Assessment of How Efficiently Manitoba's Major Hospitals Discharge TheirAn Assessment of How Efficiently Manitoba's Major Hospitals Discharge TheirAn Assessment of How Efficiently Manitoba's Major Hospitals Discharge TheirPatientsPatientsPatientsPatients, by Marni Brownell, PhD and Noralou Roos, PhD (October 1992)
Maternal Demographic Risk Factors and the Incidence of Low Birthweight, ManitobaMaternal Demographic Risk Factors and the Incidence of Low Birthweight, ManitobaMaternal Demographic Risk Factors and the Incidence of Low Birthweight, ManitobaMaternal Demographic Risk Factors and the Incidence of Low Birthweight, Manitoba1979-19891979-19891979-19891979-1989, by Cam Mustard, ScD (November 1991)
Hospital Funding within the Health Care System: Moving Towards EffectivenessHospital Funding within the Health Care System: Moving Towards EffectivenessHospital Funding within the Health Care System: Moving Towards EffectivenessHospital Funding within the Health Care System: Moving Towards Effectiveness, byCharlyn Black, MD, ScD and Norman Frohlich, PhD (May 1991)
Manitoba Health Care Studies and Their Policy ImplicationsManitoba Health Care Studies and Their Policy ImplicationsManitoba Health Care Studies and Their Policy ImplicationsManitoba Health Care Studies and Their Policy Implications, by Evelyn Shapiro, MA(April 1991)
If you would like to receive a copy of any of our reports, the price (in Canadian funds) foreach report is $10.00 in Canada and $12.00 outside of Canada (there is no charge forreports mailed in Manitoba). Please send an international money order or an institutionalcheque payable to the “University of Manitoba“University of Manitoba“University of Manitoba“University of Manitoba” ” ” ” with your completed order form. Wecannot cannot cannot cannot accept personal cheques drawn on non-Canadian banks. Nor can we accept apurchase order; we must receive your payment prior to sending out any reports. Sendyour order form and payment to:
Manitoba Centre for Health Policy and EvaluationManitoba Centre for Health Policy and EvaluationManitoba Centre for Health Policy and EvaluationManitoba Centre for Health Policy and EvaluationUniversity of ManitobaUniversity of ManitobaUniversity of ManitobaUniversity of Manitoba
Visit MCHPE’s WWW site at: http://www.umanitoba.ca/centres/mchpe
There you’ll find:� A complete listing of all MCHPE reports. You can get one our summaries, a
full report (for download in pdf), a power-point presentation, or orderinginformation
� A link to our Research Index. Click on the Concepts/Research icon andyou’ll be able to mine a motherlode of research resources, including our:� Concept Dictionary: answers to frequently asked questions,
programming tips and descriptions of database analysis topics� Research Definitions: surgical procedures, medical diagnoses and
diagnostic tests� Meta-Index to Concepts and Definitions: subject-based index� Glossary and Related Terms: glossary of terms used at MCHPE� Teaching:
� Web-based graduate course in Epidemiology and Health Care� Introduction to SAS from MCHPE