Indicators of Microbial Quality of Waters: From D’Herelle to “What the Hell?” Gary A. Toranzos and Alfredo Gonzalez Ancient DNA Center/ Environmental Microbiology Laboratory, University of Puerto Rico, Rio Piedras
Transcript
Indicators of Microbial Quality of Waters: From D’Herelle to “What
the Hell?” Gary A. Toranzos and Alfredo Gonzalez
Ancient DNA Center/ Environmental Microbiology Laboratory, University of Puerto Rico, Rio Piedras
I KNOW ONE THING: THAT I KNOW NOTHING
Socrates (470-399 BC)
Or those of us involved in environmental microbiology
Average Concentrations in Fecal Matter
* Concentrations may vary with diet and even individual.
From Latrines to Toilets
Smart Sensor Web
Sap Flow Sensor Array
Minirhizotron Array
Multiparameter Soil Probes
‘Smart Dust’ tagged Insects Automated E-tongue
Sensor Clustered MEMS Insects
RF Telemetry Macro-organisms
Instrumenting the Environment
Micro-weather Stations
E-nose
1 2
3 4
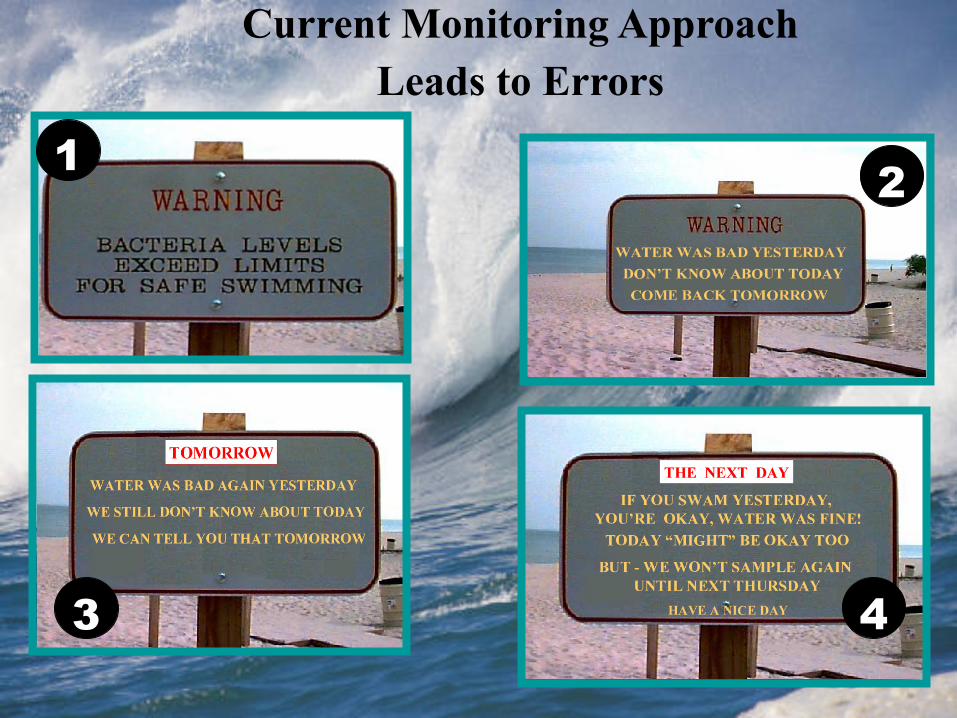
Current Monitoring Approach Leads to Errors
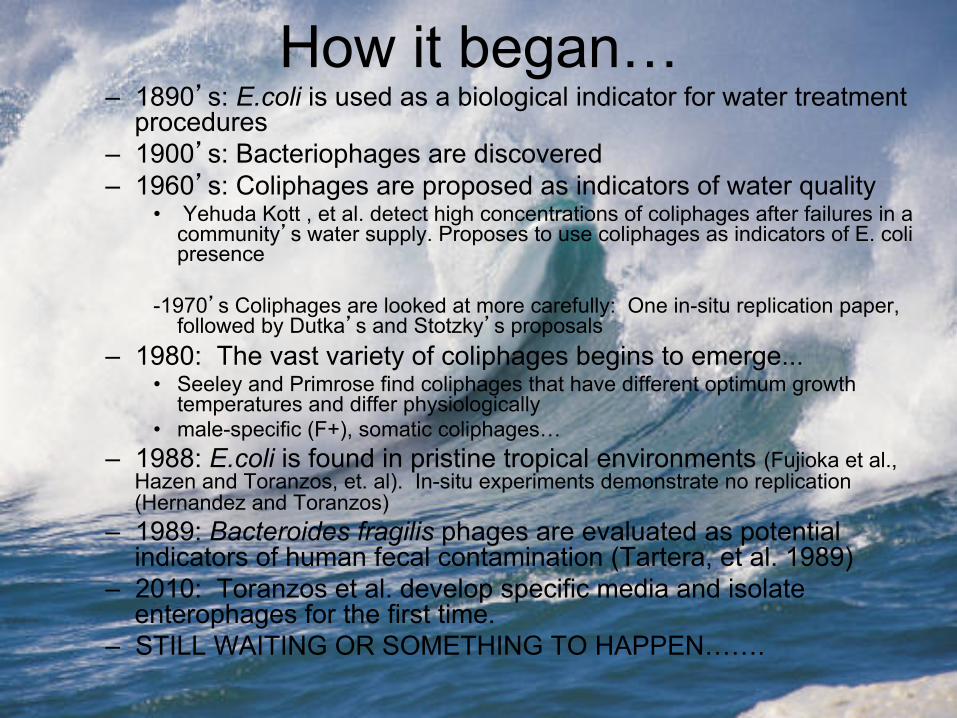
How it began… – 1890’s: E.coli is used as a biological indicator for water treatment
procedures – 1900’s: Bacteriophages are discovered – 1960’s: Coliphages are proposed as indicators of water quality
• Yehuda Kott , et al. detect high concentrations of coliphages after failures in a community’s water supply. Proposes to use coliphages as indicators of E. coli presence
-1970’s Coliphages are looked at more carefully: One in-situ replication paper,
followed by Dutka’s and Stotzky’s proposals – 1980: The vast variety of coliphages begins to emerge...
• Seeley and Primrose find coliphages that have different optimum growth temperatures and differ physiologically
• male-specific (F+), somatic coliphages… – 1988: E.coli is found in pristine tropical environments (Fujioka et al.,
Hazen and Toranzos, et. al). In-situ experiments demonstrate no replication (Hernandez and Toranzos)
– 1989: Bacteroides fragilis phages are evaluated as potential indicators of human fecal contamination (Tartera, et al. 1989)
– 2010: Toranzos et al. develop specific media and isolate enterophages for the first time.
– STILL WAITING OR SOMETHING TO HAPPEN…….
Somatic Coliphages
• Widely distributed in sewage but also in non-contaminated rivers – May replicate in sewage???? and in
natural water environments • No direct correlation to the presence of
enteric viruses in water. – Are sometimes not detected in waters
positive for enteric viruses.
Bacteroides phages
– Detected 1000x more in raw sewage than in sewage-contaminated waters.
– Scarce numbers found in sewage from slaughterhouses and in waters polluted with wildlife fecal contamination.
• Although they are also associated with animal feces • Implies a wide host range?
– Does not seem to multiply significantly in most natural environments; only under anaerobic conditions with high nutrient content.
F-specific RNA coliphages • Seeley and Primrose (1980) suggested
that coliphages replicating at 15 to 45ºC (mid and low temperature bacteriophages) may indicate fecal contamination.
• The F-specific RNA phages belong to this group and can replicate at 37 to 42ºC.
• Examples include those of the Leviviridae family (MS2).
F-specific RNA coliphages
• Yet, these phages are present at very low concentrations in the human colon and are not source-specific.
• The low concentrations of F-RNA phages in feces, but high concentrations in the environment suggest that replication occurs in the environment.
F-specific RNA coliphages
Group Host I Non-human animals. II Humans and occasionally pigs. III Exclusively human (????). IV Non-human origin with rare human associations.
Somatic coliphages
• This group has been studied as a single group.
• Studies have shown that somatic coliphages are very diverse.
• Recent studies by Sobsey have evaluated molecular approaches to detect these in the environment.
Novel Possible Indicators • Enterophages • Possible surrogates of human
fecal contamination: • Present in human feces • Survival (7 days fresh waters/13 days in marine waters and sand at 22°C). • Not present in environmental waters.
Bar =200nm
Bar =20nm
Bar =100nm
EPA’s Indicators & Methods Reseach
• Evaluation of qPCR performance, relative to other methods, in wastewater effluents and ambient waters;
• Single lab validation (completed) – Enterococcus qPCRand Bacteroidales
qPCR methods are now posted online; – Methods published at: http://water.epa.gov/scitech/swguidance/
methods/bioindicators/biological_index.cfm • Multi-lab validation complete for marine
waters, underway for fresh waters. 16
Other EPA Indicator/Method Efforts • Developing Approaches to Bring Additional
Indicator/Methods into Criteria – Establish scientifically defensible “equivalency” of indicator/methods with an unknown health relationship to indicator/methods with an established health relationship.
• Developing Options for Incorporating New Technologies and Methods into State WQS
– Identify analyses and techniques states could use to incorporate alternative indicators and novel methods into state standards.
17
Soooo, what do we do? Do we keep the usual suspects (E.coli and
Enterococci)? Do we even TRY bacteriophages
as indicators (of something)? What do indicators indicate;
really?
Microbial species concept is absolete
• Whole genome sequencing is opening our eyes to the diversity of genomes within ‘single species’ (pangenomes)
• Most microbes have yet to be identified – so expect novel pathogens to be identified in the near future – Horizontal transfer expected with virulence factors
• For E. coli & other non-obligate pathogens, explains why microbial source tracking may not work – gene targets move – We need to be really careful in interpreting
environmental molecular detections – as we know little about most microbial genetic diversity
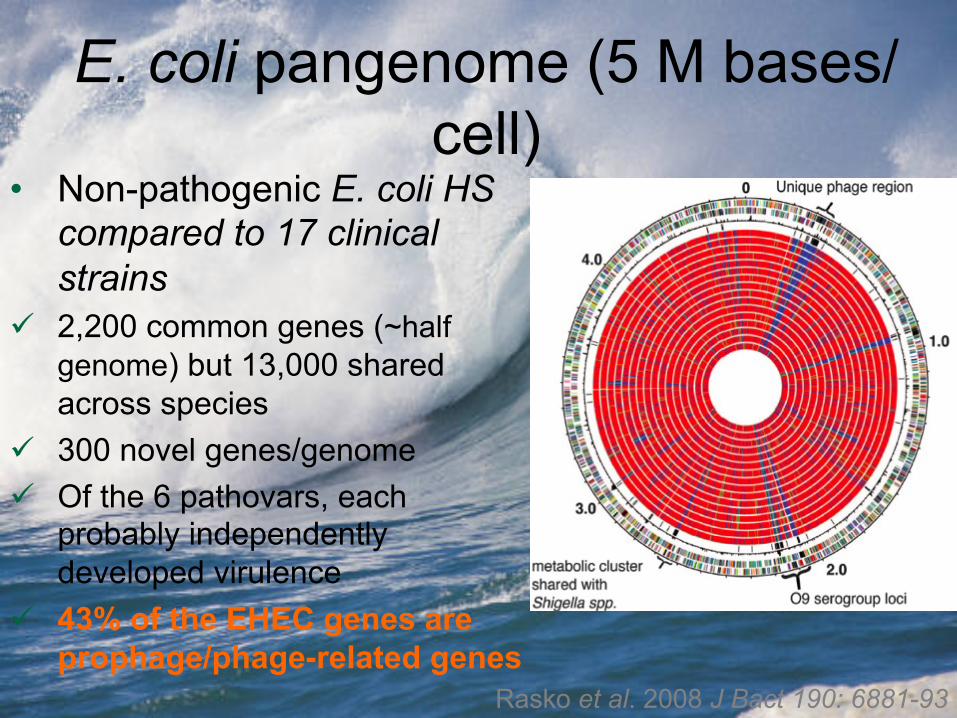
E. coli pangenome (5 M bases/cell)
Rasko et al. 2008 J Bact 190: 6881-93
• Non-pathogenic E. coli HS compared to 17 clinical strains
ü 2,200 common genes (~half genome) but 13,000 shared across species
ü 300 novel genes/genome ü Of the 6 pathovars, each
probably independently developed virulence
ü 43% of the EHEC genes are prophage/phage-related genes
Not just contamination – Ecology, Biology AND EVOLUTION
important to understand • Pathogens
– Difficult to detect, many problems – Thus fecal indicators used (over 100 years INSTEAD OF………)
• E. coli,V. cholerae and other “enteric bacteria”? have environmental reservoirs – poorly understood: WHAT TO DO
Known unknowns • Traditional fecal indicators
– Sources are fecal and non-fecal – Less indicative of health risk when sewage is not a significant or obvious source
– Spatial & temporal variability differs from pathogens
• New indicators (e.g. Bacteroides phages,enterophages) – Ecological sources & behavior not understood
– So still reliant on sound sanitary understanding
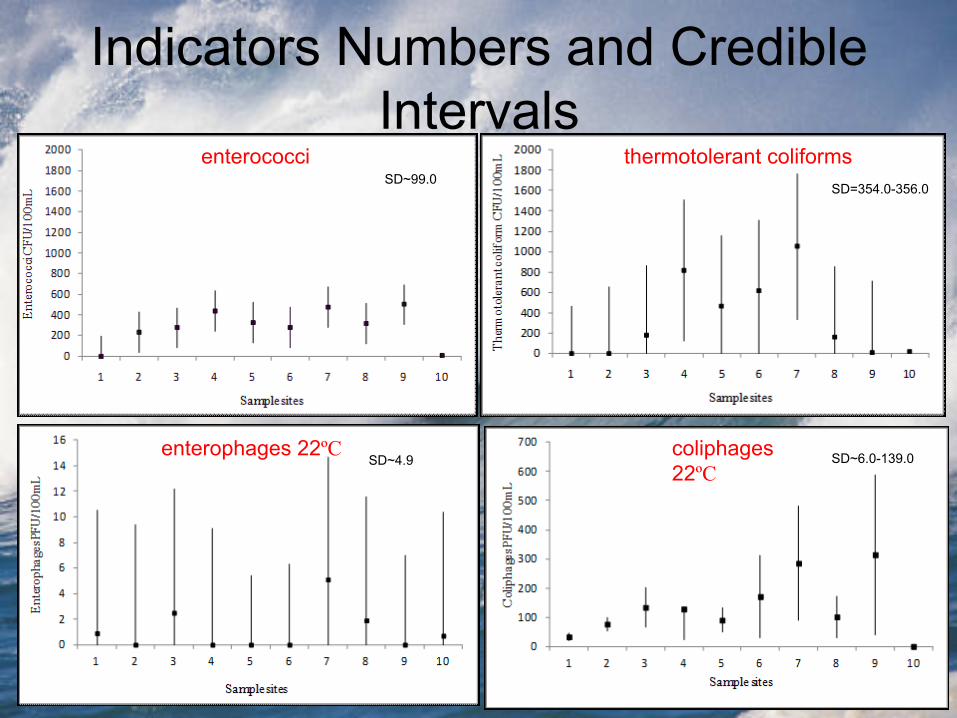
Background • There is the need of finding reliable
markers of human fecal pollution. • Currently used bacterial indicators fail to
mimic human enteric viruses in waters. • Why Enterococcus-infecting phages?
• Little is known about these phages. • It remains unknown if Enterococcus-infecting
phages are present in the feces of animals and humans.
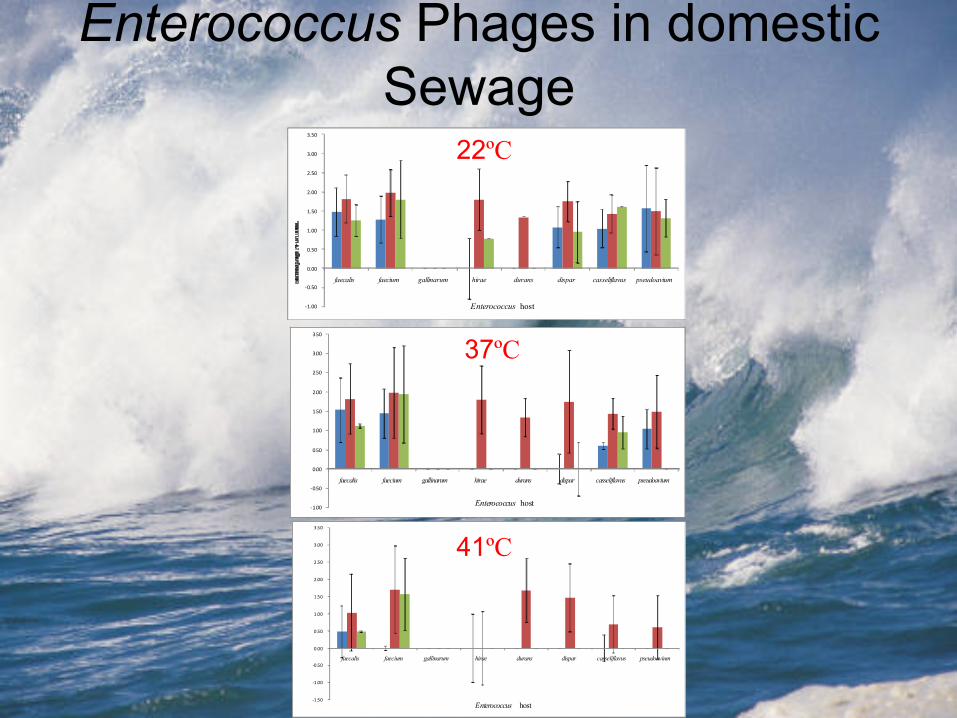
Host Phage Isolate E. faecalis E. faecium E. gallinarum E. hirae E. durans E. dispar E. casseliflavus E. psdeudoavium
E. faecalis sewage a, b, c - - - - - - - fresh a, b, c - - - - - - - E. faecium sewage a, b, c a, b - - - a, b - a, b poultry - b - - - a, b - a, b fresh - b - - - - - a, b E. hirae sewage - - - a, b, c - c - b, c E. dispar sewage a, b, c - - - - b, c - a, b E. casseliflavus sewage - - - b, c - b a a, b, c poultry - a, b a, b, c a, b, c a, b, c a, b, c a, b, c a, b, c
E. pseudoavium sewage b - - c - b - a, b
poultry - a, b, c a, b, c a, b, c a a, b, c - a, b, c
a= 22ºC; b=37ºC; 41ºC
!
0.00
1.00
2.00
3.00
4.00
5.00
6.00
0 1 2 3 4 5 6
Time%(days)
E.!faecalis
E.!faecium
E.!casseliflavus
E.!coli
!
0.00
1.00
2.00
3.00
4.00
5.00
6.00
0 1 2 3 4 5 6
Time%(days)
E.!faecalis
E.!faecium
E.!casseliflavus
E.!coli
!
0.00
1.00
2.00
3.00
4.00
5.00
6.00
0 1 2 3 4 5 6
Time%(days)
E.!faecalis
E.!faecium
E.!casseliflavus
E.!coli
22°C 37°C
41°C
• There is no significant difference in the inactivation rate of E. faecalis, E. faecium, E. casseliflavus and E. coli phages in sewage at 4°C, obviating current guidelines of processing samples 4-6h post-collection.
Inactivation Rate of enterophages and coliphages in sewage at 4°C
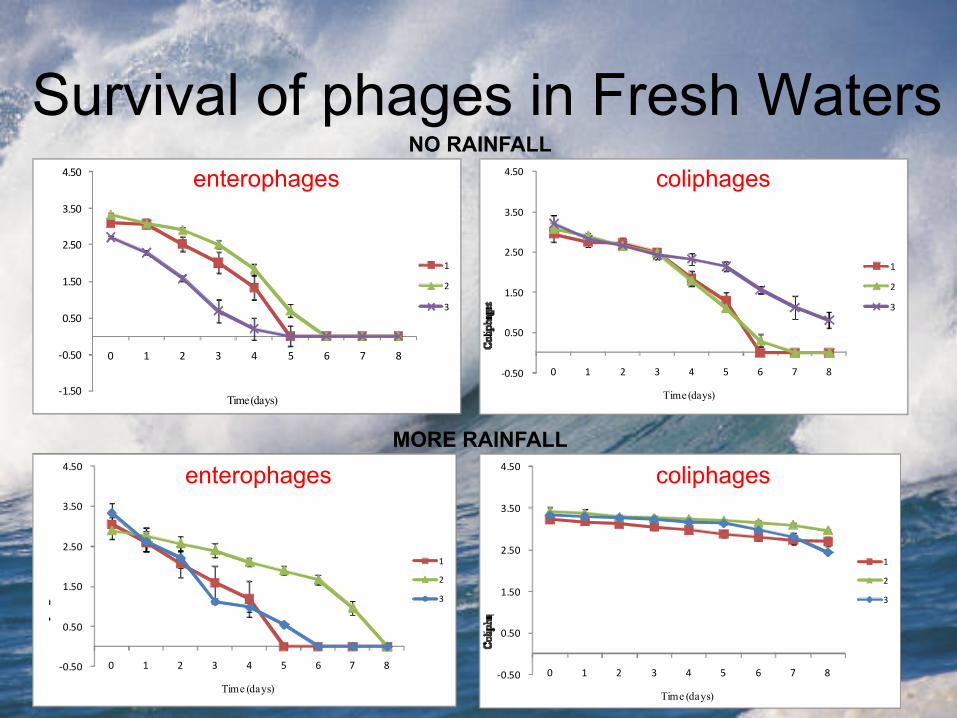
Survival of phages in Fresh Waters
!
"1.50
"0.50
0.50
1.50
2.50
3.50
4.50
0 1 2 3 4 5 6 7 8
Time (days)
1
2
3
!
"0.50
0.50
1.50
2.50
3.50
4.50
0 1 2 3 4 5 6 7 8
Time (days)
1
2
3
enterophages coliphages
!
"0.50
0.50
1.50
2.50
3.50
4.50
0 1 2 3 4 5 6 7 8
Time (days)
1
2
3
!
"0.50
0.50
1.50
2.50
3.50
4.50
0 1 2 3 4 5 6 7 8
Time (days)
1
2
3
enterophages coliphages
NO RAINFALL
MORE RAINFALL
Survival in Tap Water
0.00
0.50
1.00
1.50
2.00
2.50
3.00
3.50
4.00
4.50
0 1 2 3 4 5 6 7 8 9 10 11
Time0(days)
22°C
37°C
41°C
0.00
0.50
1.00
1.50
2.00
2.50
3.00
3.50
4.00
4.50
0 1 2 3 4 5 6 7 8 9 10 11 12
Time0(days)
22°C
37°C
41°C
0.00
0.50
1.00
1.50
2.00
2.50
3.00
3.50
4.00
4.50
0 1 2 3 4 5 6 7 8 9 10 11
Time0(days)
22°C
37°C
41°C
0.00
0.50
1.00
1.50
2.00
2.50
3.00
3.50
4.00
4.50
0 1 2 3 4 5 6 7 8 9 10 11
Time%(days)
22°C
37°C
41°C
CHLORINATED
DECHLORINATED
enterophages
enterophages
coliphages
coliphages
Conclusions • Enterophages could be used for MST
purposes. • Rainfall could influence the survival of
bacteriophages in tropical fresh waters. • Other Enterococcus-infecting phages may
be used for MST purposes as well. Specifically, those infecting E. faecium, E. casseliflavus and E. pseudoavium replicating at 37°C, may infer the presence of chicken-fecal matter in fresh water sources.
Good, but all indicators have to somehow be “health-
associated” I.e. epidemiological studies…..
Any “new” indicator has to be at least as good as the “old”
ones
Current regulations and phages
U.S. Environmental Protection Agency. 2006. National primary drinking water regulations: ground water rule; final rule; 40 CFR parts 9, 141, and 142. Fed. Regist. 71:65574–65660. Queensland Government – Environmental Protection Agency. 2005. Queensland Water Recycling Guidelines. Pp 84. Bacteriophages mentioned in passing in Chapter 6: Microbial Aspects of Beach Sand Quality. WHO Guidelines for safe recreational water environments. Pp. 118. Guidelines for Canadian Recreational Water Quality. 1992. Minister of Supply and Services Canada. Pp. 25.
Risk-based studies???? Yes, in epidemiological Studies!!
• Germany (Lakes, somatic coliphages, Wiedenmann)
• United States (California, Marine Waters, male-specific coliphages, Colford)
• Puerto Rico (Marine Waters, somatic and male-specific coliphages, Toranzos)
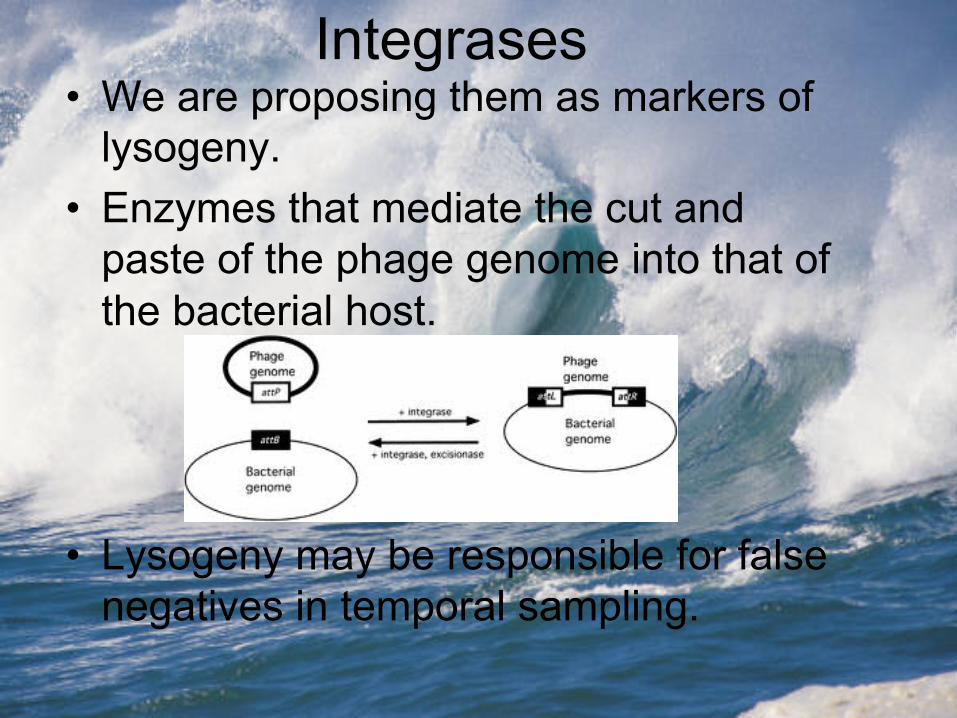
Integrases • We are proposing them as markers of
lysogeny. • Enzymes that mediate the cut and
paste of the phage genome into that of the bacterial host.
• Lysogeny may be responsible for false negatives in temporal sampling.
CRISPRs • What is a CRISPR?
– Clustered Regularly Interspersed Short Palindromic Repeats
– Class of repeats found exclusively in prokaryotes • How widespread are they?
Frequency of Occurrence Unknown • What is their function?
Function Unknown
• How did they get there in the first place?
Mode of Transmission Unknown
James Godde, John Iverson, Kabi Neupane, and Sara Penhale
SOME THOUGHTS 1. Phages are the most promising candidate indicators
for most types of waters; ground-, recreational, reuse as well as drinking (inexpensive, short time, low-tech, and ESPECIALLY VIABILITY!!!!)
2. Need to know the BIOLOGY and ECOLOGY of phages. 3. Need to do whole-genome sequencing of ALL
bacterial hosts to find possible CRISPR sequences, LYSOGENS and VIRULENCE FACTORS.
4. Need to test more phages as indicators of health risk and/or do equivalency measurements to include phages as part of a TOOLBOX once we are sure that there are no confounding variables in the analyses.
“The distribution system is the remaining component of public water supplies yet to be adequately addressed in national efforts to eradicate waterborne disease.”
Well……, also!
National Research Council. 2006. Drinking Water Distribution Systems: Assessing and Reducing Risks. National Academies Press. Washington, DC.
qPCR enterococci Sample sites Wet season Dry season
1 16.52 ± 24.74 0.0023 ± 0.0024
2 9.93 ± 11.59 0.013 ± 0.016
3 10.87 ± 13.36 0.0022 ± 0.00043
4 48.43 ± 40.0 0.025 ± 0.040
5 33.42 ± 43.60 0.0037 ± 0.0
6 28.85 ± 44.10 0.0041 ± 0.076
7 106.81 ± 179.36 0.016 ± 0.021
8 75.75 ± 150.30 0.00085 ± 0.0017
9 34.64 ± 35.80 0.0033 ± 0.0052
10 26.19 ± 40.27 0.0036 ± 0.0063
What May These Changes Mean for Beach Managers, etc.
• New criteria are likely to recommend both culture and qPCR methods.
• Attempting to retain indicators currently adopted into state water quality standards, provided science supports it.
• Research unlikely to allow us to recommend different criteria for different sources. Instead, tools for site-specific criteria derivation under development.
• Looking closely at options for how to express criteria.
Risk to Public Health • It’s all about pathogen sources and not just fecal contamination (human vs. animal sources)
• Emerging pathogens and aging/changing infrastructure
• A numbers game, below detection does not equate to no risk (Ashbolt)
45
• 90 % of the outbreaks are waterborne. • Pathogens concentrations are relatively
low in surface waters. • Thus, sensitive and specific methods for
their detection are still needed. • REAL-TIME DETECTION IS THE “HOLY GRAIL”
Real-time optical detection based on dark-field interferometry
Definition • Has been developed due to the need of a
single method which could quickly and accurately quantify levels of different viruses.
• Is the combination of heterodyne interferometry with dark-field microscopy.
Real-time optical detection based on dark-field interferometry • Advantages
– Can clearly differentiate between single biological nanoparticles (phage and viruses) in a mixture.
– Such high sensitivity and resolution enables to detect even impurities in virus samples.
• Limitations – Specialized equipment and
personnel.
Tryptophan detection
• LiquID: is an instrument is capable of continuously measuring tryptophan, providing a unique method for monitoring E. coli in real time.
• They claim to detect concentrations as low as two colony forming units (CFU)/100 mL, with no sampling, filtering, reagents or waiting required.
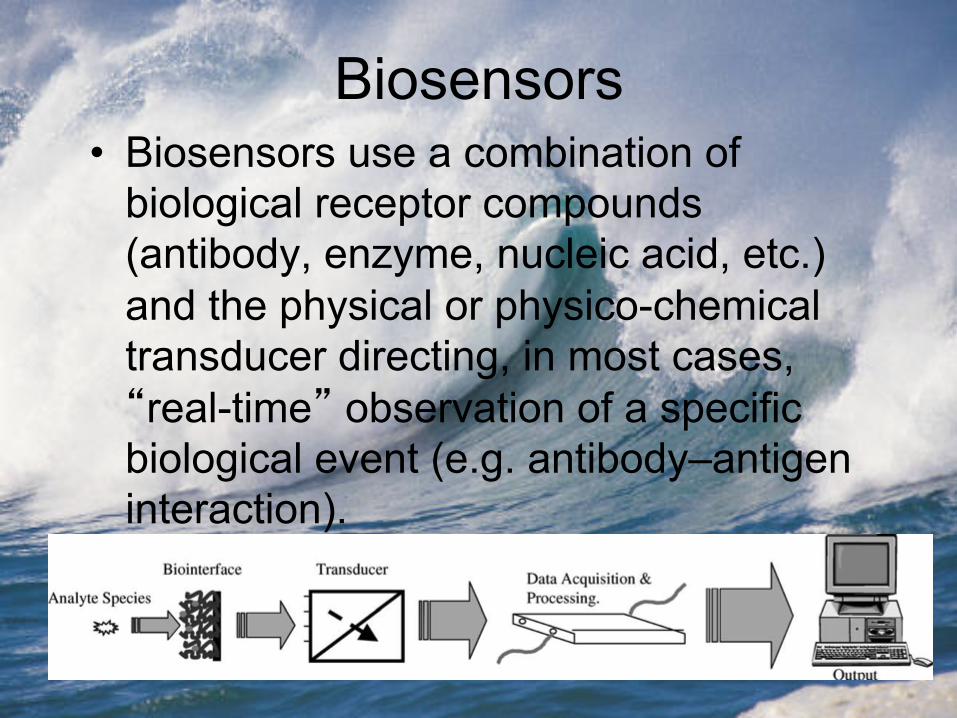
Biosensors • Biosensors use a combination of
biological receptor compounds (antibody, enzyme, nucleic acid, etc.) and the physical or physico-chemical transducer directing, in most cases, “real-time” observation of a specific biological event (e.g. antibody–antigen interaction).
Acoustic wave-based biosensors
• Are based on the detection of mechanical acoustic waves and incorporate a biological component.
• Are mass sensitive detectors, operated on the basis of an oscillating crystal.
• The crystal is coated with a biological reagent (such as an antibody) and exposed to the particular antigen. A quantifiable change occurs in the resonant frequency of the crystal, which correlates to mass changes at the crystal surface.
• Two types: – Bulk wave and surface acoustic wave devices
Advantages
• Label-free, on-line analysis for antigen–antibody interactions.
• Provide the option of several immunoassay formats, which allow increased detection sensitivity and specificity.
• Cost effectiveness combined with ease of use.
Limitations
• Relatively long incubation times for the bacteria and biosensor surface (REAL-TIME?).
• Problems with crystal surface regeneration.
• Number of washing and drying steps required.
• Difficulties in coating and immobilization on the crystal surface.
Molecular Beacon/NASBA Mycobacterium spp. were detected in water and milk. 103 cells /20ml were detected in seeded water, as were E. coli cells (Rodriguez-Lazaro et al., 2004, FEMS; Baeumner, et al, 2003, Biosensors & Bioelect.) Similarly, RSV (down to 47 genome copies were detected in clinical samples (Deiman et al., 2007, JVM) may not be applicable to real-time detection
Arsenic Biosensor Aspergillus niger has a membrane arsenite efflux transporter (acrA). A construct having acrA and efgP (produces dose-dependent flourescence 1.8 to 180 ppb) was used to detect arsenite and arsenate in drinking waters (WHO - 10 to 50 ppb) (Choe, et al., AEM, 2012)
CONCLUSIONS Pros
There is no lack of technology for real-time detection of pathogens. Sensitivity and specificity are tremendous Can be adapted to the water industry
CONCLUSIONS Cons
1. Still in development 2. Industry needs incentives to integrate existing technology to water processes 3. Cost is prohibitive 4. No consensus as to what to use (WERF initiative-a good start) 5. Trained technicians needed
• Current methods for the identification of pollution are based on culture-based methods on selective media (e.g., enterococci, total and fecal coliforms).
• Human enteric virus ,Plant virus and Bacteriophages
• MST is moving to use the metagenomic and bioinformatic tools to find the specific markers capable of identifying and distinguishing the source of contamination between animals and humans.
• We propose a series of human-specific and animal-specific sequences to be used as markers of the presence of specific fecal material: this becomes “SOURCE TRACKING"
• Metagenomic analyses allow the user to rapidly find these sequences and determine the source of the sewage
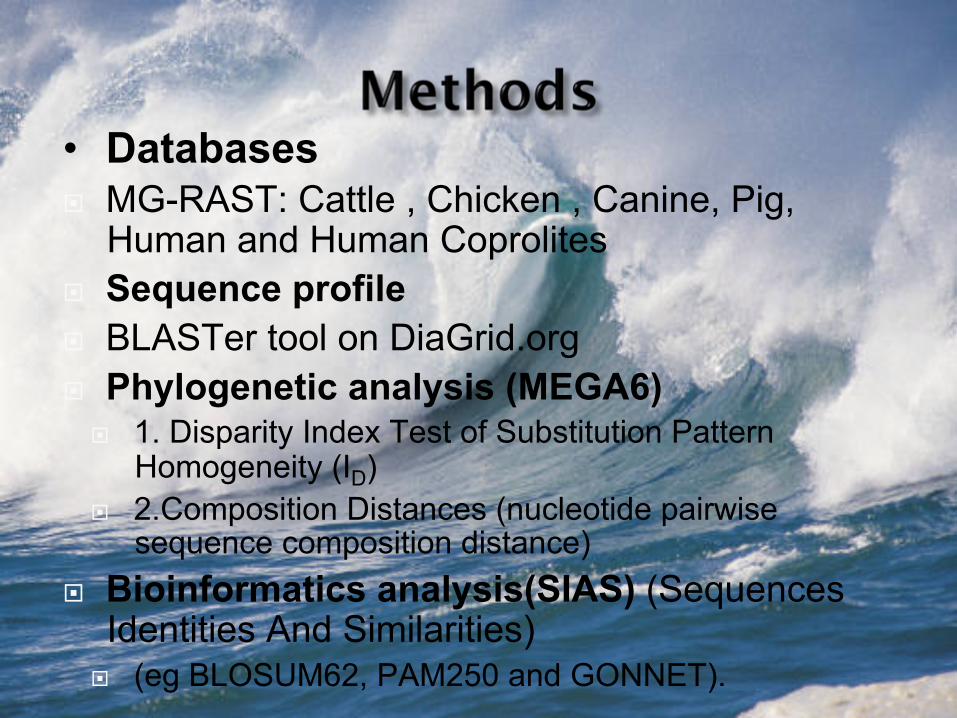
¨ Bioinformatics analysis(SIAS) (Sequences Identities And Similarities)
¨ (eg BLOSUM62, PAM250 and GONNET).
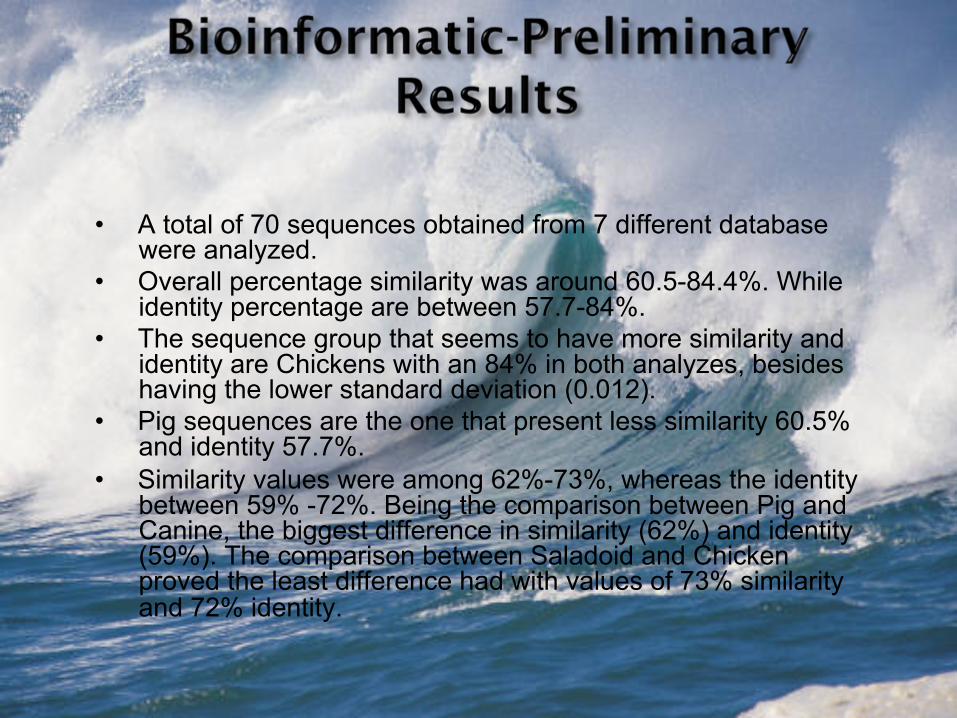
• A total of 70 sequences obtained from 7 different database were analyzed.
• Overall percentage similarity was around 60.5-84.4%. While identity percentage are between 57.7-84%.
• The sequence group that seems to have more similarity and identity are Chickens with an 84% in both analyzes, besides having the lower standard deviation (0.012).
• Pig sequences are the one that present less similarity 60.5% and identity 57.7%.
• Similarity values were among 62%-73%, whereas the identity between 59% -72%. Being the comparison between Pig and Canine, the biggest difference in similarity (62%) and identity (59%). The comparison between Saladoid and Chicken proved the least difference had with values of 73% similarity and 72% identity.
Maximum Parsimony Tree
Maximum parsimony bootstrap
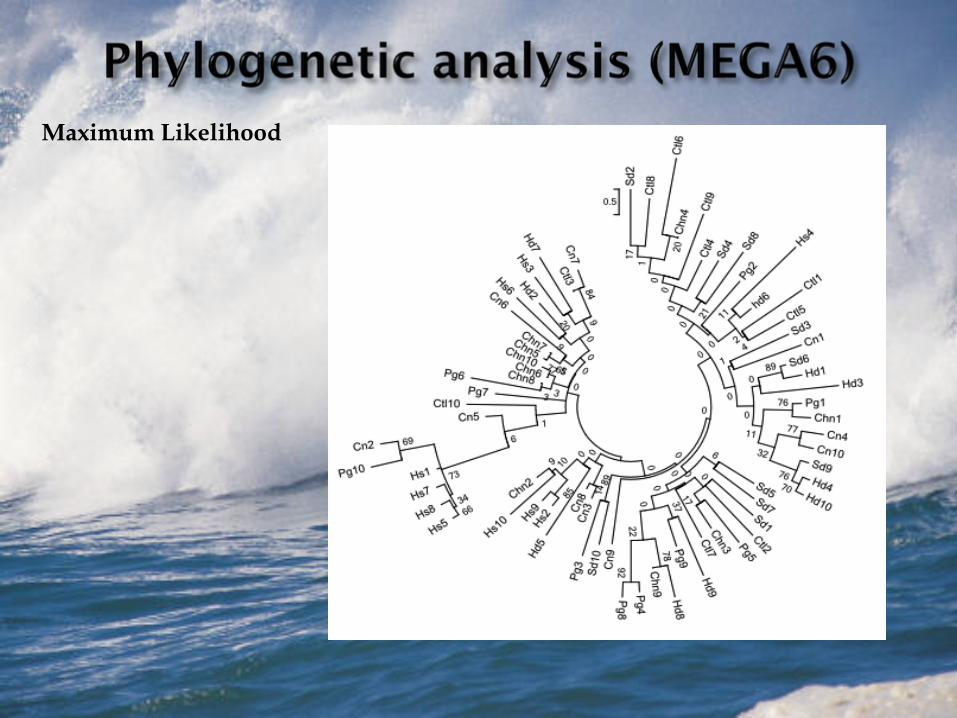
Maximum Likelihood
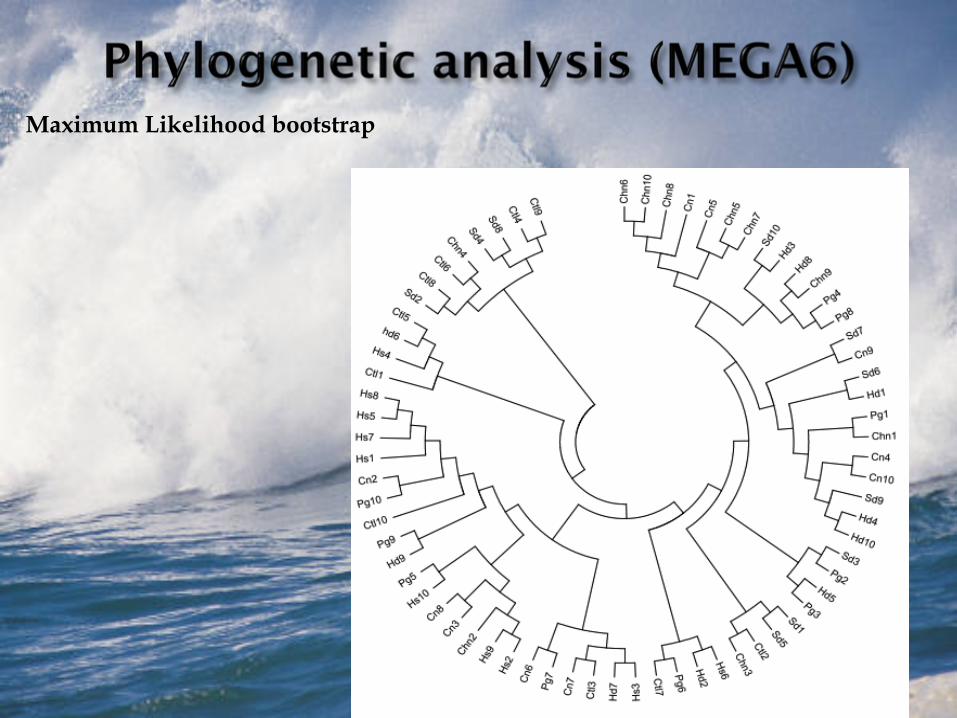
Maximum Likelihood bootstrap
Metagenomic Source Tracking Conclusions
• There are several sequences unique to each animal
• These Sequences may be used to point to specific types of fecal contamination
• Problems exist-namely, half-life of human and animal DNA under different conditions
• Controls need to be VERY STRICT
UNEXPECTED DATA FROM ENVIRONMENTAL
ISOLATES
Or what to do with environmental indicator isolates and their
molecular data
70
the interaction between EHEC and human macrophages has not been investigated.