Individual letters of the RNA polymerase II CTD code govern distinct gene expression programs in fission yeast Beate Schwer a,1 , Danny Asher Bitton b , Ana M. Sanchez a , Jürg Bähler b , and Stewart Shuman c,1 a Department of Microbiology and Immunology, Weill Cornell Medical College, New York, NY 10065; b Department of Genetics, Evolution and Environment and UCL Cancer Institute, University College London, London WC1E 6BT, United Kingdom; and c Molecular Biology Program, Sloan–Kettering Institute, New York, NY 10065 Edited by Fred M. Winston, Harvard Medical School, Boston, MA, and approved February 7, 2014 (received for review November 21, 2013) The primary structure and phosphorylation pattern of the tandem Y 1 S 2 P 3 T 4 S 5 P 6 S 7 repeats of the RNA polymerase II carboxyl-terminal domain (CTD) comprise an informational code that coordinates transcription, chromatin modification, and RNA processing. To gauge the contributions of individual CTD coding “letters” to gene expression, we analyzed the poly(A) + transcriptomes of fission yeast mutants that lack each of the four inessential CTD phos- phoacceptors: Tyr1, Ser2, Thr4, and Ser7. There was a hierarchy of CTD mutational effects with respect to the number of dysregu- lated protein-coding RNAs, with S2A (n = 227) >> Y1F (n = 71) > S7A (n = 58) >> T4A (n = 7). The majority of the protein-coding RNAs affected in Y1F cells were coordinately affected by S2A, suggesting that Tyr1-Ser2 constitutes a two-letter code “word.” Y1F and S2A elicited increased expression of genes encoding pro- teins involved in iron uptake (Frp1, Fip1, Fio1, Str3, Str1, Sib1), without affecting the expression of the genes that repress the iron regulon, implying that Tyr1-Ser2 transduces a repressive signal. Y1F and S2A cells had increased levels of ferric reductase activity and were hypersensitive to phleomycin, indicative of elevated intra- cellular iron. The T4A and S7A mutations had opposing effects on the phosphate response pathway. T4A reduced the expression of two genes encoding proteins involved in phosphate acquisition (the Pho1 acid phosphatase and the phosphate transporter SPBC8E4.01c), with- out affecting the expression of known genes that regulate the phos- phate response pathway, whereas S7A increased pho1 + expression. These results highlight specific cellular gene expression programs that are responsive to distinct CTD cues. iron homeostasis | phosphate homeostasis | transcription profiling T he carboxyl-terminal domain (CTD) of the Rpb1 subunit of RNA polymerase II (Pol II) consists of tandemly repeated heptapeptides of consensus sequence Y 1 S 2 P 3 T 4 S 5 P 6 S 7 . The in- herently plastic CTD structure is modulated by phosphorylation of the Tyr1, Ser2, Thr4, Ser5, and Ser7 residues and by cis–trans isomerization of the prolines (1, 2). With as many as 128 n po- tential CTD primary structures (where n is the number of hep- tads), the CTD provides information about the state of the transcription machinery—a CTD code—that is “read” by CTD receptor proteins that control transcription, modify chromatin structure, and catalyze or regulate mRNA capping, splicing, and polyadenylation (1, 2). Basic informational rules that govern the CTD code have been elucidated by genetically manipulating the composition and struc- ture of the Rpb1 CTD in the fission yeast Schizosaccharomyces pombe (3–7). By introducing alanines and conservative mutations in lieu of Tyr1, Ser2, Pro3, Thr4, Ser5, Pro6, and Ser7 of every consensus heptad of a fully functional Rpb1 CTD array (com- prising 14 consensus heptad repeats linked to the body of Rpb1 by a “rump” consisting of four degenerate heptads), we determined that: (i ) Tyr1, Pro3, Ser5, and Pro6 are essential for viability, by the criterion that alanine substitution is lethal, whereas Ser2, Thr4, and Ser7 are not essential; and (ii ) Y1F, S2A•S7A and T4A•S7A mutants are viable, signifying that phenylalanine is functional in lieu of Tyr1 and that Ser5 is the only strictly essential phos- phorylation site in fission yeast (6). Further interrogation of the grammar and punctuation of the CTD code established that: (i ) all essential coding letters and “words” are encompassed within a diheptad repeat; (ii ) the minimal fission yeast CTD coding unit is a decapeptide Y 1 S 2 P 3 T 4 S 5 P 6 S 7 Y 1 S 2 P 3 and the spacing between coding units is flexible; (iii ) Tyr1 must be present in consecutive heptads and proper spacing between consecutive tyrosines is important for CTD function; (iv) Pro3, Ser5, and Pro6 need not be present in adjacent heptads; and (v) Ser5(P)-Pro6 comprises an essential two-letter code word that is read chiefly by the mRNA capping apparatus (7). Querying how perturbations of CTD primary struc- ture affect CTD serine phosphorylation patterns in vivo, as gauged by Rpb1 reactivity with phosphospecific antibodies, showed that Ser2 phosphorylation does not rely on Ser5, Pro6, Ser7, or Thr4, whereas Ser5 phosphorylation does not depend on Ser2, Thr4, or Ser7. The fact that four of the five phosphoacceptor coding letters of the CTD heptad are not essential in fission yeast raises im- portant questions as to whether and how these phosphate marks impact gene expression, the extreme situations being that ab- sence of a particular CTD-PO 4 mark has little or no effect or that loss of a coding cue does exert significant effects, albeit on the expression of genes that are not essential under the laboratory Significance The carboxyl-terminal domain (CTD) code encrypted within the YSPTSPS heptad repeats of RNA polymerase II is deeply rooted in eukaryal biology. This paper exploits fission yeast CTD mutants in which single coding cues (or combinations of cues) are subtracted from all consensus heptads to gauge the roles of the Tyr1, Ser2, Thr4, and Ser7 phosphoacceptors in gene ex- pression. Transcriptome profiling revealed distinctive signatures for the CTD phosphoacceptors that were verified by cell-based activity assays. The results highlight (i ) the role of Tyr1 and Ser2 in repressing the iron uptake regulon and (ii ) the distinctive roles of Thr4 and Ser7 in the phosphate starvation response, whereby Thr4 facilitates and Ser7 represses the induction of Pho1 acid phosphatase. Author contributions: B.S., D.A.B., J.B., and S.S. designed research; B.S., D.A.B., A.M.S., and S.S. performed research; B.S., D.A.B., A.M.S., J.B., and S.S. analyzed data; and B.S., D.A.B., and S.S. wrote the paper. The authors declare no conflict of interest. This article is a PNAS Direct Submission. Freely available online through the PNAS open access option. Data deposition: The data reported in this paper have been deposited in the Gene Ex- pression Omnibus (GEO) database, www.ncbi.nlm.nih.gov/geo (accession no. GSE52370). 1 To whom correspondence may be addressed. E-mail: [email protected] or [email protected]. This article contains supporting information online at www.pnas.org/lookup/suppl/doi:10. 1073/pnas.1321842111/-/DCSupplemental. www.pnas.org/cgi/doi/10.1073/pnas.1321842111 PNAS | March 18, 2014 | vol. 111 | no. 11 | 4185–4190 GENETICS Downloaded by guest on February 9, 2022
Transcript
Individual letters of the RNA polymerase II CTD codegovern distinct gene expression programs infission yeastBeate Schwera,1, Danny Asher Bittonb, Ana M. Sancheza, Jürg Bählerb, and Stewart Shumanc,1
aDepartment of Microbiology and Immunology, Weill Cornell Medical College, New York, NY 10065; bDepartment of Genetics, Evolution and Environmentand UCL Cancer Institute, University College London, London WC1E 6BT, United Kingdom; and cMolecular Biology Program, Sloan–Kettering Institute,New York, NY 10065
Edited by Fred M. Winston, Harvard Medical School, Boston, MA, and approved February 7, 2014 (received for review November 21, 2013)
The primary structure and phosphorylation pattern of the tandemY1S2P3T4S5P6S7 repeats of the RNA polymerase II carboxyl-terminaldomain (CTD) comprise an informational code that coordinatestranscription, chromatin modification, and RNA processing. Togauge the contributions of individual CTD coding “letters” to geneexpression, we analyzed the poly(A)+ transcriptomes of fissionyeast mutants that lack each of the four inessential CTD phos-phoacceptors: Tyr1, Ser2, Thr4, and Ser7. There was a hierarchyof CTD mutational effects with respect to the number of dysregu-lated protein-coding RNAs, with S2A (n = 227) >> Y1F (n = 71) >S7A (n = 58) >> T4A (n = 7). The majority of the protein-codingRNAs affected in Y1F cells were coordinately affected by S2A,suggesting that Tyr1-Ser2 constitutes a two-letter code “word.”Y1F and S2A elicited increased expression of genes encoding pro-teins involved in iron uptake (Frp1, Fip1, Fio1, Str3, Str1, Sib1),without affecting the expression of the genes that repress the ironregulon, implying that Tyr1-Ser2 transduces a repressive signal.Y1F and S2A cells had increased levels of ferric reductase activityand were hypersensitive to phleomycin, indicative of elevated intra-cellular iron. The T4A and S7Amutations had opposing effects on thephosphate response pathway. T4A reduced the expression of twogenes encoding proteins involved in phosphate acquisition (the Pho1acid phosphatase and the phosphate transporter SPBC8E4.01c), with-out affecting the expression of known genes that regulate the phos-phate response pathway, whereas S7A increased pho1+ expression.These results highlight specific cellular gene expression programsthat are responsive to distinct CTD cues.
iron homeostasis | phosphate homeostasis | transcription profiling
The carboxyl-terminal domain (CTD) of the Rpb1 subunit ofRNA polymerase II (Pol II) consists of tandemly repeated
heptapeptides of consensus sequence Y1S2P3T4S5P6S7. The in-herently plastic CTD structure is modulated by phosphorylationof the Tyr1, Ser2, Thr4, Ser5, and Ser7 residues and by cis–transisomerization of the prolines (1, 2). With as many as 128n po-tential CTD primary structures (where n is the number of hep-tads), the CTD provides information about the state of thetranscription machinery—a CTD code—that is “read” by CTDreceptor proteins that control transcription, modify chromatinstructure, and catalyze or regulate mRNA capping, splicing, andpolyadenylation (1, 2).Basic informational rules that govern the CTD code have been
elucidated by genetically manipulating the composition and struc-ture of the Rpb1 CTD in the fission yeast Schizosaccharomycespombe (3–7). By introducing alanines and conservative mutationsin lieu of Tyr1, Ser2, Pro3, Thr4, Ser5, Pro6, and Ser7 of everyconsensus heptad of a fully functional Rpb1 CTD array (com-prising 14 consensus heptad repeats linked to the body of Rpb1 bya “rump” consisting of four degenerate heptads), we determinedthat: (i) Tyr1, Pro3, Ser5, and Pro6 are essential for viability, by thecriterion that alanine substitution is lethal, whereas Ser2, Thr4,and Ser7 are not essential; and (ii) Y1F, S2A•S7A and T4A•S7A
mutants are viable, signifying that phenylalanine is functional inlieu of Tyr1 and that Ser5 is the only strictly essential phos-phorylation site in fission yeast (6).Further interrogation of the grammar and punctuation of
the CTD code established that: (i) all essential coding lettersand “words” are encompassed within a diheptad repeat; (ii)the minimal fission yeast CTD coding unit is a decapeptideY1S2P3T4S5P6S7Y1S2P3 and the spacing between coding units isflexible; (iii) Tyr1 must be present in consecutive heptads andproper spacing between consecutive tyrosines is important forCTD function; (iv) Pro3, Ser5, and Pro6 need not be present inadjacent heptads; and (v) Ser5(P)-Pro6 comprises an essentialtwo-letter code word that is read chiefly by the mRNA cappingapparatus (7). Querying how perturbations of CTD primary struc-ture affect CTD serine phosphorylation patterns in vivo, as gaugedby Rpb1 reactivity with phosphospecific antibodies, showed thatSer2 phosphorylation does not rely on Ser5, Pro6, Ser7, or Thr4,whereas Ser5 phosphorylation does not depend on Ser2, Thr4,or Ser7.The fact that four of the five phosphoacceptor coding letters
of the CTD heptad are not essential in fission yeast raises im-portant questions as to whether and how these phosphate marksimpact gene expression, the extreme situations being that ab-sence of a particular CTD-PO4 mark has little or no effect or thatloss of a coding cue does exert significant effects, albeit on theexpression of genes that are not essential under the laboratory
Significance
The carboxyl-terminal domain (CTD) code encrypted within theYSPTSPS heptad repeats of RNA polymerase II is deeply rootedin eukaryal biology. This paper exploits fission yeast CTDmutants in which single coding cues (or combinations of cues)are subtracted from all consensus heptads to gauge the roles ofthe Tyr1, Ser2, Thr4, and Ser7 phosphoacceptors in gene ex-pression. Transcriptome profiling revealed distinctive signaturesfor the CTD phosphoacceptors that were verified by cell-basedactivity assays. The results highlight (i) the role of Tyr1 and Ser2in repressing the iron uptake regulon and (ii) the distinctive rolesof Thr4 and Ser7 in the phosphate starvation response, wherebyThr4 facilitates and Ser7 represses the induction of Pho1 acidphosphatase.
Author contributions: B.S., D.A.B., J.B., and S.S. designed research; B.S., D.A.B., A.M.S., andS.S. performed research; B.S., D.A.B., A.M.S., J.B., and S.S. analyzed data; and B.S., D.A.B.,and S.S. wrote the paper.
The authors declare no conflict of interest.
This article is a PNAS Direct Submission.
Freely available online through the PNAS open access option.
Data deposition: The data reported in this paper have been deposited in the Gene Ex-pression Omnibus (GEO) database, www.ncbi.nlm.nih.gov/geo (accession no. GSE52370).1To whom correspondence may be addressed. E-mail: [email protected][email protected].
This article contains supporting information online at www.pnas.org/lookup/suppl/doi:10.1073/pnas.1321842111/-/DCSupplemental.
conditions surveyed. The latter scenario applies to the Ser2 codingletter, insofar as a heterothallic haploid fission yeast rpb1-S2Amutant can grow vegetatively, but is unable to mate with het-erothallic WT cells of either mating type, i.e., S2A is sterile.Sterility results from the inability of S2A cells to induce expres-sion of the Ste11 transcription factor that triggers the meioticsexual differentiation pathway (5, 6, 8). Microarray analyses ofthe transcriptome of S2A cells vs. WT highlighted ≥1.5-foldchanges in the expression level of many meiotically regulatedgenes (5, 9). The Ser2 requirement for transcription during sexualdifferentiation was bypassed by subtracting Ser7, suggesting thatimbalance in the phosphorylation array, not absence of a CTD-PO4cue, underlies a CTD-associated pathology (6).In the present study, we apply high-throughput RNA sequenc-
ing methods (RNA-seq) to gauge globally the impact of the loss ofeach of the four inessential CTD phosphoacceptors on gene ex-pression. By comparing the poly(A)+ transcriptomes of four fis-sion yeast mutants, rpb1-Y1F, -S2A, -T4A, and -S7A, we illuminatehow individual letters of the Pol II CTD code affect the expressionof distinct sets of genes. Validation of selected transcriptionalprograms by functional tests identified Tyr1 and Ser2 as a two-letter coding word that governs an iron-uptake regulon (10) andThr4 and Ser7 as components of the phosphate response pathwaythat regulates Pho1 expression.
ResultsRNA-Seq Analysis of rpb1-CTDMutants.RNA-seq affords a detailedstrand-specific annotated map of the protein-coding and non-coding fission yeast transcripts vs. their genomic DNA loci (11–13). Here we performed RNA-seq on poly(A)+ RNA isolatedfrom cells expressing Rpb1 with CTDs composed of the rumpplus 14 consensus YSPTSPS heptads or an identical number ofY1F, S2A, T4A, or S7A mutant heptads (6). We also analyzedCTD double mutants Y1F•S7A, S2A•S7A, and T4A•S7A. cDNAsobtained from two nonsimultaneous biological replicates (usingRNA from cells grown to midlog phase at 30 °C) were sequencedfor each strain. In all of the datasets, ∼90% of the reads weremapped to unique genomic loci (Fig. S1), and expression levelswere highly reproducible between biological replicates (Fig. S2).As an internal control, we queried the cDNA sequences encodingthe Rpb1 CTD itself and found that between 99.7% and 100% ofthe CTD mRNA reads were correct with respect to the WT orrelevant mutant CTD, with the rare exceptions corresponding toother CTD variants that were bar-coded in the pooled sequencerun (Fig. S1). A cutoff of plus or minus twofold change in nor-malized transcript read level and a corrected P value of <0.05were the criteria applied to derive lists of differentially expressedannotated loci for each rpb1-CTD single-mutant vs. the WTCTD strain.The results are presented as heat maps for the ensemble of sig-
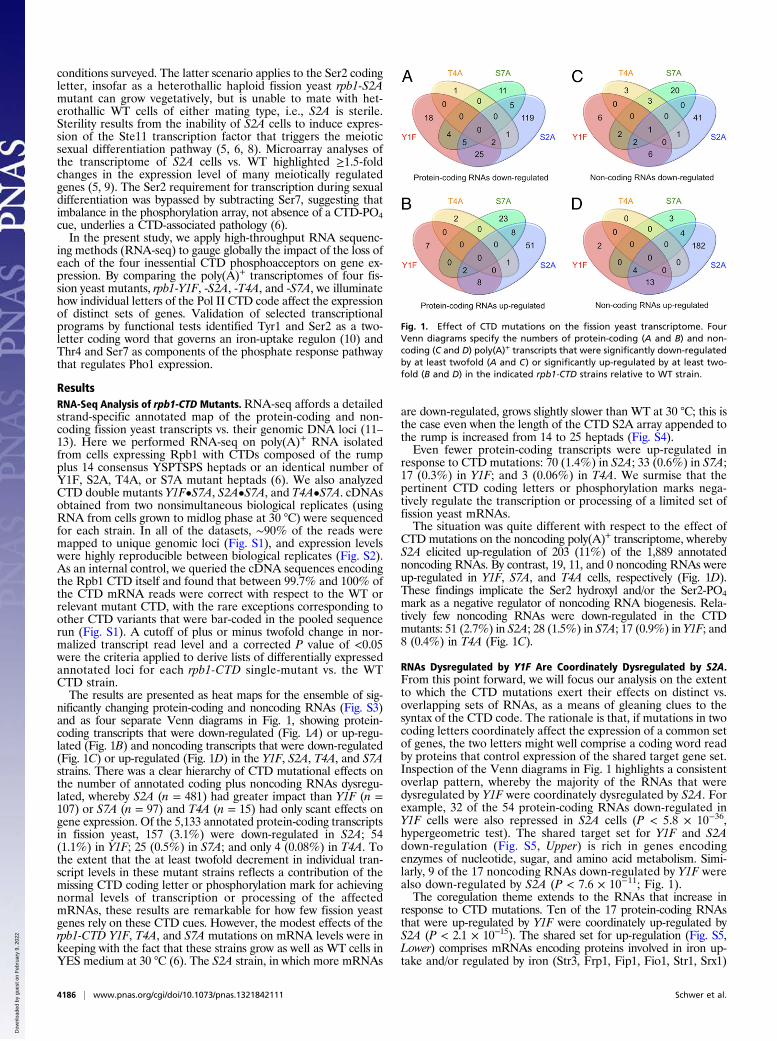
nificantly changing protein-coding and noncoding RNAs (Fig. S3)and as four separate Venn diagrams in Fig. 1, showing protein-coding transcripts that were down-regulated (Fig. 1A) or up-regu-lated (Fig. 1B) and noncoding transcripts that were down-regulated(Fig. 1C) or up-regulated (Fig. 1D) in the Y1F, S2A, T4A, and S7Astrains. There was a clear hierarchy of CTD mutational effects onthe number of annotated coding plus noncoding RNAs dysregu-lated, whereby S2A (n = 481) had greater impact than Y1F (n =107) or S7A (n = 97) and T4A (n = 15) had only scant effects ongene expression. Of the 5,133 annotated protein-coding transcriptsin fission yeast, 157 (3.1%) were down-regulated in S2A; 54(1.1%) in Y1F; 25 (0.5%) in S7A; and only 4 (0.08%) in T4A. Tothe extent that the at least twofold decrement in individual tran-script levels in these mutant strains reflects a contribution of themissing CTD coding letter or phosphorylation mark for achievingnormal levels of transcription or processing of the affectedmRNAs, these results are remarkable for how few fission yeastgenes rely on these CTD cues. However, the modest effects of therpb1-CTD Y1F, T4A, and S7A mutations on mRNA levels were inkeeping with the fact that these strains grow as well as WT cells inYES medium at 30 °C (6). The S2A strain, in which more mRNAs
are down-regulated, grows slightly slower than WT at 30 °C; this isthe case even when the length of the CTD S2A array appended tothe rump is increased from 14 to 25 heptads (Fig. S4).Even fewer protein-coding transcripts were up-regulated in
response to CTD mutations: 70 (1.4%) in S2A; 33 (0.6%) in S7A;17 (0.3%) in Y1F; and 3 (0.06%) in T4A. We surmise that thepertinent CTD coding letters or phosphorylation marks nega-tively regulate the transcription or processing of a limited set offission yeast mRNAs.The situation was quite different with respect to the effect of
CTD mutations on the noncoding poly(A)+ transcriptome, wherebyS2A elicited up-regulation of 203 (11%) of the 1,889 annotatednoncoding RNAs. By contrast, 19, 11, and 0 noncoding RNAs wereup-regulated in Y1F, S7A, and T4A cells, respectively (Fig. 1D).These findings implicate the Ser2 hydroxyl and/or the Ser2-PO4mark as a negative regulator of noncoding RNA biogenesis. Rela-tively few noncoding RNAs were down-regulated in the CTDmutants: 51 (2.7%) in S2A; 28 (1.5%) in S7A; 17 (0.9%) in Y1F; and8 (0.4%) in T4A (Fig. 1C).
RNAs Dysregulated by Y1F Are Coordinately Dysregulated by S2A.From this point forward, we will focus our analysis on the extentto which the CTD mutations exert their effects on distinct vs.overlapping sets of RNAs, as a means of gleaning clues to thesyntax of the CTD code. The rationale is that, if mutations in twocoding letters coordinately affect the expression of a common setof genes, the two letters might well comprise a coding word readby proteins that control expression of the shared target gene set.Inspection of the Venn diagrams in Fig. 1 highlights a consistentoverlap pattern, whereby the majority of the RNAs that weredysregulated by Y1F were coordinately dysregulated by S2A. Forexample, 32 of the 54 protein-coding RNAs down-regulated inY1F cells were also repressed in S2A cells (P < 5.8 × 10−36,hypergeometric test). The shared target set for Y1F and S2Adown-regulation (Fig. S5, Upper) is rich in genes encodingenzymes of nucleotide, sugar, and amino acid metabolism. Simi-larly, 9 of the 17 noncoding RNAs down-regulated by Y1F werealso down-regulated by S2A (P < 7.6 × 10⁻¹¹; Fig. 1).The coregulation theme extends to the RNAs that increase in
response to CTD mutations. Ten of the 17 protein-coding RNAsthat were up-regulated by Y1F were coordinately up-regulated byS2A (P < 2.1 × 10⁻¹⁵). The shared set for up-regulation (Fig. S5,Lower) comprises mRNAs encoding proteins involved in iron up-take and/or regulated by iron (Str3, Frp1, Fip1, Fio1, Str1, Srx1)
Fig. 1. Effect of CTD mutations on the fission yeast transcriptome. FourVenn diagrams specify the numbers of protein-coding (A and B) and non-coding (C and D) poly(A)+ transcripts that were significantly down-regulatedby at least twofold (A and C) or significantly up-regulated by at least two-fold (B and D) in the indicated rpb1-CTD strains relative to WT strain.
4186 | www.pnas.org/cgi/doi/10.1073/pnas.1321842111 Schwer et al.
and proteins induced during meiosis (Ppk31, Mde5, Mug136,Meu14). Seventeen of the 19 noncoding RNAs up-regulated byY1F were also up-regulated by S2A (P < 3.1 × 10⁻¹⁷). No com-parable extent of overlap was evident for any other pair of CTDmutants. These results suggest that Tyr1 and Ser2 are a two-letter CTD coding word that governs the expression of a discretesubset of fission yeast genes.
Tyr1 and Ser2 Transduce Repression of an Iron Uptake Regulon. Fis-sion yeast has a finely tuned system of iron homeostasis entailingregulated expression of genes encoding proteins involved in ironuptake (10). Key players are the cell surface ferric reductaseFrp1 that converts extracellular ferric ion to ferrous ion, which isthen transported across the cell membrane by the oxidase–per-mease complex composed of Fio1 and Fip1 proteins. A parallelpathway of iron acquisition entails the action of a ferrochromesiderophore, synthesized by Sib1 and Sib2, and cell surfacesiderophore transporters Str1, Str2, and Str3. The mRNAs en-coding Frp1, Fio1, Fip1, Str1, and Str3 were all up-regulated inthe Y1F strain versus the isogenic WT strain, by 16-fold, 15-fold,14-fold, 10-fold, and 98-fold, respectively (Fig. 2). These fiveRNAs were also up-regulated in S2A cells, as was the RNA en-coding Sib1. Moreover, the mRNAs encoding Frp1, Fip1, Fio1,Str3, and Str1 were up-regulated in the CTD double-mutantsY1F•S7A and S2A•S7A (Fig. 2), fortifying the inference that CTDcoding letters Tyr1 and Ser2 act to down-regulate iron uptakegenes. The RNA-seq results were verified by reverse transcriptase(RT)-qPCR analyses, which showed that the levels of mRNAsencoding Fio1, Fip1, and Frp1 were up-regulated in the Y1F, S2A,Y1F•S7A, and S2A•S7A mutants, but not in the S7A mutant (Fig.S6 A–C).The GATA-family transcription factor Fep1 represses expres-
sion of the aforementioned iron uptake genes under iron-repletegrowth conditions (10, 14). Fep1 binds in an iron-dependentmanner to a GATA sequence element [5′-ATC(A/T)GATA(A/T)]
in the regulatory regions upstream of the repressible iron uptakegenes. Additional iron/Fep1-regulated genes identified by expressionprofiling with DNA microarrays include those encoding sulfir-edoxin Srx1, Fe–S cluster assembly protein Isu1, and heme uti-lization protein Shu1 (15). The Srx1 mRNA was up-regulated inY1F, S2A, Y1F•S7A, and S2A•S7A cells (Fig. 2). The Shu1 andIsu1 transcripts were up-regulated in Y1F•S7A and S2A•S7Acells (Fig. 2). (They were also up-regulated in Y1F cells, albeitnot at the P value cutoff of 0.05). Thus, the loss of the Tyr1 andSer2 CTD cues specifically derepresses the regulon governedby Fep1.A trivial explanation for this derepression would be that Y1F
and S2A down-regulate the expression of the proteins that re-press the iron regulon. These include, in addition to Fep1, thecorepressors Tup11 and Tup12 (10, 14). However, this scenariowas vitiated by the findings that the Fep1, Tup11, and Tup12mRNA levels, gauged by RNA-seq, were not affected signifi-cantly by the Y1F, S2A, Y1F•S7A, or S2A•S7A mutations (Fig.2). RT-qPCR analysis verified that the level of mRNA encodingthe transcriptional repressor Fep1 was unaffected by these CTDmutations (Fig. S6D). Another possibility would be that Y1F andS2A prompt overexpression of a factor that derepresses the ironregulon, e.g., by negatively regulating Fep1. Grx4 is implicated asa negative regulator of Fep1 (10), but Grx4 expression was notaffected significantly in Y1F, S2A, Y1F•S7A, or S2A•S7A cells(Fig. 2). Therefore, we infer that the CTD Tyr1-Ser2 codingword is needed to transduce a repressive signal from Fep1 to thetranscription apparatus.
Y1F and S2A Affect Iron Homeostasis. If the derepression of the ironregulon at the mRNA level is physiologically important, wewould expect to see increased activity of Fep1 regulated proteinsin cells bearing the Y1F and S2A CTD mutations. We assayedferric reductase Frp1 activity by overlaying cells grown on iron-replete medium with agar containing the ferric reductase sub-strate triphenyltetrazolium chloride, which is reduced by cellsurface-associated Frp1 to yield a red pigmented product (14).This assay distinguished the pale WT, S7A, and T4A coloniesfrom the red Y1F, Y1F•S7A, and S2A•S7A colonies (Fig. 3,Right). The S2A strain grew more slowly under these conditions,and hence there were fewer cells on the plate, but it was stillapparent that the S2A cells generated red pigment. Thus, theeffect of CTD mutations on the activity of the Frp1 enzyme invivo correlated with the mRNA levels gauged by RNA-seq.We surveyed the effects of the CTD mutations on the sensi-
tivity of fission yeast to phleomycin, a glycopeptide antibioticthat cleaves the phosphodiester backbone of nucleic acids in thepresence of iron and oxygen. Derepression of the Fep1-regulatediron uptake regulon causes hypersensitivity to phleomycin tox-icity (14) by virtue of increasing the available intracellular iron.The salient findings were that Y1F, S2A, Y1F•S7A, and S2A•S7Astrains failed to grow in the presence of 10 μg/mL phleomycin,a concentration of drug that did not prevent growth of the WT,S7A, and T4A strains (Fig. 3, Left). We conclude from theseexperiments that CTD Tyr1 and Ser2 are critical informationalcues for proper iron homeostasis in fission yeast.
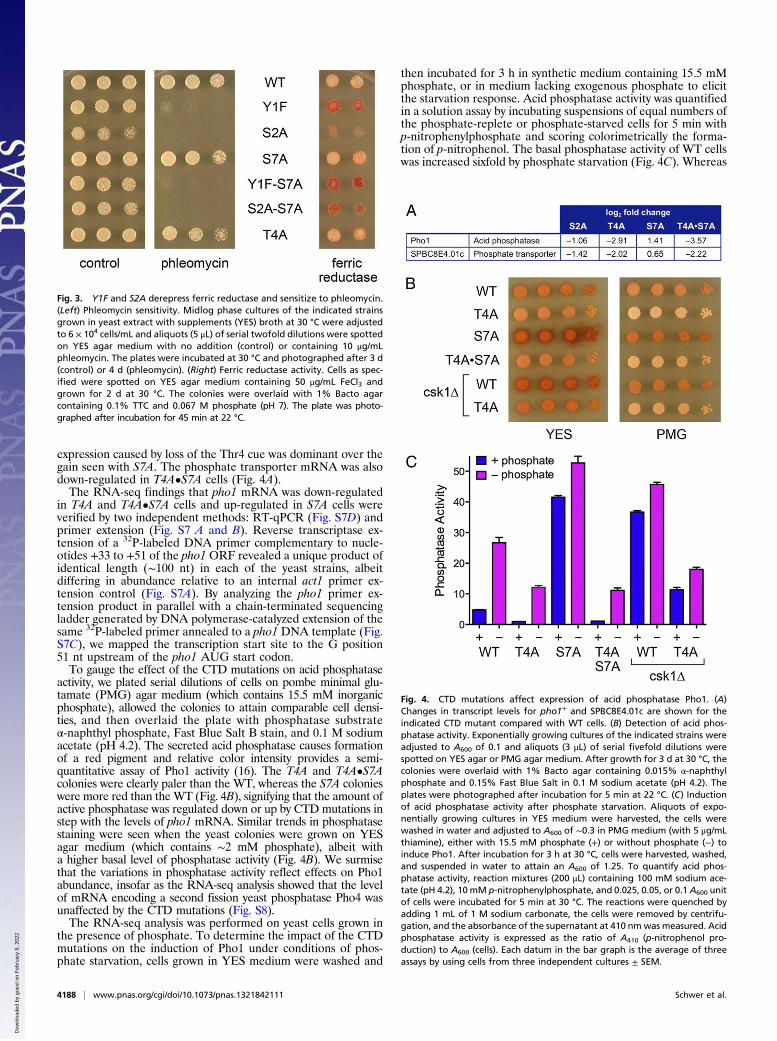
Thr4 and Ser7 Govern Expression of Acid Phosphatase Pho1 and Pho1Induction by Phosphate Starvation. Although the T4A CTD mu-tation resulted in decreased expression of merely four mRNAs,two of them encode proteins involved in phosphate homeostasis:the secreted acid phosphatase Pho1 and the inorganic phosphatetransporter SPBC8E4.01c. The fission yeast phosphate trans-porter and Pho1 are encoded by adjacent cooriented genes onchromosome II. The Pho1 and phosphate transporter mRNAswere down-regulated by 7.5-fold and fourfold, respectively, inT4A cells and by twofold and 2.7-fold, respectively, in the S2Amutant (Fig. 4A). By contrast, Pho1 was up-regulated twofold inresponse to the S7A mutation (Fig. 4A). An instructive findingwas that Pho1 was down-regulated 12-fold in the T4A•S7Adouble mutant (Fig. 4A), signifying that the decrement in
Fig. 2. CTD mutations Y1F and S2A derepress an iron uptake regulon. Theexpression levels (reads per kilobase per million reads; RPKM) of genes in-volved in iron uptake and utilization are shown for the biological replicatesof each of the strains specified. The log2 fold changes vs. WT are denotedbelow the expression levels. Values meeting the dual cutoff criteria of atleast twofold change and P < 0.05 are highlighted in brackets in plain font.Values of at least twofold change with P > 0.05 are italicized and in brackets.Other log2 fold change values not meeting either criterion are in plain font.The genes derepressed by CTD mutations are listed above the spacer rowshaded gray. The transcriptional regulatory genes that repress the ironregulon are listed below the spacer row.
Schwer et al. PNAS | March 18, 2014 | vol. 111 | no. 11 | 4187
expression caused by loss of the Thr4 cue was dominant over thegain seen with S7A. The phosphate transporter mRNA was alsodown-regulated in T4A•S7A cells (Fig. 4A).The RNA-seq findings that pho1 mRNA was down-regulated
in T4A and T4A•S7A cells and up-regulated in S7A cells wereverified by two independent methods: RT-qPCR (Fig. S7D) andprimer extension (Fig. S7 A and B). Reverse transcriptase ex-tension of a 32P-labeled DNA primer complementary to nucle-otides +33 to +51 of the pho1 ORF revealed a unique product ofidentical length (∼100 nt) in each of the yeast strains, albeitdiffering in abundance relative to an internal act1 primer ex-tension control (Fig. S7A). By analyzing the pho1 primer ex-tension product in parallel with a chain-terminated sequencingladder generated by DNA polymerase-catalyzed extension of thesame 32P-labeled primer annealed to a pho1 DNA template (Fig.S7C), we mapped the transcription start site to the G position51 nt upstream of the pho1 AUG start codon.To gauge the effect of the CTD mutations on acid phosphatase
activity, we plated serial dilutions of cells on pombe minimal glu-tamate (PMG) agar medium (which contains 15.5 mM inorganicphosphate), allowed the colonies to attain comparable cell densi-ties, and then overlaid the plate with phosphatase substrateα-naphthyl phosphate, Fast Blue Salt B stain, and 0.1 M sodiumacetate (pH 4.2). The secreted acid phosphatase causes formationof a red pigment and relative color intensity provides a semi-quantitative assay of Pho1 activity (16). The T4A and T4A•S7Acolonies were clearly paler than the WT, whereas the S7A colonieswere more red than theWT (Fig. 4B), signifying that the amount ofactive phosphatase was regulated down or up by CTD mutations instep with the levels of pho1 mRNA. Similar trends in phosphatasestaining were seen when the yeast colonies were grown on YESagar medium (which contains ∼2 mM phosphate), albeit witha higher basal level of phosphatase activity (Fig. 4B). We surmisethat the variations in phosphatase activity reflect effects on Pho1abundance, insofar as the RNA-seq analysis showed that the levelof mRNA encoding a second fission yeast phosphatase Pho4 wasunaffected by the CTD mutations (Fig. S8).The RNA-seq analysis was performed on yeast cells grown in
the presence of phosphate. To determine the impact of the CTDmutations on the induction of Pho1 under conditions of phos-phate starvation, cells grown in YES medium were washed and
then incubated for 3 h in synthetic medium containing 15.5 mMphosphate, or in medium lacking exogenous phosphate to elicitthe starvation response. Acid phosphatase activity was quantifiedin a solution assay by incubating suspensions of equal numbers ofthe phosphate-replete or phosphate-starved cells for 5 min withp-nitrophenylphosphate and scoring colorimetrically the forma-tion of p-nitrophenol. The basal phosphatase activity of WT cellswas increased sixfold by phosphate starvation (Fig. 4C). Whereas
Fig. 3. Y1F and S2A derepress ferric reductase and sensitize to phleomycin.(Left) Phleomycin sensitivity. Midlog phase cultures of the indicated strainsgrown in yeast extract with supplements (YES) broth at 30 °C were adjustedto 6 × 10⁴ cells/mL and aliquots (5 μL) of serial twofold dilutions were spottedon YES agar medium with no addition (control) or containing 10 μg/mLphleomycin. The plates were incubated at 30 °C and photographed after 3 d(control) or 4 d (phleomycin). (Right) Ferric reductase activity. Cells as spec-ified were spotted on YES agar medium containing 50 μg/mL FeCl3 andgrown for 2 d at 30 °C. The colonies were overlaid with 1% Bacto agarcontaining 0.1% TTC and 0.067 M phosphate (pH 7). The plate was photo-graphed after incubation for 45 min at 22 °C.
Fig. 4. CTD mutations affect expression of acid phosphatase Pho1. (A)Changes in transcript levels for pho1+ and SPBC8E4.01c are shown for theindicated CTD mutant compared with WT cells. (B) Detection of acid phos-phatase activity. Exponentially growing cultures of the indicated strains wereadjusted to A600 of 0.1 and aliquots (3 μL) of serial fivefold dilutions werespotted on YES agar or PMG agar medium. After growth for 3 d at 30 °C, thecolonies were overlaid with 1% Bacto agar containing 0.015% α-naphthylphosphate and 0.15% Fast Blue Salt in 0.1 M sodium acetate (pH 4.2). Theplates were photographed after incubation for 5 min at 22 °C. (C) Inductionof acid phosphatase activity after phosphate starvation. Aliquots of expo-nentially growing cultures in YES medium were harvested, the cells werewashed in water and adjusted to A600 of ∼0.3 in PMG medium (with 5 μg/mLthiamine), either with 15.5 mM phosphate (+) or without phosphate (−) toinduce Pho1. After incubation for 3 h at 30 °C, cells were harvested, washed,and suspended in water to attain an A600 of 1.25. To quantify acid phos-phatase activity, reaction mixtures (200 μL) containing 100 mM sodium ace-tate (pH 4.2), 10 mM p-nitrophenylphosphate, and 0.025, 0.05, or 0.1 A600 unitof cells were incubated for 5 min at 30 °C. The reactions were quenched byadding 1 mL of 1 M sodium carbonate, the cells were removed by centrifu-gation, and the absorbance of the supernatant at 410 nmwas measured. Acidphosphatase activity is expressed as the ratio of A410 (p-nitrophenol pro-duction) to A600 (cells). Each datum in the bar graph is the average of threeassays by using cells from three independent cultures ± SEM.
4188 | www.pnas.org/cgi/doi/10.1073/pnas.1321842111 Schwer et al.
the basal phosphatase activity of T4A cells was fivefold lowerthan WT, the basal activity of S7A cells was ninefold higher thanWT. T4A cells responded to phosphate starvation, but the levelof induced phosphatase activity was only half that of WT cells.The constitutively high level of phosphatase activity in S7A cellswas increased further during phosphate starvation, to a leveltwofold higher than in starved WT cells (Fig. 4C). The super-induction of Pho1 activity by S7A was effaced completely in theT4A•S7A strain, which displayed the same diminished basal andinduced phosphatase activities seen in the T4A single mutant(Fig. 4C). We conclude that the Thr4 mark normally exerts apositive influence on the phosphate response, whereas the Ser7mark exerts a strong repressive effect.Pho1 and phosphate transporter expression are induced in
response to phosphate starvation via the action of the Zn-fingertranscription factor Pho7 (17, 18). The protein kinase Csk1 isa negative regulator of Pho1 and phosphate transporter expres-sion, insofar as both are constitutively induced in csk1Δ cells. Thefact that constitutive expression of Pho1 is abolished in a csk1Δpho7Δ double mutant implies that Pho7 is essential for Pho1transcription and acts downstream of Csk1 (17, 18). The RNA-seq data indicate that the decrements in Pho1 and phosphatetransporter expression in T4A and T4A•S7A cells are not aconsequence of decreased expression of the positive regulatorPho7 or increased expression of the negative regulator Csk1,because pho1 and csk1 mRNA levels were not affected signifi-cantly by the CTD mutations (Fig. S8).The in vivo chromogenic colony assay indicated that csk1Δ
cells with a WT CTD elaborated increased phosphatase activitycompared with csk1+ cells (Fig. 4B). Quantitative assay of acidphosphatase showed that basal of csk1Δ cells was eightfoldhigher than csk1+ cells (Fig. 4C). The increase in basal Pho1activity was attenuated in a csk1Δ T4A strain, as was the induc-tion by phosphate starvation (Fig. 4C), suggesting that Csk1 actsupstream of the CTD in modulating the phosphate response.It is worth noting that the T4A and T4A•S7A mutations did
not significantly affect expression of the SPBC1271.09 gene thatencodes a glycerophosphodiester transporter (Fig. S8), eventhough SPBC1271.09 is part of the phosphate response and co-ordinately regulated with Pho1 and the phosphate transporter byPho7 and Csk1 (19). On the contrary, SPBC1271.09 was up-regulated along with Pho1 by the S7A mutation (Fig. S8). Thesefindings highlight the selective impact of T4A and T4A•S7A onexpression of the tandemly arranged phosphate transporter andacid phosphatase genes.
S7A Up-Regulates the Expression of Many Meiotic Genes. The S7ACTD mutation resulted in the up-regulation of 33 protein-codingmRNAs; 16 of these transcripts encode proteins with known rolesin fission yeast meiosis or are RNAs known to be up-regulatedduring meiosis (Fig. S9), accounting for their naming as meiosisup-regulated genes (Mug) or Mei4-dependent (Mde) genes (20–22). Mei4 is a meiosis-specific forkhead transcription factor thatup-regulates the expression of multiple meiotic genes, eitherduring sexual differentiation and sporulation or when Mei4 isectopically expressed in vegetative cells (20–22); these includethe genes encoding Spo6, Spn5, Spn6, Mfr1, Ght5, Mde3, Mde7,Mde1, Mei2, Mug130, Mug136, Mug147, and SPBC725.10 thatwere up-regulated in vegetative S7A cells. Becausemei4 was itselfup-regulated by S7A, it is likely that Mei4 drives the observed up-regulation of several of its target genes in S7A cells. Our resultsimplicate the CTD Ser7 mark as a negative influence on the ex-pression of Mei4 and other meiotic genes.The up-regulation elicited by S7A was largely effaced in the
Y1F•S7A and T4A•S7A double mutants (Venn diagrams in Fig.S10). Whereas the majority of mRNAs up-regulated in Y1F cellsremained up-regulated in Y1F•S7A cells (11 of 17), this was notthe case for the set of mRNAs up-regulated by S7A, of which only 6of 33 were up-regulated in Y1F•S7A cells. Similarly, 2 of 3 mRNAsup-regulated by T4A remained up-regulated in T4A•S7A cells, butonly 8 of 33 mRNAs up-regulated by S7A were up-regulated in
T4A•S7A cells (Fig. S10). With respect to the 16 meiotic genesup-regulated by S7A, 11 and 12 were not up-regulated in theY1F•S7A and T4A•S7A mutants, respectively. These findingssuggest that the biological output of a CTD coding letter may becontingent on the state of neighboring coding cues. This point isunderscored by the observations that the Y1F•S7A and T4A•S7Adouble mutations elicited up-regulation of distinctive sets of codingmRNAs that were not up-regulated by the component singlemutations (Fig. S10).
DiscussionThe CTD code is deeply rooted in eukaryal biology, yet its com-plexity and output can vary among taxa. The trend, albeit over-simplified, is that the number of heptad repeats comprising theCTD, the minimal number of repeats required for viability, andthe prevalence of nonconsensus coding letters increases as onemoves up the evolutionary ladder from unicellular to multicel-lular eukarya, as a means to accommodate and orchestrate theactions of increasing numbers of CTD receptors that regulategene expression (1, 2). It is reasonable to posit a core CTD codethat governs events common to most eukarya; for example, theessential function of the Ser5-PO4–Pro6 coding word in re-cruiting mRNA capping enzymes to the Pol II elongation com-plex, which is conserved in budding yeast, fission yeast, andmammals, notwithstanding major differences in genetic andphysical organization of the capping apparatus in these taxa (6, 7,19, 23, 24). The code is plastic (by virtue of the 128 potentialstructures each heptad can adopt), and can easily expand its func-tional capacity as new receptors emerge to read the code letters andwords. Accordingly, the necessity for specific CTD cues and theirimpact on cellular gene expression may differ among taxa. TheSer2, Thr4, Ser7, and Tyr1 hydroxyl groups are inessential forvegetative growth of fission yeast (6). In metazoa, Ser2, Thr4,and Ser7 are critical for cell viability and/or specific steps oftranscription or RNA processing, e.g., because these coding cuesare recognized by components of the processing machinery,some of which are unique to metazoa (25–27).The homogeneous primary structure of the fission yeast CTD
and the availability of viable rpb1 mutants in which single codingcues (or combinations of cues) are subtracted from all the con-sensus heptads makes for an attractive experimental system tosurvey the roles of the Tyr1, Ser2, Thr4, and Ser7 phosphoac-ceptors in gene expression. As reported here, it was remarkablehow few mRNAs were significantly dysregulated at least twofoldby the CTD mutations S2A, Y1F, S7A, and T4A, which affectedonly 4.4%, 1.4%, 1.2%, and 0.14% of the annotated fission yeastprotein-coding RNAs, respectively. We note that the method ofRNA-seq analysis used here, whereby equal amounts of RNAfrom different fission yeast strains are subjected to high-throughputsequencing, assumes that the fission yeast strains analyzed producesimilar levels of RNA per cell; we cannot exclude the possibilitythat a CTD mutation might elicit a global increase or decrement inthe steady-state levels of all, or most, RNAs per yeast cell, an issuethat has been discussed in relation to gene expression analyses inmetazoan cells (28). Nonetheless, the analysis is highly instructivewith respect to the selective effect of CTD mutations.RNA-seq revealed distinctive gene expression signatures for the
CTD phosphoacceptors that were verified by cell-based activityassays. Two examples stand out. First, our studies highlight therole of Tyr1 and Ser2 in repressing the expression of multipleunlinked genes involved in iron uptake that comprise a Fep1-repressed regulon. Although the molecular details remain tobe elucidated, we speculate that Fep1 bound to DNA flankingthe target gene promoters might interact, through its C-terminalrepressor domain (10) or corepressors bound to the repressordomain, with the Pol II CTD to exert a gene-specific repressiveeffect on transcription (or cotranscriptional RNA processing) andthat this interaction depends on Tyr1 and Ser2.Second, we implicated Thr4 as an activator of the expres-
sion of two adjacent genes encoding proteins involved inphosphate homeostasis: a phosphate transporter and the acid
Schwer et al. PNAS | March 18, 2014 | vol. 111 | no. 11 | 4189
phosphatase Pho1. The CTD T4A mutation coordinately reducedpho1 RNA and Pho1 activity at the cell surface. T4A blunted theincrease in Pho1 activity that resulted from elimination of the re-pressive kinase Csk1, thereby placing Thr4 downstream ofCsk1, perhaps acting in tandem with the transcriptional acti-vator Pho7. However, the observation that an unlinked thirdPho7-responsive gene in the phosphate pathway was not down-regulated by T4A raises the prospect that a particular featureof the transporter-phosphatase locus dictates its reliance onthe Thr4 CTD cue. The CTD Ser7 residue was found to exerta negative effect on Pho1 expression, whereby S7A coor-dinately increased pho1 RNA and Pho1 activity; when S7Awas combined with T4A, the latter held sway and Pho1 wasdown-regulated.In conclusion, the marriage of CTD genetics and transcriptome
profiling provides unique insights to the output of the CTD code,especially by Tyr1, Thr4, and Ser7. That said, we cannot atpresent distinguish whether the narrow but specific gene ex-pression dyscrasias elicited by CTD mutations Y1F, T4A, andS7A reflect the lack of phosphorylation of Tyr1, Thr4, or Ser7or, rather, interference with phosphorylation-independent func-tions of the respective hydroxyl groups. Making this distinctionwill be contingent on identifying and genetically controlling theprotein kinases responsible for Tyr1, Thr4, and Ser7 phosphor-ylation in fission yeast, an area that is presently tabula rasa.
MethodsThe isogenic heterothallic S. pombe rpb1-CTD strains studied herein expressRpb1 variants in which 14 consensus YSPTSPS WT heptad repeats or 14heptad repeats with single amino acid substitutions (Y1F, S2A, T4A, S7A) ordouble substitutions (Y1F•S7A, S2A•S7A, T4A•S7A) in each of the heptads
are appended to amino acid 1577 of Rpb1 (6). The mating type, determinedby crossing with tester strains, is h− for all strains studied, except for the sterileS2A mutant, which is h+ (as determined by diagnostic PCR using mat1-P– andmat1-M–specific primers). RNA was isolated from yeast cells grown in liquidculture in YES medium at 30 °C to an A600 of 0.4–0.7. Cells were harvested bycentrifugation and total RNA was extracted by using the Qiagen RNeasy kit. Theintegrity and quantity of total RNA was gauged with an Agilent Technologies2100 Bioanalyzer. Poly(A)+ RNAwas purified from 1 μg of total RNA by using theIllumina TruSeq RNA sample preparation kit. A TruSeq stranded total RNAsample preparation kit was used for subsequent steps of poly(A)+ RNA frag-mentation, strand-specific cDNA synthesis, indexing, and amplification. Indexedlibraries were normalized and pooled (n = 8 samples per lane) for paired-endsequencing performed by using an Illumina HiSeq2000/1000 system. Paired-endreads of length 51 bases originating from each sample were aligned with Bowtie0.12.7 (29) to the S. pombe genome sequence (Ensembl S. pombe, Build EF1,version 13) as well as to its corresponding exon–exon junction database (only thesecond part of the paired-end reads was considered). As many as three mis-matches were allowed. Reads that matched multiple loci were removed fromfurther analysis, and the resulting alignment files were processed to generate“pile-ups” against each chromosome. Differential expression between sampleswas determined using the DESeq Bioconductor package (30). A cutoff of plus orminus twofold change and corrected P value <0.05 were applied to derive a listof differentially expressed RNAs. The data analysis reported here was limited tothe 7,022 annotated protein-coding and noncoding RNAs. Full details of theRNA-seq data processing and normalization of expression levels are provided inSI Methods.
ACKNOWLEDGMENTS. This research was supported by National Institutes ofHealth Grant GM52470 (to B.S. and S.S.) a Wellcome Trust Senior Investiga-tor Award (to D.A.B. and J.B.), and a Royal Society Research Merit Award(to J.B.).
1. Eick D, Geyer M (2013) The RNA polymerase II carboxy-terminal domain (CTD) code.Chem Rev 113(11):8456–8490.
2. Corden JL (2013) RNA polymerase II C-terminal domain: Tethering transcription totranscript and template. Chem Rev 113(11):8423–8455.
3. Karagiannis J, Balasubramanian MK (2007) A cyclin-dependent kinase that promotescytokinesis through modulating phosphorylation of the carboxy terminal domain ofthe RNA Pol II Rpb1p sub-unit. PLoS ONE 2(5):e433.
4. Schneider S, Pei Y, Shuman S, Schwer B (2010) Separable functions of the fission yeastSpt5 carboxyl-terminal domain (CTD) in capping enzyme binding and transcriptionelongation overlap with those of the RNA polymerase II CTD. Mol Cell Biol 30(10):2353–2364.
5. Coudreuse D, et al. (2010) A gene-specific requirement of RNA polymerase II CTDphosphorylation for sexual differentiation in S. pombe. Curr Biol 20(12):1053–1064.
6. Schwer B, Shuman S (2011) Deciphering the RNA polymerase II CTD code in fissionyeast. Mol Cell 43(2):311–318.
7. Schwer B, Sanchez AM, Shuman S (2012) Punctuation and syntax of the RNA poly-merase II CTD code in fission yeast. Proc Natl Acad Sci USA 109(44):18024–18029.
8. Sukegawa Y, Yamashita A, Yamamoto M (2011) The fission yeast stress-responsiveMAPK pathway promotes meiosis via the phosphorylation of Pol II CTD in response toenvironmental and feedback cues. PloS Genet 7(12):e1002387.
9. Saberianfar R, Cunningham-Dunlop S, Karagiannis J (2011) Global gene expressionanalysis of fission yeast mutants impaired in Ser-2 phosphorylation of the RNA pol IIcarboxy terminal domain. PloS ONE 6(9):e24694.
10. Labbé S, Khan MG, Jacques JF (2013) Iron uptake and regulation in Schizosacchar-omyces pombe. Curr Opin Microbiol 16(6):669–676.
11. Wilhelm BT, et al. (2008) Dynamic repertoire of a eukaryotic transcriptome surveyedat single-nucleotide resolution. Nature 453(7199):1239–1243.
12. Rhind N, et al. (2011) Comparative functional genomics of the fission yeasts. Science332(6032):930–936.
13. Marguerat S, et al. (2012) Quantitative analysis of fission yeast transcriptomes andproteomes in proliferating and quiescent cells. Cell 151(3):671–683.
14. Pelletier B, Beaudoin J, Mukai Y, Labbé S (2002) Fep1, an iron sensor regulating irontransporter gene expression in Schizosaccharomyces pombe. J Biol Chem 277(25):22950–22958.
15. Rustici G, et al. (2007) Global transcriptional responses of fission and budding yeast tochanges in copper and iron levels: a comparative study. Genome Biol 8(5):R73.
16. Schweingruber ME, Schweingruber AM, Schüpbach ME (1982) Isolation and charac-terization of acid phosphatase mutants in Schizosaccharomycespombe. Curr Genet5(2):109–117.
17. Henry TC, et al. (2011) Systematic screen of Schizosaccharomyces pombe deletioncollection uncovers parallel evolution of the phosphate signal pathways in yeasts.Euk. Cell 10:198–206.
18. Carter-O’Connell I, Peel MT, Wykoff DD, O’Shea EK (2012) Genome-wide character-ization of the phosphate starvation response in Schizosaccharomyces pombe. BMCGenomics 13:697.
19. Fabrega C, Shen V, Shuman S, Lima CD (2003) Structure of an mRNA capping enzymebound to the phosphorylated carboxy-terminal domain of RNA polymerase II. MolCell 11(6):1549–1561.
20. Abe H, Shimoda C (2000) Autoregulated expression of Schizosaccharomyces pombemeiosis-specific transcription factor Mei4 and a genome-wide search for its targetgenes. Genetics 154(4):1497–1508.
21. Horie S, et al. (1998) The Schizosaccharomyces pombe mei4+ gene encodes a meiosis-specific transcription factor containing a forkhead DNA-binding domain.Mol Cell Biol18(4):2118–2129.
22. Mata J, Wilbrey A, Bähler J (2007) Transcriptional regulatory network for sexualdifferentiation in fission yeast. Genome Biol 8(10):R217.
23. Pei Y, Hausmann S, Ho CK, Schwer B, Shuman S (2001) The length, phosphorylationstate, and primary structure of the RNA polymerase II carboxyl-terminal domaindictate interactions with mRNA capping enzymes. J Biol Chem 276(30):28075–28082.
24. Ghosh A, Shuman S, Lima CD (2011) Structural insights to how mammalian cappingenzyme reads the CTD code. Mol Cell 43(2):299–310.
25. Hsin JP, Sheth A, Manley JL (2011) RNAP II CTD phosphorylated on threonine-4 isrequired for histone mRNA 3′ end processing. Science 334(6056):683–686.
26. Hintermair C, et al. (2012) Threonine-4 of mammalian RNA polymerase II CTD is tar-geted by Polo-like kinase 3 and required for transcriptional elongation. EMBO J31(12):2784–2797.
27. Egloff S, et al. (2007) Serine-7 of the RNA polymerase II CTD is specifically required forsnRNA gene expression. Science 318(5857):1777–1779.
28. Lovén J, et al. (2012) Revisiting global gene expression analysis. Cell 151(3):476–482.29. Langmead B, Trapnell C, Pop M, Salzberg SL (2009) Ultrafast and memory-efficient
alignment of short DNA sequences to the human genome. Genome Biol 10(3):R25.30. Anders S, Huber W (2010) Differential expression analysis for sequence count data.
Genome Biol 11(10):R106.
4190 | www.pnas.org/cgi/doi/10.1073/pnas.1321842111 Schwer et al.