Individual Radiation Protection Monitoring in the Marshall Islands: Enewetak Atoll (2005-2006) T.F. Hamilton S.R. Kehl D.P. Hickman T.A. Brown R.E. Martinelli S.J. Tumey T. M. Jue B.A. Buchholz R.G. Langston K. Johannes D. Henry March 2007 As a hard copy supplement to the Marshall Islands Program web site (http://eed.llnl.gov/mi/ ), this document provides an overview of the individual radiological surveillance monitoring program on Enewetak Island (Enewetak Atoll) along with a full disclosure of all verified measurement data (2005-2006). UCRL-TR-231397
Transcript
Individual Radiation Protection Monitoring in the Marshall Islands: Enewetak Atoll
(2005-2006)
T.F. Hamilton S.R. Kehl
D.P. Hickman T.A. Brown
R.E. Martinelli S.J. Tumey T. M. Jue
B.A. Buchholz R.G. Langston K. Johannes
D. Henry
March 2007 As a hard copy supplement to the Marshall Islands Program web site (http://eed.llnl.gov/mi/), this document provides an overview of the individual radiological surveillance monitoring program on Enewetak Island (Enewetak Atoll) along with a full disclosure of all verified measurement data (2005-2006).
This document was prepared as an account of work sponsored by an agency of the United States Government. Neither the United States Government nor the University of California nor any of their employees, makes any warranty, express or implied, or assumes any legal liability or responsibility for the accuracy, completeness, or usefulness of any information, apparatus, product, or process disclosed, or represents that its use would not infringe privately owned rights. Reference herein to any specific commercial product, process, or service by trade name, trademark, manufacturer, or otherwise, does not necessarily constitute or imply its endorsement, recommendation, or favoring by the United States Government or the University of California. The views and opinions of authors expressed herein do not necessarily state or reflect those of the United States Government or the University of California, and shall not be used for advertising or product endorsement purposes.
This work was performed under the auspices of the U.S. Department of Energy by the University of California, Lawrence Livermore National Laboratory under Contract W-7405-Eng-48.
As a hard copy supplement to the Marshall Islands Program web site (http://eed.llnl.gov/mi/), this document provides an overview of the individual radiological surveillance monitoring program on Enewetak Island (Enewetak Atoll) along with a full disclosure of all verified measurement data (2005-2006).
BRIEF HISTORY OF NUCLEAR TESTING IN THE MARSHALL ISLANDS ------------ 03
ENEWETAK ATOLL------------------------------------------------------------------------------------ 04 People and Events on Enewetak Atoll ----------------------------------------------------- 05 Post Testing Era and Initial Cleanup Activities ------------------------------------------- 06
WHOLE BODY COUNTING-------------------------------------------------------------------------- 07 What is Whole Body Counting? ------------------------------------------------------------- 07 What Will the Whole Body Counting Show?---------------------------------------------- 09 Estimating Doses from Cesium-137 Based on Whole Body Counting------------- 09 Performance Evaluation of the Whole Body Counting Program--------------------- 10 Doses to Enewetak Atoll Residents from Internally Deposited Cesium-137 ----- 12 Summary------------------------------------------------------------------------------------------- 14
PLUTONIUM URINALYSIS (BIOASSAY) MONITORING ------------------------------------ 15 What is Plutonium Urinalysis Monitoring? ------------------------------------------------- 15 Routes of Exposure ----------------------------------------------------------------------------- 16 What is the Purpose of Plutonium Urinalysis Monitoring in the Marshall Islands? -------------------------------------------------------------------------------------------- 17 Methods of Detection of Plutonium in Urine ---------------------------------------------- 18 Method Validation ------------------------------------------------------------------------------- 19 Plutonium Urinalysis Monitoring on Enewetak ------------------------------------------- 21 Plans for the Future ----------------------------------------------------------------------------- 25
MEASUREMENT DATA FROM THE INDIVIDUAL RADIOLOGICAL SURVEILLANCE PROGRAM------------------------------------------------------------------------ 25 Introduction---------------------------------------------------------------------------------------- 25 Individual Measurement Database ---------------------------------------------------------- 26
DOSIMETRIC DATA AND METHODOLOGY --------------------------------------------------- 26 Introduction---------------------------------------------------------------------------------------- 26 Dosimetric Methodology ----------------------------------------------------------------------- 28
PROVIDING FOLLOWUP ON RESULTS -------------------------------------------------------- 28
APPENDIX 1. INDIVIDUAL RADIOLOGICAL SURVEILLANCE MONITORING DATA BASED ON WHOLE BODY COUNTING AND PLUTONIUM URINALYSIS -- A1
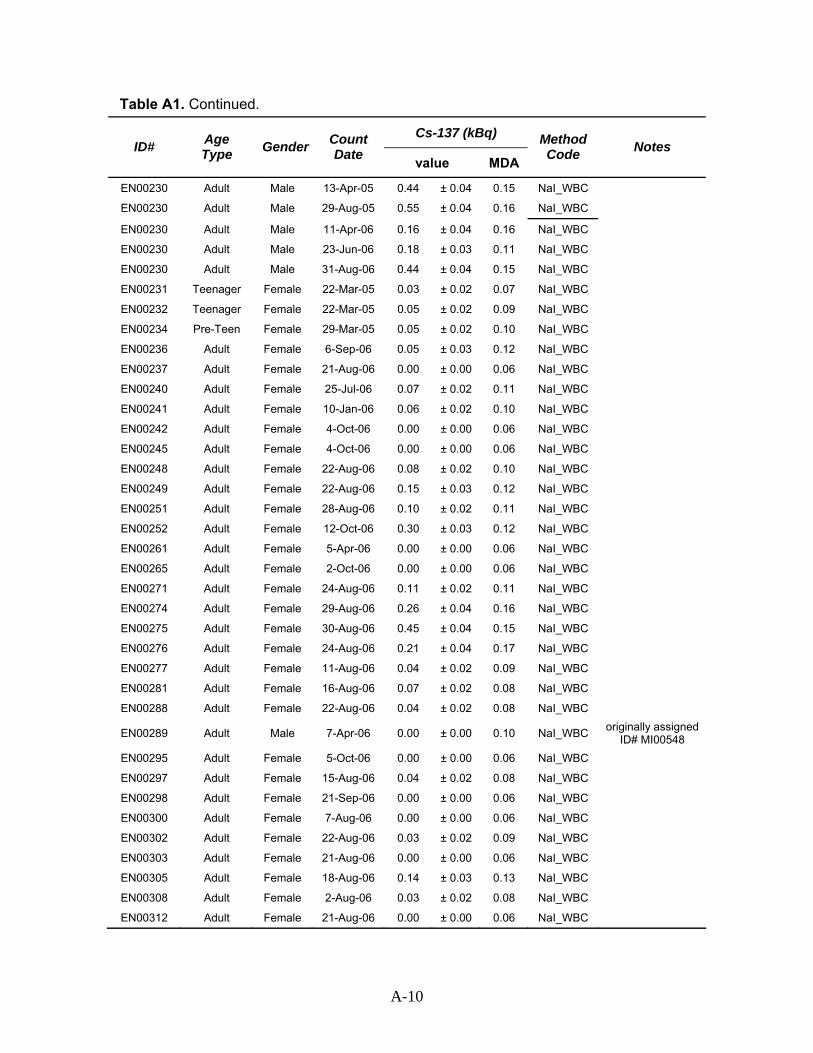
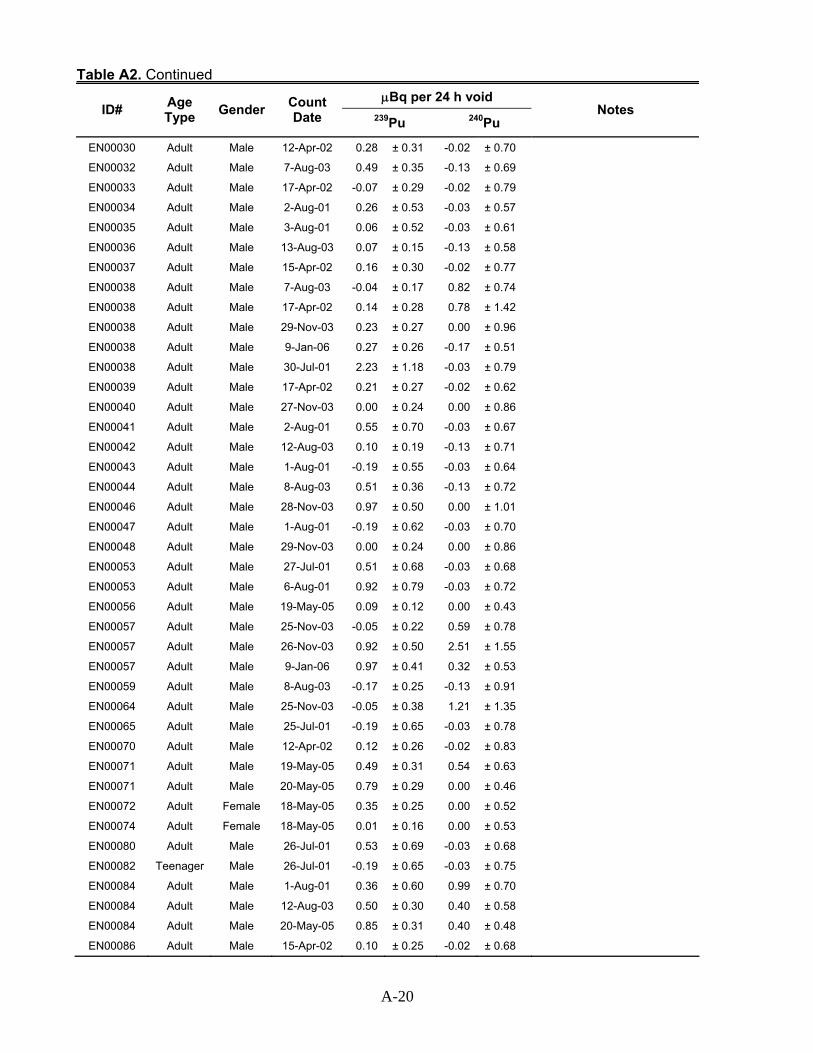
List of Tables Table 1. Fraction of bioassay samples from Enewetak Atoll containing >0.35 μBq of plutonium-239 ------------------------------------------------------------------------------24 Table A1. Whole body count data from Enewetak Atoll (2005-2006) ----------- A2 Table A2. Plutonium urinalysis data from Enewetak Atoll (2001-2006) -------A19
List of Figures Figure 1. The Enewetak Radiological Laboratory located on Enewetak Island, Enewetak Atoll ---------------------------------------------------------------------------------02
Figure 2. Map of the Republic of Marshall Islands showing the fallout pattern from the Bravo thermonuclear test conducted on March 1 of 1954---------------04 Figure 3. The Enewetak Radiological Laboratory whole body counter showing a calibration phantom sitting in the chair ---------------------------------------------------08 Figure 4. Multivar gage plot showing performance of whole body counting facilities for bi-annual performance evaluation exercises (2002 - 2005). -------12 Figure 5. Dose distribution plot of the committed effective dose equivalent delivered to Enewetak Island residents (2005-2006) from internally deposited cesium-137, annualized to the measurement year------------------------------------13 Figure 6. Results of an interlaboratory exercise conducted by National Institute of Standards and Technology (NIST) on determination of plutonium-239 in synthetic urine in the microBecquerel (μBq) range------------------------------------20 Figure 7. Analyses of externally prepared natural matrix spiked quality control performance evaluation test samples (2001-2006) prepared by the Oak Ridge National Laboratory ---------------------------------------------------------------------------21 Figure 8. Layout of the menu structure used to access individual radiological protection monitoring data from the Marshall Islands web site---------------------25 Figure 9. Layout of the menu structure used to access individual dosimetric monitoring data from the Marshall Islands web site-----------------------------------27 Figure 10. Enewetak whole body counting technicians, Mr. Kosma Johannes (left) and Mr. Donald Henry (right), pictured with Subject Matter Expert, Dr. David Hickman, from the Lawrence Livermore National Laboratory (second from right) and local Enewetak resident, Mr. Yose Iban--------------------------------------------30
vi
1
INTRODUCTION
The United States Department of Energy has recently implemented a series of strategic
initiatives to address long-term radiological surveillance needs at former U.S. nuclear
test sites in the Marshall Islands. The plan is to engage local atoll communities in
developing shared responsibilities for implementing radiation surveillance monitoring
programs for resettled and resettling populations in the northern Marshall Islands. Using
the pooled resources of the United States Department of Energy and local atoll
governments, individual radiological surveillance programs have been developed in
whole body counting and plutonium urinalysis. These programs are used to accurately
track and assess doses delivered to Marshall Islanders from exposure to residual fallout
contamination in the local environment. The key fallout radionuclides of radiological
concern include fission products such as cesium-137 and strontium-90, and long-lived
alpha emitting radionuclides such as plutonium-239, plutonium-240 and americium-241.
Permanent whole body counting facilities have been established at three separate
locations in the Marshall Islands including Enewetak Atoll (Bell et al., 2002) (Figure 1).
These facilities are operated and maintained by Marshallese technicians with scientists
from the Lawrence Livermore National Laboratory providing on-going technical support
services. The concentration of cesium-137 in soils from the northern Marshall Islands is
significantly elevated over that expected from global fallout deposition and may enter the
body of local residents through ingestion of locally grown foods. Whole body counting
provides a direct measure of internally deposited cesium-137 and is a very reliable
method for assessing the internal dose contribution from ingestion of cesium-137.
We have also developed a state-of-the-art measurement technology in support of the
Marshall Islands plutonium urinalysis (bioassay) program. Bioassay samples are
collected by locally trained technicians under controlled conditions and returned to the
United States for analysis of plutonium isotopes by Accelerator Mass Spectrometry
(AMS). High-quality bioassay measurements based on AMS are providing more reliable
and accurate baseline measurements, and could potentially be used to track and assess
intakes of plutonium associated with resettlement.
Site specific environmental surveys are also conducted to determine the fate and
transport of fallout radionuclides in the environment or simply to verify the effects of
cleanup programs. The general aim of the environmental studies program is to develop
fundamental scientific data on the behavior of key radionuclides in the environment.
2
Figure 1. The Enewetak Radiological Laboratory located on Enewetak Island, Enewetak Atoll.
These data and information will ultimately be used to develop more reliable predictive
dose assessments for resettlement taking into account future change in radiological
conditions. This information is essential in helping determine the most appropriate
measures for cleanup and in assessing the impacts of changes in life-style, diet and
land-use on radionuclide uptake and dose. Together, the individual and environmental
radiological surveillance programs in the Marshall Islands are helping meet the
informational needs of the United States Department of Energy and the Republic of the
Marshall Islands. Our mission is to provide high quality measurement data and reliable
dose assessments, and to build a strong technical and scientific foundation to help
sustain resettlement of affected atolls. Perhaps most importantly, the recently
established individual radiological surveillance programs provide atoll population groups
with an unprecedented level of radiation protection monitoring where, for the first time,
local resources are being made available to actively monitor resettled and resettling
populations on a more permanent basis.
As a hard copy supplement to Marshall Islands Program web site (http://eed.llnl.gov/mi/),
this document provides an overview of the individual radiation protection monitoring
program established on Enewetak Atoll along with a full disclosure of all verified
BRIEF HISTORY OF NUCLEAR TESTING IN THE MARSHALL ISLANDS
Immediately after WWII, the United States created a Joint Task Force to develop a
nuclear weapons testing program. Planners examined a number of possible locations in
the Atlantic Ocean, the Caribbean, and the Central Pacific but decided that coral atolls in
the northern Marshall Islands offered the best advantages of stable weather conditions,
fewest inhabitants to relocate and isolation with hundreds of miles of open-ocean to the
west where trade winds were likely to disperse radioactive fallout. During the period
between 1945 and 1958, a total of 67 nuclear tests were conducted on Bikini and
Enewetak Atolls and adjacent regions within the Republic of the Marshall Islands. The
most significant contaminating event was the Castle Bravo test conducted on March 1,
1954 (Figure 2). Bravo was an experimental thermonuclear device with an estimated
explosive yield of 15 MT (USDOE, 2000), and led to widespread fallout contamination
over inhabited islands on Rongelap and Utrōk Atolls as well as other atolls to the east of
Bikini. Today, the United States Department of Energy through the Office of International
Health Studies continues to provide environmental monitoring, healthcare and medical
services on the affected atolls.
Key directives of the Marshall Islands Dose Assessment and Radioecology Program
conducted at the Lawrence Livermore National Laboratory are (1) to provide technical
support services and oversight in establishing radiological surveillance monitoring
programs for resettled and resettling populations in the northern Marshall Islands; (2) to
develop comprehensive assessments of current (and assess potential changing)
radiological conditions on the islands; and (3) provide recommendations for remediation
of contaminated sites and verify the effects of any actions taken.
4
Figure 2. Map of the Republic of Marshall Islands showing the fallout pattern from the Bravo nuclear test conducted on March 1 of 1954.
ENEWETAK ATOLL
People and Events on Enewetak Atoll| Post Testing Era and Initial Cleanup Activities
5
People and Events on Enewetak Atoll
After an initial series of nuclear tests on Bikini Atoll in 1946, local inhabitants of
Enewetak Atoll were relocated to a new home on Ujelang Atoll in December 1947 in
preparation for scheduling of the first series of nuclear tests on Enewetak. Operation
Sandstone commenced during April of 1948 and included 3 tests atop of 60 m high steel
towers located separately on the islands of Enjebi, Aomen, and Runit. An additional 4
near-surface tests were conducted on towers as part of Operation Greenhouse during
1951. Operation Ivy, in 1952, set the stage for the first test of a large thermonuclear
device. The Mike thermonuclear blast of 31 October of 1952 had an explosive yield of
10.4 Mt (USDOE, 2000) vaporizing the island of Elugelab and leaving behind a deep
crater about 1 km in diameter. Early analysis of Mike fallout debris showed the presence
of two new isotopes of plutonium, plutonium-244 (244Pu) and plutonium-246 (246Pu), and
lead to the discovery of the new heavy elements, Einsteinum and Fermium. Operation
Castle involved a single nuclear test on Enewetak in 1954 and 5 high-yield tests on
Bikini. A total of 11 nuclear tests were also conducted on Enewetak in 1956 as part of
Operation Redwing including an air burst from a balloon located over water.
In 1958, the United States anticipated the acceptance of a call for suspension of
atmospheric nuclear testing and assembled a large number of devices for testing before
the moratorium came into effect. From April through August 1958, 22 near-surface
nuclear denotations were conducted on Enewetak Atoll either on platforms, barges or
underwater, 10 tests were conducted at Bikini Atoll, 2 tests near Johnson Atoll, and a
high altitude test conducted about 100 kms west of Bikini Atoll. Most nuclear tests
conducted on Enewetak Atoll were detonated in the northern reaches of the atoll and
produced highly localized fallout contamination of neighboring islands and the atoll
lagoon. As a consequence, the northern islands on Enewetak received significantly
higher levels of fallout contamination containing a range of fission products, activation
products and unfissioned nuclear fuel. By the time the test moratorium came into effect
on 31 October of 1958, the United States had conducted a total of 42 nuclear tests on
Enewetak Atoll.
6
Post Testing Era and Initial Cleanup Activities
Enewetak Atoll continued to be used for defense programs until the start of a cleanup
and rehabilitation program in 1977. There were five feasible approaches considered by
the Defense Nuclear Agency (DNA, 1981) for cleanup of Enewetak Atoll. The final plan
called for 1) removing all radioactive and non-radioactive debris (equipment, concrete,
scrap metal, etc.), 2) removing all soil that exceeded 400 pCi (14.8 Bq) of plutonium per
gram of soil, 3) removing or amending soil between 40 and 400 pCi (1.48 and 14.8 Bq)
of plutonium per gram of soil, determined on a case-by-case basis depending on
ultimate land-use, and 4) disposing and stabilizing all this accumulated radioactive waste
into a crater on Runit Island and capping it with a concrete dome. Over 4,000 U.S.
servicemen assisted in the cleanup operations, with 6 lives lost in accidents, in what
became known as the Enewetak Radiological Support Project (DOE, 1982). Over 73,000
cubic meters of surface soil across 6 different islands was removed and deposited in
Cactus crater on Runit Island. The Nevada Operations Office of the Department of
Energy was responsible for certification of radiological conditions of each island upon
completion of the project. The Operations Office also developed several large databases
to document radiological conditions before and after the cleanup operations, and to
provide data to update available dose assessments. The Enewetak cleanup was largely
focused on the removal and containment of plutonium along with other heavy radioactive
elements. However, even during this early period of cleanup and rehabilitation, the
adequacy of cleanup of the northern islands on Enewetak was brought into question
because predictive dose assessments showed that ingestion of cesium-137 and other
fission products from consumption of locally grown terrestrial foods was the most
significant route for human exposure to residual fallout contamination on atolls affected
by the nuclear test program.
The people of Enewetak remained on Ujelang Atoll until resettlement of Enewetak Island
in 1980. Between 1980 and 1997, the resettled population was periodically monitored for
internally deposited radionuclides by scientists from the Brookhaven National Laboratory
using whole body counting and plutonium urinalysis (Sun et al., 1992; 1995; 1997a;
1997b). More recently, the Department of Energy agreed to design and construct a
radiological laboratory on Enewetak Island, and help develop the necessary local
resources and technical expertise to maintain and operate the facility on a permanent
basis. This cooperative effort was formalized in a Memorandum of Understanding signed
7
by the United States Department of Energy, the Republic of the Marshall Islands, and
the Enewetak/Ujelang Local Atoll Government in August of 2000 (MOU, 2000).
Construction on the Enewetak Radiological Laboratory was completed in May of 2001.
The laboratory facility incorporates both a permanent whole body counting system, to
assess radiation doses from internally deposited cesium-137, and clean living space for
collecting in-vitro bioassay samples. Scientists from the Lawrence Livermore National
Laboratory continue to support the operation of the facility and are responsible for
systems maintenance, training and quality assurance.
WHOLE BODY COUNTING
What is Whole Body Counting? | What Will Whole Body Counting Show? | Estimating Doses from Cesium-137 Based on Whole Body Counting | Performance Evaluation of the Whole Body Counting Program ׀ Doses to Enewetak Atoll Residents from Internally Deposited Cesium-137
What is whole Body Counting?
The whole body counting systems installed in the Marshall Islands contain large volume
sodium iodide radiation detectors that measure gamma-rays coming from radionuclides
deposited in the body. The detector systems are modeled after the ‘Masse-Bolton Chair’
design (Figure 3) and can be used to detect high-energy, gamma-emitting fallout
radionuclides such as cesium-137 and cobalt-60 in most of the body and all of the
internal organs. Using established procedures the whole body counting measurement
data are converted into an annual effective dose using specially designed computer
software (Canberra, 1998a; 1998b) and a dose report issued immediately to program
volunteers.
There are currently three operational whole body counting facilities in the Republic of the
Marshall Islands. These facilities are located on Enewetak, Rongelap and Majuro Atolls.
The whole body counting systems are calibrated using a mixed-gamma point source
method. The point source calibration procedure was developed by cross-reference to a
Bottle Man-akin Absorption (BOMAB) phantom (or human surrogate) calibration source
containing a standard mix of gamma-emitting radionuclides traceable to the United
States National Institute of Standards and Technology (NIST).
Wherever possible, the whole body counting program in the Marshall Islands is
conducted using the same quality control requirements as established under the United
States Department of Energy Laboratory Accreditation Program (DOELAP) for internal
8
dosimetry. A systems background and other quality control check counts are performed
daily to ensure that the measurement system conforms to all applicable quality
requirements. Also, the whole body counting facilities participate in performance testing
under the umbrella of the Oak Ridge National Laboratory Intercomparison Studies
Program (ISP). These performance test samples are distributed around each of the
facilities including a mirror whole body counting system located at Livermore under the
Marshall Islands Program.
Figure 3. The Enewetak Radiological Laboratory whole body counter showing a calibration phantom sitting in the chair.
The performance of each facility is then evaluated by comparing results with those
obtained by the Hazards Control Department at the Lawrence Livermore National
Laboratory−a DOELAP accredited facility−and with the reference values supplied by the
Oak Ridge National Laboratory. Based on our external quality assurance program, the
Marshall Island Program whole body counting facilities have consistently conformed to
the ANSI 13.30 criteria for accuracy and measurement precision (Kehl et al., 2007).
Local Marshallese technicians are responsible for all daily operations within the facilities
including scheduling of personal counts, performing systems performance checks, data
reduction, and initial reporting of dosimetric data to program volunteers. The technicians
receive an initial six weeks of intensive training at the Lawrence Livermore National
9
Laboratory and are employed to run the facilities for up to 40 hours per week. Scientists
from the Lawrence Livermore National Laboratory provide on-going technical support
services, advanced training in whole body counting and basic health physics, and
perform a more detailed data quality assurance appraisal before any data are released
in reports or posted on the Marshall Islands web site.
What Will Whole Body Counting Show?
The main pathway for exposure to residual fallout contamination in the northern Marshall
Islands is through ingestion of cesium-137 contained in locally grown foods such as
coconut, Pandanus fruit and breadfruit (Robison et al., 1997a). The strategic objective of
the Marshall Islands Whole Body Counting Program is to offer island residents an
unprecedented level of radiation protection monitoring until such time that it is clearly
demonstrated that radiation surveillance measures can be relaxed. The value of this
type of radiation protection monitoring program lies in the fact that whole body count
data provides a direct measure of radionuclide uptake into local populations. Information
about potential high-end health risks and seasonal fluctuations in the body burden of
cesium-137 within various Marshallese atoll population groups can be assessed from
repeated measurement data rather than relying on a range of assumptions from different
dietary scenarios.
In combination with environmental monitoring data, residents who receive a whole body
count showing the presence of cesium-137 can now make an informed decision about
their eating habits or life-style based on what is considered a ‘safe’ or acceptable health
risk. The Republic of the Marshall Islands Nuclear Claims Tribunal has adopted a
standard for cleanup of radioactively contaminated sites of 0.15 millisievert (mSv) per
year (or 15 mrem per year) [EDE, Effective Dose Equivalent] using a lifetime cancer risk
criterion recommended by the United States Environmental Protection Agency (EPA). As
displaced communities return to their ancestral homelands, the Marshall Islands Whole
Body Counting Program will allow the United States Department of Energy to monitor
the resettled population on Enewetak and provide assurances that radiation related
health risks remain at or below these established standards.
Estimating Doses from Cesium-137 Based on Whole Body Counting
People living in the Marshall Islands may be exposed to cesium-137 contained in their
diets from eating locally grown food crop products such as coconut. Whole body
10
counting provides a direct measure of the amount of cesium-137 inside the body of
people. The biokinetic behavior of cesium-137 inside the human body is well known and
allows information from the whole body counter to be converted to a radiation dose. The
radiation dose is what is used to quantify the potential health risks associated with
radiation exposure. The dosimetric data graphics displayed on Marshall Islands web site
are based on the calendar year committed effective dose equivalent (CEDE) from
intakes of cesium-137 in the year of measurement projected over 50 years (Daniels et
al., 2007). Dose equivalent is given in units of rem, the conventional units used by
federal and state agencies in the United States. The SI unit of dose equivalent is the
joule per kilogram or sievert (Sv). Doses from exposure to environmental radioactivity
(natural or manmade) are normally expressed as 1/1000th of the base unit, i.e., in
millirem (mrem) or millisievert (mSv). 1 mSv is equal to 100 mrem.
Information Note: The methodologies for computing doses from the whole body counting
and plutonium urinalysis programs have recently been outlined in a Technical Basis
Document (refer to Daniels et al., 2007). This new methodology uses a 50 y dose
commitment and complies more fully with ICRP methodology. The algorithms developed
to allow users to compute doses directly from measurement data posted on the web site
are also consistent with this new methodology.
Performance Evaluation of the Whole Body Counting Program
Whole Body counting facilities in the Marshall Islands as well as a mirror facility
maintained at the Lawrence Livermore National Laboratory participate in bi-annual
performance evaluation exercises conducted under the umbrella of the Oak Ridge
National Laboratory Intercomparison Studies Program (ISP). The ISP was specifically
designed to support whole body counting facilities to comply with requirements of the
United States Department of Energy Laboratory Accreditation Program (DOELAP). In
this way, the Marshall Islands Radiological Surveillance Program has established quality
assurance measures that are consistent with standard requirements used to monitor
DOE workers in the United States.
The performance evaluation samples for whole body count measurements are prepared
in a mock-up geometry that simulates a human body torso, and usually contains a mix of
barium-133 (133Ba), cobalt-60 (60Co), cesium-137 (137Cs) and yttrium-88 (88Y) isotopes at
nominal concentrations of ≤ 500 nCi (or 18.5 kBq) per sample. The ISP at Oak Ridge
use stock isotope solutions indirectly traceable to the National Institute of Standards and
11
Technology (NIST). Details concerning the NIST stock solutions and ISP spikes used in
the preparation of the whole body count performance evaluation samples can be found
elsewhere (ISP Report, 2005). For practical purposes we have limited performance
evaluation testing of the Marshall Island whole body counting facilities to detection and
measurement of cesium-137.
For testing purposes, the relative bias (%, Bri) for a whole body count measurement (i)
shows how close the measured activity is to the reference (known) value of the test
sample. The relative bias (%, Br) for any whole body count facility can then be calculated
as the average of the individual relative biases Bri as defined by;
∑=
=n
i
rir
NBB
1
where N is the number of measurements performed within each facility.
The mean relative bias statistic for the LLNL, Rongelap, Enewetak and Utrōk (Majuro)
facilities based on performance evaluation exercises conducted between 2002 and 2005
was 25%, 15.4%, 19.6% and -5.4%, respectively. This compares with ANSI 13.30
acceptance criteria used in the United States for radiobioassay service laboratory quality
control, performance testing, and accreditation of -25% to +50%. The results for each
performance evaluation exercise conducted between 2002 and 2005 are shown
graphically in Figure 4 with the upper (UCL) and lower (LCL) control limits.
The relative precision (%, SB) of the measurements performed across each whole body
count facility is the relative dispersion of the values of Bri from their mean Br, and is
defined as;
)1()(
1
2
−
−= ∑ =
NBrBri
SN
iB
The acceptance criteria for the relative measurement precision statistic (SB) based on
the ANSI 13.30 standard criteria for radiobioassay service laboratory quality control,
performance testing, and accreditation is less than or equal to 40%. The mean relative
precision statistic for the LLNL, Rongelap, Enewetak and Utrōk (Majuro) facilities based
on performance evaluation exercises conducted between 2002 and 2005 was 8.9%,
1.6%, 9.5% and 16.7%, respectively.
12
The combined mean relative bias and relative precision statistic across all the Marshall
Islands whole body counting facilities was 12.6% and 20.5%, respectively.
Consequently, whole body count facilities in the Marshall Islands have consistently
passed ANSI 13.30 performance criteria for relative measurement bias and precision.
Mea
sure
men
t Bia
s (%
)
-30
-20
-10
0
10
20
30
40
50
4th
quar
ter 2
002
2nd
quar
ter 2
003
4th
quar
ter 2
003
2nd
quar
ter 2
004
4th
quar
ter 2
004
2nd
quar
ter 2
005
4th
quar
ter 2
005
4th
quar
ter 2
002
2nd
quar
ter 2
003
4th
quar
ter 2
003
2nd
quar
ter 2
004
4th
quar
ter 2
004
2nd
quar
ter 2
005
4th
quar
ter 2
005
4th
quar
ter 2
002
2nd
quar
ter 2
003
4th
quar
ter 2
003
2nd
quar
ter 2
004
4th
quar
ter 2
004
2nd
quar
ter 2
005
4th
quar
ter 2
005
4th
quar
ter 2
002
2nd
quar
ter 2
003
4th
quar
ter 2
003
2nd
quar
ter 2
004
4th
quar
ter 2
004
2nd
quar
ter 2
005
4th
quar
ter 2
005
LLNL Enewetak Rongelap Utrok (Majuro)
Date within facility
Upper Control Limit (UCL)
Lower Control Limit (LCL)
[Statistical reference lines include the null value (----); UCL (Upper Control Limit) = 50% (– - –); LCL (Lower Control Limit) = -25% (– - –); individual facility mean (____); and the overall or combined facility mean (-----)]
Figure 4. Multivar gage plot showing performance of whole body counting facilities for bi-annual performance evaluation exercises (2002−2005).
Doses to Enewetak Atoll Residents from Internally Deposited Cesium-137
The individual dosimetric data from the whole body counting program (2005-06) are
available on the Marshall Islands web site (http://eed.llnl.gov/mi/).
A dose distribution plot of the committed effective dose equivalent delivered to program
volunteers on Enewetak Island from internally deposited cesium-137, annualized to the
The majority of people living on Enewetak Island received internal doses from intakes of
cesium-137 of less than 1 mrem (0.01 mSv) per year (Figure 5). The population average
committed effective dose equivalent averaged over the past two years was 0.7±0.8
mrem (N=368). This compares with population average doses of 0.5±0.5 mrem reported
for 2001 (N = 417), 0.8±0.8 mrem in 2002 (N=131), 0.5±0.7 mrem in 2003 (N = 197) and
0.7±1.3 mrem in 2004 (N = 316). The corresponding maximal individual committed
effective dose equivalent reported for each measurement year since the introduction of
this radiological surveillance monitoring program are 3.2 mrem (2001), 4.9 mrem (2002),
4.0 mrem (2003), 11.5 mrem (2004), 3.5 mrem (2005) and 3.4 mrem (2006). It should be
noted that the body burden of cesium-137 in about 1 of every 4 individuals on Enewetak
Island falls below the critical level of the measurements (Lc ~ 0.05 kBq). For the
purposes of calculating summary dose statistics, those volunteers with no detectable
cesium-137 in their bodies were assigned a dose equal to zero.
0
1
2
3
4
5
6
7
8
9
10
Dos
e, m
rem
per
yea
r
.10 .20 .30 .40 .50 .60 .70
Probability
Enewetak Atoll residents & visitors (2005-2006)
Dose contribution from internally deposited cesium-137
Moments; Median = 0.43; Mean = 0.73; Std. Dev. = 0.82; Std. Err. Mean = 0.04; Upper 95% Confidence Internal Mean = 0.81; Lower 95% Confidence Interval Mean = 0.65; N (number of volunteers) = 368
Figure 5. Dose distribution plot of the committed effective dose equivalent delivered to Enewetak Island residents (2005-2006) from internally deposited cesium-137, annualized to the measurement year.
14
Summary
All volunteers participating in the whole body counting program on Enewetak Atoll during
2005-2006 received annualized doses from cesium-137 ingestion of less than 4 mrem.
The committed effective dose equivalent delivered to Enewetak Atoll residents (including
some short-term visitors) from ingestion of cesium-137 can be compared with the natural
background effective dose equivalent (EDE) of 140 mrem per year in the Marshall
Islands and 300 mrem per year in the United States. The observed internal doses from
cesium-137 for all program volunteers on Enewetak are also significantly lower than the
annual dose criteria of 100 mrem per year, excluding medical irradiation, imposed in
10CRF Part 20 (NRC, 2004) for protection of the public. Consequently, the results of the
whole body counting program clearly demonstrate that Enewetak residents are not being
exposed to significantly elevated levels of cesium-137 in their diet. However, we
recognize that people of Enewetak Atoll only receive periodic shipments of imported
foods and during food shortages or festive events may consume more local foods from
the northern islands where levels of fallout contamination are considerably higher.
Moreover, as population dynamics on the atoll change there may be more pressure on
the community to make wider use of resources across the entire atoll. The continuing
whole body counting program on Enewetak Island will ensure that people who
occasionally ‘binge’ on foods from the northern islands are carefully monitored. Under
these circumstances, the annual dose delivered to an individual may be dominated by
intakes of cesium-137 from occasional visitations to the northern islands where local
terrestrial foods typically contain higher average concentrations of cesium-137 (as well
as other fallout radionuclides).
15
PLUTONIUM URINALYSIS (BIOASSAY) MONITORING
What is Plutonium Urinalysis Monitoring | Routes of Human Exposure | Purpose of Plutonium Urinalysis Monitoring | Methods of Detection | Methods Validation | Plutonium Urinalysis Monitoring on Enewetak | Plans for the Future
A schematic diagram of the systems configuration for detection and measurement of plutonium isotopes by Accelerator Mass Spectrometry (AMS). AMS is about 200 to 400 times more sensitive than standard techniques commonly employed in routine internal dosimetry programs, and far exceeds the standard requirements established under the latest United States Department of Energy regulation 10CFR 835, for in-vitro bioassay monitoring of plutonium-239.
What is Plutonium Urinalysis Monitoring?
Plutonium urinalysis is a very sensitive in-vitro bioassay measurement technique used to
determine the amount of plutonium in human urine as a means of estimating the
systemic burden (or total amount of plutonium) in the human body. Plutonium urinalysis
tests are performed by collecting urine from individuals over a 24-hour period. Under the
Marshall Islands Radiological Surveillance Program, we have developed a new state-of-
the-art technology for measuring the amount of plutonium in urine based on Accelerator
Mass Spectrometry. The test turns a urine sample into a powder which scientists
analyze by counting the number of plutonium atoms contained in the sample.
Everybody has a small amount of plutonium in their bodies. Plutonium occurs in nature
at very low concentrations but human exposure to plutonium increased dramatically
through the 1950s as a result of global fallout from atmospheric nuclear weapons
testing. Marshall Islanders are potentially exposed to higher levels of contamination in
the environment as a result of exposure to close-in and regional fallout contamination.
16
Routes of Human Exposure
Plutonium is an important radioactive element produced in nuclear explosions.
Plutonium emits alpha particles (or alpha-rays). Alpha-particles have a short range in
tissue (about ~40 μm) and cannot be measured by detectors external to the body.
However, as heavy slow moving charged particles they have a high relative
effectiveness to disrupt or cause harm to biological cells. As a consequence, in-vitro
bioassay tests have been developed to test for the presence of systemic plutonium in
the human body based on measured urinary excretion patterns and modeled metabolic
behaviors of the absorbed radionuclides.
The main pathway for exposure to plutonium in humans is inhalation of contaminated
dust particles in the air that people breathe. Inhaled or ingested plutonium may
eventually end up in various organs–especially the lung, liver and bone–resulting in
continuous exposure of these tissues to alpha particle radiation. Plutonium remains in
the body for a long time but the systemic uptake of plutonium in people living in the
northern Marshall Islands is still expected to be very low (Robison et al., 1980; 1982;
1997b).
Inhalation exposure can be estimated from the product of the soil concentration,
resuspension enhancement factors and inhalation dose conversion factors for
radionuclides of interest. These estimates show that the projected dose contribution from
exposure to plutonium in the Marshall Islands is less that 5% of the total lifetime dose
from exposure to residual fallout contamination in the environment (Robison et al., 1980;
1982; 1997b). However, plutonium is a major concern to people living in the northern
Marshall Islands because of its long half-life and persistence in the environment.
Moreover, radioactive debris deposited in lagoon sediments of coral atolls formed a
reservoir and potential long-term source for remobilization and transfer of plutonium
through the marine food chain and potentially to man. Elevated levels of plutonium in the
terrestrial environment represent potential inhalation and/or ingestion hazards. Early
characterization of the terrestrial environment has also revealed the presence of
hotspots containing milligram-sized pieces of plutonium metal that required some form of
remediation (DOE, 1982). Consequently, dose assessments and atoll rehabilitation
programs in the Marshall Islands have historically given special consideration to
monitoring plutonium exposure in resettled and resettling populations.
17
What is the Purpose of Plutonium Urinalysis Monitoring in the Marshall Islands?
Plutonium urinalysis is a measurement technique that ultimately provides information on
the amount of plutonium people have in their bodies. Although plutonium is expected to
be a minor contributor to the total manmade dose, it is a concern to people living in the
northern Marshall Islands who are potentially exposed to elevated levels of plutonium in
the environment from close-in or regional fallout deposition. Consequently, the United
States Department of Energy has agreed to monitor resettlement workers and perform a
limited number of urinalysis tests on island residents using advanced measurement
technologies available at the Lawrence Livermore National Laboratory. The
measurement technique currently employed at the Lawrence Livermore National
Laboratory is based on Accelerator Mass Spectrometry. AMS is about 200 to 400 times
more sensitive than monitoring techniques commonly employed in occupational internal
dosimetry monitoring programs within the United States, and far exceeds the standard
requirements established under the latest Department of Energy regulation 10CFR 835
for in-vitro bioassay monitoring of plutonium-239.
The Marshall Islands Plutonium Urinalysis Monitoring Program was implemented under
the following action plan:-
1) To provide more reliable and accurate data to assess baseline and potentially
significant incremental uptakes of plutonium within resettled and/or resettling
populations in the Marshall Islands.
2) To monitor plutonium exposure in critical population groups such as workers
involved in soil remediation or agriculture.
3) To demonstrate and document that occupational and/or public exposures to
plutonium in the Marshall Islands are below levels that will have an impact on
human health.
4) To ensure that our plutonium bioassay data meet all applicable quality
requirements through the use of standardized procedures and performance
testing.
5) To document and test the reliability of using environmental data to assess
human exposure (and uptake) to plutonium in coral atoll ecosystems, and
predict future change.
18
Methods of Detection of Plutonium in Urine
Researchers from the Brookhaven National Laboratory (BNL) were the first to use whole
body counting and plutonium urinalysis techniques to assess intakes of internally
deposited radionuclides in Marshallese populations (Sun et al., 1992; 1995; 1997a;
1997b; Conard, 1992; Lessard et al., 1984; Miltenberger et al., 1981; Greenhouse et al.,
1980). Classical methods for evaluating intakes of plutonium in bioassay samples
include alpha-spectrometry and fission-track analysis. Alpha spectrometry cannot
distinguish between plutonium-239 and plutonium-240, and results are normally reported
for the sum of the two isotopes. Moreover, alpha spectrometry lacks the necessary
detection sensitivity to accurately assess plutonium exposure in the Marshall Islands
(Hamilton et al., 2004). Fission Track Analysis is limited to the quantification of
plutonium-239 but with a reported detection limit (MDA, Minimum Detectable Amount) of
around 1 to 3 microBecquerel (μBq) of plutonium-239 offers a greatly improved potential
for assessing uptakes associated with low-level chronic exposure to plutonium in the
environment.
Under the Marshall Islands Plutonium Urinalysis Program, urine samples were initially
sent to the University of Utah for analysis of plutonium using fission track analysis.
Fission is a process where heavy nuclei such as plutonium and uranium break up into
two large fragments. Fission may occur spontaneously or be induced by collisions with
neutrons. During fission track analysis samples are exposed to a source of neutrons in a
reactor while in contact with a quartz or plastic slide. Any resulting fission fragments will
leave behind tracks on the slide that can be counted under an optical microscope to
determine the amount of plutonium present. Historically, fission track analysis has been
plagued with a number of deficiencies including the use of less than reliable and tedious
preparative methods, low chemical yields, contamination issues and inaccurate
quantification. The University of Utah and the Brookhaven National Laboratory improved
on the fission track process methodology, and adopted a more rigorous approach to
data reduction and quality assurance in support of urinalysis testing programs in the
Marshall Islands.
More recently, scientists from the Lawrence Livermore National Laboratory have
developed a low-level detection technique for determination of plutonium isotopes in
bioassay samples based Accelerator Mass Spectrometry (Brown et al., 2004; Hamilton
et al., 2004; Hamilton et al., 2007). The technique has vastly improved the quality and
19
reliability of assessments of urinary excretion of plutonium from Marshall Islanders, and
avoids many of the disadvantages of using conventional atom counting techniques or
other competing new technologies.
INFORMATION NOTE
There are two main isotopes of plutonium in the environment–namely plutonium-239
(239Pu) and plutonium-240 (240Pu). The isotopic composition of plutonium (i.e., the
relative amounts of 239Pu and 240Pu) may vary significantly depending on the source of
plutonium. For example, the 240Pu/239Pu content of nuclear fallout from high−yield
atmospheric nuclear tests in the Marshall Islands produced 240Pu/239Pu atom ratio
signatures of ~0.35 compared with that present in integrated global fallout deposition
(~0.18) or unfissioned nuclear fuel (~0.05). Consequently, it may be possible to use
bioassay testing and plutonium isotopic measurements as an investigative tool to assess
source specific exposures to Bravo fallout as well as from other specific nuclear events.
Method Validation
Method validation is the process used to monitor and document the quality of the
measurement data. Methods validation testing under the Marshall Islands Urinalysis
Monitoring Program has included participation in an independent interlaboratory exercise
organized by the United States National Institute of Standards and Technology (NIST).
The results of this exercise clearly demonstrate that accelerator mass spectrometry is
well suited for detection of μBq concentrations of plutonium-239 and plutonium-240 in
urine (Figure 6) (Marchetti et al., 2002). An independent report on the results of this
intercomparison exercise was recently published in the open scientific literature
(McCurdy et al., 2005). This study demonstrated that accelerator mass spectrometry
provided equally or more precise and higher quality results than comparative methods.
20
-20
0
20
40
60
80
0 20 40 60 80
Certified Value (239Pu, μBq)
MeasuredValue
(239Pu, μBq)
ANSI N13.30 Performance Criteria Bias (-25% to 50%) = -5.8%
Precision (< or = 40%) = 18.7%
Figure 6. Results of an interlaboratory exercise conducted by National Institute of Standards and Technology (NIST) on determination of plutonium-239 in synthetic urine in the microBecquerel (μBq) range.
We also continue to test the performance of the technique by analyzing externally-
prepared quality control natural urine samples artificially spiked with known amounts of
plutonium. These quality control performance test samples are prepared under contract
with the Oak Ridge National Laboratory and analyzed along with routine bioassay
samples collected from the Marshall Islands. The activity concentration of plutonium-239
in the quality control samples is kept below 200 μBq in order to avoid possible cross-
contamination problems, and the plutonium-240/plutonium-239 atom ratio approximates
that observed in integrated worldwide fallout deposition, i.e., ~0.2. The results of the
quality control sample analyses are sent to Oak Ridge National Laboratory researchers
for review and, in return, they prepare a data quality assurance report. All quality control
data must pass ANSI N13.30 performance criteria for accuracy and precision before
acceptance of any routine bioassay measurement data. The average combined
measurement bias and precision based on spiked quality samples analyzed under the
Marshall Islands Program (2001-2006) were 1.1% and 6.8% for plutonium-239, and
4.6% and 11.1% for plutonium-240, respectively. The results of the plutonium-239
measurements are shown in Figure 7. Based on the results from these performance
21
tests we consider that the methodologies employed under the Marshall Islands
Urinalysis Monitoring Program represent the current state-of-the-art in the field for a
routine plutonium bioassay program.
20
60
100
140
180
20 60 100 140 180Measured Value
(239Pu, μBq)
Certified Value(239Pu, μBq)
ANSI N13.30 Performance Criteria Bias (-25% to 50%) = 1.1%
Precision (< or = 40%) = 6.8%
Figure 7. Analyses of externally prepared natural matrix spiked quality control performance evaluation test samples (2001-2006) prepared by the Oak Ridge National Laboratory.
Plutonium Urinalysis Monitoring on Enewetak
Individual measurement data from the Marshall Islands Plutonium Urinalysis Monitoring
Program on Enewetak Atoll are available on the Marshall Islands web site
(http://eed.llnl.gov/mi/).
The bioassay sampling program on Enewetak Atoll has involved 5 periodic sample
collections of 40 to 50 volunteers between 2001 and 2005, and a small number of
subsequent follow-up collections. At the request of the Enewetak-Ujelang Atoll Local
Government priority was given to collecting bioassay samples from three main cohort
groups; (1) agricultural workers, (2) Enewetak residents born during the 1940-50s; and
(3) Enewetak residents born during the early 1980s and who have mostly lived at
Enewetak Atoll. Some additional bioassay samples were collected through 2006 in order
to investigate occurrences related to measurement data that either failed outlier tests
members of the public] resulting in a committed dose. Accordingly, these future
transformations will commit additional dose to the individual according to the biological
half-life of the radioactive element of concern. For this reason, it is considered
appropriate and conforming with the national and international recommendations of the
U.S EPA and the International Commission on Radiological Protection (ICRP) that this
additional dose commitment be assigned to the year of measurement. Consequently,
dose reports issued under the Marshall Islands Radiological Surveillance Program are
based on the Committed Effective Dose Equivalent (CEDE).
Dosimetric Methodology
The calendar year dose represents the sum of radionuclide-specific, age-dependent,
committed effective dose equivalent for each monitored radionuclide. The total calendar
year dose is calculated over a calendar year but only applies to the sum of the
committed dose from cesium-137 and the 50-y integrated dose from plutonium (based
on a time integral of any whole body counting and any available plutonium bioassay
measurements performed during that year). When only one radionuclide is measured,
the total dose assigned in a year and the CEDE for a specific radionuclide are identical.
When more than one radionuclide is measured, the total annual ‘calendar year’ dose is
the sum on the CEDE for each measured radionuclide. The calendar year dose
estimates based on whole body counting and plutonium bioassay are conservative in
nature, especially in relation to committed dose contributions from plutonium, but
exclude dose contributions from external radiation exposure and from other internally
deposited radionuclides such as strontium-90 (refer Daniels et al., 2007).
For comparison, the Marshall Islands Nuclear Claims Tribunal has established a
standard of 0.15 mSv (15 mrem) per year (EDE) for cleanup and rehabilitation of
radioactively contaminated sites in the northern Marshall Islands.
PROVIDING FOLLOW-UP ON RESULTS
All volunteers participating in the Marshall Islands Radiological Surveillance Program are
issued a preliminary copy of their dose report immediately after receiving a whole body
count. Scientists from the Lawrence Livermore National Laboratory verify the
measurement data and, if required, issue a revised measurement dose report.
Statistically significant individual whole body counter or plutonium bioassay
measurement data that yield computed doses of 10 mrem (0.1 mSv) or higher will
29
normally evoke some type of pre-determined action or investigation (refer to the
discussion outline below). These actions will nearly always lead to follow-up verification
measurements but may also include a dietary evaluation and/or a work history review.
Below the 10 mrem level, default assumptions for assigning doses (Daniels et al., 2007)
are assumed to be valid and no further action is taken. Data may be withheld from the
web site or hard copy reports while these investigations are on-going. The Lawrence
Livermore National Laboratory Marshall Islands Program action level (10 mrem) is one-
tenth of the investigation level used for occupational workers throughout the United
States Department of Energy and two-thirds of the United States Environmental
Protection Agency guideline for cleanup of radioactively contaminated sites (i.e., 15
mrem). In addition, at the end of each calendar year, all program volunteers receive a
formal written report containing an estimate of their ‘calendar year dose’ based on all
available verified data for that year. Program volunteers are also invited to discuss their
concerns with local technicians and/or to contact Dr. Terry Hamilton at Lawrence
Livermore National Laboratory for more information.
Due to the very conservative nature of our dose methodology and preference not to
trivialize doses no matter what the level, we anticipate that the default assumptions for
calculating committed doses from low-level plutonium bioassay measurements will
occasionally yield values that exceed the 10 mrem investigation level. In some cases,
doses in excess of 10 mrem will not necessarily evoke a follow-up response. The
reasoning for this is that the low-level plutonium bioassay measurements usually contain
a relatively large uncertainty where the confidence level (nominally tested at 3 ×
measurement MDA) spans the investigation action level. As such, dose estimates are
computed for all the measurement data but the scope of any follow-up action may be
limited to those sample analyses that are clearly distinguishable from the measurement
MDA or upon receiving specific requests from concerned individuals.
30
ACKNOWLEDGMENTS
This work was performed under the auspices of the U.S. Department of Energy by the University of California, Lawrence Livermore National Laboratory under contract No. W-7405-Eng-48. We thank our sponsors at the U.S. Department of Energy, Office of International Health Studies, and acknowledge the cooperative efforts of local atoll leaders and their representatives in supporting the development and implementation of this program. We also wish to acknowledge and thank our Marshallese technicians for their valued contribution in support of the Marshall Islands whole body counting and plutonium bioassay programs.
Figure 10. Enewetak whole body counting technicians, Mr. Kosma Johannes (left) and Mr. Donald Henry (right), pictured with Subject Matter Expert, Dr. David Hickman, from the Lawrence Livermore National Laboratory (second from right) and local Enewetak resident, Mr. Yose Iban.
31
REFERENCES
Bell, R.T., D. Hickman, L. Yamaguchi, W. Jackson, and T. Hamilton (2002). A whole body counting facility in a remote Enewetak Island Setting, The Radiation Safety Journal, 83 (suppl. 1), S22-S26.
Boecker, B.B., R. Hall, K. Inn, J. Lawrence, P. Ziemer, G. Eisle, B. Wachholtz, and W. Bunn, Jr. (1991). Current status of bioassay procedures to detect and quantity previous exposures to radioactive materials, Health Phys., 60, 45–100.
Bogen, K.T., T.F. Hamilton, T. A. Brown, R.E. Martinelli, A.A. Marchetti, S.R. Kehl, and R.G. Langston (2006). A Statistical Basis for Interpreting Urinary Excretion of Plutonium Based on Accelerator Mass Spectrometry (AMS) Data from the Marshall Islands, Lawrence Livermore National Laboratory, Livermore CA, UCRL-MI-230705.
Brown, T.A., A.A. Marchetti, R.E. Martinelli, C.C. Cox, J.P. Knezovich, and T.F. Hamilton (2004). Actinide Measurements by Accelerator Mass Spectrometry at Lawrence Livermore National Laboratory, Nucl. Instr. Meth. B223-224, 788–793.
Conard R.A. (1992). Fallout: The experiences of a medical team in care of a Marshallese population accidentally exposed to fallout radiation, Brookhaven National Laboratory, Report BNL-46444, Upton NY.
Daniels, J.I., D.P. Hickman, S.R. Kehl, and T.F. Hamilton (2007), Estimation of Radiation Doses in the Marshall Islands Based on Whole Body Counting of Cesium-137 (137Cs) and Plutonium Urinalysis, Technical Basis Document, Lawrence Livermore National Laboratory, Livermore CA, UCRL-TR-231680.
Defense Nuclear Agency (1981). The Radiological Cleanup of Enewetak Atoll. Defense Nuclear Agency: Washington DC, 700pp.
DOE (1982). Enewetak Radiological Support Project, NVO-213, United States Department of Energy (DOE), Nevada Operation Office, Nevada, 158 pp.
Greenhouse N.A., P.P. Miltenberger, and E.T. Lessard (1980), Dosimetric results for the Bikini population, Health Phys., 38, 845–851.
Hamilton, T.F., T.A. Brown, D.P. Hickman, A.A. Marchetti, R.E. Martinelli, and S.R. Kehl (2004). Low-Level Plutonium Bioassay Measurements at the Lawrence Livermore National Laboratory, Lawrence Livermore National Laboratory, Livermore CA, UCRL-MI-232208.
32
Hamilton, T.F., T.A. Brown, R.E. Martinelli, S.R. Kehl, A.A. Marchetti, S.J. Tumey, and R.G. Langston (2007). Low-Level Detection of Plutonium Isotopes in Bioassay Samples from the Marshall Islands using Accelerator Mass Spectrometry, Health Phys. (in preparation).
ICRP (1977). International Commission on Radiological Protection, Recommendations of the International Commission on Radiological Protection, ICRP Publication 26, Annuals of the ICRP 3(1−4), Elsevier Science, New York.
ICRP (1991). International Commission on Radiological Protection, 1990 Recommendations of the International Commission on Radiological Protection, ICRP Publication 60, Annuals of the ICRP 21(1−3), Elsevier Science, New York.
ISP (2005). Annual Performance Evaluation 2005 Whole Body Count, Intercomparison Studies Program (ISP), Oak Ridge National Laboratory, Oak Ridge, Tennessee.
Kehl, S.R., T.F. Hamilton, T.M. Jue, D.P. Hickman (2007). Performance Evaluation of Whole Body Counting Facilities in the Marshall Islands (2002-2005), Lawrence Livermore National Laboratory, Livermore CA, UCRL-TR-229724.
Lessard, E.T., R.P. Miltenburger, S.H. Cohn, S.V. Musolino, and R.A. Conrad (1984). Protacted exposure to fallout: the Rongelap and Utirik experience, Health Phys., 46, 511–527.
Marchetti, A.A., T.A. Brown, J.E. McAninch, J. Brunk, C.C. Cox, R. Martinelli, J.P. Knezovich, and T.F. Hamilton (2002). Measurements of Plutonium Isotopes in Urine at MicroBecquerel Levels: AMS Results of a NIST Interlaboratory Exercise, Lawrence Livermore National Laboratory, Livermore CA, UCRL-ID-147972.
McCurdy, D., Z. Lin, K. Inn, R. Bell, S. Wagner, D. Efurd, T. Hamilton, T. Brown, and A. Marchetti (2005). Second Inter-Laboratory comparison Study for the Analysis of 239Pu in Synthetic Urine at the microBecquerel (~100 aCi) Level by Mass Spectrometry, J. Radioanal. Nuc. Chem., 263(2), 447–455.
Miltenberger, R.P., E.T. Lessard, and N.A. Greenhouse (1981). Cobalt-60 and cesium-137 long-term biological removal rate constants for the Marshallese population, Health Phys., 40, 615–623.
MOU (2000). Memorandum of Understanding by and between the Republic of the Marshall Islands, the Enewetak/Ujelang Atoll Local Government Council, and the U.S. Department of Energy, Office of Environmental Safety and Health.
National Research Council (2004), Radiological Assessments for Resettlement of Rongelap in the Republic of the Marshall Islands, National Research Council, National Academy Press, Washington DC, 108 pp.
NCRP (2004). Approaches to Risk Management in Remediation of Radioactively Contaminated Sites, National Council on Radiation Protection and Measurement, NCRP Report No. 146, Bethesia, MD 20814, 280 pp.
33
NRC (1994). U.S. Nuclear Regulatory Commission. “10CRF part 20⎯Standards for protection against radiation,” Proposed rule, 59 FR 43200, U.S. Government Printing Office, Washington DC.
Robison W.L., V.E. Noshkin, C.L. Conrado, R.J. Eagle, J.L. Brunk, T.A. Jokela, M.E. Mount, W.A. Phillips, A.C. Stoker, M.L. Stuart, S.E. Thompson, and K.M. Wong (1997a). The northern Marshall Islands radiological survey: data and dose assessments, Health Phys., Vol. 73(1), 37–48.
Robison W.L., K.T. Bogen, and C.L. Conrado (1997b). An updated dose assessment for resettlement options at Bikini Atoll-a U.S. nuclear test site, Health Phys., Vol. 73(1), 100–114.
Robison W.L., M.E. Mount, W.A. Phillips, M.L. Stuart, S.E. Thompson, C.L. Conrado, and A.C. Stoker (1982). An updated radiological dose assessment of Bikini and Eneu Islands at Bikini Atoll, Lawrence Livermore National Laboratory, Livermore CA, UCRL-53225.
Robison W.L., W.A. Phillips, M.E. Mount, B.R. Clegg, and C.L. Conrado (1980). Reassessment of the potential radiological doses for residents resettling Enewetak Atoll, Lawrence Livermore National Laboratory, Livermore CA, UCRL-53066.
Sun L.C., J.H. Clinton, E. Kaplan, and C.B. Meinhold (1997c). 137Cs exposure in the Marshallese populations: An assessment based on whole body counting measurements (1989-1994), Health Phys., 73(1), 86–99.
Sun L.C., C.B. Meinhold, A.R. Moorthy, E. Kaplan, and J.W. Baum (1997b). Assessment of plutonium exposure in the Enewetak population by urinalysis, Health Phys., 73(1), 127–132.
Sun L.C., A.R. Moorthy, E. Kaplan, J.W. Baum, and C.B. Meinhold (1995). Assessment of plutonium exposures in Rongelap and Utrik populations by fission tracks analysis of urine, Applied Radiat. Isotopes, 46, 1259–1269.
Sun L.C., C.B. Meinhold, A.R. Moorthy, J.H. Clinton, and E. Kaplan (1992). Radiological dose assessments in the Northern Marshall Islands (1989-1991), In: Proceedings of the Eighth International Congress of the International Radiation Protection Association (IRPA-8), Vol. II, IRPA, BNL-45868, 1320–1323.
United States Department of Energy (USDOE) (2000), United States Nuclear Tests: July 1945 through September 1992, United States Department of Energy, Nevada Operations Office, Las Vegas, NV, DOE/NV–209-REV.
34
GLOSSARY OF TERMS
Absorbed Dose
The absorbed dose is the energy deposited in an organ or tissue per unit mass of irradiated material. The common unit for absorbed dose is the rad, which is equivalent to 100 egs per gram of material. The international scientific community has adopted the use of different terms. The International System (SI) unit of absorbed dose is the joule per kilogram (J kg−1) and its special name is the gray (Gy). One Gy is the same as 100 rad.
Activity
Activity is the rate of transformation or decay of a radioactive material. The International System (SI) unit of activity is the reciprocal second (s−1) and its special name is the Becquerel. Federal and state agencies in the United States use conventional units where activity is expressed in curies (Ci); 1 Ci = 3.7 x 10¹⁰ Bq.
Alpha Particles
Alpha particles are one of the primary types of radiation associated with radioactivity and exist as energetic nuclei of helium atoms, consisting of two protons and two neutrons. Alpha rays are heavy, slow moving charged particles that travel only 2 to 5 cm in air, and can be stopped by a piece of paper or the outer dead layer of human skin.
Background Radiation The average person in the United States receives about 3.6 mSv (360 mrem) of ionizing radiation every year. About 3 mSv (300 mrem) per year comes from natural background radiation including cosmic radiation and radiation emitted by naturally occurring radionuclides either in the environment (e.g., in air, water, soil and rock) or deposited in tissues inside the body. The other 0.60 mSv (60 mrem) is derived from man-made sources such as exposures to diagnostic X-rays, and consumer products such as smoking tobacco. The general worldwide contribution from radioactive fallout contamination is <0.3% of the average total annual effective dose. Exposures to natural background radiation vary depending on the geographic area, diet and other factors such as the composition of materials used in the construction of homes. The natural background radiation dose in the Marshall Islands is around 1.4 mSv (140 mrem) per year and is significantly less than what most people receive in most other parts of the world.
Baseline
We have all been exposed to some level of worldwide fallout contamination. In the United States, the general population receives up to 0.015 mSv (1.5 mrem) (0.3% of the average total annual effective dose) from exposure to worldwide fallout contamination resulting from atmospheric nuclear weapons testing and about 0.005 mSv (0.5 mrem) (or 0.1% of the average total annual effective dose) from operations related to nuclear power generation. Similarly, people living in the Marshall Islands will have very small quantities of internally deposited fallout radionuclides such as cesium-137, strontium-90 and plutonium in their bodies from worldwide contamination of food, air, water and soil.
35
Assessments of possible increases in radiation exposure from elevated levels of fallout contamination in the northern Marshall Islands can only be made on the basis of comparisons with residual systemic burdens of radionuclides acquired from previous exposures. Under the Marshall Islands Radiological Surveillance Program, efforts are being made to improve on the reliability of measurements of systemic plutonium in Marshallese populations using state-of-the-art methodologies in bioassay against which the results of future bioassay measurements can be compared to accurately assess the impacts of resettlement on radiation exposure and dose.
Becquerel (Bq)
A Becquerel (abbreviated as Bq) is the International System (SI) unit for activity of radioactive material. One Bq of radioactive material is that amount of material in which one atom is transformed or undergoes one disintegration every second. Whole body counting and plutonium bioassay measurements are usually reported in activity units of kBq (kiloBecquerel) (1000 Bq) and μBq (microBecquerel) (1×10⁻⁶ Bq), respectively.
Biokinetic
The word ‘biokinetic’ is used here to describe the absorption (uptake), distribution and retention of elements in humans.
Calibration
Calibration is the process of adjusting or determining the response or reading of an instrument to a standard.
Committed Dose Equivalent
The committed dose equivalent is the time integral of the dose-equivalent rate in a particular tissue that will be received by an individual following an intake of radioactive material into the body by inhalation, ingestion or dermal absorption. For adults, the committed dose is usually the dose received over 50 years. For children, the committed dose is usually calculated from the age of intake to age 70 years. For these age groups the term ‘integrated dose equivalent’ is used.
Committed Effective Dose Equivalent (CEDE)
The committed dose equivalents to various tissues or organ in the body each multiplied by an appropriate tissue-weighing factor and then summed. The conventional unit for committed effective dose equivalence (CEDE) used by federal and state agencies within the United States is the rem. The international scientific (SI) unit of committed effective dose equivalent is called a sievert (Sv). One Sv is the same as 100 rem. Chronic doses are usually reported in units of mSv (1×10⁻³ Sv) or mrem (1×10⁻³ rem)
36
Critical Level
The amount of a count (Lc) or final measurement of a quantity of an analyte at or above which a decision is made that the analyte is definitely present above background levels (Lc ≈ MDA/2).
Default Assumptions (used in assignment of dose)
The largest dose contributions attributable to exposure to residual nuclear fallout contamination in the Marshall Islands result from either internal exposure from intakes of radionuclides through ingestion, inhalation and/or absorption through the skin or external exposure from radionuclides distributed in the soil. External exposure rates can be measured directly using instrument surveys of the radiation field. The assignment of dose to internally deposited radionuclides is much more complicated. Biokinetic and dosimetric models developed by the International Commission on Radiological Protection (ICRP) are used to convert whole body burdens (from whole body counting or from in vitro bioassay tests such as urinalysis) into dose. In the case of chronic exposure, organ and body burdens continue to build up over time until a steady state is reached, and where losses due to decay and excretion are balanced by intake and absorption. Cesium-137 has an effective half-life in an adult of about 110 days, and under chronic exposure conditions reaches a maximal dose contribution after about 2 years. By contrast, plutonium absorbed from the gastrointestinal or respiratory tract enters the blood stream and deposits in liver and bone with an effective half-life of 20 to 50 years. Only a small fraction of plutonium entering the blood stream is excreted in urine with the long-term excretion rate approaching 2 x 10⁻⁵ of the systemic body burden per day. Knowledge of excretion rates and time of exposure are important when interpreting urinalysis data. A more detailed discussion of the dose calculation methodology employed under the Marshall Islands is given elsewhere (see under Daniels et al., 2007).
Direct bioassay
The measurements of radioactive material in the human body utilizing instrumentation that detects radiation emitted from radioactive material in the body (synonymous with in vivo measurements).
Dose Assessment
The scientific process used to determine radiation dose and uncertainty in the dose.
Dose Equivalent
The dose equivalent is the adsorbed dose at a point in tissue multiplied by a biological effectiveness factor or quality factor for the particular types of radiation to cause biological damage. The conventional unit of dose equivalents used by federal and state agencies in the United States is the rem. A 100 rem dose to an adult will normally produce some clinical signs of radiation sickness and requires hospitalization. The International System (SI) unit for dose equivalent is the joule per kilogram (J kg−1) and is called the sievert (Sv). One Sv is equal to 100 rem.
37
Effective Dose (ICRP 60)
The sum of the equivalent dose over specified organs and tissues weighted by the tissue weighing factor (ICRP, 1991). Supersedes the effective dose equivalent in ICRP and NCRP recommendations but is not used in current U.S. regulations.
Effective Dose Equivalent (ICRP 26)
The effective dose equivalent for the whole body is the sum of dose-equivalents for various organs in the body weighted to account for different sensitivities of the organs to radiation. It includes the dose from radiation sources internal and/or external to the body. Superseded by the effective dose in ICRP and NCRP recommendations but often used in current U.S. regulations. The effective dose equivalent is usually expressed in units of millirem (mrem). The International System (SI) unit for dose equivalent is the joule per kilogram (J kg−1) and is called the sievert (Sv). One Sv is the same as 100 rem.
Dose (exposure) Assessment
A quantification of the magnitude, duration and timing of radiation exposures, and the resulting doses from such exposures, based on all possible types of radiological agents involved and their primary pathways and routes of exposure.
Exposure Pathway
The physical route a hazardous substance takes in leading to the exposure of an organism.
External Dose or Exposure or Radiation
That portion of the dose equivalent delivered by ionizing radiation originating from a source outside the body of an organism (e.g., also know as direct radiation).
Fission Track Analysis
During neutron irradiation heavy nuclei such as uranium and plutonium undergo nuclear fission with release of large fission fragments. This property has led to the development of a number of measurement techniques such as delayed neutron activation analysis and fission track analysis. Fission track analysis is a measurement technique commonly employed in plutonium urinalysis (bioassay) monitoring programs. Urine samples are chemically treated to remove plutonium. The plutonium is then mounted in contact with a special plastic or quartz slide known as solid-state nuclear track detector (SSNTD). The slide along with the sample is then irradiated in a reactor where neutron-induced fission of plutonium-239 (or uranium-235) causes emission of energetic fission fragments. Some of the fragments penetrate into the SSNTD damaging the integrity of the material before coming to rest. The SSNTD is separated from the sample and chemically etched to expose the damaged areas (known as fission tracks) on the detector surface. The fission tracks are then counted under an optical microscope. The amount of plutonium (and/or uranium) present in the sample is a function of the total number of tracks generated and the total irradiation neutron flux.
38
Gamma-rays
Gamma-rays are electromagnetic waves produced by spontaneous decay of radioactive elements during de-excitation of an atomic nucleus. Sunlight also consists of electromagnetic waves but gamma-rays have a shorter wavelength and much higher energy. High-energy gamma-rays such as those produced by decay of cesium-137 may penetrate deeply into the body and affect cells. Gamma-rays from a cobalt-60 source are often used for cancer radiotherapy.
Half-life
The time taken for the activity of a radionuclide to halve as a result of radioactive decay. Also used in more general terms to indicate the time taken for the quantity of a specified radionuclide in a specified place to halve as a result of any specified process or processes that follow similar exponential patterns (e.g., biological half-life or effective half-life).
High-End Health Risk
Use of the term ‘high-end health risk’ usually relates to the maximally exposed individuals in a population.
In-Vito
In vitro measurements are synonymous with indirect bioassay techniques, such as plutonium urinalysis.
In-Vivo
In vivo measurements are synonymous with bioassay techniques, such as whole body counting.
Indirect bioassay
Measurements to determine the presence of and/or the amount of a radioactive material in the excreta, urine or in other biological materials removed from the body (synonymous with in vitro measurements).
Individual
An individual is any human being.
Internal Dose or Exposure or Radiation
That portion of the dose equivalent delivered by ionizing radiation originating from a radiation source inside the body of an organism (e.g., from intakes of radionuclides by ingestion, inhalation or dermal adsorption).
Isotope
Atoms with the same number of protons but different numbers of neutrons are called isotopes of that element. We identify different isotopes by appending the total number of nucleons (the total number of proton plus neutrons in the nucleus of an atom) to the name of the element, e.g., cesium-137. Isotopes are usually written in an abbreviated form using the chemical symbol of the element. Two examples include 137Cs for cesium-137 and 239Pu for plutonium-239.
39
Minimum Detectable Amount (MDA)
The minimum detectable amount (MDA) is the smallest activity or mass of an analyte in a sample or person that can be detected with an acceptable level of uncertainty.
Quality Assurance
All those planned and systematic actions necessary to provide adequate confidence that an analysis, measurement or surveillance program will perform satisfactorily.
Quality Control
Those actions that control the attributes of an analytical process, system or facility according to predetermined quality requirements.
Radiation Dose (or mrem)
A generic term to describe the amount of radiation a person receives. Dose is measured in units of thousands of a roentegen equivalent man (rem). The millirem (normally abbreviated as mrem) is the preferred unit used by federal and state agencies in the United States. Dose is a general term used in the general field of radiological protection. The common International System (SI) unit for dose is the millisievert (mSv). One mSv is the same as 100 mrem.
Radiological Monitoring (Monitoring)
Radiological monitoring is the measurement of radiation levels or individual doses, and the use of the results to assess radiological hazards in the environment or workplace, or the potential and actual doses resulting from exposures to ionizing radiation.
Radioactivity
A natural and spontaneous process by which unstable atoms of an element emit energy and/or particles from their nuclei and, thus change (or decay) to atoms of a different element or a different state of the same element.
Remediation
Remediation is the actions taken to reduce risks to human health or the environment posed by the presence of radioactive or hazardous materials.
Risk
The probability of harm from the presence of radionuclides or hazardous materials taking into account (1) the probability of occurrences or events that could lead to an exposure, (2) probability that individual or populations would be exposed to radioactive or hazardous materials and the magnitude of such exposures, and (3) the probability that an exposure would produce a response.
40
Total Effective Dose Equivalent (TEDE)
The sum of the deep-dose equivalent (for external exposures) and the committed effective dose equivalent for external from intakes of radionuclides as described by the U.S. Nuclear Regulatory Commission under 10 CFR Part 20.1003.
Validation
Defining the process of the method capability and determining whether it can be properly applied as intended.
Whole Body
For the purposes of external exposure includes the head, trunk, the arms above and including the elbow, and legs above and including the knee.
*******************
41
GENERAL STAFF PUBLICATIONS, PRESENTATIONS & INTERNAL REPORTS ARCHIVE (2002-2007)
Hamilton, T.F. (2007). What can low-level plutonium bioassay measurements do for you? Invited presentation, CIEMAT visit to the Lawrence Livermore National Laboratory, 30 April 2007, Lawrence Livermore National Laboratory, Livermore CA, UCRL-PRES-231910.
Hamilton, T.F., S.R. Kehl, T.A. Brown, R.E. Martinelli, D.P. Hickman, T.M. Jue, S.J. Tumey, and R.G. Langston (2007). Individual Radiological Protection Monitoring of Utrōk Atoll Residents Based on Whole Body Counting of Cesium-137 (137Cs) and Plutonium Bioassay, Lawrence Livermore National Laboratory, Livermore CA, UCRL-MI-231678.
Brunk, J.L., S.R. Kehl, and T.F. Hamilton (2007), Bikini Island Geographical Information System (GPS) Sample Site Mapping, Field Operations Report (February-March 2006), Lawrence Livermore National Laboratory, Livermore CA, UCRL-MI-231650.
Brunk, J.L., S.R. Kehl, and T.F. Hamilton (2007), Rongelap Island Information Positioning System (GPS) Sample Site Mapping, Field Operations Report (March 2006), Lawrence Livermore National Laboratory, Livermore CA, UCRL-MI-231660.
Buchholz, B.A., T.A. Brown, T.F. Hamilton, I.D. Hutcheon, A.A. Marchetti, R.E. Martinelli, E.C. Ramon, S.J. Tumey, and R.W. Williams (2007). Investigating Uranium Isotopic Distributions in Environmental Samples Using AMS and ICPMS. Nucl. Instrum. Methods Phys. Res., Section B, 259, 733-738.
Hamilton, T.F., S.R. Kehl, D.P. Hickman, T.A. Brown, R.E. Martinelli, S.J. Tumey, T.M. Jue, B.A. Buchholz, R.G. Langston, S. Langinbelik, and E. Arelong (2007). Individual Radiation Protection Monitoring in the Marshall Islands: Rongelap Atoll (2005–2006), Lawrence Livermore National Laboratory, Livermore CA, UCRL-TR-231414.
Hamilton, T.F., S.R. Kehl, D.P. Hickman, T.A. Brown, R.E. Martinelli, S.J. Tumey, T.M. Jue, B.A. Buchholz, R.G. Langston, K. Johannes, and D. Henry (2007). Individual Radiation Protection Monitoring in the Marshall Islands: Enewetak Atoll (2005–2006), Lawrence Livermore National Laboratory, Livermore CA, UCRL-TR-231397.
Hamilton, T.F., S.R. Kehl, D.P. Hickman, T.A. Brown, R.E. Martinelli, S.J. Tumey, T.M. Jue, B.A. Buchholz, R.G. Langston, S. Tibon, and L. Chee (2007). Individual Radiation Protection Monitoring in the Marshall Islands: Utrōk Atoll (2005–2006), Lawrence Livermore National Laboratory, Livermore CA, UCRL-TR-231415.
Kehl, S.R., T.F. Hamilton, T.M. Jue, D.P. Hickman (2007). Performance Evaluation of Whole Body Counting Facilities in the Marshall Islands (2002−2005), Lawrence Livermore National Laboratory, Livermore CA, UCRL-TR-229724.
42
Hamilton, T.F. (2007). DOE-RMI Marshall Islands Program Review Briefing, Invited presentation, Annual DOE-RMI Meeting on the Marshall Islands Program, Majuro 2526 April 2007, Lawrence Livermore National Laboratory, Livermore CA, UCRL-PRES-230112.
Robison, W.L., T.F. Hamilton, K.T. Bogen, C.L. Conrado, and S.R. Kehl (2007). 137Cs Inter-Plant Concentration Ratios for Tree Food Crops on Atolls Provide a Tool for Dose Predictions with Distinct Benefits Over Transfer Factors, Submitted J. Environ. Radioact., April 2007.
Bogen, K.T., T.F. Hamilton, T. A. Brown, R.E. Martinelli, A.A. Marchetti, S.R. Kehl, and R.G. Langston (2006). A Statistical Basis for Interpreting Urinary Excretion of Plutonium Based on Accelerator Mass Spectrometry (AMS) Data from the Marshall Islands, Lawrence Livermore National Laboratory, Livermore CA, UCRL-MI-230705.
Daniels, J.I., D.P. Hickman, S.R. Kehl, and T.F. Hamilton (2007), Estimation of Radiation Doses in the Marshall Islands Based on Whole Body Counting of Cesium-137 (137Cs) and Plutonium Urinalysis, Technical Basis Document, Lawrence Livermore National Laboratory, Livermore CA, UCRL-TR-231680.
Hamilton T.F., T.A. Brown, and R.L. Newmark (2006). A Systematic Baseline Study of Internally Deposited Plutonium in Agricultural Workers and Local Residents of Palomares (Almeria District), Spain, Project Pre-Proposal, Lawrence Livermore National Laboratory CA, UCRL-PROP-225310. Hamilton,T.F., T.A Brown, G. Bench, B.A. Buchholz, and K.W. Turteltaub (2006). Baseline Measurements of Internally Deposited Radionuclides in the U.S. Population, Project Pre-Proposal, Lawrence Livermore National Laboratory CA, UCRL-PROP-225308.
Hamilton,T.F., S.R. Kehl, D.P. Hickman, T.A. Brown, A.A. Marchetti, R.E. Martinelli, E. Arelong, and S. Langinbelk (2006), Individual Radiation Protection Monitoring in the Marshall Islands: Rongelap Atoll (2002–2004), Lawrence Livermore National Laboratory, Livermore CA, UCRL-TR-220590.
Hamilton,T.F., S.R. Kehl, D.P. Hickman, T.A. Brown, A.A. Marchetti, R.E. Martinelli, K. Johannes, and D. Henry (2006). Individual Radiation Protection Monitoring in the Marshall Islands: Enewetak Atoll (2002–2004), Lawrence Livermore National Laboratory, Livermore CA, UCRL-TR-220591.
Hamilton, T.F., S.R. Kehl, D.P. Hickman, T.A. Brown, A.A. Marchetti, R.E. Martinelli, S. Tibon, and L. Chee (2006). Individual Radiation Protection Monitoring in the Marshall Islands: Utrōk Atoll (2003–2004), Lawrence Livermore National Laboratory, Livermore CA, UCRL-TR-220654.
Hamilton, T.F. (2006). FY2005 Operational Activities in Support of the Marshall Islands Program, Lawrence Livermore National Laboratory, Livermore CA, UCRL-PRES-219263.
43
Hamilton, T.F. (2006). Marshall Islands Program Briefing, Lawrence Livermore National Laboratory, Livermore CA, UCRL-PRES-219265.
Hamilton, T.F. (2006). Plutonium Isotope Measurements in the Marshall Islands, Lawrence Livermore National Laboratory, Livermore CA, UCRL-PRES-221266.
Hamilton, T.F. (2006). Marshall Islands Program Logo, Lawrence Livermore National Laboratory, Livermore, CA, UCRL-MI-220556.
Hamilton, T.F. (2006). Radiological Surveillance Measures in Support of the Rongelap Atoll Resettlement Program, Lawrence Livermore National Laboratory, Livermore CA, UCRL-PRES-220893.
Hamilton, T.F. (2006). Continuation of the Marshall Islands Dose Assessment and Radioecology Program, Lawrence Livermore National Laboratory, Livermore CA, UCRL-PRES-220894.
Hamilton, T.F. (2006). Marshall Islands Program Advertisement, Lawrence Livermore National Laboratory, Livermore CA, UCRL-POST-221208.
Hamilton, T.F. (2006). Marshall Islands Program Advertisement, Lawrence Livermore National Laboratory, Livermore, CA, UCRL-POST-MI-220556.
Hamilton, T.F., and S.R. Kehl (2006), Marshall Islands Program Web Site, Lawrence Livermore National Laboratory, Livermore CA, UCRL-WEB-220536; URL: http://eed.llnl.gov/mi/.
Hamilton, T.F., R.E. Martinelli, S.K. Kehl, and J.L. Brunk (2006). Preconcentration of Cesium-137 (137Cs) from Large Volume Water Samples Using Zirconium Ferrocyanide Embedded on Cartridge Water Filters, Methods and Applications of Radioanalytical Chemistry, Kailue-Kona, HI, April 3–7, 2006, Lawrence Livermore National Laboratory, Livermore CA, UCRL-ABS-217452.
Hamilton, T.F., D. Dasher, T.A. Brown, A.A. Marchetti, R.E. Martinelli, and S.R. Kehl (2006), Measurements of Plutonium Activity Concentrations and 240Pu/239Pu Atom Ratios in Brown Algae (Fucus distichus) Collected from the Littoral Zone of Amchitka Island Using Accelerator Mass Spectrometry (AMS), Methods and Applications of Radioanalytical Chemistry, Kailue-Kona, HI, April 3–7, 2006, Lawrence Livermore National Laboratory, Livermore CA, UCRL-ABS-217453.
Jernström J., M. Eriksson, R. Simon, G. Tamborini, O. Bildstein, R. Carlos Marquez, S.R. Kehl, T.F. Hamilton, Y. Ranedo, and M. Betti (2006), Characterization and Source Term Assessments of Radioactive Particles From Marshall Islands Using Non-Destructive Analytical Techniques, Spectrochim. Acta, Part B, 61, 971−979.
Jernstrom, J., M. Erilsson, R. Simon, G Tamborini, O. Bildstein, R. Carlos Marquez, S.R. Kehl, M. Betti, and T.F. Hamilton (2006), Characterization and Source Term Assessments of Radioactive Particles from Marshall Islands Using Non-Destructive Analytical Techniques, Presented at the Technical Meeting on Analytical Methods for Characterization of Hot Particles & their Impact on Environment, March 610, 2006, ICTP, Trieste, Italy. Lawrence Livermore National Laboratory, Livermore CA, UCRL-PRES-220343.
Martinelli, R.E., T.F. Hamilton, T.A. Brown, A.A. Marchetti, R.W. Williams, and S.J. Tumey (2006). Isolation and Purification of Uranium Isotopes for Measurement by Mass-Spectrometry (233, 234, 235, 236, 238U) and Alpha-Spectrometry (232U), Lawrence Livermore National Laboratory CA, UCRL-TR-232228.
Robison, W.L., T.F. Hamilton, R.E. Martinelli, F.J. Gouveia, T.R. Lindman, and S.C. Yakuma (2006). The Concentration and Distribution of Depleted Uranium (DU) and Beryllium (Be) in Soil and Air on Illeginni Island at Kwajalein Atoll, Lawrence Livermore National Laboratory, Livermore CA, UCRL-TR-222048.
Robison, W.L., T.F. Hamilton, C.L. Conrado, and S. Kehl (2006). Uptake of cesium-137 by leafy vegetables and grains from calcareous soils, In: Proceedings of a final research coordination meeting organized by the Joint FAO/IAEA Programme of Nuclear Techniques in Food and Agriculture, Chania, Crete, 22-26 September 2003, IAEA-TECHDOC-1497, Classification of soil systems on the basis of transfer factors of radionuclides from soil to reference plants, IAEA June 2006, pp. 179–190.
Robison, W.L., E.L. Stone, T.F. Hamilton, and C.L. Conrado (2006). Long-Term Reduction in Cesium-137 Concentration in Foodcrops on coral Atolls Resulting from Potassium Treatment, J. Environ. Radioact, 88: 251–266.
Bogen, K.T., T.F. Hamilton, T. A. Brown, A.A. Marchetti, R.E. Martinelli, and S.R. Kehl (2005), Age-related trend in elevated 239Pu measured by AMS in urine samples collected in 1998-2003 from Enewetak residents and Rongelap resettlement workers, Livermore National Laboratory, Livermore CA, UCRL-PRES-216780.
Bogen, K.T., D.P. Hickman, T.F. Hamilton, T. A. Brown, C.C. Cox, A.A. Marchetti, and R.E. Martinelli (2005), AMS Analysis of 239Pu in archived occupational samples, Livermore National Laboratory, Livermore CA, UCRL-PRES-216781.
Bogen, K.T., T.F. Hamilton, T. A. Brown, A.A. Marchetti, R.E. Martinelli, and S.R. Kehl (2005), Age-related trend in elevated 239Pu measured by AMS in urine samples collected in 1998-2003 from Enewetak residents and Rongelap resettlement workers, Livermore National Laboratory, Livermore CA, UCRL-ABS-213685-REV-1.
45
Buchholz, B.A., T.A. Brown, T.F. Hamilton, I.D. Hutcheon, A.A. Marchetti, R.E. Martinelli, E.C. Ramon, S.J. Tumey, and R.W. Williams (2005)., Investigating Uranium Isotopic Distributions in Environmental Samples Using AMS and ICPMS, Nuclear Instruments & Methods B , Lawrence Livermore National Laboratory, Poster presented at the 10th International Conference on Accelerator Mass Spectrometry, September 5–9, 2005, Berkeley, CA.
Hamilton, T.F., (2005), FY2005 Operations Activities in Support of the Marshall Islands Program, Lawrence Livermore National Laboratory, Livermore CA, UCRL-PRES-329925.
Hamilton, T.F., (2005), Individual Dose Reporting, Lawrence Livermore National Laboratory, Livermore CA, UCRL-MI-217507.
Hamilton, T.F. (2005). Continuation of the Marshall Islands Dose Assessment and Radioecology Program, Lawrence Livermore National Laboratory, Livermore CA, UCRL-PRES-210283.
Hamilton T.F., and S.R. Kehl (2005). Individual Dose Reporting Form for the Marshall Islands Program, Lawrence Livermore National Laboratory, Livermore CA, UCRL-MI-217507.
Hamilton T.F., and R.L. Newmark (2005), HOMEWARD BOUND: Radiological Surveillance Measures in Support of Rongelap Atoll Resettlement, Lawrence Livermore National Laboratory, Livermore CA, UCRL-PRES-329925.
Hamilton, T.F., T.A. Brown, A.A. Marchetti, R.E. Martinelli, and S.R. Kehl (2005), Determination of Plutonium Activity Concentrations and 240Pu/239Pu Atom Ratios in Brown Algae (Fucus distichus) collected From Amchitka Island, Alaska, Final Report, Lawrence Livermore National Laboratory, Livermore CA, UCRL-SR-212129.
Hamilton, T.F., (2005), Preconcentration of Cesium-137 (137Cs) From Large Volume Water Samples Using Ferrocyanide Embedded on Cartridge Water Filters, Lawrence Livermore National Laboratory, Livermore CA, UCRL-ABS-217452.
Hamilton, T.F., (2005), Measurements of Plutonium Activity Concentrations and 240Pu/239Pu Atom Ratios in Brown Algae (Fucus Distichus) Collected from the Littoral Zone of Amchitka Island Using Accelerator Mass Spectrometry (AMS), Lawrence Livermore National Laboratory, Livermore CA, UCRL-ABS-217453.
Hamilton, T.F. (2005), 137Cs and 210Po in Pacific Walrus and Bearded Seal, Lawrence Livermore National Laboratory, Livermore CA, UCRL-JRNL-211213, submitted Mar. Pollut. Bull.
Hamilton, T.F. (2005), Validation Testing of Accelerator Mass Spectrometry Plutonium Bioassay Measurement Conducted at the Lawrence Livermore National Laboratory, Lawrence Livermore National Laboratory, Livermore CA, UCRL-CONF-207648.
46
Hamilton, T.F. (2005), Accelerator Mass Spectrometric Measurements of Uranium-236 Associated with Workplace Intakes of Anthropogenic Uranium, Lawrence Livermore National Laboratory, Livermore CA, UCRL-CONF-207647.
Hamilton, T.F.(2005), Radiological Surveillance Measures in Support of Rongelap Atoll Resettlement Minimizing Radiation Exposure from Residual Nuclear Fallout Contamination, Lawrence Livermore National Laboratory, Livermore CA, UCRL-POST-207541.
McCurdy, D., Z. Lin, K. Inn, R. Bell, S. Wagner, D. Efurd, T. Hamilton, T. Brown, and A. Marchetti (2005). Second Inter-Laboratory comparison Study for the Analysis of 239Pu in Synthetic Urine at the microBecquerel (~100 aCi) Level by Mass Spectrometry, J. Radioanal. Nuc. Chem., 263(2), 447–455.
Povinec, P.P., M.K. Pham, G. Barci-Funel, R. Bojanawski, T. Boshkova, W. Burnett, F. Carvalho, B. Chapeyron, I.L. Cunha, H. Dahlgaard, N. Galabov, J. Gaustaud, J.-J. Geering, I.F. Gomez, N. Green, T. Hamilton, F.L. Ibanez, M. Ibn Majah, M. John, G. Kanisch, T.C. Kenna, M. Kloster, M. Korun, L. Liong Wee Kwong, J. La Rosa, S.-H. Leee, I. Levy-Plaomo, M. Malatova, Y. Maruo, P. Michell, I.V.Murciano, R. Nelson, J.-S. Oh, B. Oregioni, G. Le Petit, H.B.L. Pettersson, A. Reineking, P.A. Smedley, A. Suckow, T.D.B. van der Struijs, P.I. Voors, K. Yoshimiza, and E. Wyse (2005). Reference Material for Radionuclides in Sediment, IAEA−384 (Fangataufa Lagoon Sediment), Lawrence Livermore National Laboratory, Livermore CA, UCRL-JRNL-218110, submitted J. of Radioanal. Nucl. Chem.
Robison, W.L., T. F. Hamilton, R. E. Martinelli, S. K. Kehl, and T.R. Lindman (2005). Concentration of Beryllium (Be) and Depleted Uranium (DU) in Marine Fauna and Sediment Samples from Illeginni and Boggerik Islands at Kwajalein Atoll, Lawrence Livermore National Laboratory, Livermore CA, UCRL-TR-210057.
Brown, T.A., A.A. Marchetti, R.E. Martinelli, C.C. Cox, J.P. Knezovich, and T.F. Hamilton (2004). Actinide Measurements by Accelerator Mass Spectrometry at Lawrence Livermore National Laboratory, Nucl. Instrum. Methods, B223−224, 788–793.
Hamilton, T.F. (2004). Radiation Fallout – Guam, Lawrence Livermore National Laboratory, Livermore, CA, UCRL-TR-204361.
Hamilton T.F. (2004). Linking legacies of the cold war to arrival of anthropogenic radionuclides in the oceans through the 20th century, In: Radioactivity in the Environment, Vol. 6, Marine Radioactivity, H.D. Livingston (editor), Elsevier Science, Amsterdam, pp. 30−87.
Hamilton, T.F., T.A. Brown, D.P. Hickman, A.A. Marchetti, R.E. Martinelli, and S.R. Kehl (2004). Low-Level Plutonium Bioassay Measurements at the Lawrence Livermore National Laboratory, Lawrence Livermore National Laboratory, Livermore CA, UCRL-MI-232208.
47
Hamilton, T.F., T.A. Brown, A.A. Marchetti, G.P. Payne, R.E. Martinelli, S.R. Kehl, R.G. Langston, and J.M. Rankin (2004). Validation Testing of Accelerator Mass Spectrometry Plutonium Bioassay Measurements Conducted at the Lawrence Livermore National Laboratory, Lawrence Livermore National Laboratory, Livermore CA, UCRL-PRES-207648.
Hamilton, T.F., T.A. Brown, A.A. Marchetti, R.E. Martinelli, A. Wood-Zika, R.W. Williams, L. Johnson-Collins, Wm.G. Mansfield, and J.P. Knezovich (2004). Accelerator Mass Spectrometric Measurements of Uranium-236 Associated with Potential Workplace Intakes of Anthropogenic Uranium, Lawrence Livermore National Laboratory, Livermore CA, UCRL-PRES-207647.
Hamilton, T.F., and W.L. Robison (2004). Overview of Radiological Conditions on Bikini Atoll, Lawrence Livermore National Laboratory, Livermore CA, UCRL-MI-208228.
Hamilton, T.F., and W.L. Robison (2004). Current Day Impact of Tracer Materials Associated with the U.S. Nuclear Test Program in the Marshall Islands, Lawrence Livermore National Laboratory, Livermore, CA, UCRL-MI-204441.
Hamilton, T.F., and W.L. Robison (2004). The effective and environmental half-life of cesium-137 at former U.S. nuclear test sites in the Marshall Islands, Lawrence Livermore National Laboratory, Livermore, CA, UCRL-MI-206535.
Robison W.L., E.L. Stone, T.F. Hamilton, and C.L. Conrado (2004). Long-term reduction in 137Cs concentrations in food crops on coral atolls resulting from potassium treatment, J. Environ. Radioactivity, 88, 251–266.
Robison W.L., E.L. Stone, and T.F. Hamilton (2004). Large plate lysimeter collection efficiency for water being transported from soil to ground water, Soil Sci., 758−764.
Bradsher, R.V., W.L. Robison, and T.F. Hamilton (2003). The Marshall Islands Dose Assessment and Radioecology Program (1974–2003): A Bibliography of Lawrence Livermore National Laboratory Staff Publications, Lawrence Livermore National Laboratory, Livermore CA, UCRL-ID-203184.
Hamilton, T.F. (2003), Radiological Conditions on Rongelap Atoll: Perspective on Resettlement of Rongelap Atoll, Lawrence Livermore National Laboratory, Livermore CA, UCRL-ID-151952.
Hamilton, T.F. (2003). Radiological Conditions on Rongelap Atoll: Recommendations for Visiting and Food Gathering on the Northern Islands of Rongelap Atoll, Lawrence Livermore National Laboratory, Livermore, CA, UCRL-ID-151953.
Hamilton, T.F. (2003), Radiological Conditions on Rongelap Atoll: Diving and Fishing on and around Rongelap Atoll, Lawrence Livermore National Laboratory, Livermore CA, UCRL-ID-151954.
48
Hamilton, T., C. Conrado, and W. Robison (2003). The LLNL Environmental Program on Bikini Island: A Status Report Related to Resettlement of the Northern Marshall Islands, Lawrence Livermore National Laboratory, Livermore CA, UCRL-MI-151707.
Hamilton, T., E. Arelong, and S. Langinbelik (2003). LLNL/DOE Individual Radiation Protection Monitoring of Rongelap Resettlement Workers During 1999–2002: An Overview, Lawrence Livermore National Laboratory, Livermore CA, UCRL-MI-150922, Rev. 1 (includes Marshallese translation).
Hamilton, T., E. Arelong, and S. Langinbelik (2003). Perspective on Resettlement of Rongelap Island, Lawrence Livermore National Laboratory, Livermore CA, UCRL-MI-151706 (includes Marshallese translation).
Robison W.L., C.L. Conrado, K.T. Bogen, and A.C. Stoker (2003). The effective and environmental half-life of 137Cs at coral islands at the former US nuclear test site, J. Environ. Radioact., 69, 207–223.
Bell, R.T., D. Hickman, L. Yamaguchi, W. Jackson, and T. Hamilton (2002). A whole body counting facility in a remote Enewetak Island setting, The Radiation Safety Journal, 83 (suppl.1), S22−S26.
Gouveia, F., R. Bradsher, J. Brunk, W. Robison, and T. Hamilton (2002), Meteorological Monitoring on Bikini Atoll: System Description and Data Summary (May 2000–April 2001), Lawrence Livermore National Laboratory, Livermore CA, UCRL-ID-147523.
Hamilton, T., K. Johannes, and D. Henry (2002). LLNL/DOE Individual Radiation Protection Monitoring of Enewetak Island Residents during 2001–2002: An Overview, Lawrence Livermore National Laboratory, Livermore CA, UCRL-MI-150970 (includes Marshallese translation).
Hamilton, T., D. Hickman, C. Conrado, T. Brown, J. Brunk, A. Marchetti, C. Cox, R. Martinelli, S. Kehl, E. Arelong, S. Langinbelik, R.T. Bell, and G. Petersen (2002), Individual Radiation Protection Monitoring in the Marshall Islands: Rongelap Island Resettlement Support (1998–2001), Lawrence Livermore National Laboratory, Livermore CA, UCRL-LR-149600.
Hamilton, T., D. Hickman, C. Conrado, T. Brown, J. Brunk, A. Marchetti, C. Cox, R. Martinelli, S. Kehl, K. Johannes, D. Henry, R.T. Bell, and G. Petersen (2002), Individual Radiation Protection Monitoring in the Marshall Islands: Enewetak Island Resettlement Support (May–December 2001), Lawrence Livermore National Laboratory, Livermore CA, UCRL-LR-149601.
Marchetti A.A., T.A. Brown, J.E. McAninch, J. Brunk, C.C. Cox, R. Martinelli, J.P. Knezovich, and T.F. Hamilton (2002). Measurements of Plutonium Isotopes in Urine at MicroBecquerel Levels: AMS Results of a NIST Interlaboratory Exercise, Lawrence Livermore National Laboratory, Livermore CA, UCRL-ID-147972.
A-1
Appendix I
Individual Radiological Surveillance Monitoring Data Based on Whole Body
Counting and Plutonium Urinalysis
The following tables provide full disclosure of measurement data developed from the whole body counting (2005-2006) and plutonium bioassay (2001-2006) program on Enewetak Atoll.
A-2
Table A1. Whole body count data from Enewetak Atoll (2005-2006).
Cs-137 (kBq) ID# Age
Type Gender Count Date value MDA
Method Code Notes
EN00002 Adult Male 12-Sep-05 0.57 ± 0.05 0.20 NaI_WBC
EN00002 Adult Male 9-Jan-06 0.45 ± 0.04 0.18 NaI_WBC
EN00002 Adult Male 27-Sep-06 0.50 ± 0.04 0.17 NaI_WBC
EN00003 Adult Male 24-May-06 0.19 ± 0.04 0.16 NaI_WBC
EN00003 Adult Male 11-Dec-06 0.39 ± 0.05 0.24 NaI_WBC
EN00004 Adult Male 27-Jan-05 0.07 ± 0.02 0.10 NaI_WBC
EN00004 Adult Male 8-Apr-05 0.00 ± 0.00 0.06 NaI_WBC
EN00004 Adult Male 26-Aug-05 0.10 ± 0.02 0.11 NaI_WBC
EN00004 Adult Male 1-Nov-05 0.07 ± 0.02 0.10 NaI_WBC
EN00004 Adult Male 13-Jan-06 0.04 ± 0.02 0.11 NaI_WBC
EN00004 Adult Male 3-Apr-06 0.06 ± 0.02 0.09 NaI_WBC
EN00004 Adult Male 29-Jun-06 0.04 ± 0.02 0.08 NaI_WBC
EN00004 Adult Male 4-Sep-06 0.00 ± 0.00 0.06 NaI_WBC
EN00004 Adult Male 25-Oct-06 0.05 ± 0.02 0.09 NaI_WBC
EN00005 Adult Male 18-Apr-05 0.46 ± 0.04 0.18 NaI_WBC
EN00005 Adult Male 30-Aug-05 0.66 ± 0.05 0.20 NaI_WBC
EN00005 Adult Male 1-Nov-05 0.60 ± 0.04 0.16 NaI_WBC
EN00005 Adult Male 3-Apr-06 0.46 ± 0.04 0.19 NaI_WBC
EN00005 Adult Male 22-May-06 0.29 ± 0.04 0.17 NaI_WBC
EN00005 Adult Male 22-Jun-06 0.45 ± 0.05 0.21 NaI_WBC
EN00005 Adult Male 31-Aug-06 0.51 ± 0.04 0.15 NaI_WBC
EN00005 Adult Male 25-Oct-06 0.36 ± 0.04 0.31 NaI_WBC
EN00006 Adult Male 28-Jan-05 0.13 ± 0.03 0.16 NaI_WBC
EN00006 Adult Male 14-Apr-05 0.42 ± 0.04 0.16 NaI_WBC
EN00006 Adult Male 29-Aug-05 0.57 ± 0.04 0.17 NaI_WBC
EN00006 Adult Male 1-Nov-05 0.50 ± 0.04 0.19 NaI_WBC
EN00006 Adult Male 24-Jan-06 0.45 ± 0.04 0.19 NaI_WBC
EN00006 Adult Male 3-Apr-06 0.41 ± 0.04 0.19 NaI_WBC
EN00006 Adult Male 23-Jun-06 0.42 ± 0.04 0.15 NaI_WBC
EN00006 Adult Male 25-Oct-06 0.44 ± 0.04 0.17 NaI_WBC
EN00007 Adult Male 31-Jan-05 0.10 ± 0.03 0.13 NaI_WBC
EN00007 Adult Male 13-Apr-05 0.23 ± 0.03 0.13 NaI_WBC
EN00007 Adult Male 31-Aug-05 0.53 ± 0.04 0.16 NaI_WBC
EN00007 Adult Male 22-May-06 0.06 ± 0.02 0.10 NaI_WBC
EN00007 Adult Male 22-Jun-06 0.08 ± 0.03 0.12 NaI_WBC
EN00007 Adult Male 4-Sep-06 0.06 ± 0.02 0.10 NaI_WBC
EN00007 Adult Male 25-Oct-06 0.10 ± 0.02 0.11 NaI_WBC
EN00008 Adult Male 3-Feb-05 0.18 ± 0.03 0.12 NaI_WBC
A-3
Table A1. Continued.
Cs-137 (kBq) ID# Age
Type Gender Count Date value MDA
Method Code Notes
EN00009 Adult Male 1-Feb-05 0.00 ± 0.00 0.06 NaI_WBC
EN00009 Adult Male 8-Apr-05 0.14 ± 0.03 0.11 NaI_WBC
EN00009 Adult Male 29-Aug-05 0.19 ± 0.04 0.17 NaI_WBC
EN00009 Adult Male 1-Nov-05 0.10 ± 0.02 0.10 NaI_WBC
EN00009 Adult Male 17-Jan-06 0.07 ± 0.02 0.09 NaI_WBC
EN00009 Adult Male 3-Apr-06 0.00 ± 0.00 0.06 NaI_WBC
EN00009 Adult Male 22-May-06 0.07 ± 0.02 0.10 NaI_WBC
EN00009 Adult Male 22-Jun-06 0.09 ± 0.02 0.10 NaI_WBC
EN00009 Adult Male 31-Aug-06 0.14 ± 0.02 0.10 NaI_WBC
EN00009 Adult Male 25-Oct-06 0.09 ± 0.02 0.10 NaI_WBC
EN00010 Adult Male 1-Feb-05 0.43 ± 0.04 0.17 NaI_WBC
EN00010 Adult Male 15-Apr-05 0.46 ± 0.04 0.18 NaI_WBC
EN00010 Adult Male 7-Nov-05 0.21 ± 0.04 0.18 NaI_WBC
EN00010 Adult Male 16-Jan-06 0.31 ± 0.04 0.17 NaI_WBC
EN00010 Adult Male 3-Apr-06 0.20 ± 0.03 0.17 NaI_WBC
EN00010 Adult Male 22-May-06 0.13 ± 0.04 0.18 NaI_WBC
EN00010 Adult Male 22-Jun-06 0.21 ± 0.04 0.17 NaI_WBC
EN00010 Adult Male 31-Aug-06 0.36 ± 0.04 0.16 NaI_WBC
EN00010 Adult Male 25-Oct-06 0.32 ± 0.03 0.13 NaI_WBC
EN00011 Adult Male 1-Feb-05 0.50 ± 0.04 0.15 NaI_WBC
EN00011 Adult Male 12-Apr-05 0.39 ± 0.04 0.16 NaI_WBC
EN00011 Adult Male 29-Aug-05 0.39 ± 0.03 0.14 NaI_WBC
EN00011 Adult Male 8-Nov-05 0.34 ± 0.04 0.18 NaI_WBC
EN00011 Adult Male 11-Apr-06 0.25 ± 0.03 0.12 NaI_WBC
EN00011 Adult Male 22-May-06 0.22 ± 0.03 0.12 NaI_WBC
EN00011 Adult Male 22-Jun-06 0.25 ± 0.03 0.15 NaI_WBC
EN00011 Adult Male 31-Aug-06 0.40 ± 0.04 0.16 NaI_WBC
EN00013 Adult Male 28-Jan-05 0.00 ± 0.00 0.06 NaI_WBC
EN00013 Adult Male 11-Apr-05 0.07 ± 0.02 0.09 NaI_WBC
EN00013 Adult Male 29-Aug-05 0.07 ± 0.02 0.10 NaI_WBC
EN00013 Adult Male 8-Nov-05 0.00 ± 0.00 0.06 NaI_WBC
EN00013 Adult Male 13-Jan-06 0.00 ± 0.00 0.06 NaI_WBC
EN00013 Adult Male 11-Apr-06 0.00 ± 0.00 0.06 NaI_WBC
EN00013 Adult Male 22-Jun-06 0.00 ± 0.00 0.06 NaI_WBC
EN00013 Adult Male 31-Aug-06 0.00 ± 0.00 0.06 NaI_WBC
EN00013 Adult Male 7-Nov-06 0.10 ± 0.02 0.10 NaI_WBC
EN00014 Adult Male 2-Aug-06 0.00 ± 0.00 0.06 NaI_WBC
EN00015 Adult Male 26-Jan-05 0.00 ± 0.00 0.07 NaI_WBC
A-4
Table A1. Continued.
Cs-137 (kBq) ID# Age
Type Gender Count Date value MDA
Method Code Notes
EN00015 Adult Male 8-Apr-05 0.37 ± 0.04 0.16 NaI_WBC
EN00015 Adult Male 26-Aug-05 0.18 ± 0.04 0.16 NaI_WBC
EN00015 Adult Male 1-Nov-05 0.25 ± 0.04 0.17 NaI_WBC
EN00015 Adult Male 13-Jan-06 0.07 ± 0.02 0.11 NaI_WBC
EN00015 Adult Male 4-Apr-06 0.00 ± 0.00 0.07 NaI_WBC
EN00015 Adult Male 22-May-06 0.05 ± 0.02 0.09 NaI_WBC
EN00015 Adult Male 22-Jun-06 0.06 ± 0.02 0.09 NaI_WBC
EN00015 Adult Male 31-Aug-06 0.00 ± 0.00 0.07 NaI_WBC
EN00015 Adult Male 7-Nov-06 0.04 ± 0.02 0.09 NaI_WBC
EN00016 Adult Male 13-Apr-05 0.11 ± 0.02 0.11 NaI_WBC
EN00016 Adult Male 12-Sep-05 0.32 ± 0.04 0.16 NaI_WBC
EN00018 Adult Male 31-Jan-05 0.16 ± 0.03 0.12 NaI_WBC
EN00018 Adult Male 12-Apr-05 0.33 ± 0.03 0.13 NaI_WBC
EN00018 Adult Male 26-Aug-05 0.40 ± 0.04 0.16 NaI_WBC
EN00018 Adult Male 7-Nov-05 0.33 ± 0.04 0.17 NaI_WBC
EN00018 Adult Male 16-Jan-06 0.11 ± 0.03 0.12 NaI_WBC
EN00018 Adult Male 22-Jun-06 0.09 ± 0.02 0.11 NaI_WBC
EN00020 Adult Male 28-Jan-05 0.19 ± 0.03 0.12 NaI_WBC
EN00020 Adult Male 15-Apr-05 0.51 ± 0.04 0.18 NaI_WBC
EN00020 Adult Male 31-Aug-05 0.31 ± 0.04 0.16 NaI_WBC
EN00020 Adult Male 25-Jan-06 0.26 ± 0.04 0.20 NaI_WBC
EN00020 Adult Male 4-Apr-06 0.27 ± 0.02 0.11 NaI_WBC
EN00020 Adult Male 23-May-06 0.27 ± 0.04 0.18 NaI_WBC
EN00020 Adult Male 23-Jun-06 0.18 ± 0.03 0.15 NaI_WBC
EN00020 Adult Male 20-Nov-06 0.38 ± 0.04 0.17 NaI_WBC
EN00021 Adult Male 26-Jan-05 0.35 ± 0.04 0.18 NaI_WBC
EN00021 Adult Male 13-Apr-05 0.56 ± 0.04 0.17 NaI_WBC
EN00021 Adult Male 14-Apr-05 0.56 ± 0.04 0.17 NaI_WBC
EN00021 Adult Male 29-Aug-05 0.17 ± 0.03 0.25 NaI_WBC
EN00021 Adult Male 8-Nov-05 0.22 ± 0.05 0.21 NaI_WBC
EN00021 Adult Male 17-Jan-06 0.44 ± 0.04 0.15 NaI_WBC
EN00021 Adult Male 4-Apr-06 0.32 ± 0.04 0.16 NaI_WBC
EN00021 Adult Male 29-May-06 0.19 ± 0.03 0.13 NaI_WBC
EN00021 Adult Male 26-Jun-06 0.32 ± 0.03 0.12 NaI_WBC
EN00021 Adult Male 31-Aug-06 0.49 ± 0.04 0.16 NaI_WBC
EN00021 Adult Male 7-Nov-06 0.43 ± 0.03 0.14 NaI_WBC
EN00022 Adult Male 31-Jan-05 0.19 ± 0.04 0.16 NaI_WBC
EN00022 Adult Male 15-Apr-05 0.33 ± 0.04 0.17 NaI_WBC
A-5
Table A1. Continued.
Cs-137 (kBq) ID# Age
Type Gender Count Date value MDA
Method Code Notes
EN00022 Adult Male 29-Aug-05 0.53 ± 0.04 0.16 NaI_WBC
EN00022 Adult Male 7-Nov-05 0.23 ± 0.03 0.14 NaI_WBC
EN00022 Adult Male 16-Jan-06 0.18 ± 0.03 0.15 NaI_WBC
EN00022 Adult Male 4-Apr-06 0.22 ± 0.03 0.15 NaI_WBC
EN00022 Adult Male 23-May-06 0.26 ± 0.04 0.16 NaI_WBC
EN00022 Adult Male 23-Jun-06 0.22 ± 0.04 0.16 NaI_WBC
EN00022 Adult Male 31-Aug-06 0.45 ± 0.04 0.16 NaI_WBC
EN00022 Adult Male 20-Nov-06 0.27 ± 0.03 0.13 NaI_WBC
EN00023 Adult Male 1-Feb-05 0.00 ± 0.00 0.07 NaI_WBC
EN00023 Adult Male 14-Apr-05 0.55 ± 0.05 0.21 NaI_WBC
EN00023 Adult Male 29-Aug-05 0.50 ± 0.04 0.19 NaI_WBC
EN00023 Adult Male 9-Jan-06 0.28 ± 0.04 0.17 NaI_WBC
EN00023 Adult Male 5-Apr-06 0.26 ± 0.03 0.13 NaI_WBC
EN00023 Adult Male 23-May-06 0.23 ± 0.03 0.14 NaI_WBC
EN00023 Adult Male 23-Jun-06 0.28 ± 0.04 0.17 NaI_WBC
EN00023 Adult Male 31-Aug-06 0.32 ± 0.04 0.16 NaI_WBC
EN00023 Adult Male 7-Nov-06 0.29 ± 0.04 0.17 NaI_WBC
EN00024 Adult Male 1-Feb-05 0.50 ± 0.04 0.17 NaI_WBC
EN00024 Adult Male 13-Apr-05 0.48 ± 0.04 0.16 NaI_WBC
EN00024 Adult Male 1-Nov-05 0.43 ± 0.04 0.18 NaI_WBC
EN00024 Adult Male 5-Apr-06 0.32 ± 0.04 0.17 NaI_WBC
EN00024 Adult Male 23-May-06 0.23 ± 0.03 0.13 NaI_WBC
EN00024 Adult Male 22-Jun-06 0.35 ± 0.03 0.15 NaI_WBC
EN00024 Adult Male 6-Sep-06 0.49 ± 0.04 0.18 NaI_WBC
EN00027 Adult Male 1-Feb-05 0.00 ± 0.00 0.07 NaI_WBC
EN00027 Adult Male 8-Apr-05 0.10 ± 0.02 0.11 NaI_WBC
EN00027 Adult Male 31-Aug-05 0.09 ± 0.02 0.10 NaI_WBC
EN00027 Adult Male 1-Nov-05 0.04 ± 0.02 0.10 NaI_WBC
EN00027 Adult Male 17-Jan-06 0.11 ± 0.03 0.13 NaI_WBC
EN00027 Adult Male 4-Apr-06 0.14 ± 0.03 0.13 NaI_WBC
EN00027 Adult Male 23-May-06 0.00 ± 0.00 0.07 NaI_WBC
EN00027 Adult Male 26-Jun-06 0.09 ± 0.03 0.12 NaI_WBC
EN00027 Adult Male 4-Sep-06 0.06 ± 0.02 0.10 NaI_WBC
EN00029 Adult Male 26-Jan-05 0.00 ± 0.00 0.07 NaI_WBC
EN00029 Adult Male 14-Apr-05 0.31 ± 0.03 0.13 NaI_WBC
EN00029 Adult Male 30-Aug-05 0.42 ± 0.04 0.16 NaI_WBC
EN00029 Adult Male 25-Jan-06 0.22 ± 0.03 0.15 NaI_WBC
EN00029 Adult Male 6-Sep-06 0.17 ± 0.03 0.12 NaI_WBC
A-6
Table A1. Continued.
Cs-137 (kBq) ID# Age
Type Gender Count Date value MDA
Method Code Notes
EN00030 Adult Male 9-Sep-05 0.00 ± 0.00 0.07 NaI_WBC
EN00032 Adult Male 28-Jan-05 0.10 ± 0.03 0.12 NaI_WBC
EN00032 Adult Male 11-Apr-05 0.22 ± 0.03 0.12 NaI_WBC
EN00032 Adult Male 29-Aug-05 0.44 ± 0.05 0.21 NaI_WBC
EN00032 Adult Male 7-Nov-05 0.37 ± 0.03 0.15 NaI_WBC
EN00032 Adult Male 25-Jan-06 0.19 ± 0.04 0.17 NaI_WBC
EN00032 Adult Male 29-May-06 0.29 ± 0.03 0.15 NaI_WBC
EN00032 Adult Male 23-Jun-06 0.30 ± 0.04 0.18 NaI_WBC
EN00032 Adult Male 4-Sep-06 0.26 ± 0.03 0.16 NaI_WBC
EN00032 Adult Male 7-Nov-06 0.21 ± 0.03 0.13 NaI_WBC
EN00033 Adult Male 31-Jan-05 0.11 ± 0.02 0.11 NaI_WBC
EN00033 Adult Male 26-Aug-05 0.12 ± 0.04 0.18 NaI_WBC
EN00033 Adult Male 13-Jan-06 0.07 ± 0.02 0.09 NaI_WBC
EN00033 Adult Male 11-Apr-06 0.10 ± 0.02 0.10 NaI_WBC
EN00033 Adult Male 26-Jun-06 0.07 ± 0.02 0.10 NaI_WBC
EN00033 Adult Male 4-Sep-06 0.13 ± 0.02 0.11 NaI_WBC
EN00034 Adult Male 27-Jan-05 0.19 ± 0.03 0.15 NaI_WBC
EN00034 Adult Male 11-Apr-05 0.48 ± 0.04 0.17 NaI_WBC
EN00034 Adult Male 29-Aug-05 0.53 ± 0.04 0.16 NaI_WBC
EN00034 Adult Male 8-Nov-05 0.34 ± 0.03 0.15 NaI_WBC
EN00034 Adult Male 16-Jan-06 0.40 ± 0.04 0.17 NaI_WBC
EN00034 Adult Male 11-Apr-06 0.14 ± 0.03 0.13 NaI_WBC
EN00034 Adult Male 29-May-06 0.29 ± 0.04 0.18 NaI_WBC
EN00034 Adult Male 26-Jun-06 0.22 ± 0.03 0.13 NaI_WBC
EN00034 Adult Male 7-Nov-06 0.27 ± 0.04 0.18 NaI_WBC
EN00035 Adult Male 31-Jan-05 0.40 ± 0.04 0.16 NaI_WBC
EN00035 Adult Male 15-Apr-05 0.72 ± 0.04 0.15 NaI_WBC
EN00035 Adult Male 29-Aug-05 0.61 ± 0.04 0.17 NaI_WBC
EN00035 Adult Male 8-Nov-05 0.52 ± 0.05 0.21 NaI_WBC
EN00035 Adult Male 24-Jan-06 0.37 ± 0.04 0.17 NaI_WBC
EN00035 Adult Male 11-Apr-06 0.41 ± 0.04 0.16 NaI_WBC
EN00035 Adult Male 29-May-06 0.24 ± 0.03 0.13 NaI_WBC
EN00035 Adult Male 23-Jun-06 0.24 ± 0.04 0.16 NaI_WBC
EN00035 Adult Male 31-Aug-06 0.26 ± 0.04 0.19 NaI_WBC
EN00037 Adult Male 18-Mar-05 0.07 ± 0.02 0.11 NaI_WBC
EN00038 Adult Male 28-Jan-05 0.45 ± 0.04 0.16 NaI_WBC
EN00038 Adult Male 14-Apr-05 0.57 ± 0.04 0.17 NaI_WBC
EN00038 Adult Male 30-Aug-05 0.47 ± 0.04 0.18 NaI_WBC
A-7
Table A1. Continued.
Cs-137 (kBq) ID# Age
Type Gender Count Date value MDA
Method Code Notes
EN00038 Adult Male 7-Nov-05 0.30 ± 0.04 0.17 NaI_WBC
EN00038 Adult Male 9-Jan-06 0.26 ± 0.02 0.09 NaI_WBC
EN00038 Adult Male 4-Sep-06 0.22 ± 0.03 0.15 NaI_WBC
EN00040 Adult Male 1-Jun-05 0.44 ± 0.04 0.16 NaI_WBC
EN00042 Adult Male 27-Jan-05 0.18 ± 0.03 0.12 NaI_WBC
EN00042 Adult Male 14-Apr-05 0.58 ± 0.04 0.17 NaI_WBC
EN00042 Adult Male 26-Aug-05 0.57 ± 0.04 0.17 NaI_WBC
EN00042 Adult Male 7-Nov-05 0.49 ± 0.04 0.16 NaI_WBC
EN00042 Adult Male 16-Jan-06 0.38 ± 0.05 0.22 NaI_WBC
EN00042 Adult Male 5-Apr-06 0.23 ± 0.03 0.14 NaI_WBC
EN00042 Adult Male 22-Jun-06 0.26 ± 0.04 0.17 NaI_WBC
EN00042 Adult Male 7-Sep-06 0.38 ± 0.03 0.14 NaI_WBC
EN00043 Adult Male 31-Jan-05 0.39 ± 0.04 0.17 NaI_WBC
EN00043 Adult Male 13-Apr-05 0.54 ± 0.04 0.17 NaI_WBC
EN00043 Adult Male 8-Nov-05 0.17 ± 0.03 0.14 NaI_WBC
EN00043 Adult Male 7-Sep-06 0.12 ± 0.03 0.12 NaI_WBC
EN00046 Adult Male 3-Feb-05 0.68 ± 0.05 0.20 NaI_WBC
EN00046 Adult Male 9-Jan-06 0.48 ± 0.04 0.19 NaI_WBC
EN00047 Adult Male 12-Apr-05 0.40 ± 0.04 0.16 NaI_WBC
EN00047 Adult Male 29-Aug-05 0.33 ± 0.03 0.13 NaI_WBC
EN00051 Adult Male 28-Jul-06 0.32 ± 0.04 0.17 NaI_WBC
EN00054 Adult Male 17-May-06 0.25 ± 0.03 0.16 NaI_WBC
EN00057 Adult Male 9-Jan-06 0.18 ± 0.02 0.11 NaI_WBC
EN00060 Adult Male 10-May-06 0.00 ± 0.00 0.07 NaI_WBC
EN00065 Adult Male 17-Mar-05 0.25 ± 0.04 0.18 NaI_WBC
EN00068 Adult Male 14-Mar-06 0.26 ± 0.04 0.17 NaI_WBC
EN00068 Adult Male 4-Aug-06 0.27 ± 0.04 0.17 NaI_WBC
EN00070 Adult Male 31-Jan-05 0.23 ± 0.04 0.18 NaI_WBC
EN00070 Adult Male 15-Apr-05 0.43 ± 0.04 0.16 NaI_WBC
EN00070 Adult Male 1-Nov-05 0.34 ± 0.04 0.17 NaI_WBC
EN00070 Adult Male 25-Jan-06 0.09 ± 0.03 0.15 NaI_WBC
EN00070 Adult Male 11-Apr-06 0.13 ± 0.04 0.17 NaI_WBC
EN00070 Adult Male 23-Jun-06 0.14 ± 0.04 0.16 NaI_WBC
EN00070 Adult Male 20-Nov-06 0.30 ± 0.04 0.17 NaI_WBC
EN00071 Adult Male 17-Jan-05 0.07 ± 0.02 0.10 NaI_WBC
EN00071 Adult Male 4-Aug-06 0.14 ± 0.03 0.14 NaI_WBC