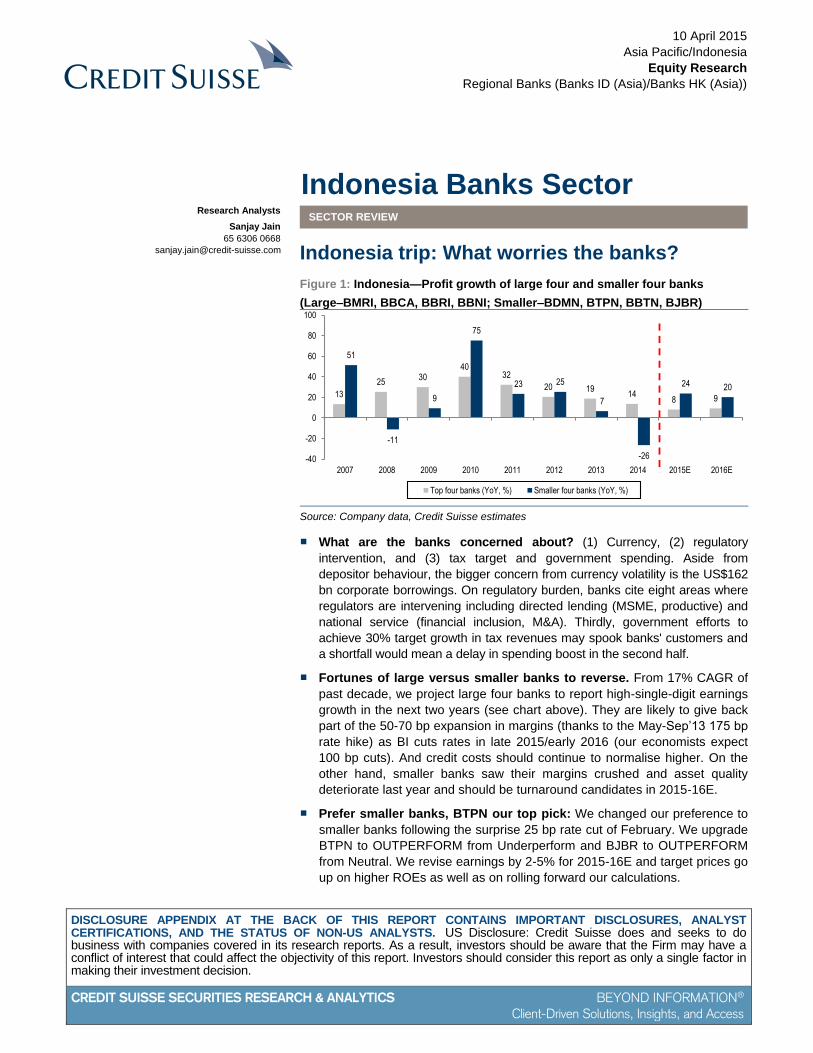
DISCLOSURE APPENDIX AT THE BACK OF THIS REPORT CONTAINS IMPORTANT DISCLOSURES, ANALYST CERTIFICATIONS, AND THE STATUS OF NON-US ANALYSTS. US Disclosure: Credit Suisse does and seeks to do business with companies covered in its research reports. As a result, investors should be aware that the Firm may have a conflict of interest that could affect the objectivity of this report. Investors should consider this report as only a single factor in making their investment decision. CREDIT SUISSE SECURITIES RESEARCH & ANALYTICS BEYOND INFORMATION ® Client-Driven Solutions, Insights, and Access 10 April 2015 Asia Pacific/Indonesia Equity Research Regional Banks (Banks ID (Asia)/Banks HK (Asia)) Indonesia Banks Sector SECTOR REVIEW Indonesia trip: What worries the banks? Figure 1: Indonesia—Profit growth of large four and smaller four banks (Large–BMRI, BBCA, BBRI, BBNI; Smaller–BDMN, BTPN, BBTN, BJBR) 13 25 30 40 32 20 19 14 8 9 51 -11 9 75 23 25 7 -26 24 20 -40 -20 0 20 40 60 80 100 2007 2008 2009 2010 2011 2012 2013 2014 2015E 2016E Top four banks (YoY, %) Smaller four banks (YoY, %) Source: Company data, Credit Suisse estimates ■ What are the banks concerned about? (1) Currency, (2) regulatory intervention, and (3) tax target and government spending. Aside from depositor behaviour, the bigger concern from currency volatility is the US$162 bn corporate borrowings. On regulatory burden, banks cite eight areas where regulators are intervening including directed lending (MSME, productive) and national service (financial inclusion, M&A). Thirdly, government efforts to achieve 30% target growth in tax revenues may spook banks' customers and a shortfall would mean a delay in spending boost in the second half. ■ Fortunes of large versus smaller banks to reverse. From 17% CAGR of past decade, we project large four banks to report high-single-digit earnings growth in the next two years (see chart above). They are likely to give back part of the 50-70 bp expansion in margins (thanks to the May-Sep’13 175 bp rate hike) as BI cuts rates in late 2015/early 2016 (our economists expect 100 bp cuts). And credit costs should continue to normalise higher. On the other hand, smaller banks saw their margins crushed and asset quality deteriorate last year and should be turnaround candidates in 2015-16E. ■ Prefer smaller banks, BTPN our top pick: We changed our preference to smaller banks following the surprise 25 bp rate cut of February. We upgrade BTPN to OUTPERFORM from Underperform and BJBR to OUTPERFORM from Neutral. We revise earnings by 2-5% for 2015-16E and target prices go up on higher ROEs as well as on rolling forward our calculations. Research Analysts Sanjay Jain 65 6306 0668 [email protected]
Transcript
DISCLOSURE APPENDIX AT THE BACK OF THIS REPORT CONTAINS IMPORTANT DISCLOSURES, ANALYST CERTIFICATIONS, AND THE STATUS OF NON-US ANALYSTS. US Disclosure: Credit Suisse does and seeks to do business with companies covered in its research reports. As a result, investors should be aware that the Firm may have a conflict of interest that could affect the objectivity of this report. Investors should consider this report as only a single factor in making their investment decision.
CREDIT SUISSE SECURITIES RESEARCH & ANALYTICS BEYOND INFORMATION®
Client-Driven Solutions, Insights, and Access
10 April 2015
Asia Pacific/Indonesia
Equity Research
Regional Banks (Banks ID (Asia)/Banks HK (Asia))
Indonesia Banks Sector SECTOR REVIEW
Indonesia trip: What worries the banks?
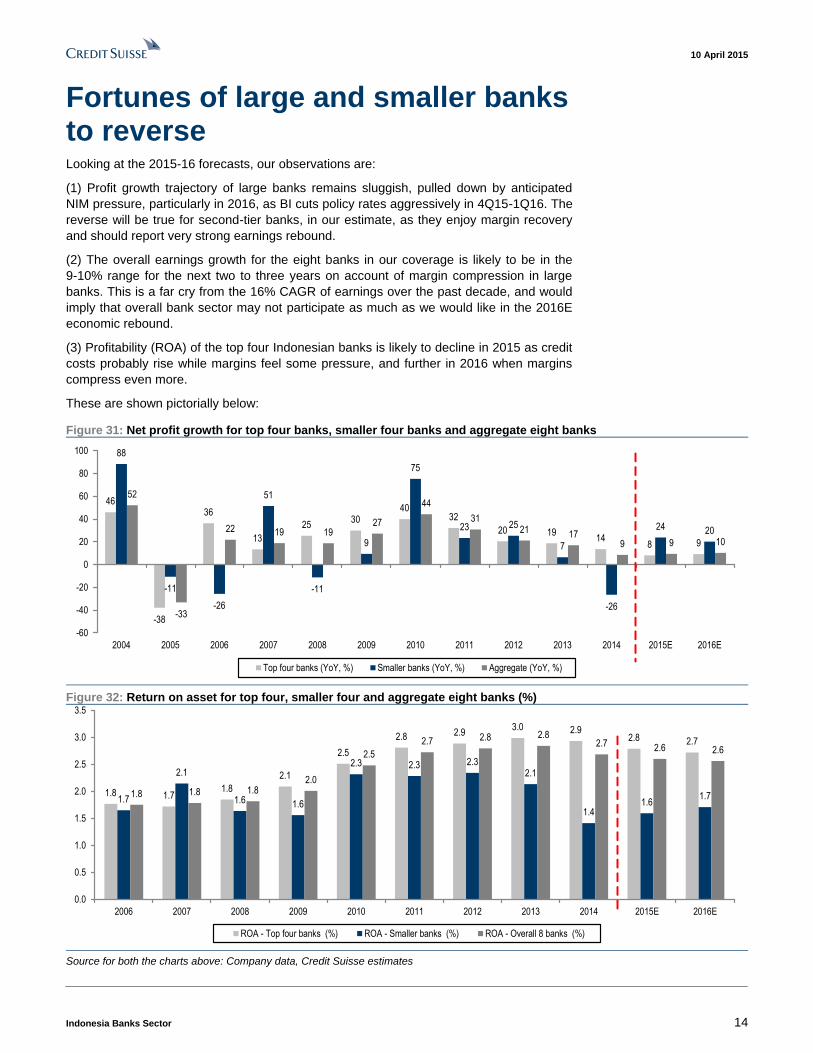
Figure 1: Indonesia—Profit growth of large four and smaller four banks
BMRI 2.40 2.37 19.8 19.1 20.3 13.0 2.8 13.9 13,700 12,075 13.5 11,800 O O
BBCA 3.08 2.88 21.2 18.8 25.3 13.0 4.1 16.1 13,600 15,025 -9.5 11,500 U U
BBRI 3.14 3.16 24.3 22.6 26.8 14.5 3.2 12.1 14,000 13,100 6.9 11,500 N N
BBNI 2.56 2.45 18.8 18.5 21.3 14.0 2.5 11.5 7,550 7,225 4.5 6,000 N N
BDMN 1.61 1.79 9.6 10.8 16.0 14.0 1.4 8.8 4,100 5,050 -18.8 3,050 U U
BTPN 2.81 2.89 17.6 17.7 22.8 14.5 2.5 11.0 5,050 4,095 23.3 3,950 O U
BBTN 0.97 1.04 11.9 13.3 13.3 13.5 1.0 7.2 1,100 1,185 -7.2 950 N N
BJBR 1.57 1.64 16.9 18.1 17.5 14.5 1.5 8.3 1,150 965 19.2 800 O N
Source: Company data, Credit Suisse estimates
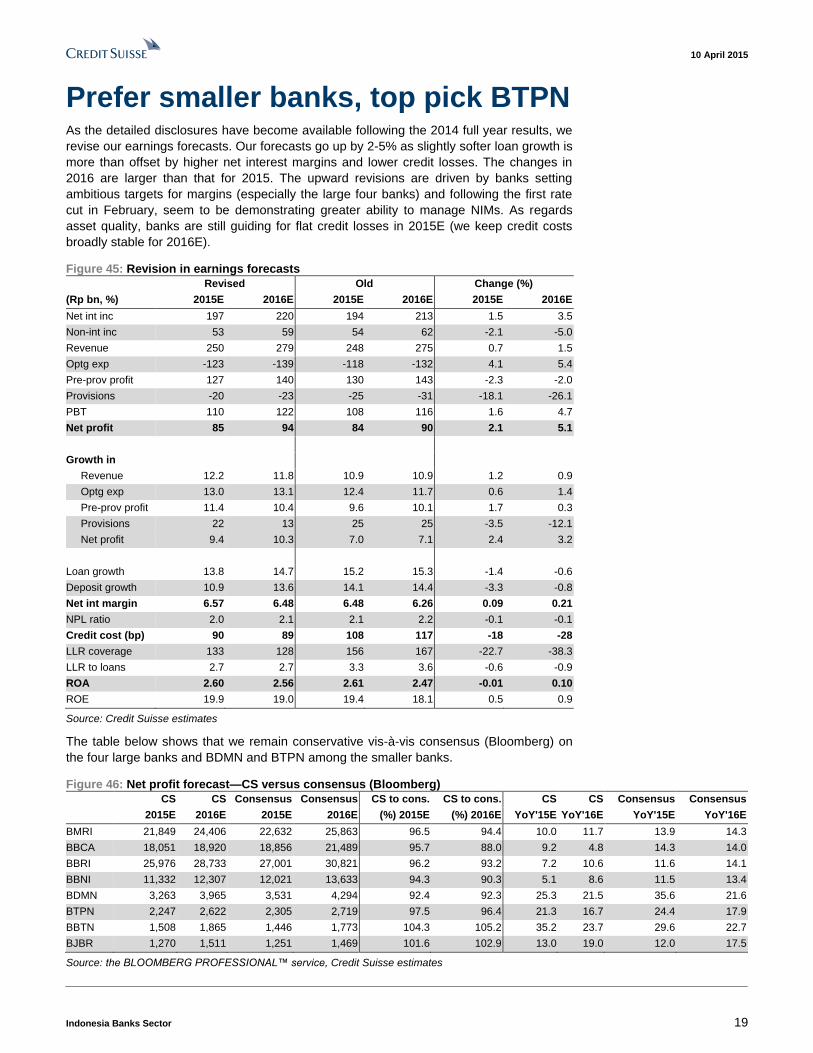
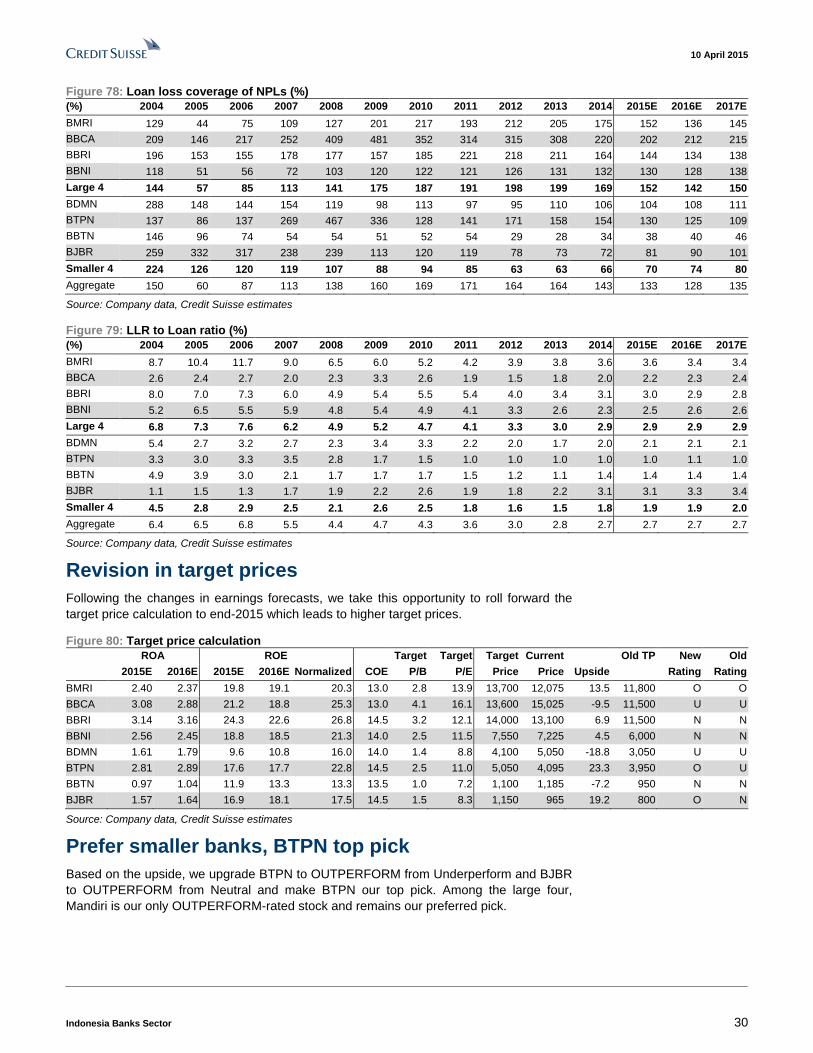
Prefer smaller banks, BTPN top pick
Based on the upside, we upgrade BTPN to OUTPERFORM from Underperform and BJBR
to OUTPERFORM from Neutral and make BTPN our top pick. Among the large four,
Mandiri is our only OUTPERFORM-rated stock and remains our preferred pick.
10 April 2015
Indonesia Banks Sector 31
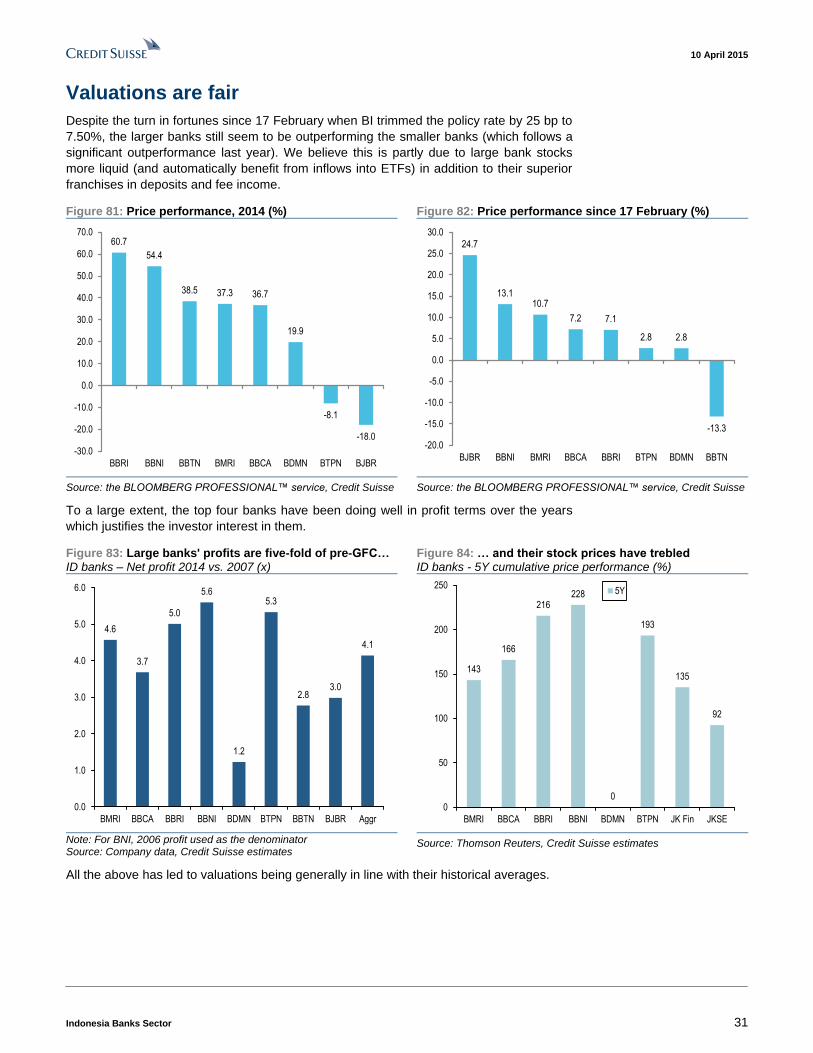
Valuations are fair
Despite the turn in fortunes since 17 February when BI trimmed the policy rate by 25 bp to
7.50%, the larger banks still seem to be outperforming the smaller banks (which follows a
significant outperformance last year). We believe this is partly due to large bank stocks
more liquid (and automatically benefit from inflows into ETFs) in addition to their superior
franchises in deposits and fee income.
Figure 81: Price performance, 2014 (%) Figure 82: Price performance since 17 February (%)
60.7
54.4
38.5 37.3 36.7
19.9
-8.1
-18.0
-30.0
-20.0
-10.0
0.0
10.0
20.0
30.0
40.0
50.0
60.0
70.0
BBRI BBNI BBTN BMRI BBCA BDMN BTPN BJBR
24.7
13.110.7
7.2 7.1
2.8 2.8
-13.3
-20.0
-15.0
-10.0
-5.0
0.0
5.0
10.0
15.0
20.0
25.0
30.0
BJBR BBNI BMRI BBCA BBRI BTPN BDMN BBTN
Source: the BLOOMBERG PROFESSIONAL™ service, Credit Suisse Source: the BLOOMBERG PROFESSIONAL™ service, Credit Suisse
To a large extent, the top four banks have been doing well in profit terms over the years
which justifies the investor interest in them.
Figure 83: Large banks' profits are five-fold of pre-GFC… ID banks – Net profit 2014 vs. 2007 (x)
Figure 84: … and their stock prices have trebled ID banks - 5Y cumulative price performance (%)
4.6
3.7
5.0
5.6
1.2
5.3
2.83.0
4.1
0.0
1.0
2.0
3.0
4.0
5.0
6.0
BMRI BBCA BBRI BBNI BDMN BTPN BBTN BJBR Aggr
143
166
216228
0
193
135
92
0
50
100
150
200
250
BMRI BBCA BBRI BBNI BDMN BTPN JK Fin JKSE
5Y
Note: For BNI, 2006 profit used as the denominator Source: Company data, Credit Suisse estimates
Source: Thomson Reuters, Credit Suisse estimates
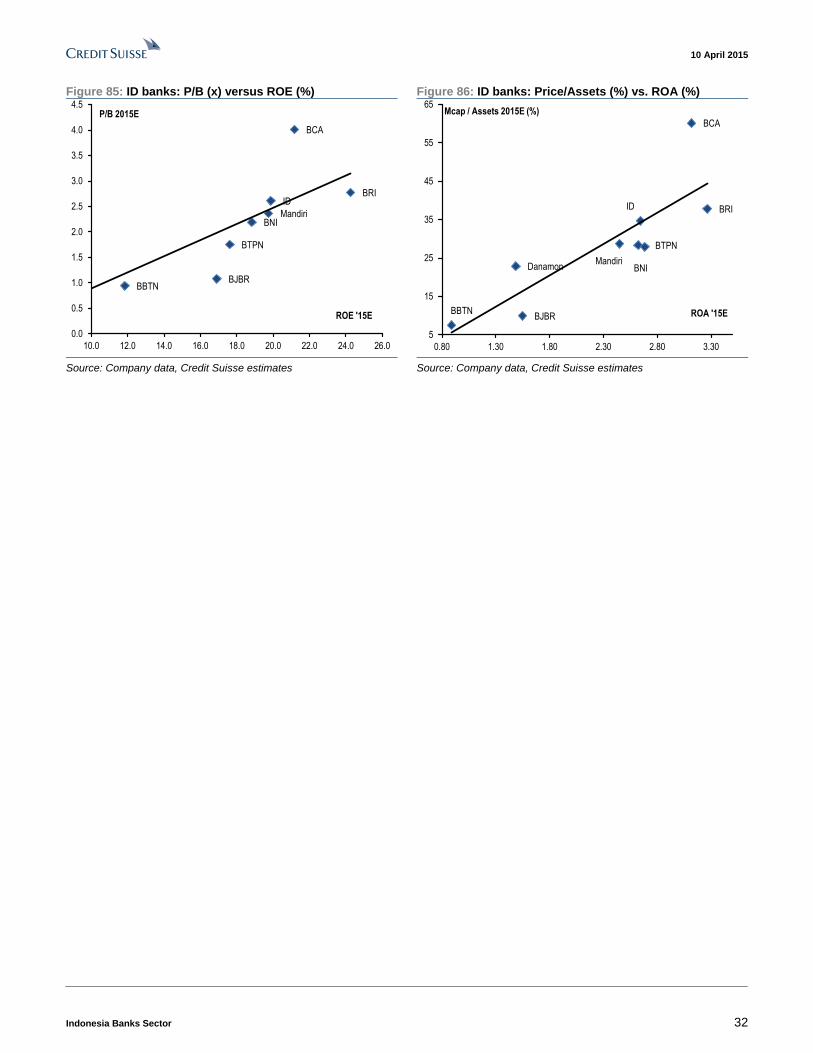
All the above has led to valuations being generally in line with their historical averages.
10 April 2015
Indonesia Banks Sector 32
Figure 85: ID banks: P/B (x) versus ROE (%) Figure 86: ID banks: Price/Assets (%) vs. ROA (%)
BRI
BCA
MandiriBNI
BJBR
BTPN
BBTN
ID
0.0
0.5
1.0
1.5
2.0
2.5
3.0
3.5
4.0
4.5
10.0 12.0 14.0 16.0 18.0 20.0 22.0 24.0 26.0
ROE '15E
P/B 2015E
BRI
BCA
MandiriDanamon BNI
BJBR
BTPN
BBTN
ID
5
15
25
35
45
55
65
0.80 1.30 1.80 2.30 2.80 3.30
Mcap / Assets 2015E (%)
ROA '15E
Source: Company data, Credit Suisse estimates Source: Company data, Credit Suisse estimates
10 April 2015
Indonesia Banks Sector 33
Companies Mentioned (Price as of 10-Apr-2015)
PT Bank Central Asia Tbk (BBCA.JK, Rp15,075, UNDERPERFORM, TP Rp13,600) PT Bank Danamon Indonesia Tbk (BDMN.JK, Rp5,075, UNDERPERFORM, TP Rp4,100) PT Bank Mandiri (Persero) Tbk (BMRI.JK, Rp12,000, OUTPERFORM, TP Rp13,700) PT Bank Negara Indonesia (Persero) Tbk (BBNI.JK, Rp7,175, NEUTRAL, TP Rp7,550) PT Bank Pembangunan Daerah Jawa Barat dan Banten T (BJBR.JK, Rp885, OUTPERFORM, TP Rp1,150) PT Bank Rakyat Indonesia (Persero) Tbk (BBRI.JK, Rp13,075, NEUTRAL, TP Rp14,000) PT Bank Tabungan Negara Persero Tbk (BBTN.JK, Rp1,175, NEUTRAL[V], TP Rp1,100) PT Bank Tabungan Pensiunan Nasional Tbk (BTPN.JK, Rp4,095, OUTPERFORM, TP Rp5,050)
Disclosure Appendix
Important Global Disclosures
I, Sanjay Jain, certify that (1) the views expressed in this report accurately reflect my personal views about all of the subject companies and securities and (2) no part of my compensation was, is or will be directly or indirectly related to the specific recommendations or views expressed in this report.
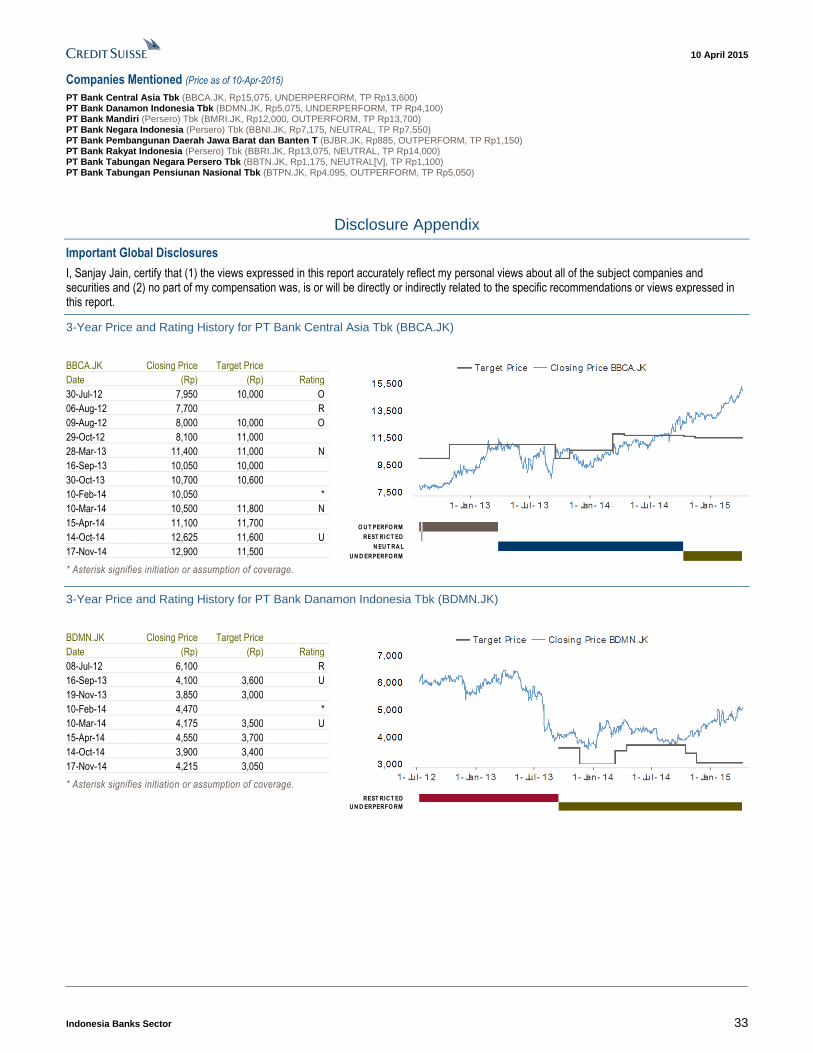
3-Year Price and Rating History for PT Bank Central Asia Tbk (BBCA.JK)
BBCA.JK Closing Price Target Price
Date (Rp) (Rp) Rating
30-Jul-12 7,950 10,000 O
06-Aug-12 7,700 R
09-Aug-12 8,000 10,000 O
29-Oct-12 8,100 11,000
28-Mar-13 11,400 11,000 N
16-Sep-13 10,050 10,000
30-Oct-13 10,700 10,600
10-Feb-14 10,050 *
10-Mar-14 10,500 11,800 N
15-Apr-14 11,100 11,700
14-Oct-14 12,625 11,600 U
17-Nov-14 12,900 11,500
* Asterisk signifies initiation or assumption of coverage.
O U T PERFO RM
REST RICT ED
N EU T RA L
U N D ERPERFO RM
3-Year Price and Rating History for PT Bank Danamon Indonesia Tbk (BDMN.JK)
BDMN.JK Closing Price Target Price
Date (Rp) (Rp) Rating
08-Jul-12 6,100 R
16-Sep-13 4,100 3,600 U
19-Nov-13 3,850 3,000
10-Feb-14 4,470 *
10-Mar-14 4,175 3,500 U
15-Apr-14 4,550 3,700
14-Oct-14 3,900 3,400
17-Nov-14 4,215 3,050
* Asterisk signifies initiation or assumption of coverage. REST RICT ED
U N D ERPERFO RM
10 April 2015
Indonesia Banks Sector 34
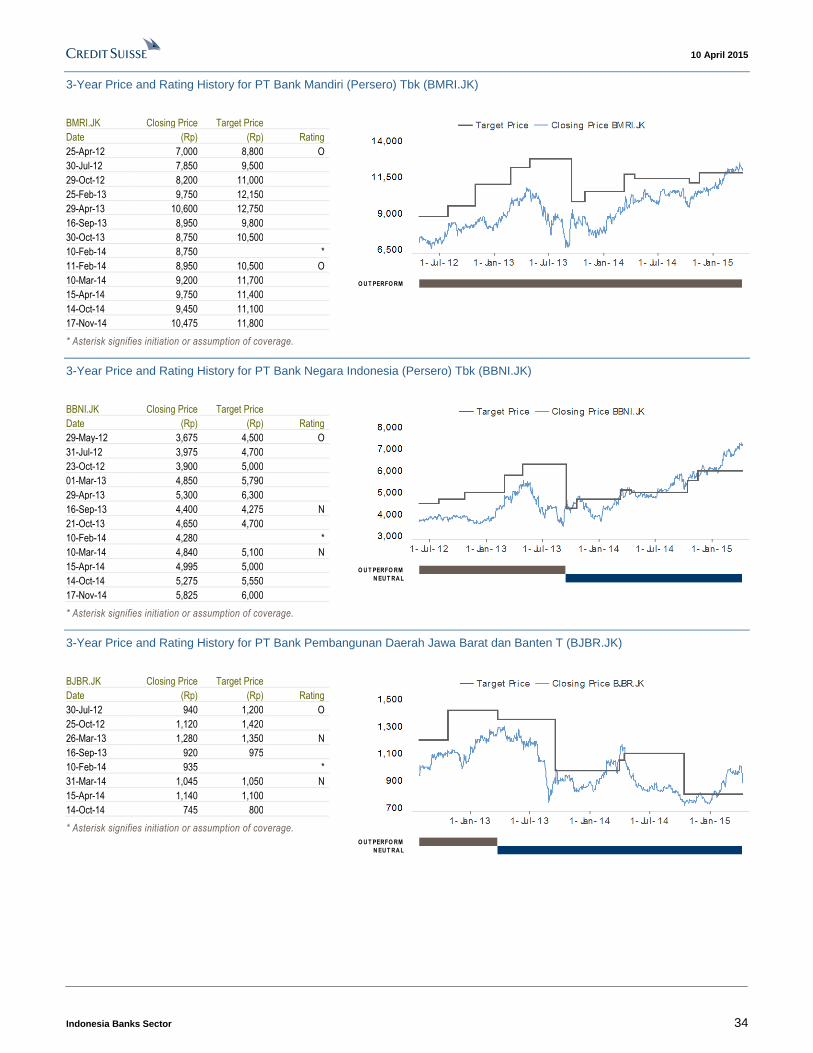
3-Year Price and Rating History for PT Bank Mandiri (Persero) Tbk (BMRI.JK)
BMRI.JK Closing Price Target Price
Date (Rp) (Rp) Rating
25-Apr-12 7,000 8,800 O
30-Jul-12 7,850 9,500
29-Oct-12 8,200 11,000
25-Feb-13 9,750 12,150
29-Apr-13 10,600 12,750
16-Sep-13 8,950 9,800
30-Oct-13 8,750 10,500
10-Feb-14 8,750 *
11-Feb-14 8,950 10,500 O
10-Mar-14 9,200 11,700
15-Apr-14 9,750 11,400
14-Oct-14 9,450 11,100
17-Nov-14 10,475 11,800
* Asterisk signifies initiation or assumption of coverage.
O U T PERFO RM
3-Year Price and Rating History for PT Bank Negara Indonesia (Persero) Tbk (BBNI.JK)
BBNI.JK Closing Price Target Price
Date (Rp) (Rp) Rating
29-May-12 3,675 4,500 O
31-Jul-12 3,975 4,700
23-Oct-12 3,900 5,000
01-Mar-13 4,850 5,790
29-Apr-13 5,300 6,300
16-Sep-13 4,400 4,275 N
21-Oct-13 4,650 4,700
10-Feb-14 4,280 *
10-Mar-14 4,840 5,100 N
15-Apr-14 4,995 5,000
14-Oct-14 5,275 5,550
17-Nov-14 5,825 6,000
* Asterisk signifies initiation or assumption of coverage.
O U T PERFO RM
N EU T RA L
3-Year Price and Rating History for PT Bank Pembangunan Daerah Jawa Barat dan Banten T (BJBR.JK)
BJBR.JK Closing Price Target Price
Date (Rp) (Rp) Rating
30-Jul-12 940 1,200 O
25-Oct-12 1,120 1,420
26-Mar-13 1,280 1,350 N
16-Sep-13 920 975
10-Feb-14 935 *
31-Mar-14 1,045 1,050 N
15-Apr-14 1,140 1,100
14-Oct-14 745 800
* Asterisk signifies initiation or assumption of coverage. O U T PERFO RM
N EU T RA L
10 April 2015
Indonesia Banks Sector 35
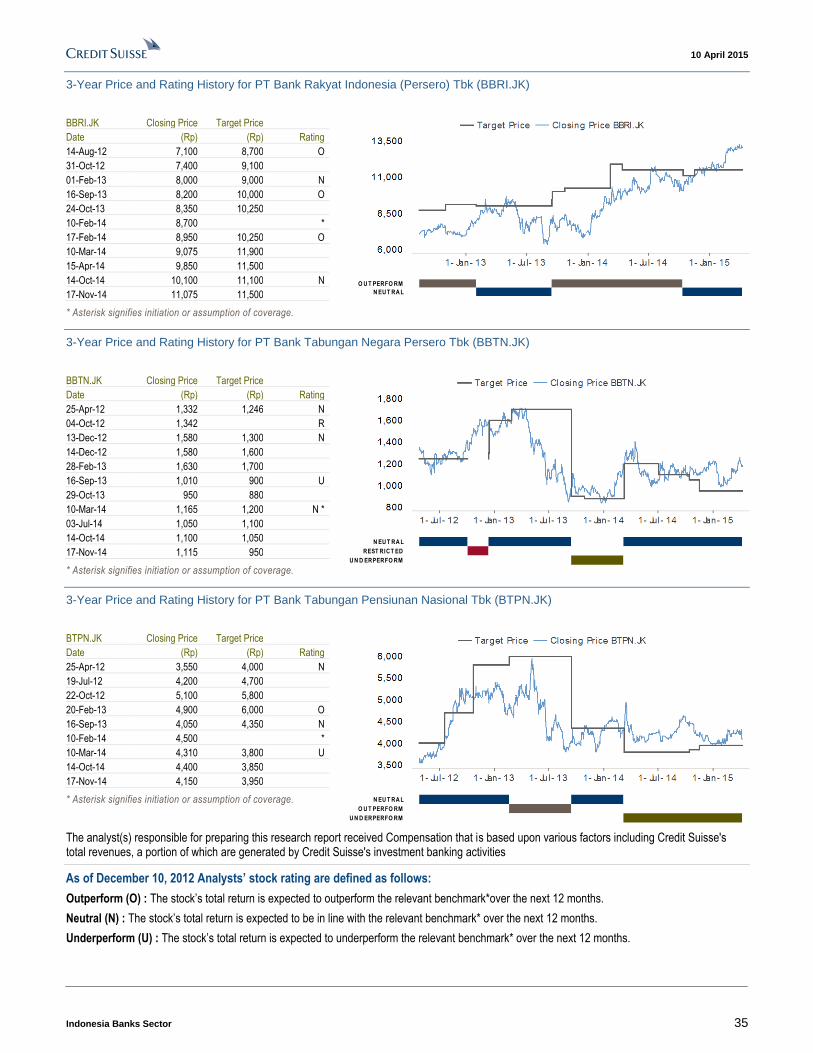
3-Year Price and Rating History for PT Bank Rakyat Indonesia (Persero) Tbk (BBRI.JK)
BBRI.JK Closing Price Target Price
Date (Rp) (Rp) Rating
14-Aug-12 7,100 8,700 O
31-Oct-12 7,400 9,100
01-Feb-13 8,000 9,000 N
16-Sep-13 8,200 10,000 O
24-Oct-13 8,350 10,250
10-Feb-14 8,700 *
17-Feb-14 8,950 10,250 O
10-Mar-14 9,075 11,900
15-Apr-14 9,850 11,500
14-Oct-14 10,100 11,100 N
17-Nov-14 11,075 11,500
* Asterisk signifies initiation or assumption of coverage.
O U T PERFO RM
N EU T RA L
3-Year Price and Rating History for PT Bank Tabungan Negara Persero Tbk (BBTN.JK)
BBTN.JK Closing Price Target Price
Date (Rp) (Rp) Rating
25-Apr-12 1,332 1,246 N
04-Oct-12 1,342 R
13-Dec-12 1,580 1,300 N
14-Dec-12 1,580 1,600
28-Feb-13 1,630 1,700
16-Sep-13 1,010 900 U
29-Oct-13 950 880
10-Mar-14 1,165 1,200 N *
03-Jul-14 1,050 1,100
14-Oct-14 1,100 1,050
17-Nov-14 1,115 950
* Asterisk signifies initiation or assumption of coverage.
N EU T RA L
REST RICT ED
U N D ERPERFO RM
3-Year Price and Rating History for PT Bank Tabungan Pensiunan Nasional Tbk (BTPN.JK)
BTPN.JK Closing Price Target Price
Date (Rp) (Rp) Rating
25-Apr-12 3,550 4,000 N
19-Jul-12 4,200 4,700
22-Oct-12 5,100 5,800
20-Feb-13 4,900 6,000 O
16-Sep-13 4,050 4,350 N
10-Feb-14 4,500 *
10-Mar-14 4,310 3,800 U
14-Oct-14 4,400 3,850
17-Nov-14 4,150 3,950
* Asterisk signifies initiation or assumption of coverage.
N EU T RA L
O U T PERFO RM
U N D ERPERFO RM
The analyst(s) responsible for preparing this research report received Compensation that is based upon various factors including Credit Suisse's total revenues, a portion of which are generated by Credit Suisse's investment banking activities
As of December 10, 2012 Analysts’ stock rating are defined as follows:
Outperform (O) : The stock’s total return is expected to outperform the relevant benchmark*over the next 12 months.
Neutral (N) : The stock’s total return is expected to be in line with the relevant benchmark* over the next 12 months.
Underperform (U) : The stock’s total return is expected to underperform the relevant benchmark* over the next 12 months.
10 April 2015
Indonesia Banks Sector 36
*Relevant benchmark by region: As of 10th December 2012, Japanese ratings are based on a stock’s total return relative to the analyst's coverage universe which consists of all companies covered by the analyst within the relevant sector, with Outperforms representing the most attractive, Neutrals the less attrac tive, and Underperforms the least attractive investment opportunities. As of 2nd October 2012, U.S. and Canadian as well as Europea n ratings are based on a stock’s total return relative to the analyst's coverage universe which consists of all companies covered by the analyst within the relevant sector, with Outperforms representing the most attractive, Neutrals the less attractive, and Underperforms the least attractive investment opportunities. For Latin American and non -Japan Asia stocks, ratings are based on a stock’s total return relative to the average total return of the relevant country or regional benchmark; prior to 2nd October 2012 U.S. and Canadian ratings were based on (1) a stock’s absolute total return potential to its current share price and (2) the relative attractiv eness of a stock’s total return potential within an analyst’s coverage universe. For Australian and New Zealand stocks, 12-month rolling yield is incorporated in the absolute total return calculation and a 15% and a 7.5% threshold replace the 10-15% level in the Outperform and Underperform stock rating definitions, respectively. The 15% and 7.5% thresholds rep lace the +10-15% and -10-15% levels in the Neutral stock rating definition, respectively. Prior to 10th December 2012, Japanese ratings were based on a stock’s total return relative to the average total return of the relevant country or regional benchmark.
Restricted (R) : In certain circumstances, Credit Suisse policy and/or applicable law and regulations preclude certain types of communications, including an investment recommendation, during the course of Credit Suisse's engagement in an investment banking transaction and in certain other circumstances.
Volatility Indicator [V] : A stock is defined as volatile if the stock price has moved up or down by 20% or more in a month in at least 8 of the past 24 months or the analyst expects significant volatility going forward.
Analysts’ sector weightings are distinct from analysts’ stock ratings and are based on the analyst’s expectations for the fundamentals and/or valuation of the sector* relative to the group’s historic fundamentals and/or valuation:
Overweight : The analyst’s expectation for the sector’s fundamentals and/or valuation is favorable over the next 12 months.
Market Weight : The analyst’s expectation for the sector’s fundamentals and/or valuation is neutral over the next 12 months.
Underweight : The analyst’s expectation for the sector’s fundamentals and/or valuation is cautious over the next 12 months.
*An analyst’s coverage sector consists of all companies covered by the analyst within the relevant sector. An analyst may cov er multiple sectors.
Credit Suisse's distribution of stock ratings (and banking clients) is:
Global Ratings Distribution
Rating Versus universe (%) Of which banking clients (%)
Outperform/Buy* 44% (53% banking clients)
Neutral/Hold* 38% (51% banking clients)
Underperform/Sell* 16% (43% banking clients)
Restricted 3%
*For purposes of the NYSE and NASD ratings distribution disclosure requirements, our stock ratings of Outperform, Neutral, an d Underperform most closely correspond to Buy, Hold, and Sell, respectively; however, the meanings are not the same, as our stock ratings are determined on a relative basis. (Please refer to definitions above.) An investor's decision to buy or sell a security should be based on investment objectives, current holdin gs, and other individual factors.
Credit Suisse’s policy is to update research reports as it deems appropriate, based on developments with the subject company, the sector or the market that may have a material impact on the research views or opinions stated herein.
Credit Suisse's policy is only to publish investment research that is impartial, independent, clear, fair and not misleading. For more detail please refer to Credit Suisse's Policies for Managing Conflicts of Interest in connection with Investment Research: http://www.csfb.com/research-and-analytics/disclaimer/managing_conflicts_disclaimer.html
Credit Suisse does not provide any tax advice. Any statement herein regarding any US federal tax is not intended or written to be used, and cannot be used, by any taxpayer for the purposes of avoiding any penalties.
Price Target: (12 months) for PT Bank Central Asia Tbk (BBCA.JK)
Method: Our target price for BBCA of Rp13,600/share is derived based on Gordon's growth assuming sustainable return on equity (ROE) of 18-21%, beta of 0.8-0.9x, risk free rate of 8.5% and market risk premium of 5.0%. Our target price for BBCA implies 3.8x 2015E P/B and 18.8x 2015E P/E.
Risk: Risks to our estimates and target price of Rp13,600/share for BBCA include: (1) longer-than-anticipated tight liquidity conditions in Indonesia as well as a faster-than-expected recovery of the currently tight liquidity conditions; (2) significant changes in global sentiment; (3) significant changes in the public's confidence in the bank; (4) risks relating to Indonesia, including macroeconomic, political and social risks; (5) risks of major changes in the bank's current management team; and (6) currency risks.
Price Target: (12 months) for PT Bank Negara Indonesia (Persero) Tbk (BBNI.JK)
Method: Our target price of Rp7,550/share for BBNI is derived based on Gordon's growth model, assuming normalized return of equity (ROE) of 18-19%, beta of 1.0x, risk-free rate of 8.5% and market risk premium of 5.0%, implying 2.5x 2015E price-to-book ratio (P/B) and 11.5x 2014E price-to-earnings ratio (P/E).
10 April 2015
Indonesia Banks Sector 37
Risk: Risks to our estimates and target price of Rp7,550/share for BBNI include: (1) longer-than-anticipated tight liquidity conditions in Indonesia as well as faster-than-expected recovery of the currently tight liquidity conditions; (2) significant changes in global sentiment; (3) significant changes in the public's confidence in the bank; (4) risks relating to Indonesia, including macroeconomic, political and social risks; (5) risks of major changes in the bank's current management team; and (6) currency risks.
Price Target: (12 months) for PT Bank Rakyat Indonesia (Persero) Tbk (BBRI.JK)
Method: Our target price of Rp14,000/share for BBRI is derived based on Gordon's growth model, assuming normalized return of equity (ROE) of 22-24%, beta of 1.1-1.2x, risk-free rate of 8.5% and market risk premium of 5.0%, implying a 3.1x 2014E price-to-book ratio (P/B) and 14.3x 2014E price-to-earnings ratio (P/E).
Risk: Risks to our estimates and target price of Rp14,000/share for BBRI include: (1) longer-than-anticipated tight liquidity conditions in Indonesia as well as faster-than-expected recovery of the currently tight liquidity conditions; (2) significant changes in global sentiment; (3) significant changes in the public's confidence in the bank; (4) risks relating to Indonesia, including macroeconomic, political and social risks; (5) risks of major changes in the bank's current management team; and (6) currency risks.
Price Target: (12 months) for PT Bank Tabungan Negara Persero Tbk (BBTN.JK)
Method: Our target price of Rp1,100/share for BBTN is derived based on Gordon's growth model, a normalised return of equity (ROE) of 12.0-13.0%, beta of 1.1-1.2x, a risk-free rate of 8.5% and market risk premium of 5.0%, implying 1.0x 2015E price-to-book ratio (P/B) and 7.2x 2015E price-to-earnings ratio (P/E).
Risk: Risks to our estimates and target price of Rp1,100/share for BBTN include: (1) an earlier-than-expected pick-up in competition for funding; (2) irrational competition from new entrants to the mortgage sector; and (3) Indonesia's sovereign and political risks.
Price Target: (12 months) for PT Bank Danamon Indonesia Tbk (BDMN.JK)
Method: Our target price of Rp4,100/share for BDMN is derived based on Gordon's growth model, assuming a sustainable return of equity (ROE) of 10-11, beta of 1.1-1.2x, risk-free rate of 8.5% and market risk premium of 5.0%, implying 1.4x 2015E price-to-book ratio (P/B) and 8.8x 2015E price-to-earnings ratio (P/E).
Risk: Risks to our estimates and target price of Rp4,100/share for Bank Danamon include: (1) challanges in tight liquidity conditions to sustain longer than our initial expectation; (2) significant changes in global sentiment; (3) unexpected deterioration in public's confidence in Indonesian banks; (4) risks relating to Indonesia including macroeconomics, geopolitics and social risks; (5) risks relating to changes in the management team; (6) currency risks; and (7) lower-than-expected expansion on micro segments.
Price Target: (12 months) for PT Bank Pembangunan Daerah Jawa Barat dan Banten T (BJBR.JK)
Method: Our target price of Rp1,150/share for BJBR is derived based on Gordon's growth model, assuming: a normalized Return on Equity (ROE) of 17-18%, beta of 1.3x, risk free rate of 8.5% and market risk premium of 5.0%, implying 8.3x 15E Price to Earning Ratio (P/E) and 1.5x 15E Price to Book Ratio (P/B).
Risk: Risks to our estimates and target price of Rp1,150/share for BJBR include: (1) longer-than- anticipated tight liquidity conditions in Indonesia as well as a faster-than-expected recovery of the currently tight liquidity conditions; (2) significant changes in global sentiment; (3) significant changes in public's confidence in the bank; (4) risks relating to Indonesia, including macroeconomic, political and social risks; and (5) currency risks
Price Target: (12 months) for PT Bank Mandiri (Persero) Tbk (BMRI.JK)
Method: Our target price of Rp13,700/share for BMRI is derived based on Gordon's growth model, assuming: (1) a sustainable return of equity (ROE) of 19-20%; (2) a beta of 0.9x; and (3) cost of equity of 13.0%, implying 14.6x 2015E price to earnings ratio (P/E) and 2.7x 2015E price to book ratio (P/B).
Risk: Risks to our estimates and target price of Rp13,700/share for BMRI include: (1) longer-than-anticipated tight liquidity conditions in Indonesia as well as faster-than-expected recovery of the currently tight liquidity conditions; (2) significant changes in global sentiment; (3) significant changes in the public's confidence in the bank; (4) risks relating to Indonesia, including macroeconomic, political and social risks; (5) risks of major changes in the bank's current management team; and (6) currency risks.
Price Target: (12 months) for PT Bank Tabungan Pensiunan Nasional Tbk (BTPN.JK)
Method: Our target price of Rp5,050/share for BTPN is derived based on Gordon's growth model, assuming a normalised return of equity (ROE) of 18%, beta of 1.3x, risk-free rate of 8.5% and market risk premium of 5.0%, implying 2.5x 2015E price-to-book ratio (P/B) and 11.0x 2015E price-to-earnings ratio (P/E).
Risk: Risks to our estimates and target price of Rp5,050/share for BTPN include: (1) challenges in tight liquidity conditions sustaining longer than our initial expectation; (2) significant changes in global sentiment; (3) an unexpected deterioration in the public's confidence in
10 April 2015
Indonesia Banks Sector 38
Indonesian banks; (4) risks relating to Indonesia including macroeconomics, geopolitics and social risks; (5) risks relating to changes in the management team; (6) currency risks; and (7) a slower-than-expected expansion in micro segments.
Please refer to the firm's disclosure website at https://rave.credit-suisse.com/disclosures for the definitions of abbreviations typically used in the target price method and risk sections.
See the Companies Mentioned section for full company names
The subject company (BBCA.JK, BBNI.JK, BBRI.JK, BDMN.JK, BMRI.JK, BTPN.JK) currently is, or was during the 12-month period preceding the date of distribution of this report, a client of Credit Suisse.
Credit Suisse provided investment banking services to the subject company (BBNI.JK, BBRI.JK, BMRI.JK, BTPN.JK) within the past 12 months.
Credit Suisse has managed or co-managed a public offering of securities for the subject company (BBRI.JK, BMRI.JK) within the past 12 months.
Credit Suisse has received investment banking related compensation from the subject company (BBNI.JK, BBRI.JK, BMRI.JK, BTPN.JK) within the past 12 months
Credit Suisse expects to receive or intends to seek investment banking related compensation from the subject company (BBCA.JK, BBNI.JK, BBRI.JK, BDMN.JK, BMRI.JK, BTPN.JK) within the next 3 months.
Credit Suisse may have interest in (BBCA.JK, BBNI.JK, BBRI.JK, BBTN.JK, BDMN.JK, BJBR.JK, BMRI.JK, BTPN.JK)
Credit Suisse has a material conflict of interest with the subject company (BDMN.JK) . Credit Suisse is one of the joint financial advisors to DBS Group Holdings Limited in relation to the proposed acquisition of PT Bank Danamon Indonesia Tbk.
Important Regional Disclosures
Singapore recipients should contact Credit Suisse AG, Singapore Branch for any matters arising from this research report.
The analyst(s) involved in the preparation of this report have not visited the material operations of the subject company (BBCA.JK, BBNI.JK, BBRI.JK, BBTN.JK, BDMN.JK, BJBR.JK, BMRI.JK, BTPN.JK) within the past 12 months
Restrictions on certain Canadian securities are indicated by the following abbreviations: NVS--Non-Voting shares; RVS--Restricted Voting Shares; SVS--Subordinate Voting Shares.
Individuals receiving this report from a Canadian investment dealer that is not affiliated with Credit Suisse should be advised that this report may not contain regulatory disclosures the non-affiliated Canadian investment dealer would be required to make if this were its own report.
For Credit Suisse Securities (Canada), Inc.'s policies and procedures regarding the dissemination of equity research, please visit http://www.csfb.com/legal_terms/canada_research_policy.shtml.
Credit Suisse has acted as lead manager or syndicate member in a public offering of securities for the subject company (BBCA.JK, BBNI.JK, BBRI.JK, BBTN.JK, BDMN.JK, BMRI.JK, BTPN.JK) within the past 3 years.
As of the date of this report, Credit Suisse acts as a market maker or liquidity provider in the equities securities that are the subject of this report.
Principal is not guaranteed in the case of equities because equity prices are variable.
Commission is the commission rate or the amount agreed with a customer when setting up an account or at any time after that.
To the extent this is a report authored in whole or in part by a non-U.S. analyst and is made available in the U.S., the following are important disclosures regarding any non-U.S. analyst contributors: The non-U.S. research analysts listed below (if any) are not registered/qualified as research analysts with FINRA. The non-U.S. research analysts listed below may not be associated persons of CSSU and therefore may not be subject to the NASD Rule 2711 and NYSE Rule 472 restrictions on communications with a subject company, public appearances and trading securities held by a research analyst account.
For Credit Suisse disclosure information on other companies mentioned in this report, please visit the website at https://rave.credit-suisse.com/disclosures or call +1 (877) 291-2683.
10 April 2015
Indonesia Banks Sector 39
References in this report to Credit Suisse include all of the subsidiaries and affiliates of Credit Suisse operating under its investment banking division. For more information on our structure, please use the following link: https://www.credit-suisse.com/who_we_are/en/This report may contain material that is not directed to, or intended for distribution to or use by, any person or entity who is a citizen or resident of or located in any locality, state, country or other jurisdiction where such distribution, publication, availability or use would be contrary to law or regulation or which would subject Credit Suisse AG or its affiliates ("CS") to any registration or licensing requirement within such jurisdiction. All material presented in this report, unless specifically indicated otherwise, is under copyright to CS. None of the material, nor its content, nor any copy of it, may be altered in any way, transmitted to, copied or distributed to any other party, without the prior express written permission of CS. All trademarks, service marks and logos used in this report are trademarks or service marks or registered trademarks or service marks of CS or its affiliates. The information, tools and material presented in this report are provided to you for information purposes only and are not to be used or considered as an offer or the solicitation of an offer to sell or to buy or subscribe for securities or other financial instruments. CS may not have taken any steps to ensure that the securities referred to in this report are suitable for any particular investor. CS will not treat recipients of this report as its customers by virtue of their receiving this report. The investments and services contained or referred to in this report may not be suitable for you and it is recommended that you consult an independent investment advisor if you are in doubt about such investments or investment services. Nothing in this report constitutes investment, legal, accounting or tax advice, or a representation that any investment or strategy is suitable or appropriate to your individual circumstances, or otherwise constitutes a personal recommendation to you. CS does not advise on the tax consequences of investments and you are advised to contact an independent tax adviser. Please note in particular that the bases and levels of taxation may change. Information and opinions presented in this report have been obtained or derived from sources believed by CS to be reliable, but CS makes no representation as to their accuracy or completeness. CS accepts no liability for loss arising from the use of the material presented in this report, except that this exclusion of liability does not apply to the extent that such liability arises under specific statutes or regulations applicable to CS. This report is not to be relied upon in substitution for the exercise of independent judgment. CS may have issued, and may in the future issue, other communications that are inconsistent with, and reach different conclusions from, the information presented in this report. Those communications reflect the different assumptions, views and analytical methods of the analysts who prepared them and CS is under no obligation to ensure that such other communications are brought to the attention of any recipient of this report. Some investments referred to in this report will be offered solely by a single entity and in the case of some investments solely by CS, or an associate of CS or CS may be the only market maker in such investments. Past performance should not be taken as an indication or guarantee of future performance, and no representation or warranty, express or implied, is made regarding future performance. Information, opinions and estimates contained in this report reflect a judgment at its original date of publication by CS and are subject to change without notice. The price, value of and income from any of the securities or financial instruments mentioned in this report can fall as well as rise. The value of securities and financial instruments is subject to exchange rate fluctuation that may have a positive or adverse effect on the price or income of such securities or financial instruments. Investors in securities such as ADR's, the values of which are influenced by currency volatility, effectively assume this risk. Structured securities are complex instruments, typically involve a high degree of risk and are intended for sale only to sophisticated investors who are capable of understanding and assuming the risks involved. The market value of any structured security may be affected by changes in economic, financial and political factors (including, but not limited to, spot and forward interest and exchange rates), time to maturity, market conditions and volatility, and the credit quality of any issuer or reference issuer. Any investor interested in purchasing a structured product should conduct their own investigation and analysis of the product and consult with their own professional advisers as to the risks involved in making such a purchase. Some investments discussed in this report may have a high level of volatility. High volatility investments may experience sudden and large falls in their value causing losses when that investment is realised. Those losses may equal your original investment. Indeed, in the case of some investments the potential losses may exceed the amount of initial investment and, in such circumstances, you may be required to pay more money to support those losses. Income yields from investments may fluctuate and, in consequence, initial capital paid to make the investment may be used as part of that income yield. Some investments may not be readily realisable and it may be difficult to sell or realise those investments, similarly it may prove difficult for you to obtain reliable information about the value, or risks, to which such an investment is exposed. This report may provide the addresses of, or contain hyperlinks to, websites. Except to the extent to which the report refers to website material of CS, CS has not reviewed any such site and takes no responsibility for the content contained therein. Such address or hyperlink (including addresses or hyperlinks to CS's own website material) is provided solely for your convenience and information and the content of any such website does not in any way form part of this document. Accessing such website or following such link through this report or CS's website shall be at your own risk. This report is issued and distributed in Europe (except Switzerland) by Credit Suisse Securities (Europe) Limited, One Cabot Square, London E14 4QJ, England, which is authorised by the Prudential Regulation Authority and regulated by the Financial Conduct Authority and the Prudential Regulation Authority. This report is being distributed in Germany by Credit Suisse Securities (Europe) Limited Niederlassung Frankfurt am Main regulated by the Bundesanstalt fuer Finanzdienstleistungsaufsicht ("BaFin"). This report is being distributed in the United States and Canada by Credit Suisse Securities (USA) LLC; in Switzerland by Credit Suisse AG; in Brazil by Banco de Investimentos Credit Suisse (Brasil) S.A or its affiliates; in Mexico by Banco Credit Suisse (México), S.A. (transactions related to the securities mentioned in this report will only be effected in compliance with applicable regulation); in Japan by Credit Suisse Securities (Japan) Limited, Financial Instruments Firm, Director-General of Kanto Local Finance Bureau (Kinsho) No. 66, a member of Japan Securities Dealers Association, The Financial Futures Association of Japan, Japan Investment Advisers Association, Type II Financial Instruments Firms Association; elsewhere in Asia/ Pacific by whichever of the following is the appropriately authorised entity in the relevant jurisdiction: Credit Suisse (Hong Kong) Limited, Credit Suisse Equities (Australia) Limited, Credit Suisse Securities (Thailand) Limited, regulated by the Office of the Securities and Exchange Commission, Thailand, having registered address at 990 Abdulrahim Place, 27th Floor, Unit 2701, Rama IV Road, Silom, Bangrak, Bangkok 10500, Thailand, Tel. +66 2614 6000, Credit Suisse Securities (Malaysia) Sdn Bhd, Credit Suisse AG, Singapore Branch, Credit Suisse Securities (India) Private Limited (CIN no. U67120MH1996PTC104392) regulated by the Securities and Exchange Board of India (registration Nos. INB230970637; INF230970637; INB010970631; INF010970631), having registered address at 9th Floor, Ceejay House, Dr.A.B. Road, Worli, Mumbai - 18, India, T- +91-22 6777 3777, Credit Suisse Securities (Europe) Limited, Seoul Branch, Credit Suisse AG, Taipei Securities Branch, PT Credit Suisse Securities Indonesia, Credit Suisse Securities (Philippines ) Inc., and elsewhere in the world by the relevant authorised affiliate of the above. Research on Taiwanese securities produced by Credit Suisse AG, Taipei Securities Branch has been prepared by a registered Senior Business Person. Research provided to residents of Malaysia is authorised by the Head of Research for Credit Suisse Securities (Malaysia) Sdn Bhd, to whom they should direct any queries on +603 2723 2020. This report has been prepared and issued for distribution in Singapore to institutional investors, accredited investors and expert investors (each as defined under the Financial Advisers Regulations) only, and is also distributed by Credit Suisse AG, Singapore branch to overseas investors (as defined under the Financial Advisers Regulations). By virtue of your status as an institutional investor, accredited investor, expert investor or overseas investor, Credit Suisse AG, Singapore branch is exempted from complying with certain compliance requirements under the Financial Advisers Act, Chapter 110 of Singapore (the "FAA"), the Financial Advisers Regulations and the relevant Notices and Guidelines issued thereunder, in respect of any financial advisory service which Credit Suisse AG, Singapore branch may provide to you. This information is being distributed by Credit Suisse AG, Dubai Branch, duly licensed and regulated by the Dubai Financial Services Authority (DFSA), and is directed at Professional Clients or Market Counterparties only, as defined by the DFSA. The financial products or financial services to which the information relates will only be made available to a client who meets the regulatory criteria to be a Professional Client or Market Counterparty only, as defined by the DFSA, and is not intended for any other person. This research may not conform to Canadian disclosure requirements. In jurisdictions where CS is not already registered or licensed to trade in securities, transactions will only be effected in accordance with applicable securities legislation, which will vary from jurisdiction to jurisdiction and may require that the trade be made in accordance with applicable exemptions from registration or licensing requirements. Non-U.S. customers wishing to effect a transaction should contact a CS entity in their local jurisdiction unless governing law permits otherwise. U.S. customers wishing to effect a transaction should do so only by contacting a representative at Credit Suisse Securities (USA) LLC in the U.S. Please note that this research was originally prepared and issued by CS for distribution to their market professional and institutional investor customers. Recipients who are not market professional or institutional investor customers of CS should seek the advice of their independent financial advisor prior to taking any investment decision based on this report or for any necessary explanation of its contents. This research may relate to investments or services of a person outside of the UK or to other matters which are not authorised by the Prudential Regulation Authority and regulated by the Financial Conduct Authority and the Prudential Regulation Authority or in respect of which the protections of the Prudential Regulation Authority and Financial Conduct Authority for private customers and/or the UK compensation scheme may not be available, and further details as to where this may be the case are available upon request in respect of this report. CS may provide various services to US municipal entities or obligated persons ("municipalities"), including suggesting individual transactions or trades and entering into such transactions. Any services CS provides to municipalities are not viewed as "advice" within the meaning of Section 975 of the Dodd-Frank Wall Street Reform and Consumer Protection Act. CS is providing any such services and related information solely on an arm's length basis and not as an advisor or fiduciary to the municipality. In connection with the provision of the any such services, there is no agreement, direct or indirect, between any municipality (including the officials, management, employees or agents thereof) and CS for CS to provide advice to the municipality. Municipalities should consult with their financial, accounting and legal advisors regarding any such services provided by CS. In addition, CS is not acting for direct or indirect compensation to solicit the municipality on behalf of an unaffiliated broker, dealer, municipal securities dealer, municipal advisor, or investment adviser for the purpose of obtaining or retaining an engagement by the municipality for or in connection with Municipal Financial Products, the issuance of municipal securities, or of an investment adviser to provide investment advisory services to or on behalf of the municipality. If this report is being distributed by a financial institution other than Credit Suisse AG, or its affiliates, that financial institution is solely responsible for distribution. Clients of that institution should contact that institution to effect a transaction in the securities mentioned in this report or require further information. This report does not constitute investment advice by Credit Suisse to the clients of the distributing financial institution, and neither Credit Suisse AG, its affiliates, and their respective officers, directors and employees accept any liability whatsoever for any direct or consequential loss arising from their use of this report or its content. Principal is not guaranteed. Commission is the commission rate or the amount agreed with a customer when setting up an account or at any time after that.
Investment principal on bonds can be eroded depending on sale price or market price. In addition, there are bonds on which investment principal can be eroded due to changes in redemption amounts. Care is required when investing in such instruments. When you purchase non-listed Japanese fixed income securities (Japanese government bonds, Japanese municipal bonds, Japanese government guaranteed bonds, Japanese corporate bonds) from CS as a seller, you will be requested to pay the purchase price only.