Page 1
___________________________________________________________________________
2008/SOM3/ISTWG/SYM/008 Agenda Item: 1-05
Indonesia Mitigation and Adaptation Program in Responding to Climate Change Issue
Submitted by: Indonesia
APEC Climate SymposiumLima, Peru
19-21 August 2008
Page 2
19 August, 2008 APEC Climate Symposium, 2008
Abstract 1-05
INDONESIA MITIGATION AND ADAPTATION PROGRAM IN RESPONDING TO CLIMATE CHANGE ISSUE
Yunus S. Swarinoto
Climatologist, Geographer, Senior Researcher in Climatology
Head, Climatological and Air Quality Data Management Division
Indonesia Meteorological and Geophysical Agency, JAKARTA
E-mail: [email protected] .
ABSTRACT Global Warming and Climate Change are known as recent issue which have been paid attention by
miscellaneous countries. These countries are coming from both developed countries and developing
ones. Miscellaneous responses are also emerging from industrial countries and agriculture ones. The
global action to reduce pollutant emission into the atmosphere is obviously sponsored by the United
Nation (UN). The last international meeting have been held in Nusa Dua Bali Indonesia during
December 2007. This meeting is called as Conference of Parties (COP) XIII. This paper is provided In
order to show and detect the occurrences of climate change in Indonesia as a result of global
warming, Data sample taken from miscellaneous locations have been computed. The sample location
is chosen at Padang and its surrounding in West Sumatera Province, Indonesia. Those data are
processing such as: sea surface temperature (SST), Green House Gasses (GHG) concentration, and
other climate parameter data which have been considered as having properly relationship with climate
change issue in Indonesia. Results showed that trend line taken from all data processing output in
miscellaneous locations in Indonesia, are generally continuously increasing or decreasing. The
average yearly SST in Indonesia is increasing at least +0,59 °C using 1982-2007 data series. During
January since the year of 1982 until now, the range of maximum average SST and minimum ones
have been noted increasingly as +1,062 °C, meanwhile during July, the maximum range of average
SST is noted increasingly as +1,572 °C. Since the year of 2004, the increased concentration of GHG
CO2 reaches 1,0%, N2O reaches 0,8%, SF6 reaches 17%, and CH4 reaches un-significantly
decreasing concentration. Record of daily maximum-minimum surface temperature observation taken
from automatic weather station (AWS) equipment in Global Atmosphere Watch (GAW) Bukit
Kototabang West Sumatera is also showed that the distance of trend line of maximum and minimum
temperatures apparently closer and closer each other. The first observation of AWS is noted in
August 1999. In order to respond the Intergovernmental Panel of Climate Change (IPCC), Indonesia
Meteorological and Geophysical Agency (BMG) have already had programs to mitigate and adapt the
climate change issue. These programs are provided especially for agriculture, infrastructure, coastal
area infrastructure, health, fishery, transportation, water, and also energy.
Key Words: climate change, decreasing, green house gasses, increasing, global warming,
sea surface temperature, trend line
Page 3
BMG
INDONESIA MITIGATION AND ADAPTATION PROGRAMS IN
RESPONDING TO CLIMATE CHANGE ISSUE
Yunus S. SwarinotoMeteorologist, Geographer
Indonesia Meteorological & Geophysical Agency
BMGOutline
1. Introduction2. Global Atmosphere Watch
3. Climate System4. Existing Condition
5. Climate Change Detection6. Indonesia Action Plan
7. Closing
Page 4
BMG
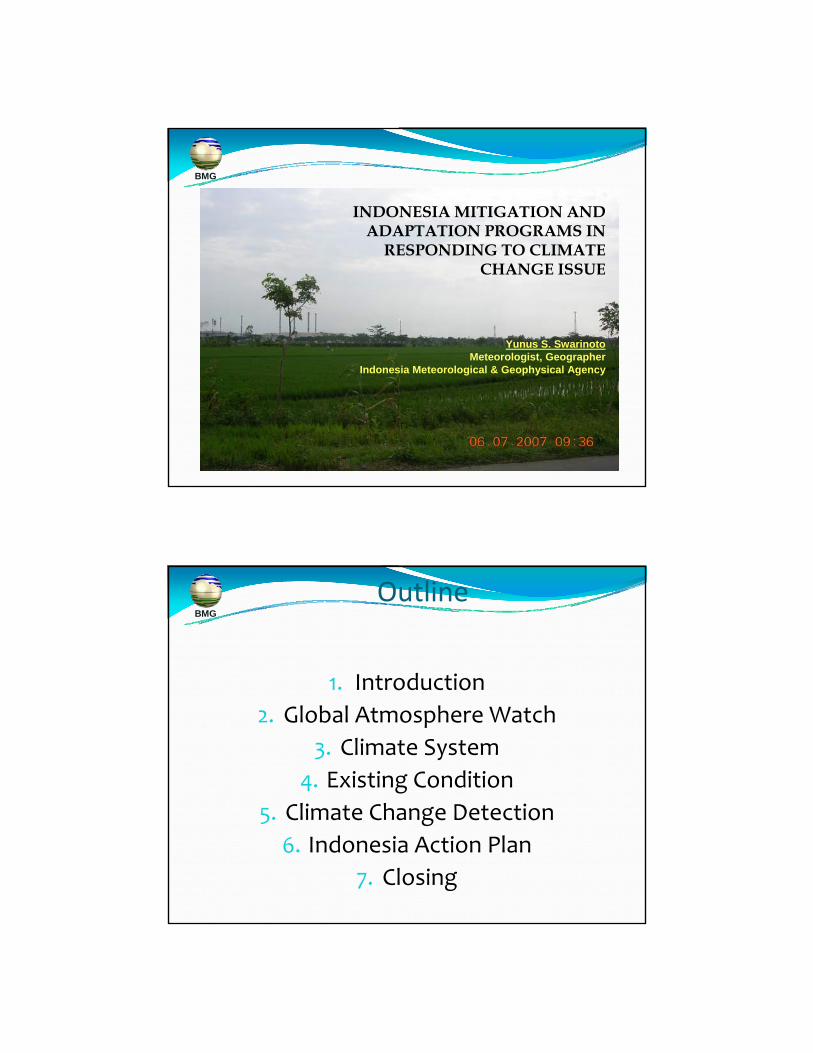
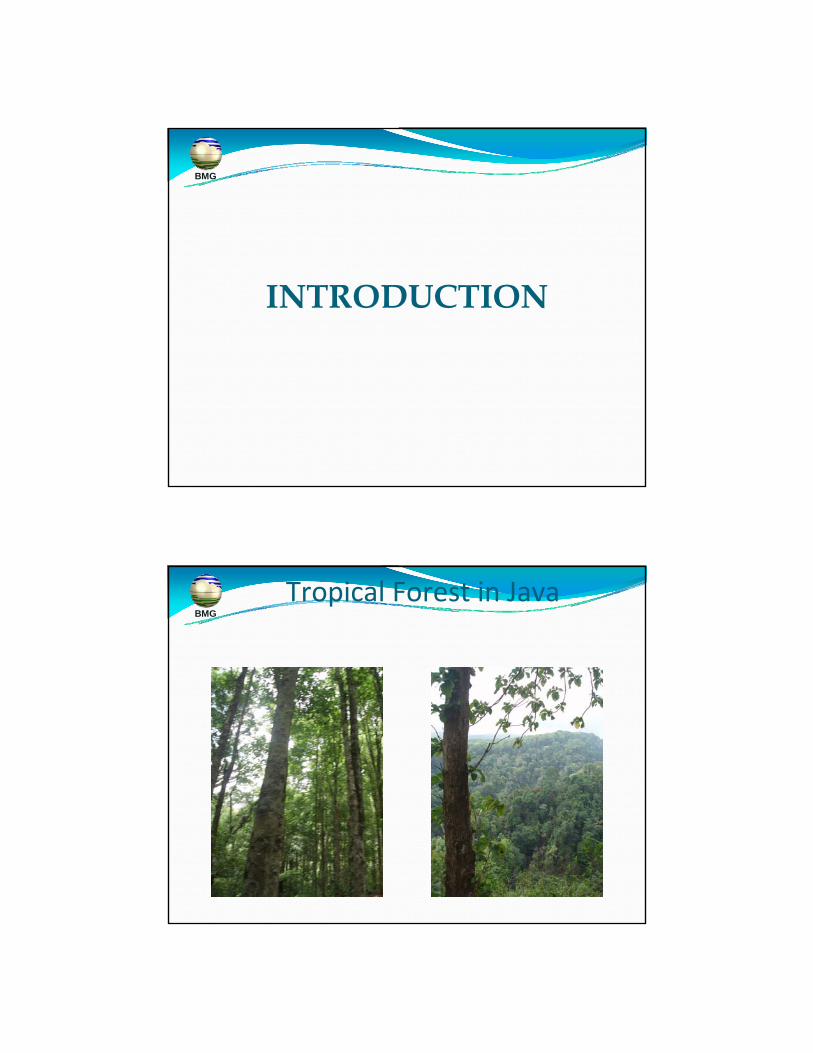
INTRODUCTION
BMGTropical Forest in Java
Page 5
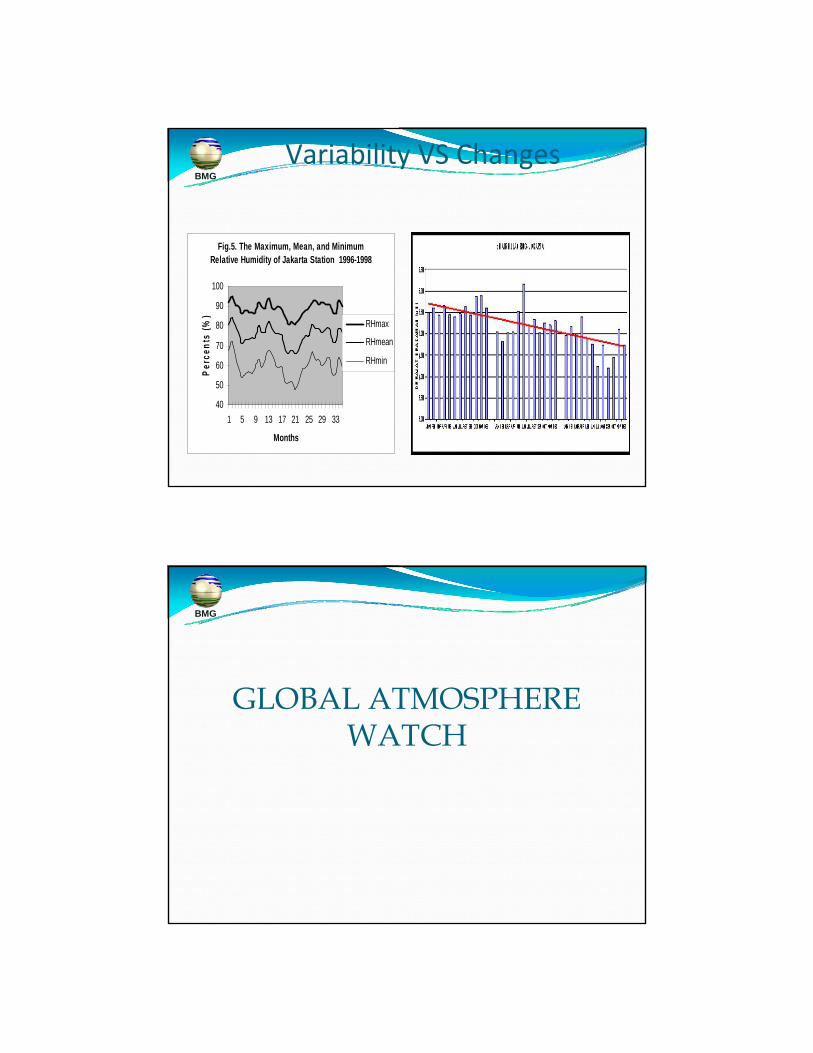
BMGVariability VS Changes
Fig.5. The Maximum, Mean, and Minimum Relative Humidity of Jakarta Station 1996-1998
40
50
60
70
80
90
100
1 5 9 13 17 21 25 29 33
Months
Perc
ents
(%)
RHmax
RHmean
RHmin
BMG
GLOBAL ATMOSPHERE WATCH
Page 6
BMG
40
0
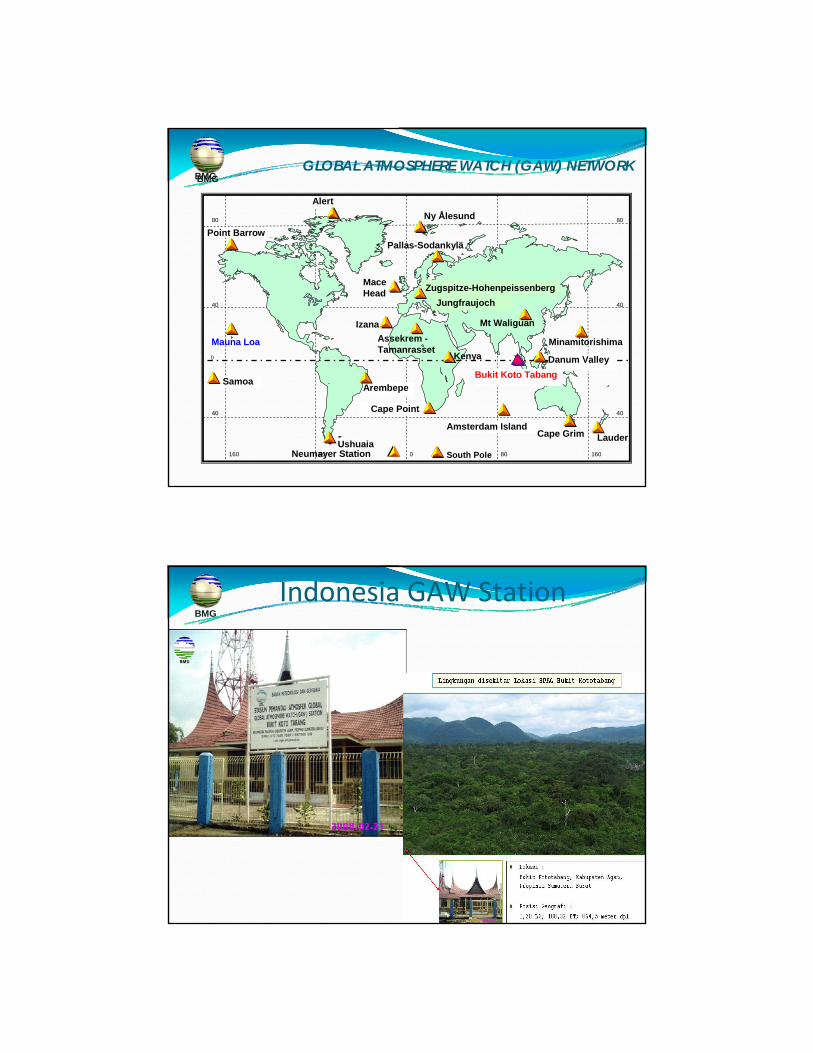
South Pole
Point Barrow
Mauna Loa
Alert
Pallas-Sodankylä
MinamitorishimaKenya
Assekrem -Tamanrasset
Arembepe
Ushuaia
Izana
Amsterdam IslandCape Grim
Cape Point
Samoa
Ny Ålesund
Lauder
Mace Head
40
80
40
0
40
80
160 80 0 80 160
Zugspitze-Hohenpeissenberg
Mt Waliguan
Neumayer Station
Bukit Koto Tabang
Jungfraujoch
Danum Valley
GLOBAL ATMOSPHERE WATCH (GAW) NETWORKBMG
BMGIndonesia GAW Station
Page 7
BMG
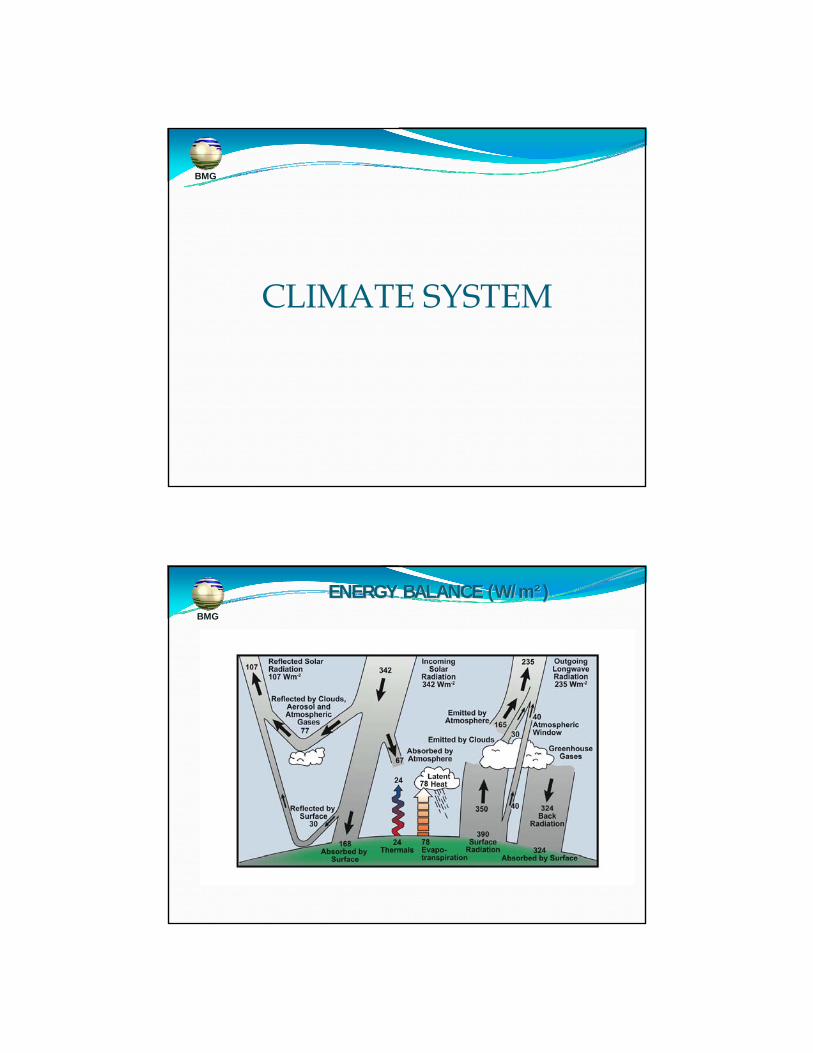
CLIMATE SYSTEM
BMG
ENERGY BALANCE (W/mENERGY BALANCE (W/m²²))
Page 8
BMG
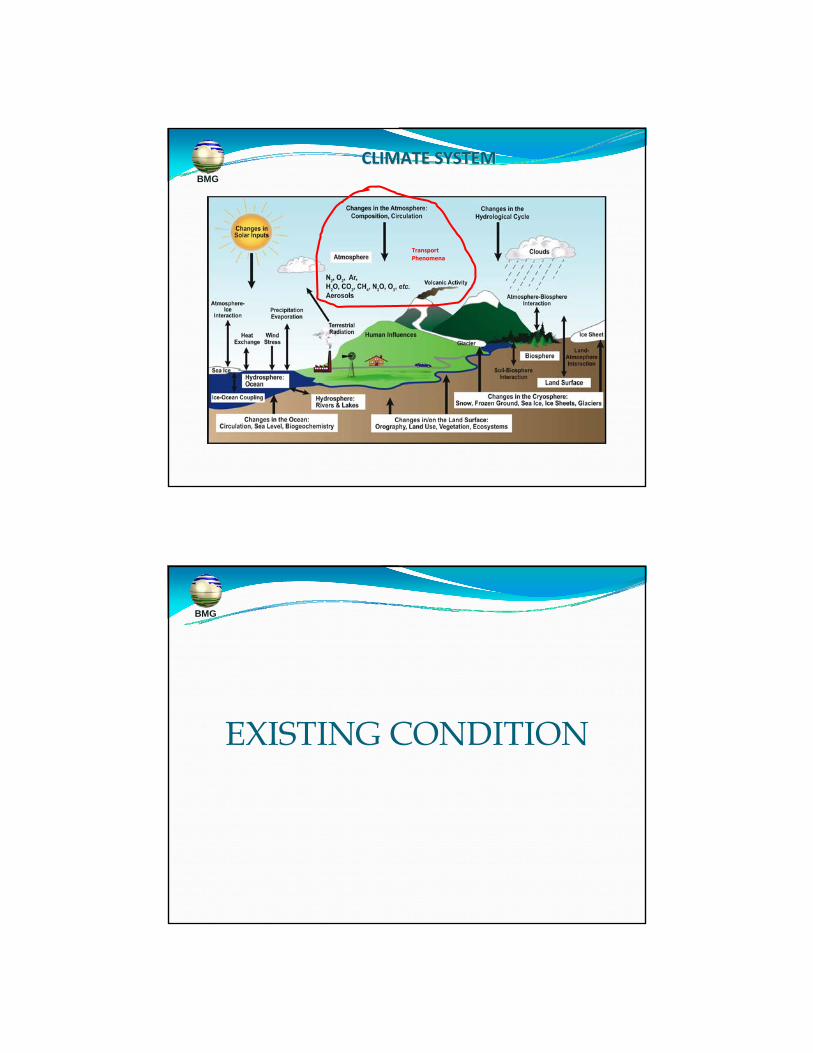
CLIMATE SYSTEMCLIMATE SYSTEM
Transport Transport PhenomenaPhenomena
BMG
EXISTING CONDITION
Page 9
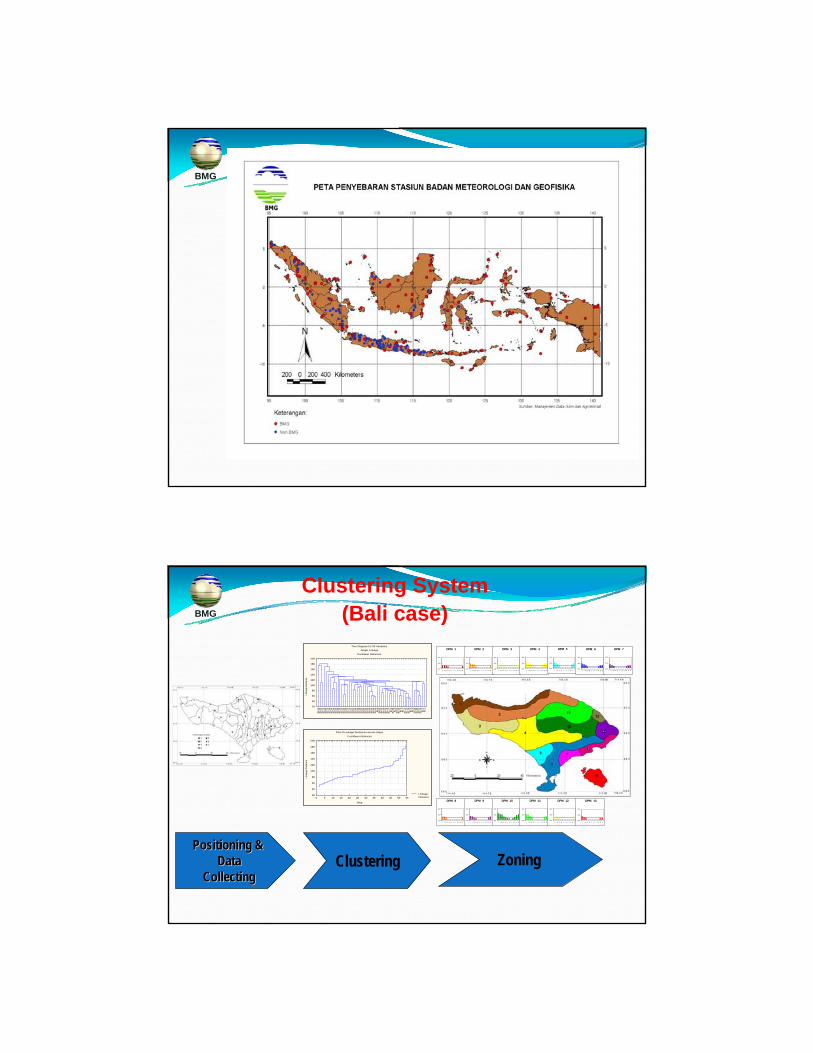
BMGMeteorological Stations in Indonesia
BMG
Clustering System(Bali case)
Positioning & Positioning & DataData
CollectingCollectingClustering Zoning
Tree Diagram for 55 Variables
Single Linkage
Euclidean distances
Link
age
Dis
tanc
e
20
40
60
80
100
120
140
160
180
200
B
L41
B
L35
B
L24
B
L13
B
L53
B
L15
B
L46
B
L27
B
L26
B
L23
B
L30
B
L10
B
L42
B
L34
B
L29
B
L25
B
L14
B
L37
B
L55
B
L44
B
L48
B
L38
B
L20
B
L50
B
L32
B
L40
B
L49
B
L54
B
L43
B
L31
B
L8
BL5
2
BL2
2
BL1
6
BL2
1
BL1
8
BL1
7
BL9
B
L39
B
L6
BL5
1
BL4
5
BL5
B
L7
BL1
1
BL1
2
BL1
9
BL3
B
L4
BL3
3
BL3
6
BL4
7
BL2
8
BL2
B
L1
Linkage Distance
Plot of Linkage Distances across Steps
Euclidean distances
Step
Link
age
Dis
tanc
e
20
40
60
80
100
120
140
160
180
200
0 5 10 15 20 25 30 35 40 45 50 55
DPM 1
-100
400
900
J J M A M J J A S O N D
DPM 2
-100
400
900
J J M A M J J A S O N D
DPM 3
-100
400
900
J J M A M J J A S O N D
DPM 4
-100
400
900
J J M A M J J A S O N D
DPM 5
-100
400
900
J J M A M J J A S O N D
DPM 6
-100
400
900
J J M A M J J A S O N D
DPM 7
-100
400
900
J J M A M J J A S O N D
DPM 8
-100
400
900
J J M A M J J A S O N D
DPM 9
-100
400
900
J J M A M J J A S O N D
DPM 10
-100
400
900
J J M A M J J A S O N D
DPM 11
-100
400
900
J J M A M J J A S O N D
DPM 12
-100
400
900
J J M A M J J A S O N D
DPM 13
-100
400
900
J J M A M J J A S O N D
Page 10
BMG
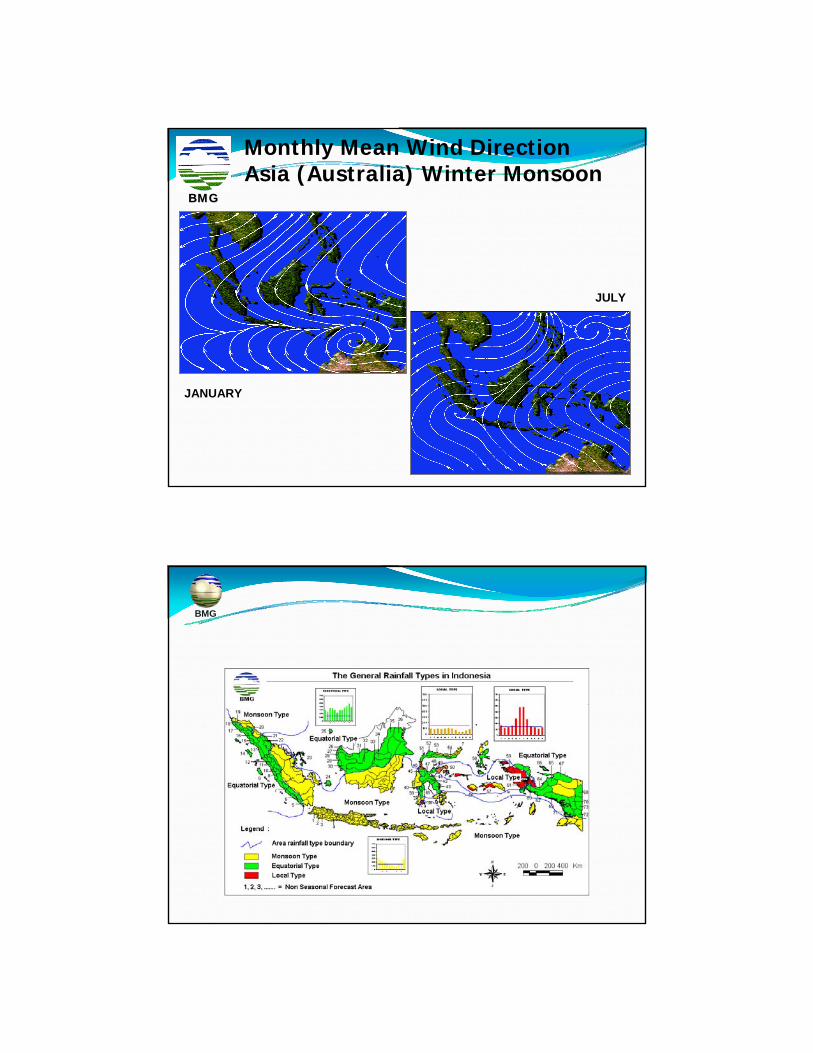
Monthly Mean Wind Direction Asia (Australia) Winter Monsoon
BMGBMG
JANUARY
JULY
BMG
Page 11
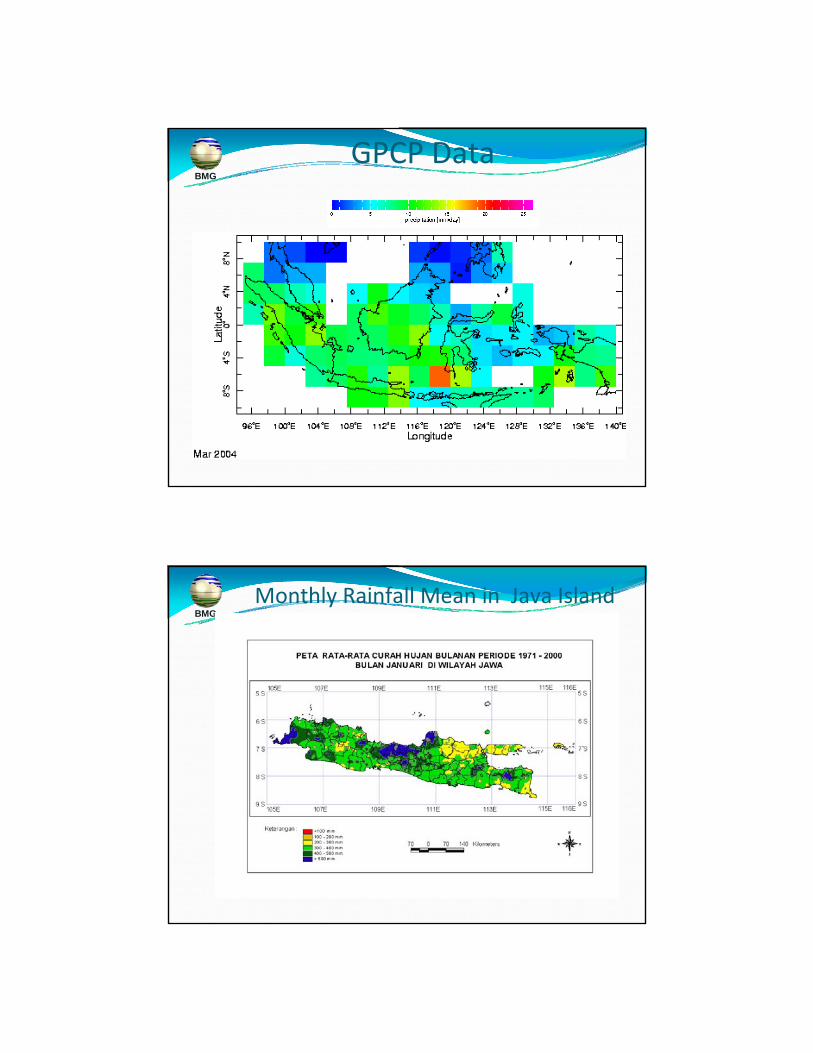
BMGGPCP Data
BMGMonthly Rainfall Mean in Java Island
Page 12
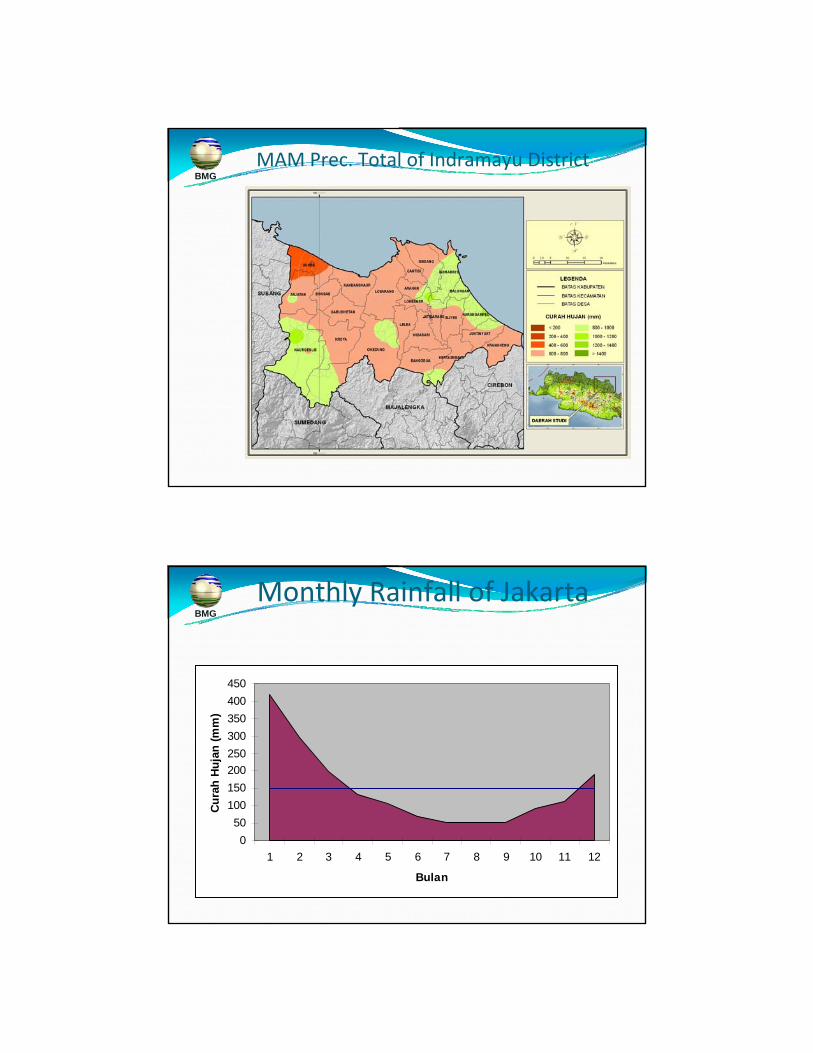
BMGMAM Prec. Total of Indramayu District
BMGMonthly Rainfall of Jakarta
050
100150200250300350400450
1 2 3 4 5 6 7 8 9 10 11 12
Bulan
Cur
ah H
ujan
(mm
)
Page 13
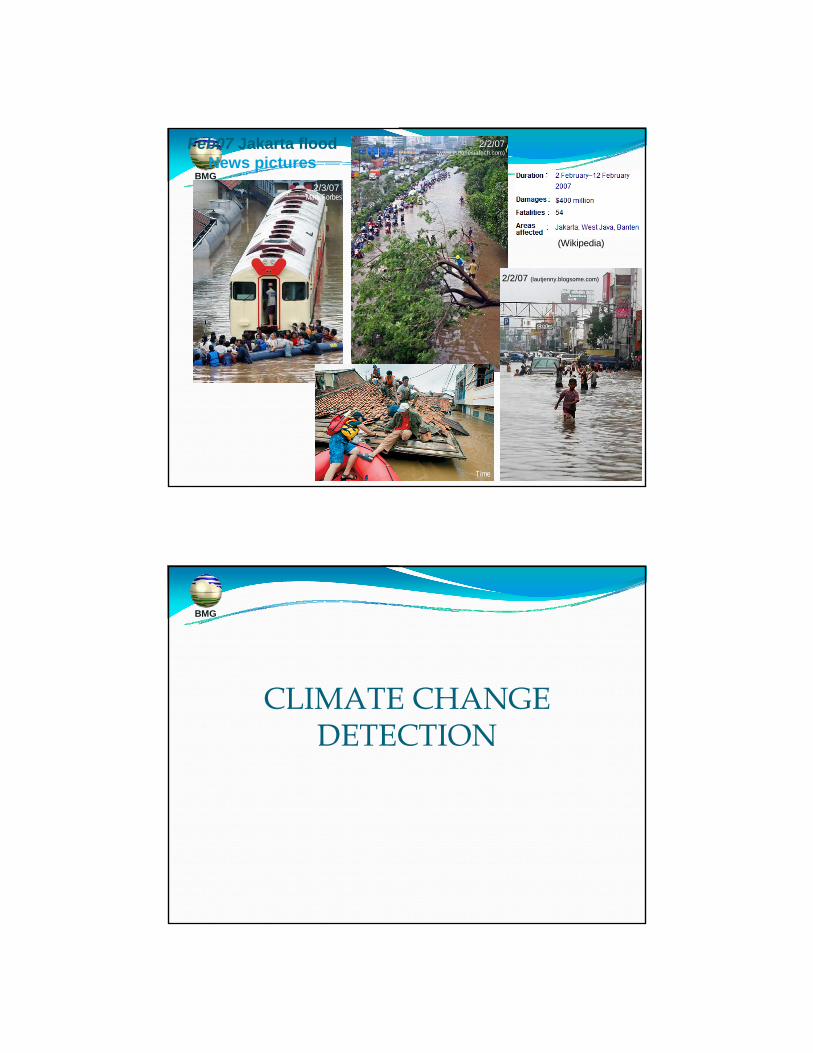
BMG
Feb07 Jakarta floodNews pictures
2/2/07 (lautjenny.blogsome.com)
2/2/07(www.indonesiatech.com)
Mark Forbes 2/3/07
Time
(Wikipedia)
BMG
CLIMATE CHANGEDETECTION
Page 14
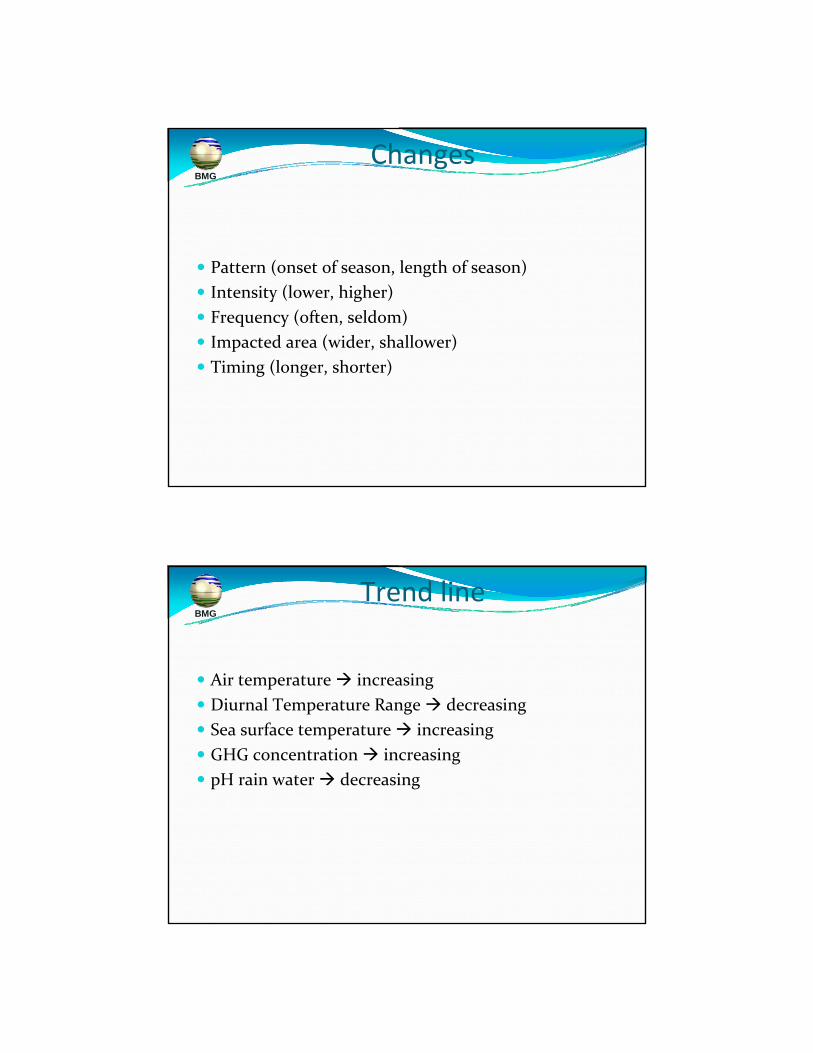
BMGChanges
Pattern (onset of season, length of season)Intensity (lower, higher)Frequency (often, seldom)Impacted area (wider, shallower)Timing (longer, shorter)
BMGTrend line
Air temperature increasingDiurnal Temperature Range decreasingSea surface temperature increasingGHG concentration increasingpH rain water decreasing
Page 15
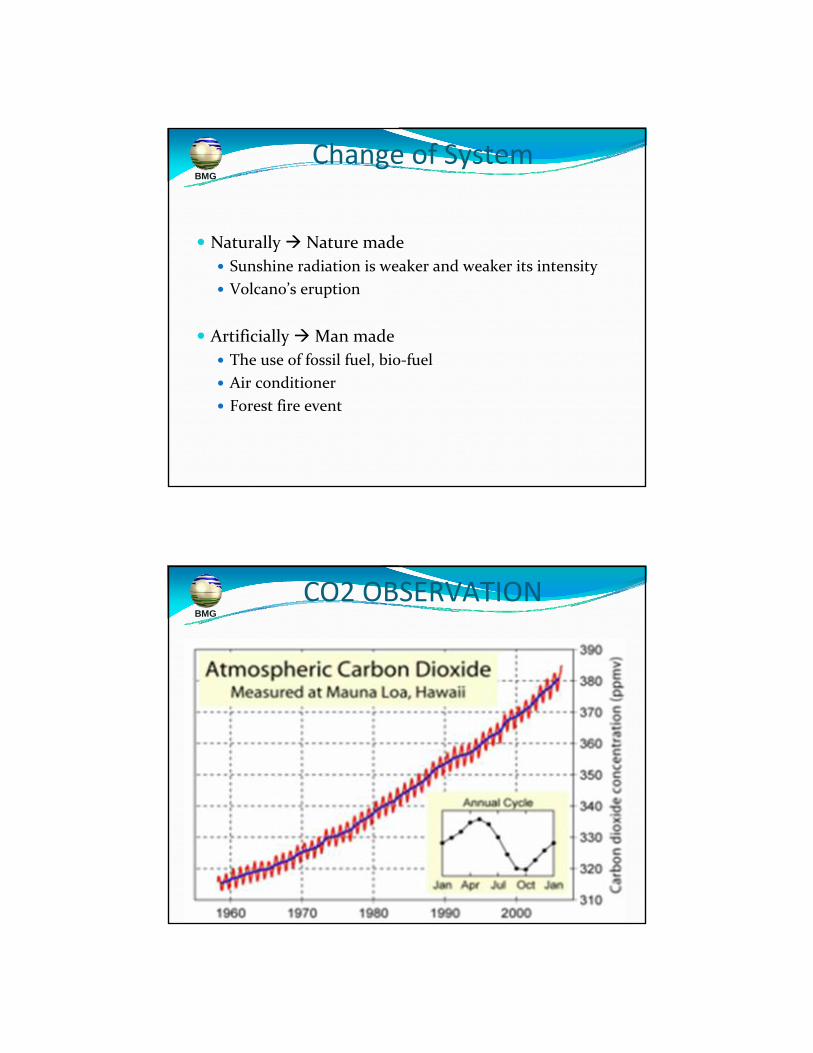
BMGChange of System
Naturally Nature madeSunshine radiation is weaker and weaker its intensityVolcano’s eruption
Artificially Man madeThe use of fossil fuel, bio‐fuelAir conditionerForest fire event
BMGCO2 OBSERVATION
Page 16
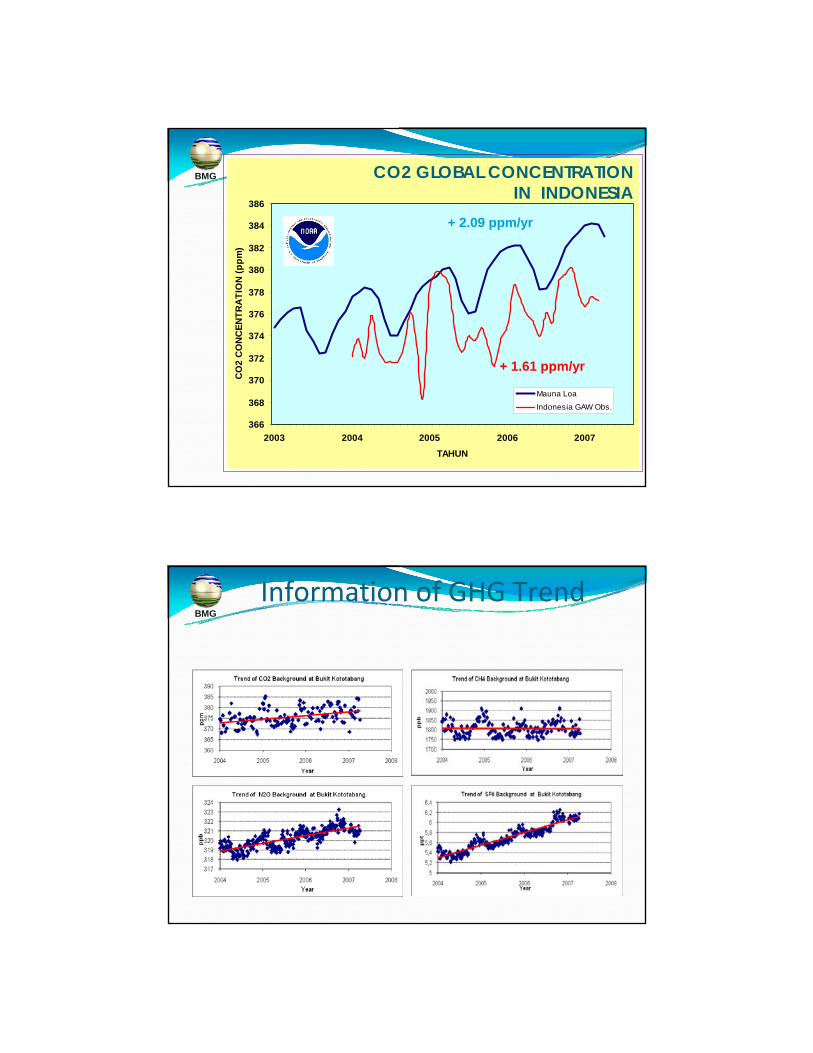
BMG KONSENTRASI CO2 GLOBAL & DI ATAS INDONESIA
366
368
370
372
374
376
378
380
382
384
386
2003 2004 2005 2006 2007TAHUN
CO
2 C
ON
CEN
TRA
TIO
N (p
pm)
Mauna Loa
Indonesia GAW Obs.
+ 2.09 ppm/yr
+ 1.61 ppm/yr
CO2 GLOBAL CONCENTRATION IN INDONESIA
BMGInformation of GHG Trend
Page 17
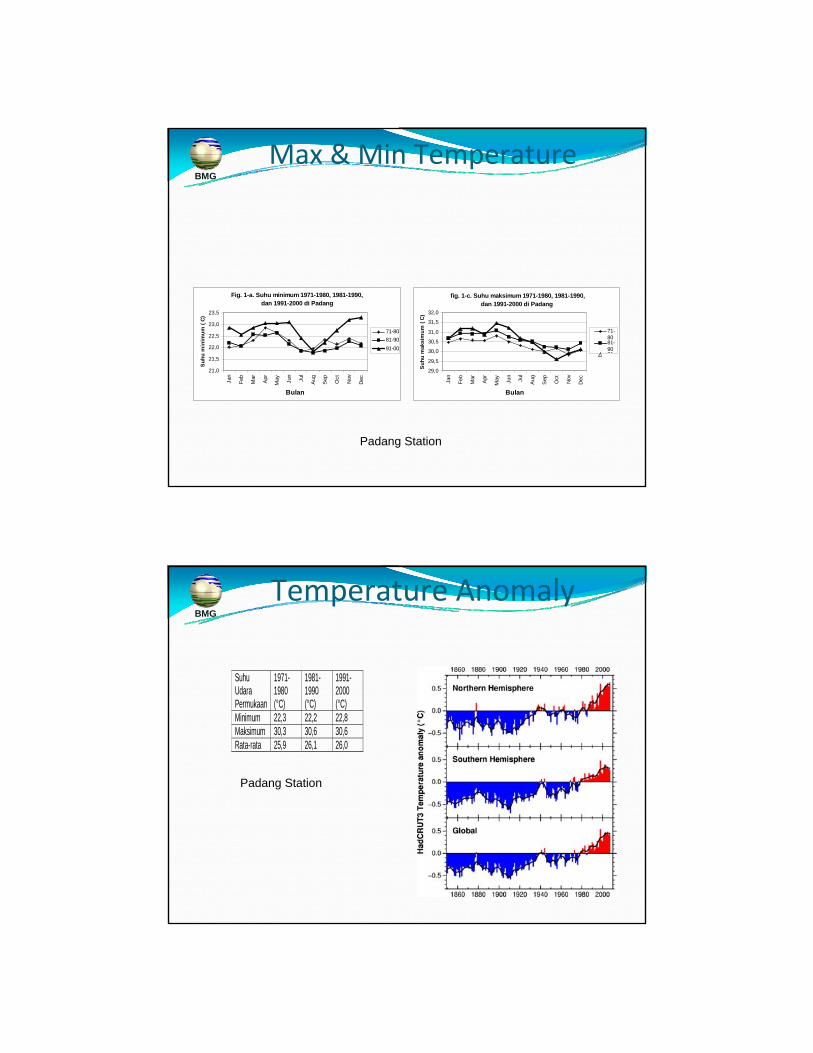
BMGMax & Min Temperature
Fig. 1-a. Suhu minimum 1971-1980, 1981-1990, dan 1991-2000 di Padang
21,0
21,5
22,0
22,5
23,0
23,5
Jan
Feb
Mar
Apr
May Ju
n
Jul
Aug
Sep Oct
Nov
Dec
Bulan
Suhu
min
imum
( C)
71-8081-9091-00
fig. 1-c. Suhu maksimum 1971-1980, 1981-1990, dan 1991-2000 di Padang
29,0
29,5
30,0
30,5
31,0
31,5
32,0
Jan
Feb
Mar
Apr
May Ju
n
Jul
Aug
Sep Oct
Nov
Dec
Bulan
Suh
u m
aksi
mum
( C
)
71-8081-9091
Padang Station
BMGTemperature Anomaly
Suhu Udara Permukaan
1971-1980 (°C)
1981-1990 (°C)
1991-2000 (°C)
Minimum 22,3 22,2 22,8 Maksimum 30,3 30,6 30,6 Rata-rata 25,9 26,1 26,0
Padang Station
Page 18
BMG
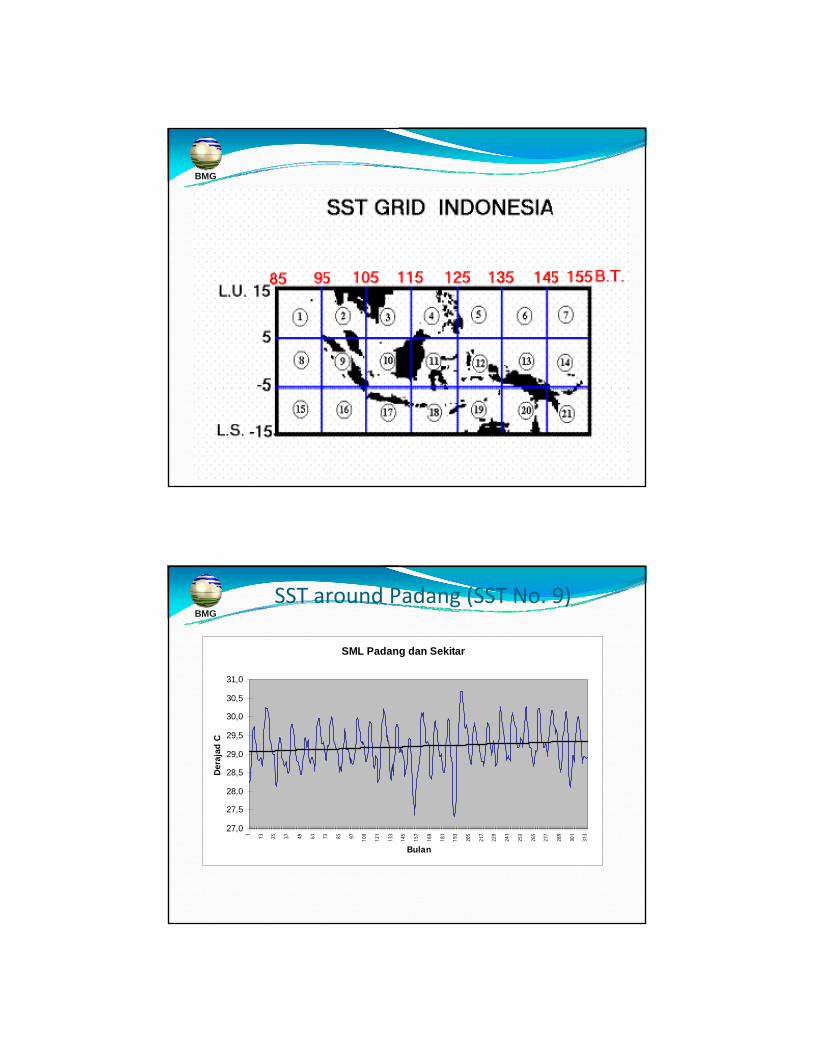
BMGSST around Padang (SST No. 9)
SML Padang dan Sekitar
27,0
27,5
28,0
28,5
29,0
29,5
30,0
30,5
31,0
1 13 25 37 49 61 73 85 97 109
121
133
145
157
169
181
193
205
217
229
241
253
265
277
289
301
313
Bulan
Dera
jad
C
Page 19
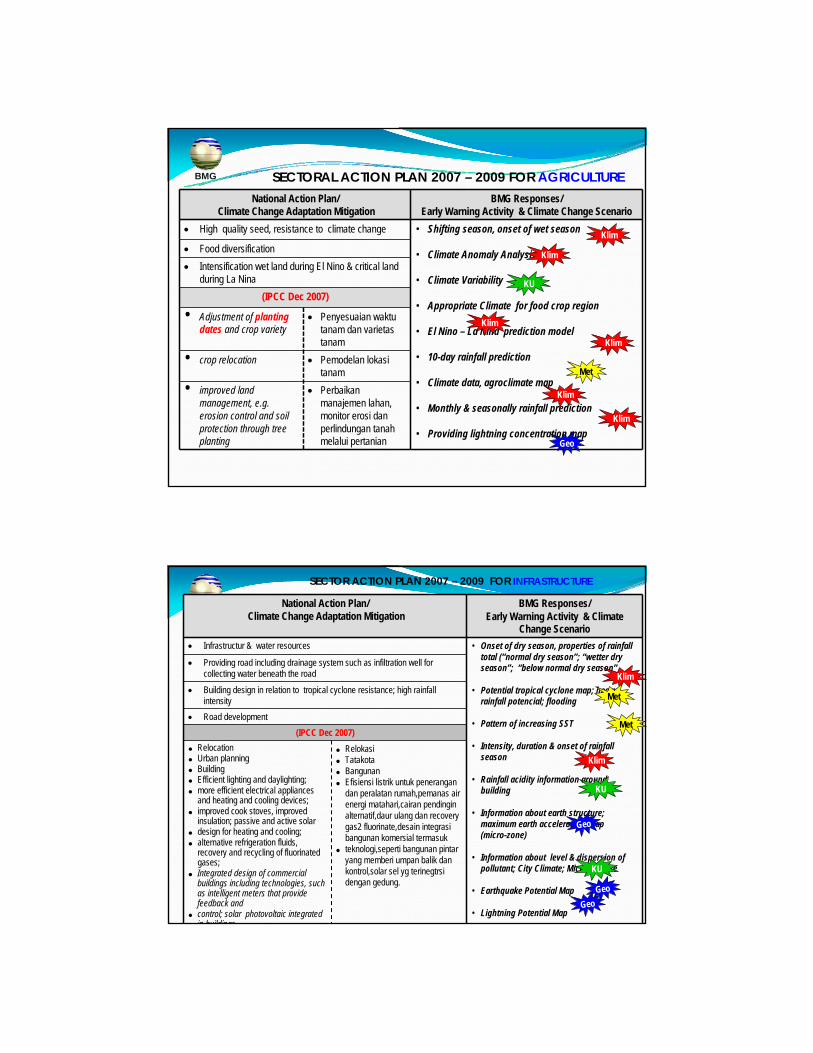
BMGSST AVERAGE in INDONESIA
AVE SST INDONESIA
27.0
27.5
28.0
28.5
29.0
29.5
1982
1983
1984
1985
1986
1987
1988
1989
1990
1991
1992
1993
1994
1995
1996
1997
1998
1999
2000
2001
2002
2003
2004
2005
2006
2007
Year
Tem
pera
ture
(oC)
SST9 JAN 82-07
27.5
28.0
28.5
29.0
29.5
1982
1983
1984
1985
1986
1987
1988
1989
1990
1991
1992
1993
1994
1995
1996
1997
1998
1999
2000
2001
2002
2003
2004
2005
2006
2007
Year
C de
gree
SST9 JUL 82-07
28.0
28.5
29.0
29.5
30.0
30.5
1982
1983
1984
1985
1986
1987
1988
1989
1990
1991
1992
1993
1994
1995
1996
1997
1998
1999
2000
2001
2002
2003
2004
2005
2006
2007
Year
C de
gree
BMG
ACTION PLANACTION PLAN
Page 20
BMG
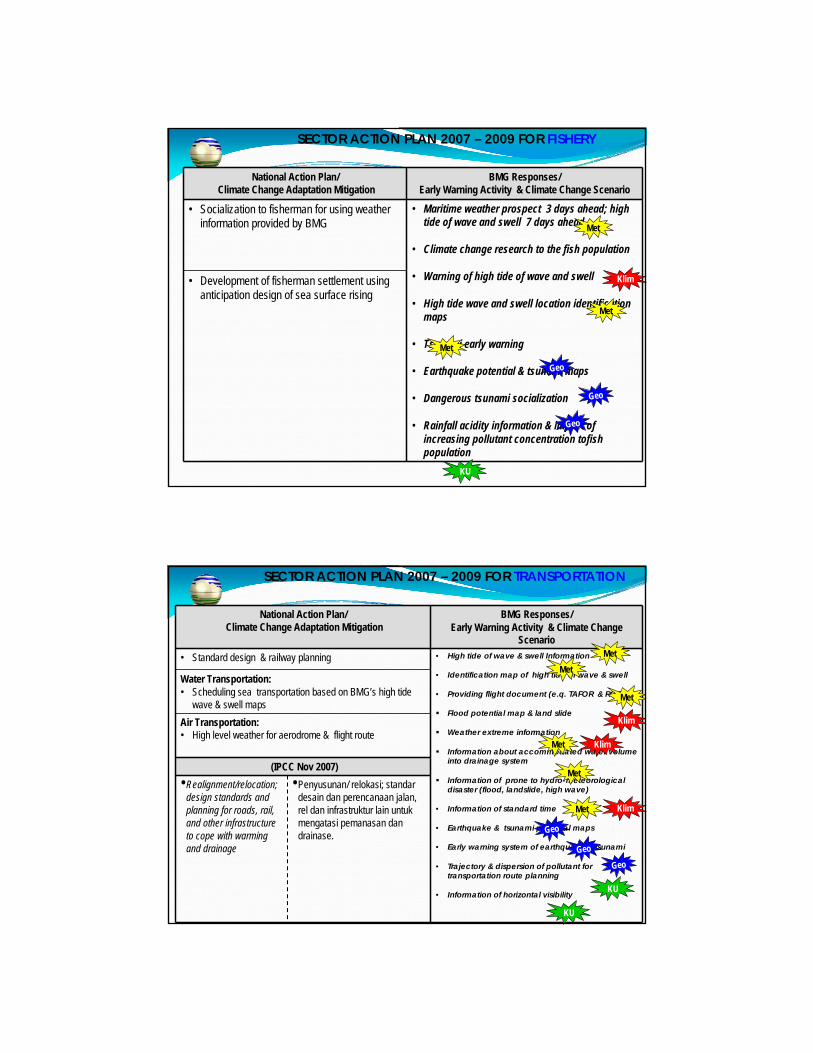
National Action Plan/Climate Change Adaptation Mitigation
BMG Responses/ Early Warning Activity & Climate Change Scenario
• High quality seed, resistance to climate change • Shifting season, onset of wet season
• Climate Anomaly Analysis
• Climate Variability
• Appropriate Climate for food crop region
• El Nino – La Nina prediction model
• 10-day rainfall prediction
• Climate data, agroclimate map
• Monthly & seasonally rainfall prediction
• Providing lightning concentration map
• Food diversification• Intensification wet land during El Nino & critical land
during La Nina(IPCC Dec 2007)
• Adjustment of planting dates and crop variety
• Penyesuaian waktutanam dan varietastanam
• crop relocation • Pemodelan lokasitanam
• improved land management, e.g. erosion control and soil protection through tree planting
• Perbaikanmanajemen lahan, monitor erosi danperlindungan tanahmelalui pertanian
SECTORAL ACTION PLAN 2007 – 2009 FOR AGRICULTURE
Met
Klim
Klim
Klim
Klim
Klim
Klim
Geo
KU
BMGNational Action Plan/
Climate Change Adaptation Mitigation BMG Responses/
Early Warning Activity & Climate Change Scenario
• Infrastructur & water resources • Onset of dry season, properties of rainfall total (“normal dry season”; “wetter dry season”; “below normal dry season”
• Potential tropical cyclone map; heavy rainfall potencial; flooding
• Pattern of increasing SST
• Intensity, duration & onset of rainfall season
• Rainfall acidity information around building
• Information about earth structure; maximum earth acceleration map (micro-zone)
• Information about level & dispersion of pollutant; City Climate; Micro Climate
• Earthquake Potential Map
• Lightning Potential Map
• Providing road including drainage system such as infiltration well for collecting water beneath the road
• Building design in relation to tropical cyclone resistance; high rainfall intensity
• Road development(IPCC Dec 2007)
RelocationUrban planningBuildingEfficient lighting and daylighting; more efficient electrical appliances and heating and cooling devices; improved cook stoves, improved insulation; passive and active solar design for heating and cooling; alternative refrigeration fluids, recovery and recycling of fluorinated gases; Integrated design of commercial buildings including technologies, such as intelligent meters that provide feedback and control; solar photovoltaic integrated in buildings
RelokasiTatakotaBangunanEfisiensi listrik untuk penerangandan peralatan rumah,pemanas air energi matahari,cairan pendinginalternatif,daur ulang dan recovery gas2 fluorinate,desain integrasibangunan komersial termasukteknologi,seperti bangunan pintaryang memberi umpan balik dankontrol,solar sel yg terinegtrsidengan gedung.
SECTOR ACTION PLAN 2007 – 2009 FOR INFRASTRUCTURE
Geo
Klim
Klim
Met
Met
Geo
Geo
KU
KU
Page 21
BMG National Action Plan/Climate Change Adaptation Mitigation
BMG Responses/ Early Warning Activity & Climate
Change Scenario• Relocation: moving people & infrastructure to the safe location • Information about Saved Location
(elevation)
• Information about maritime extreme meteorology
• Early warning system for weather extreme
Information about coastal weather/ climate
Information about maximum impact & maximum forcing coastal flood (rob, swell, etc. for choosing safety location; barrier or sea wall structure
Earthquake potential & tsunami map
Lightning potential map
Destroying ecosystem & acid rain
• Providing building protector: river bank, coastal area recovery,planting vegetation variety
• Adaptation to climate change condition
IPCC (Nov 2007)
• Relocation; seawalls and storm surge barriers; dune reinforcement; land acquisition and creation of marshlands/ wetlands as buffer against sea level rise and flooding; protection of existing natural barriers
•Relokasi;Penghalang badai dan gelombang tinggi;penguatan bukit-bukit pasir di pesisir; pembuatan rawa dan lahan basah sbg penyangga banjir dan kenaikan muka laut;menjaga penghalang2 alami yg sudah ada
SECTOR ACTION PLAN 2007 – 2009 FOR COASTAL AREA INFRASTRUCTURE
Klim
Met
Met
Met
Met
Geo
Geo
Geo
KU
BMG
National Action Plan/Climate Change Adaptation Mitigation
BMG Responses/ Early Warning Activity & Climate Change Scenario
• Health socialization for people in relation to malaria, dengue, other tropical disease
• Seasonal change pattern; prediction of rainfall season onset in relation to dengue outbreak & malaria
• Climate extreme information
• Early warning system: urban heat island (pollutant – temperature – pressure –humidity)
• Daily weather information; monthly rainfall
• Rapid earthquake information; tsunami early warning
• Earthquake potential & tsunami maps
• Pollutant consentration information; UV radiation; visibility, rainfall acidity
• Adaptation to climate change condition
(IPCC Nov 2007)
• Emergency medical services
• Layanan kesehatanemergensi
• Improved climate sensitive disease surveillance and control
• Perbaikanpengawasanpenyakit rentanterhadap perubahaniklim
• Safe water and improved sanitation
• Pengamanan air bersih dan sanitasi
SECTOR ACTION PLAN 2007 – 2009 FOR HEALTH
Klim
Met
Met
Geo
Geo
KU
KU
Klim
Page 22
BMG National Action Plan/Climate Change Adaptation Mitigation
BMG Responses/ Early Warning Activity & Climate Change Scenario
• Socialization to fisherman for using weather information provided by BMG
• Maritime weather prospect 3 days ahead; high tide of wave and swell 7 days ahead
• Climate change research to the fish population
• Warning of high tide of wave and swell
• High tide wave and swell location identification maps
• Tsunami early warning
• Earthquake potential & tsunami maps
• Dangerous tsunami socialization
• Rainfall acidity information & impact of increasing pollutant concentration tofish population
• Development of fisherman settlement using anticipation design of sea surface rising
SECTOR ACTION PLAN 2007 – 2009 FOR FISHERY
Met
Met
Met
Klim
Geo
Geo
Geo
KU
BMG National Action Plan/Climate Change Adaptation Mitigation
BMG Responses/ Early Warning Activity & Climate Change
Scenario• Standard design & railway planning • High tide of wave & swell Information
• Identification map of high tide of wave & swell
• Providing flight document (e.q. TAFOR & ROFOR)
Flood potential map & land slide
Weather extreme information
Information about accommodated water volume into drainage system
Information of prone to hydro-meteorological disaster (flood, landslide, high wave)
• Information of standard time
• Earthquake & tsunami potential maps
• Early warning system of earthquake & tsunami
• Trajectory & dispersion of pollutant for transportation route planning
• Information of horizontal visibility
Water Transportation:• Scheduling sea transportation based on BMG’s high tide
wave & swell mapsAir Transportation:• High level weather for aerodrome & flight route
(IPCC Nov 2007)•Realignment/relocation;
design standards and planning for roads, rail, and other infrastructure to cope with warming and drainage
•Penyusunan/ relokasi; standardesain dan perencanaan jalan, rel dan infrastruktur lain untukmengatasi pemanasan dandrainase.
SECTOR ACTION PLAN 2007 – 2009 FOR TRANSPORTATION
Klim
Met
Met
Met
Met
Met Klim
Met
Klim
Geo
Geo
Geo
KU
KU
Page 23
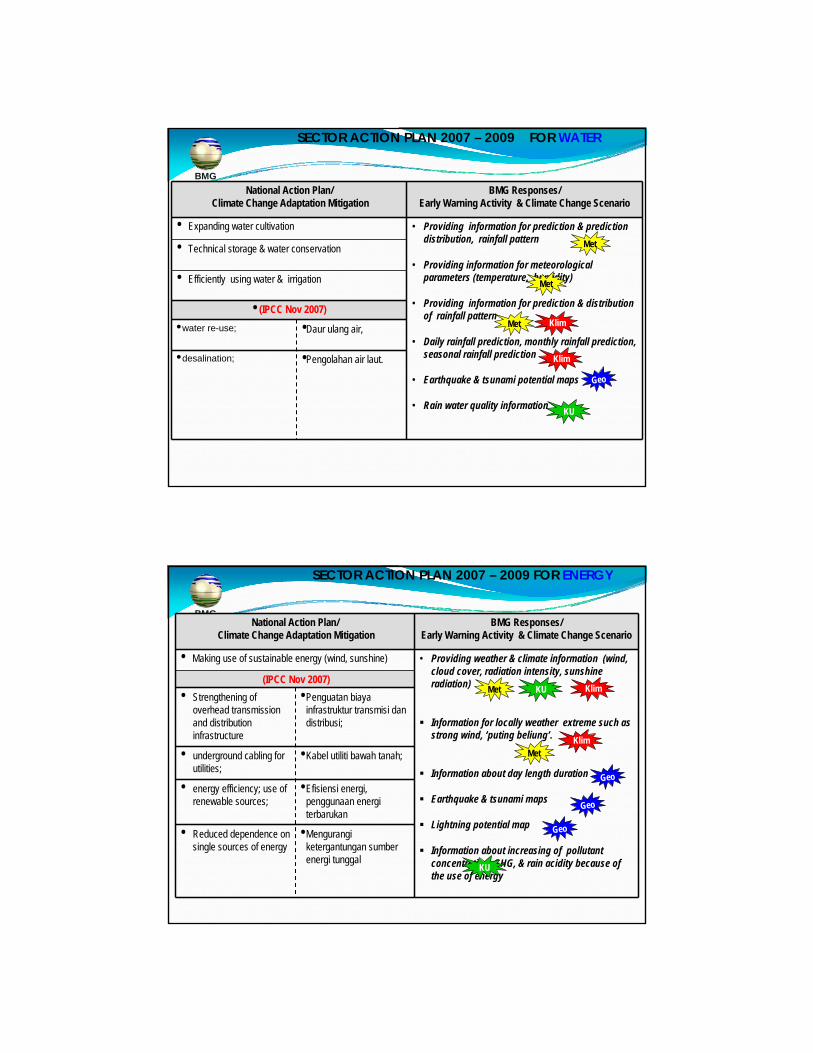
BMGNational Action Plan/
Climate Change Adaptation Mitigation BMG Responses/
Early Warning Activity & Climate Change Scenario
• Expanding water cultivation • Providing information for prediction & prediction distribution, rainfall pattern
• Providing information for meteorological parameters (temperature, humidity)
• Providing information for prediction & distribution of rainfall pattern
• Daily rainfall prediction, monthly rainfall prediction, seasonal rainfall prediction
• Earthquake & tsunami potential maps
• Rain water quality information
• Technical storage & water conservation
• Efficiently using water & irrigation
• (IPCC Nov 2007)•water re-use; •Daur ulang air,
•desalination; •Pengolahan air laut.
SECTOR ACTION PLAN 2007 – 2009 FOR WATER
Met
Met
Met
Klim
Klim
Geo
KU
BMGNational Action Plan/
Climate Change Adaptation Mitigation BMG Responses/
Early Warning Activity & Climate Change Scenario
• Making use of sustainable energy (wind, sunshine) • Providing weather & climate information (wind, cloud cover, radiation intensity, sunshine radiation)
Information for locally weather extreme such as strong wind, ‘puting beliung’.
Information about day length duration
Earthquake & tsunami maps
Lightning potential map
Information about increasing of pollutant concentration, GHG, & rain acidity because of the use of energy
(IPCC Nov 2007)• Strengthening of
overhead transmission and distribution infrastructure
•Penguatan biayainfrastruktur transmisi dandistribusi;
• underground cabling for utilities;
•Kabel utiliti bawah tanah;
• energy efficiency; use of renewable sources;
•Efisiensi energi, penggunaan energiterbarukan
• Reduced dependence on single sources of energy
•Mengurangiketergantungan sumberenergi tunggal
SECTOR ACTION PLAN 2007 – 2009 FOR ENERGY
KlimMet
KlimMet
Geo
Geo
Geo
KU
KU
Page 24
BMG
CLOSING
BMG NecessarilyNecessarily
1.1. Improving our observation system;Improving our observation system;
2.2. Providing denser observation stations, Providing denser observation stations, faster dissemination facility, and high faster dissemination facility, and high precision information;precision information;
3.3. Developing roadmap & master plan;Developing roadmap & master plan;
4.4. Improving HW, SW, BW availabilitiesImproving HW, SW, BW availabilities
Page 25
BMG
BMG
Thank YouThank You
Tuban, Bali