Indonesia NDC roadmap on AFOLU and Energy sector Rizaldi Boer and Retno Gumilang Dewi Email: [email protected]; [email protected]Centre for Climate Risk and Opportunity Management in South East Asia and Pacific IPB University; Centre on Research for Energy Policy, Bandung Institute of Technology
Centre for Climate Risk and Opportunity Management in South East Asia and Pacific IPB University;
Centre on Research for Energy Policy, Bandung Institute of Technology
2
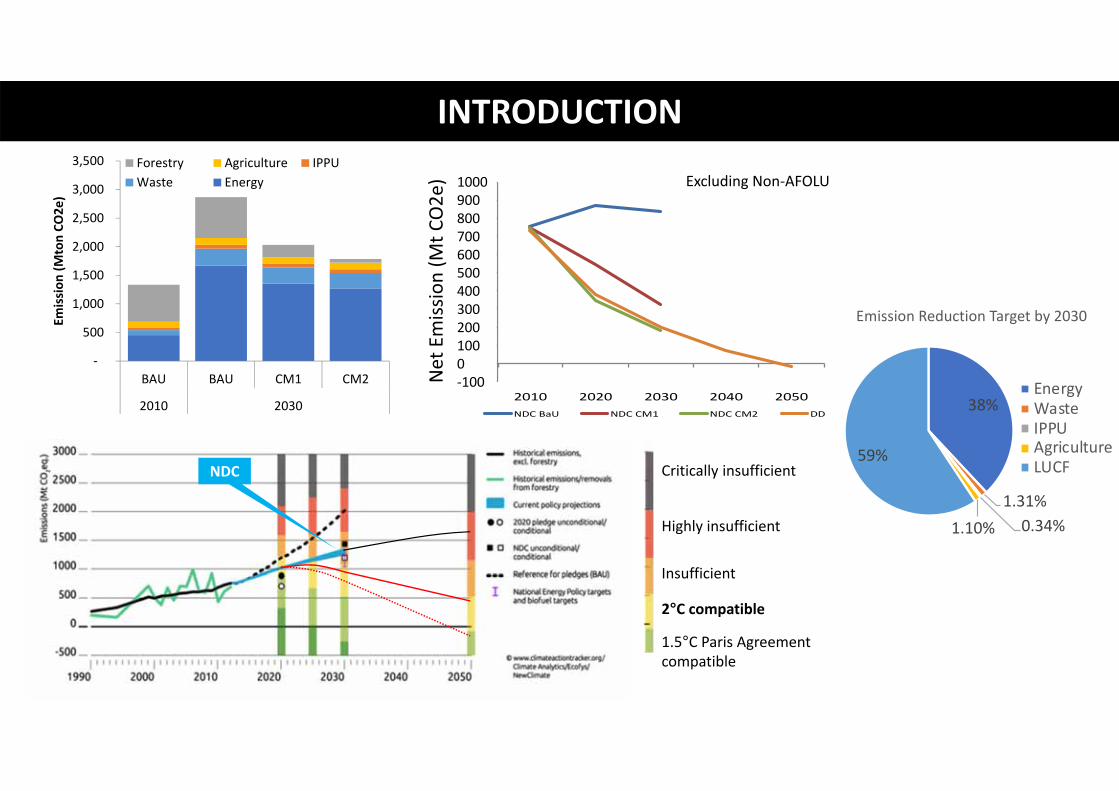
INTRODUCTION
Insufficient
2°C compatible
1.5°C Paris Agreement compatible
Highly insufficient
Critically insufficientNDC
‐0.1 0.0 0.1 0.2 0.3 0.4 0.5 0.6 0.7 0.8 0.9 1.0
2010 2020 2030 2040 2050
Net
Emission
(Gt CO2e)
NDC BaU NDC CM1 NDC CM2 DD
10009008007006005004003002001000‐100N
et Emission (M
t CO2e)
‐
500
1,000
1,500
2,000
2,500
3,000
3,500
BAU BAU CM1 CM2
2010 2030
Emission
(Mton CO
2e)
Forestry Agriculture IPPUWaste Energy Excluding Non‐AFOLU
38%
1.31%0.34%1.10%
59%
Emission Reduction Target by 2030
EnergyWasteIPPUAgricultureLUCF
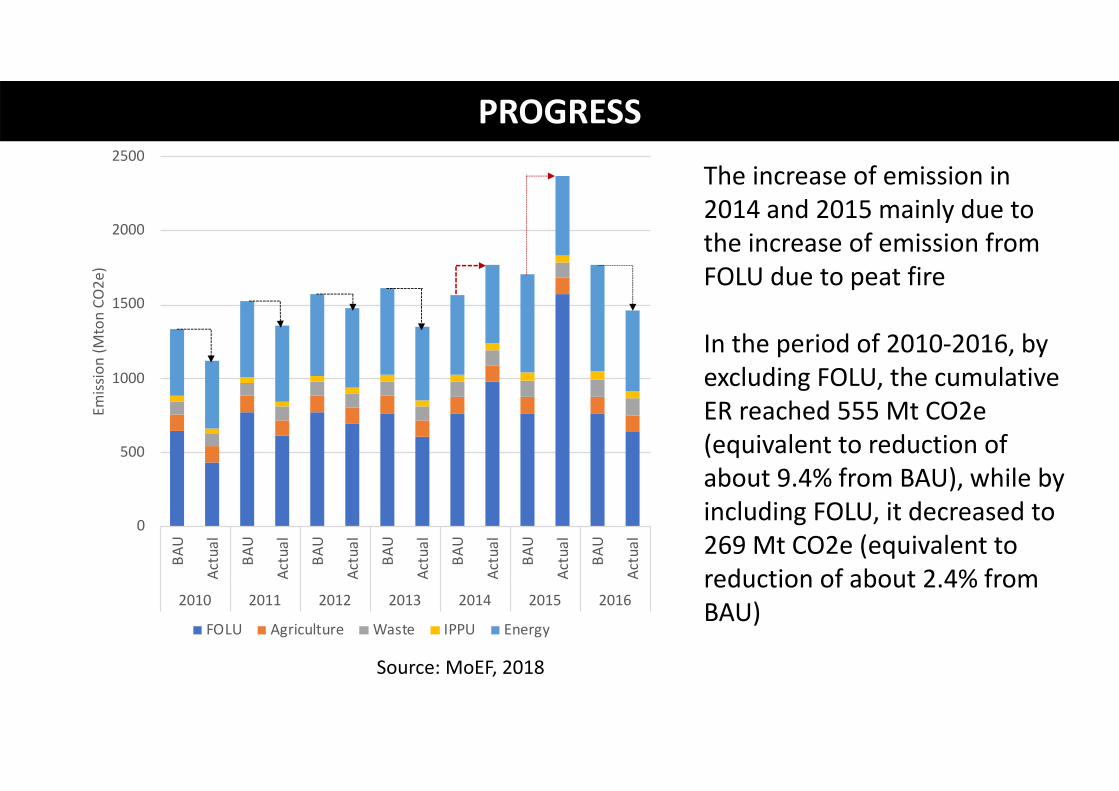
PROGRESS
Source: MoEF, 2018
The increase of emission in 2014 and 2015 mainly due to the increase of emission from FOLU due to peat fire
In the period of 2010‐2016, by excluding FOLU, the cumulative ER reached 555 Mt CO2e (equivalent to reduction of about 9.4% from BAU), while by including FOLU, it decreased to 269 Mt CO2e (equivalent to reduction of about 2.4% from BAU)
0
500
1000
1500
2000
2500BA
U
Actual
BAU
Actual
BAU
Actual
BAU
Actual
BAU
Actual
BAU
Actual
BAU
Actual
2010 2011 2012 2013 2014 2015 2016
Emiss
ion (M
ton CO
2e)
FOLU Agriculture Waste IPPU Energy
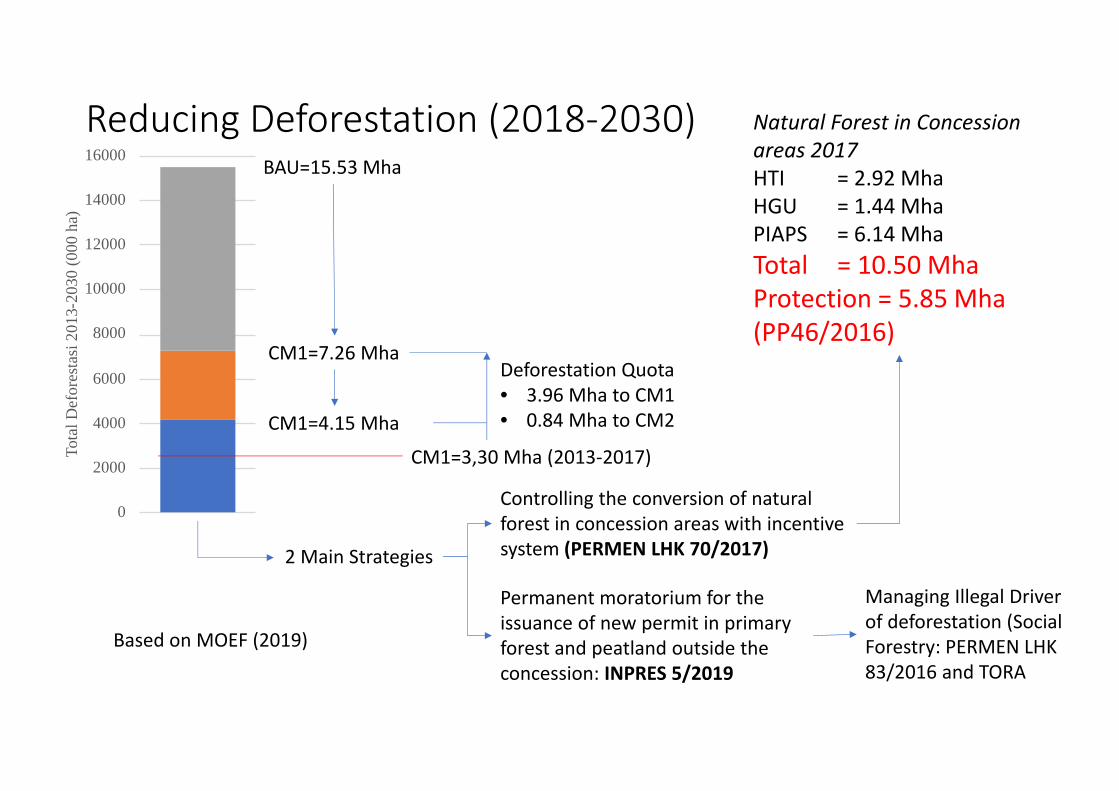
Reducing Deforestation (2018‐2030)BAU=15.53 Mha
CM1=7.26 Mha
CM1=4.15 Mha
0
2000
4000
6000
8000
10000
12000
14000
16000
Tota
l Def
ores
tasi
201
3-20
30 (0
00 h
a)
CM1=3,30 Mha (2013‐2017)
Deforestation Quota• 3.96 Mha to CM1• 0.84 Mha to CM2
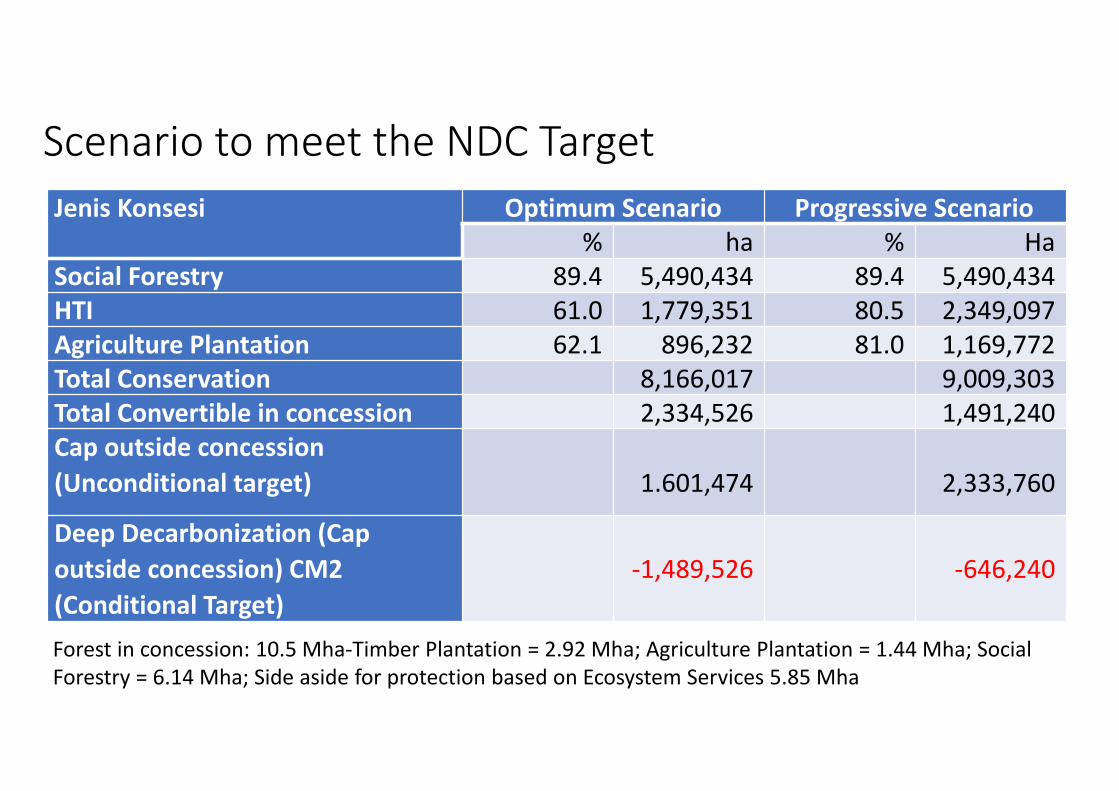
Deep Decarbonization (Cap outside concession) CM2 (Conditional Target)
‐1,489,526 ‐646,240
Forest in concession: 10.5 Mha‐Timber Plantation = 2.92 Mha; Agriculture Plantation = 1.44 Mha; Social Forestry = 6.14 Mha; Side aside for protection based on Ecosystem Services 5.85 Mha
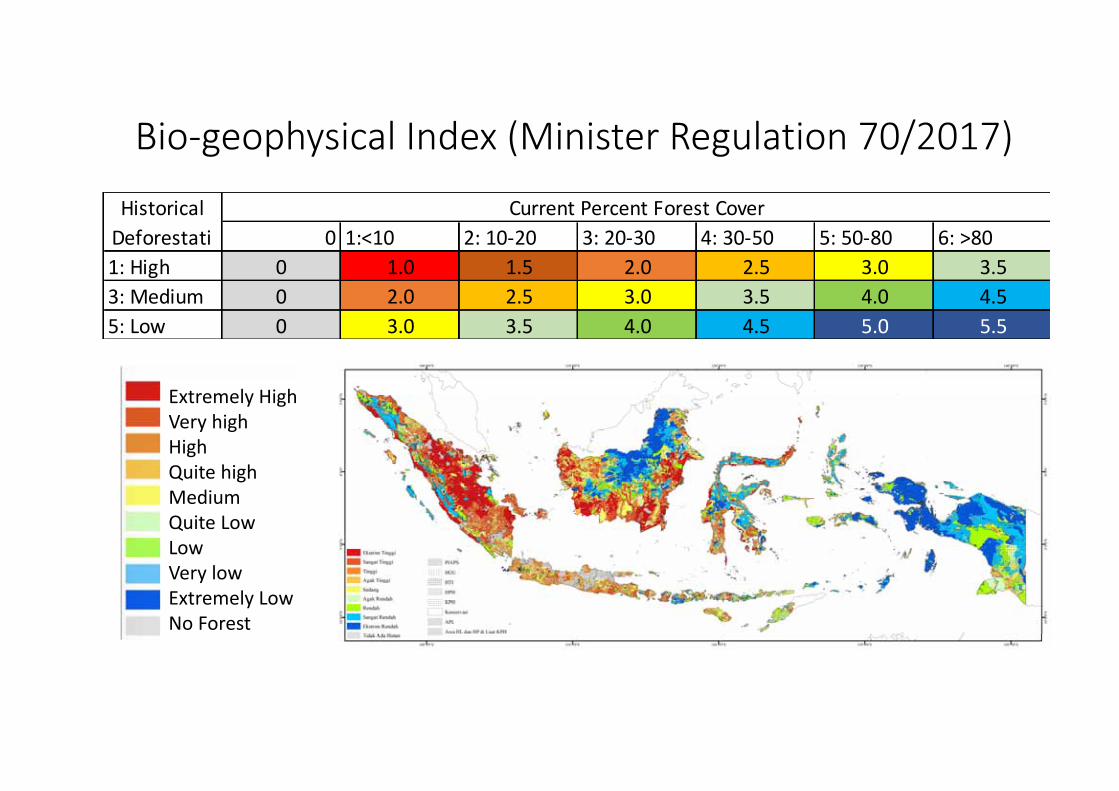
Bio‐geophysical Index (Minister Regulation 70/2017)
Extremely HighVery highHighQuite highMediumQuite LowLow Very lowExtremely LowNo Forest
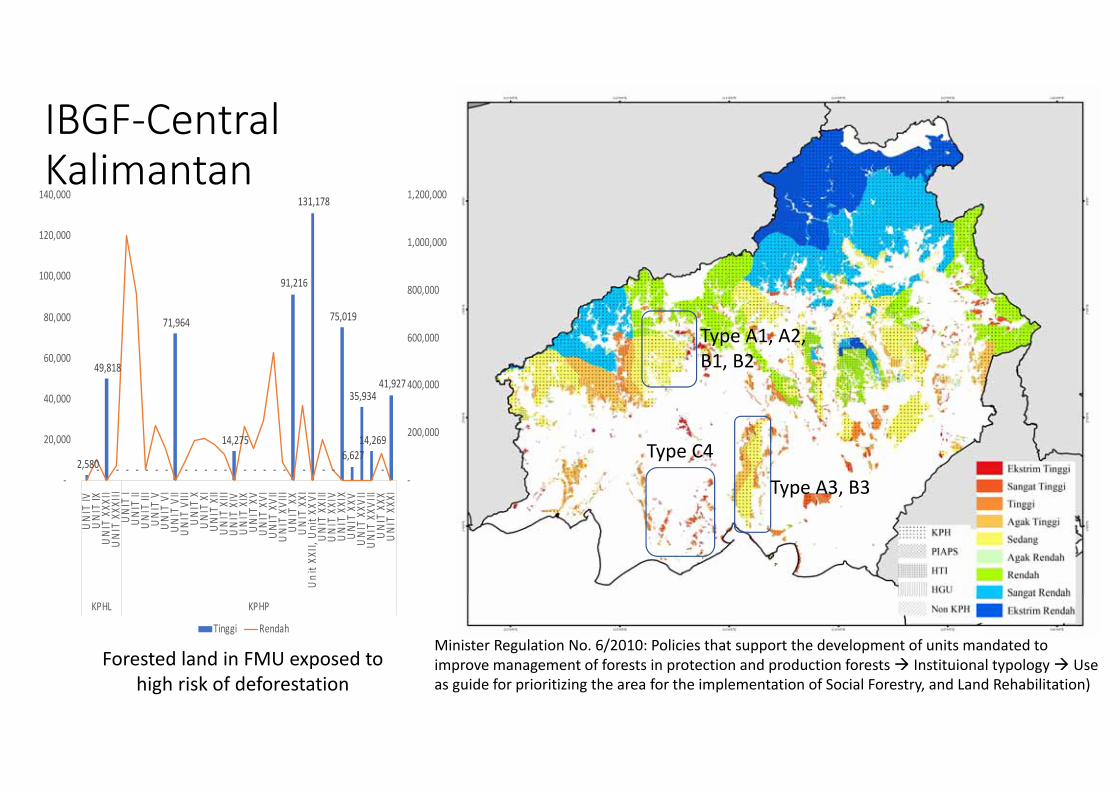
IBGF‐Central Kalimantan
2,580 ‐
49,818
‐ ‐ ‐ ‐ ‐ ‐
71,964
‐ ‐ ‐ ‐ ‐
14,275
‐ ‐ ‐ ‐ ‐
91,216
‐
131,178
‐ ‐
75,019
6,627
35,934
14,269
‐
41,927
‐
200,000
400,000
600,000
800,000
1,000,000
1,200,000
‐
20,000
40,000
60,000
80,000
100,000
120,000
140,000
UNIT
IV U
NIT
IX U
NIT
XXX
II U
NIT
XXX
III U
NIT
I U
NIT
II U
NIT
III
UNIT
V U
NIT
VI
UNIT
VII
UNIT
VIII
UNIT
X U
NIT
XI
UNIT
XII
UNIT
XIII
UNIT
XIV
UNIT
XIX
UNIT
XV
UNIT
XVI
UNIT
XVII
UNIT
XVIII
UNIT
XX
UNIT
XXI
Unit X
XII, Unit X
XVI
UNIT
XXIII
UNIT
XXIV
UNIT
XXIX
UNIT
XXV
UNIT
XXV
II U
NIT
XXV
III U
NIT
XXX
UNIT
XXX
I
KPHL KPHP
Tinggi Rendah
Forested land in FMU exposed to high risk of deforestation
Type A3, B3
Type A1, A2,B1, B2
Type C4
Minister Regulation No. 6/2010: Policies that support the development of units mandated to improve management of forests in protection and production forests Instituional typology Use as guide for prioritizing the area for the implementation of Social Forestry, and Land Rehabilitation)
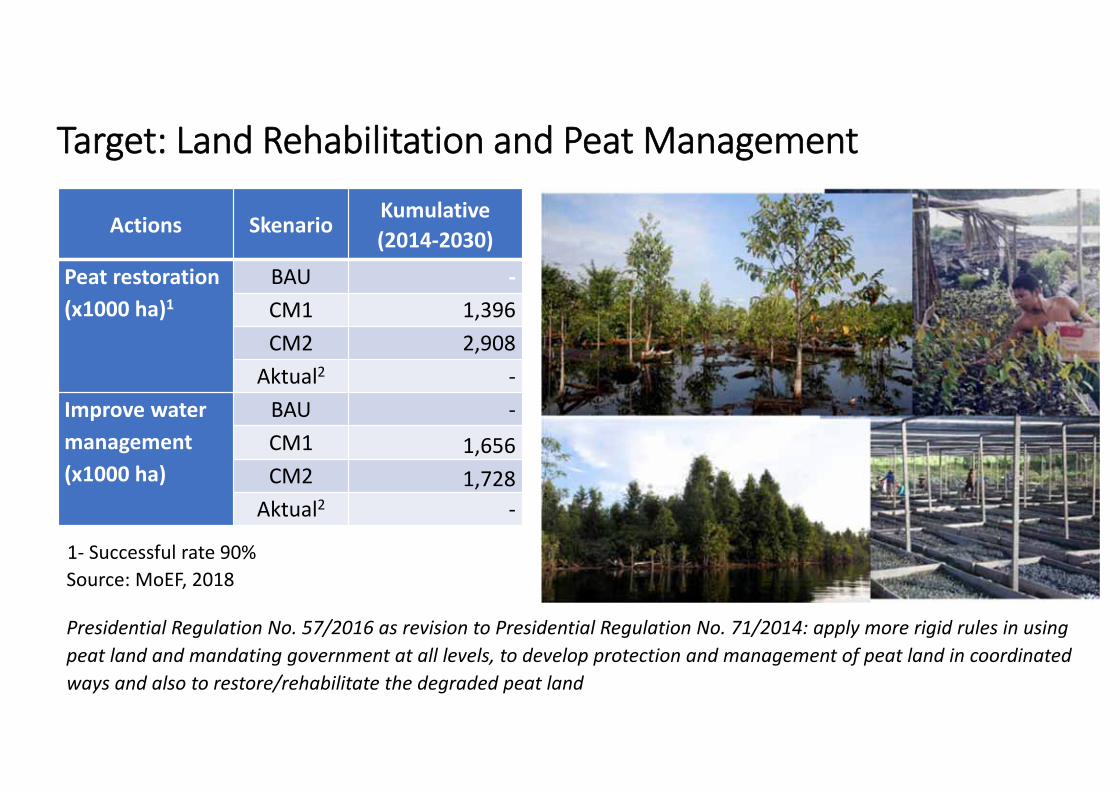
Target: Land Rehabilitation and Peat Management
Actions SkenarioKumulative(2014‐2030)
Peat restoration(x1000 ha)1
BAU ‐CM1 1,396CM2 2,908
Aktual2 ‐Improve watermanagement(x1000 ha)
BAU ‐CM1 1,656CM2 1,728
Aktual2 ‐
1‐ Successful rate 90%Source: MoEF, 2018
Presidential Regulation No. 57/2016 as revision to Presidential Regulation No. 71/2014: apply more rigid rules in using peat land and mandating government at all levels, to develop protection and management of peat land in coordinated ways and also to restore/rehabilitate the degraded peat land
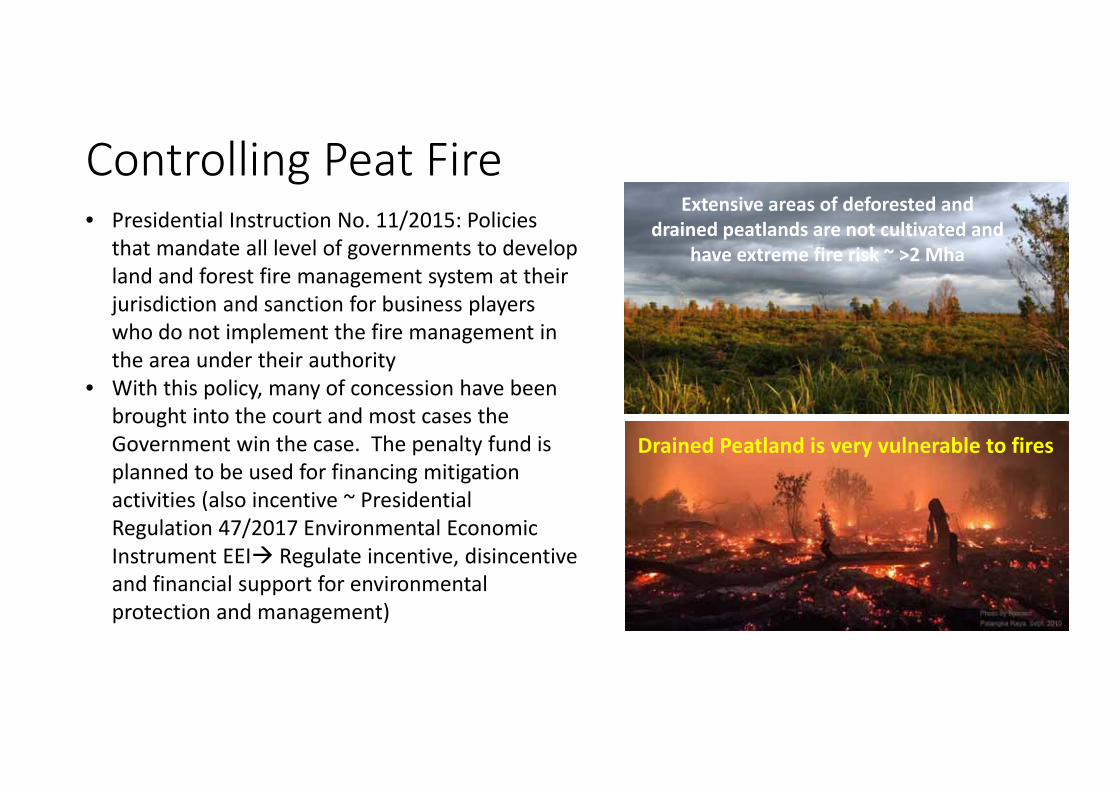
Controlling Peat FireExtensive areas of deforested and
drained peatlands are not cultivated and have extreme fire risk ~ >2 Mha
Drained Peatland is very vulnerable to fires
• Presidential Instruction No. 11/2015: Policies that mandate all level of governments to develop land and forest fire management system at their jurisdiction and sanction for business players who do not implement the fire management in the area under their authority
• With this policy, many of concession have been brought into the court and most cases the Government win the case. The penalty fund is planned to be used for financing mitigation activities (also incentive ~ Presidential Regulation 47/2017 Environmental Economic Instrument EEI Regulate incentive, disincentive and financial support for environmental protection and management)
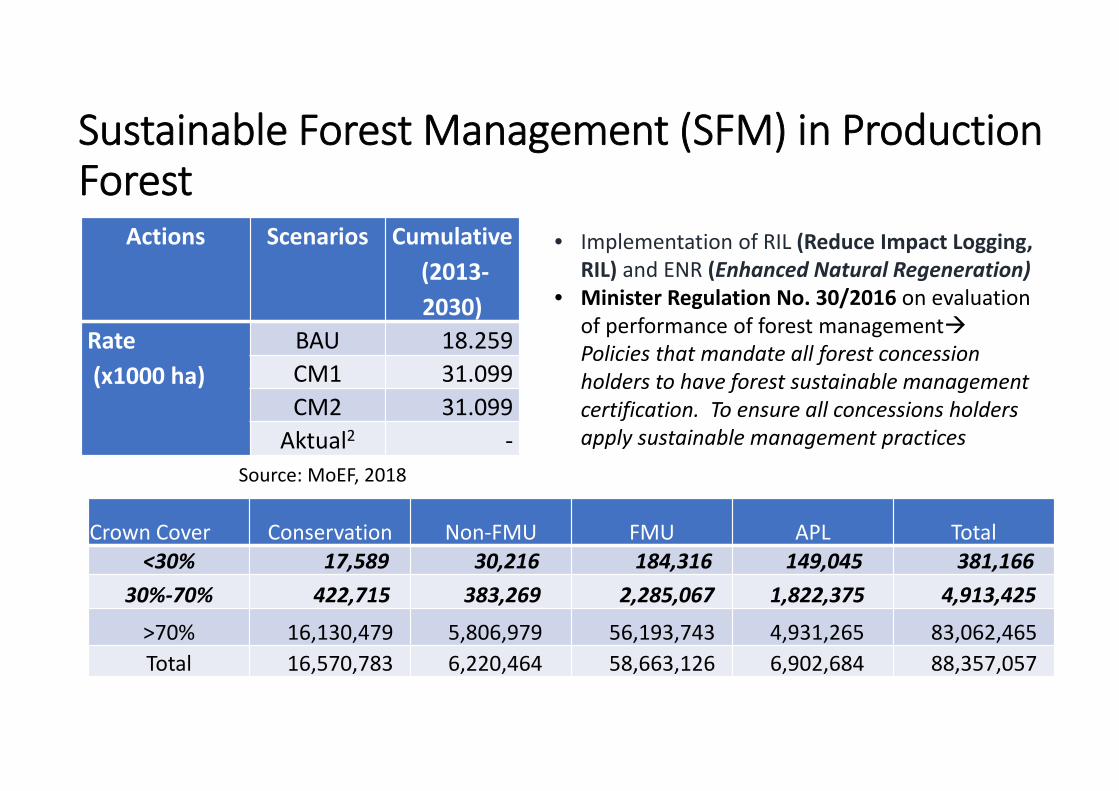
Sustainable Forest Management (SFM) in Production Forest
Actions Scenarios Cumulative(2013‐2030)
Rate(x1000 ha)
BAU 18.259CM1 31.099CM2 31.099
Aktual2 ‐
• Implementation of RIL (Reduce Impact Logging, RIL) and ENR (Enhanced Natural Regeneration)
• Minister Regulation No. 30/2016 on evaluation of performance of forest managementPolicies that mandate all forest concession holders to have forest sustainable management certification. To ensure all concessions holders apply sustainable management practices
• Mainstreaming the NDC in the process of revision of spatial plan and developing medium and long‐term development plan
• Enhancing the participation of non‐Party Actors (Private sectors) with incentive system
• Strengthening and acceleration of establishment Forest Management Unit in high risk area and synchronization of program across directorate supporting the social forestry programs and TORA
• Facilitating the adoption of farming system adapted to peat ecosystem and access to market
• Increasing access to fund for implementing climate actions (Public Service Agency for Environmental Fund)
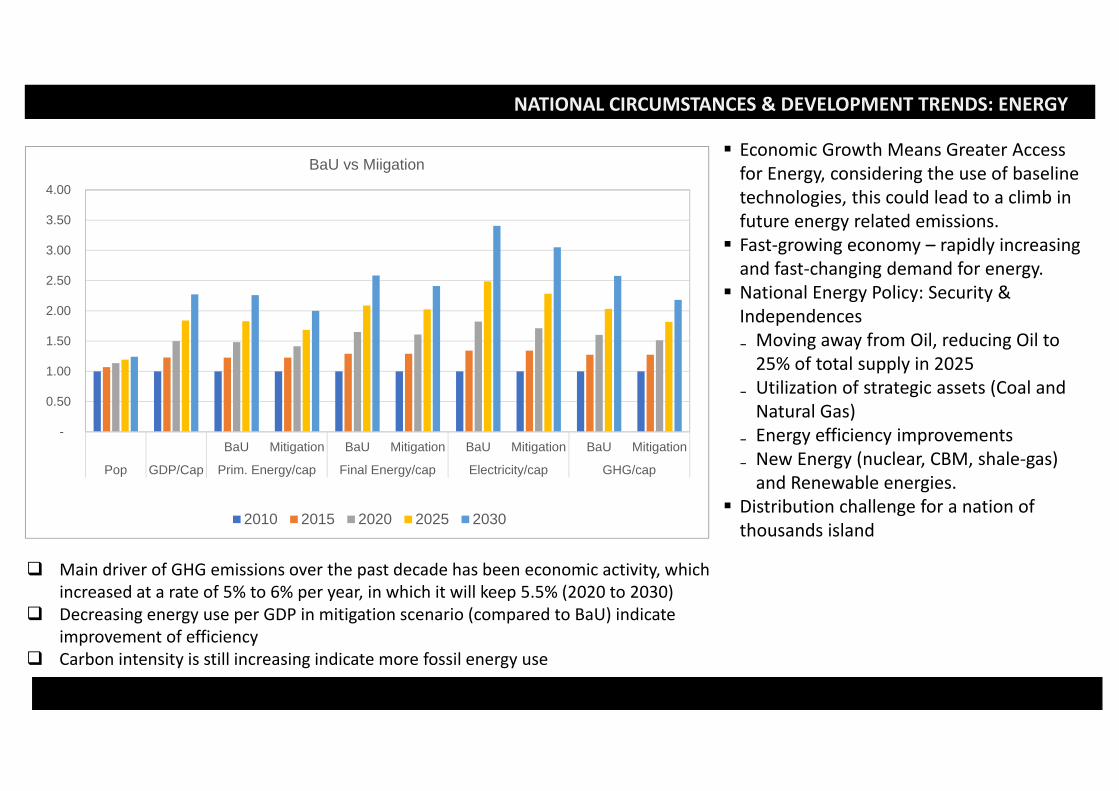
Main driver of GHG emissions over the past decade has been economic activity, which increased at a rate of 5% to 6% per year, in which it will keep 5.5% (2020 to 2030)
Decreasing energy use per GDP in mitigation scenario (compared to BaU) indicate improvement of efficiency
Carbon intensity is still increasing indicate more fossil energy use
Economic Growth Means Greater Access for Energy, considering the use of baseline technologies, this could lead to a climb in future energy related emissions. Fast‐growing economy – rapidly increasing and fast‐changing demand for energy. National Energy Policy: Security & Independences₋ Moving away from Oil, reducing Oil to 25% of total supply in 2025
₋ Utilization of strategic assets (Coal and Natural Gas)
₋ Energy efficiency improvements₋ New Energy (nuclear, CBM, shale‐gas) and Renewable energies.
Distribution challenge for a nation of thousands island
NATIONAL CIRCUMSTANCES & DEVELOPMENT TRENDS: ENERGY
-
0.50
1.00
1.50
2.00
2.50
3.00
3.50
4.00
BaU Mitigation BaU Mitigation BaU Mitigation BaU Mitigation
Pop GDP/Cap Prim. Energy/cap Final Energy/cap Electricity/cap GHG/cap
BaU vs Miigation
2010 2015 2020 2025 2030
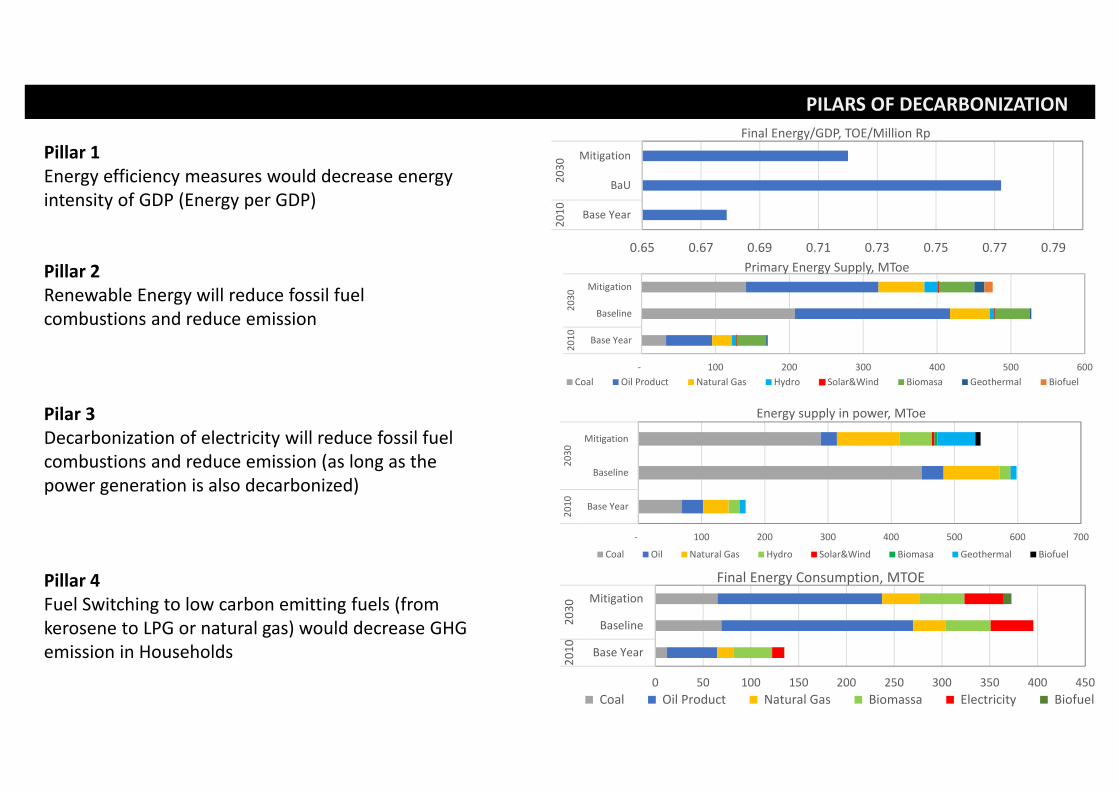
PILARS OF DECARBONIZATION
Pillar 1Energy efficiency measures would decrease energy intensity of GDP (Energy per GDP)
Pillar 2Renewable Energy will reduce fossil fuel combustions and reduce emission
Pilar 3Decarbonization of electricity will reduce fossil fuel combustions and reduce emission (as long as the power generation is also decarbonized)
Pillar 4Fuel Switching to low carbon emitting fuels (from kerosene to LPG or natural gas) would decrease GHG emission in Households
0.65 0.67 0.69 0.71 0.73 0.75 0.77 0.79
Base Year
BaU
Mitigation
2010
2030
Final Energy/GDP, TOE/Million Rp
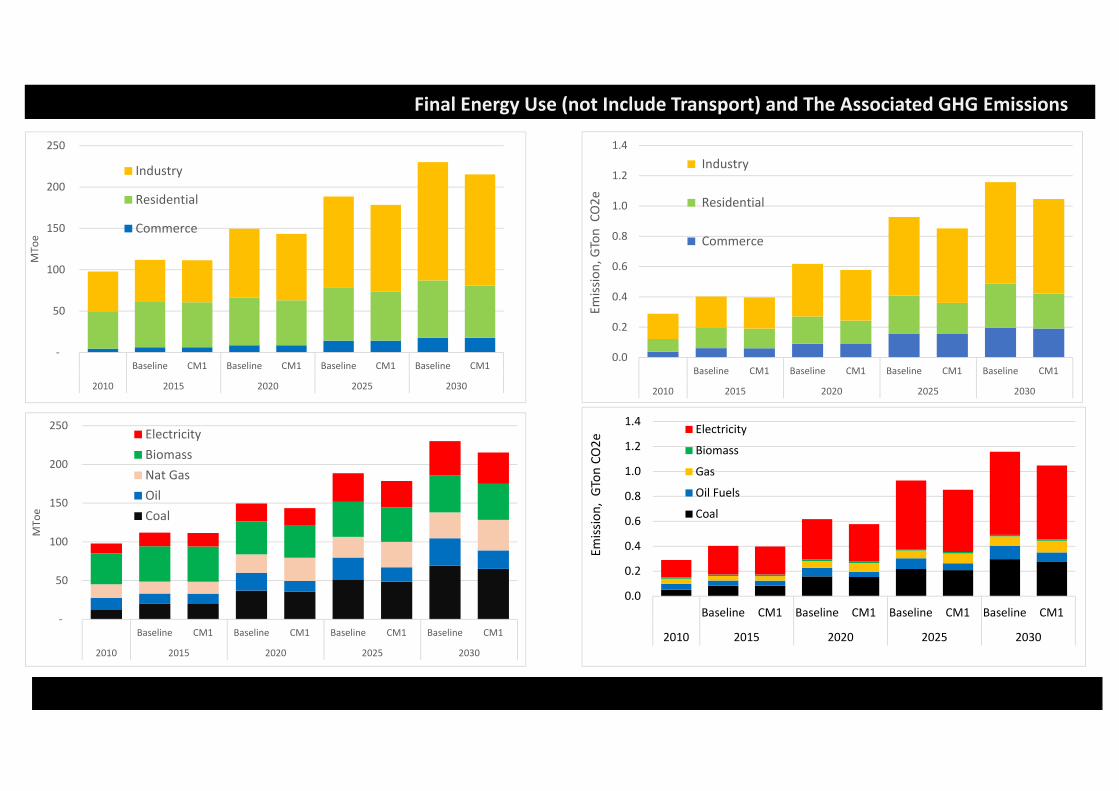
0 50 100 150 200 250 300 350 400 450
Base Year
Baseline
Mitigation
2010
2030
Final Energy Consumption, MTOE
Coal Oil Product Natural Gas Biomassa Electricity Biofuel
‐ 100 200 300 400 500 600 700
Base Year
Baseline
Mitigation
2010
2030
Energy supply in power, MToe
Coal Oil Natural Gas Hydro Solar&Wind Biomasa Geothermal Biofuel
‐ 100 200 300 400 500 600
Base Year
Baseline
Mitigation
2010
2030
Primary Energy Supply, MToe
Coal Oil Product Natural Gas Hydro Solar&Wind Biomasa Geothermal Biofuel
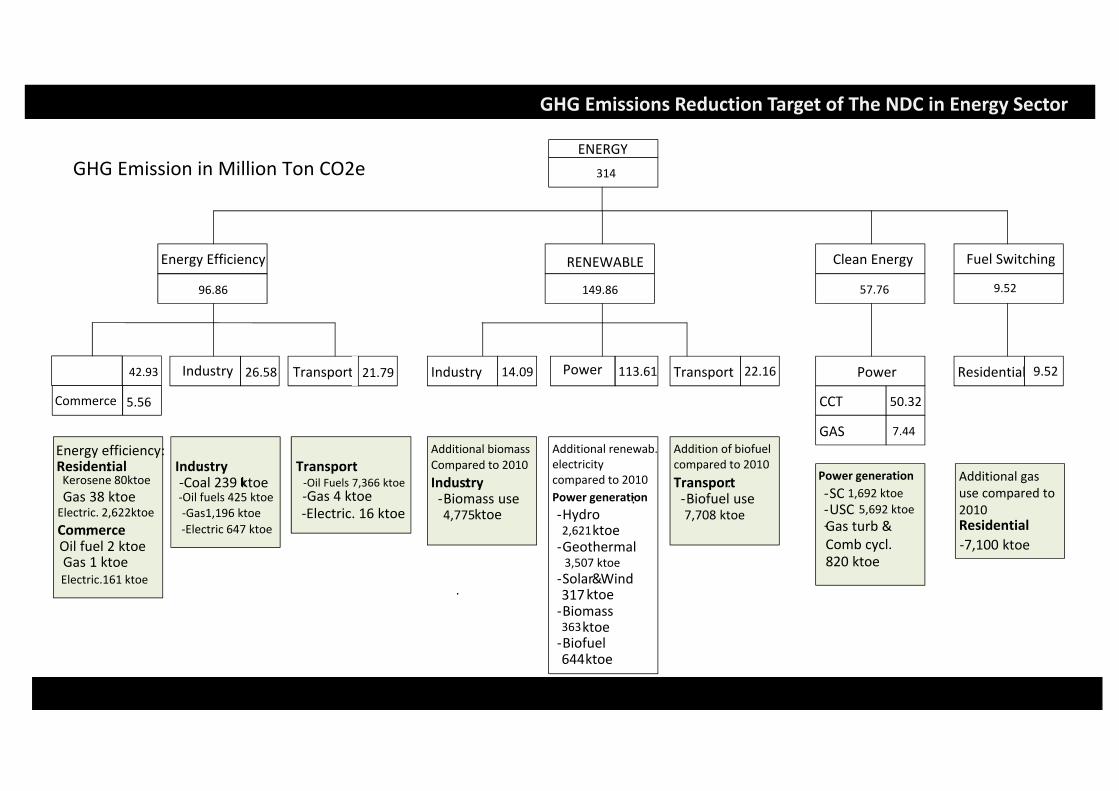
GHG Emissions Reduction Target of The NDC in Energy Sector
314
ENERGY
Energy Efficiency
96.86
RENEWABLE
149.86
Clean Energy
57.76
Fuel Switching
9.52
CCT 50.32
GAS 7.44
Power42.93
Commerce 5.56
Industry 26.58 Power 113.61 Residential 9.52Transport 21.79 Transport 22.16
Energy efficiency:Residential:Kerosene 80ktoe Gas 38 ktoeElectric. 2,622ktoeCommerce:Oil fuel 2 ktoeGas 1 ktoeElectric.161 ktoe
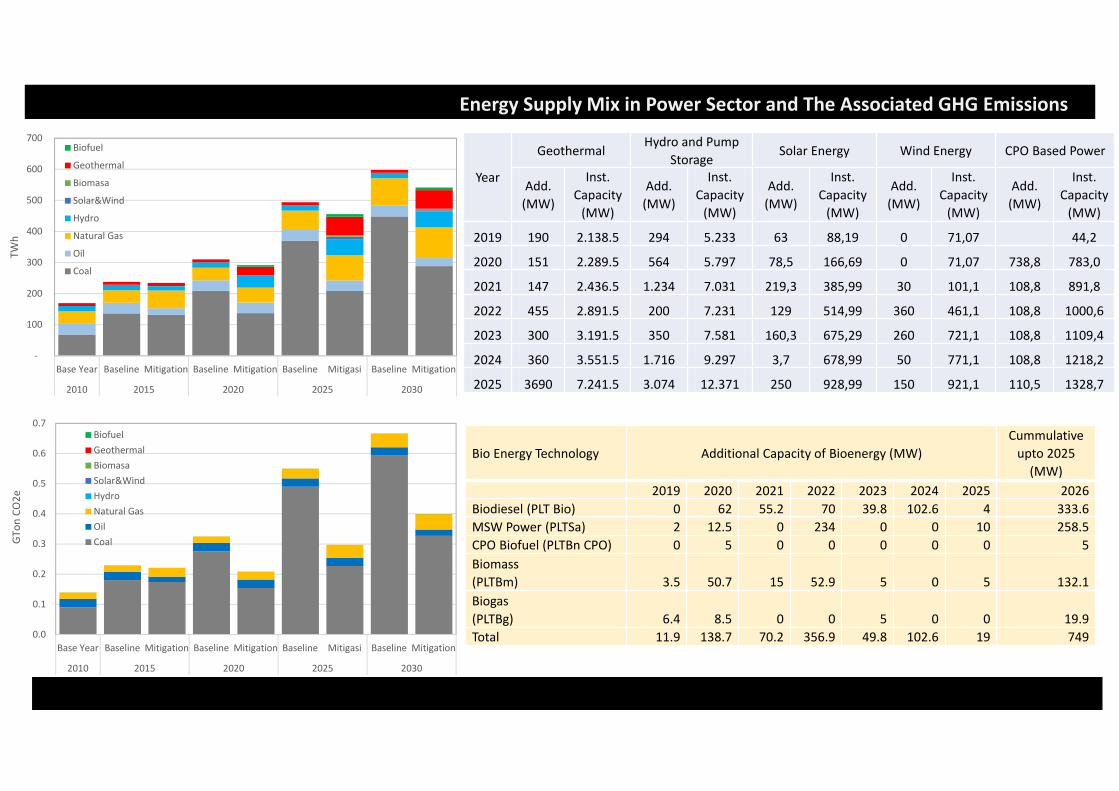
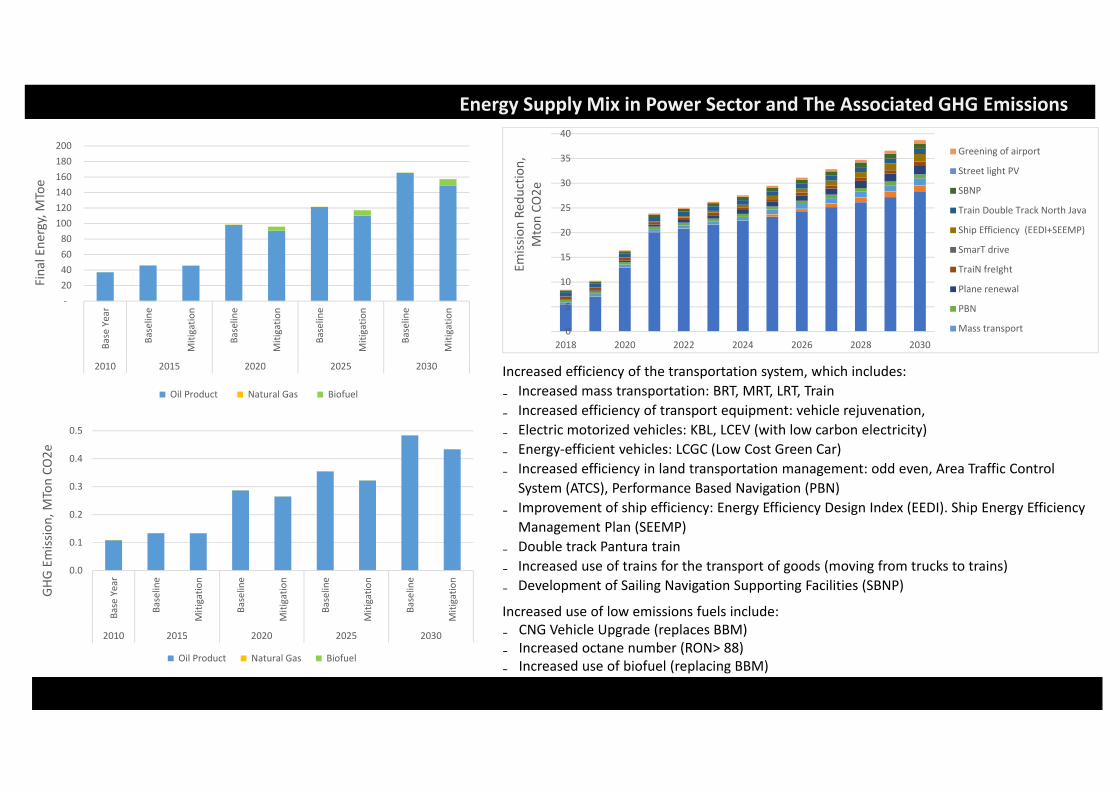
Energy Supply Mix in Power Sector and The Associated GHG Emissions
‐ 20 40 60 80
100 120 140 160 180 200
Base Year
Baseline
Mitigatio
n
Baseline
Mitigatio
n
Baseline
Mitigatio
n
Baseline
Mitigatio
n
2010 2015 2020 2025 2030
Final Ene
rgy, M
Toe
Oil Product Natural Gas Biofuel
0.0
0.1
0.2
0.3
0.4
0.5
Base Year
Baseline
Mitigatio
n
Baseline
Mitigatio
n
Baseline
Mitigatio
n
Baseline
Mitigatio
n
2010 2015 2020 2025 2030
GHG
Emission, M
TonCO
2e
Oil Product Natural Gas Biofuel
0
5
10
15
20
25
30
35
40
2018 2020 2022 2024 2026 2028 2030
Emission Re
duction,
MtonCO
2e
Greening of airport
Street light PV
SBNP
Train Double Track North Java
Ship Efficiency (EEDI+SEEMP)
SmarT drive
TraiN freIght
Plane renewal
PBN
Mass transport
Increased efficiency of the transportation system, which includes:₋ Increased mass transportation: BRT, MRT, LRT, Train₋ Increased efficiency of transport equipment: vehicle rejuvenation,₋ Electric motorized vehicles: KBL, LCEV (with low carbon electricity)₋ Energy‐efficient vehicles: LCGC (Low Cost Green Car)₋ Increased efficiency in land transportation management: odd even, Area Traffic Control
System (ATCS), Performance Based Navigation (PBN)₋ Improvement of ship efficiency: Energy Efficiency Design Index (EEDI). Ship Energy Efficiency
Management Plan (SEEMP)₋ Double track Pantura train₋ Increased use of trains for the transport of goods (moving from trucks to trains)₋ Development of Sailing Navigation Supporting Facilities (SBNP)
Increased use of low emissions fuels include:₋ CNG Vehicle Upgrade (replaces BBM)₋ Increased octane number (RON> 88)₋ Increased use of biofuel (replacing BBM)
1. There are four Pilars for achieving the target of GHG emissions reduction under the NDC road map: (1) energy efficiency, (2) renewable energy, (3) clean power (decarbonization of electricity), fuel switching to Low Carbon Emitting fuels (kerosene to LPG/Natural Gas) in households; among of these pillars, renewable energy will contribute to the reduction of about 48% of total GHG emissions reduction in energy sector.
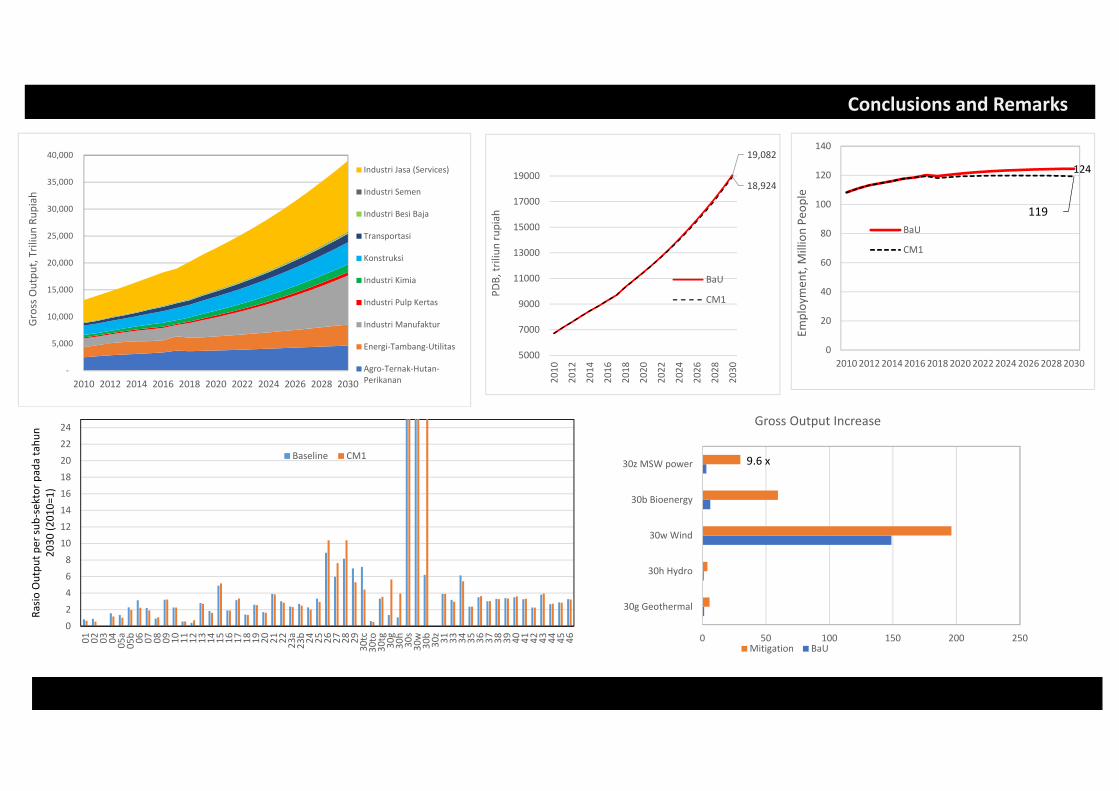
2. The biggest increase of gross output in energy related sector: MSW power, wind, bioenergy, hydro, geothermal 3. Impacts of climate change mitigation action in energy sector: GDP/Capita and Emlpoyment are slightly below
the BaU4. Enabling condition the achievement of the NDC target in the energy sector:
• The existence of energy price policies that are conducive to encourage the Energy Efficiency implementations;• There are regulations regarding the obligations of industries and commercial buildings with high energy consumption to carry out conservation or energy efficiency efforts with certain targets;
• The existence of energy performance standard regulations for household, commercial and industrial equipment. There is a funding system that can be utilized for the development of renewable energy;
• The existence of a policy of buying and selling renewable electricity and waste heat recovery, which is pursued by the public (companies & individuals), at an attractive price that encourages the RE Electricity development;
• A review of regulations that can inhibit the use of municipal waste and other waste as an energy source.