www.dbsvickers.com ed: SGC / sa: MA When the going gets tough Pedestrian marketing sales, as predicted Property is NOT in bubble territory – far from it Do not expect a breakout year in 2015 Back to fundamentals: BUY SMRA and BSDE Pedestrian marketing sales to continue. YTD marketing sales have been pedestrian, and developers are on track to meet subdued expectations. 9M14 financial results are largely within our expectations. With the expected slowdown in Indonesia’s economy next year, we expect minimal growth in marketing sales next year, as a steady decline in pre-sold units will continue to offset against the impact of higher land prices at all property development segments. Not in bubble territory.The property boom in the past four years has raised several questions about whether property bubble is in the horizon. We looked into some indicators and did studies to check the notion. We concluded that Indonesia’s property sector is NOT in bubble territory. However, we predict challenges going forward with the expected cost pressure (due to recent hike in subsidised fuel price), possibility of further tightening and sentiment risk towards Indonesia in general. Back to fundamentals. We revised our marketing sales, RNAV and earnings forecasts to reflect our view and the YTD achievements. The property sector is trading at 33% discount to RNAV and at +1SD of mean forward PE (still a good entry point for long term investors). We like developers with focused exposure on landed residential and retail malls in both big cities and suburbs. Top picks are SMRA and BSDE which are offering 22% and 11% upside, respectively. JCI : 5,164.29 Analyst Edward Tanuwijaya +6221 3003 4932 [email protected]STOCK Price Mkt Cap Target Performance (%) Rp US$m Price (Rp) 3 mth 12 mth Rating Agung Podomoro 361 609 345 -8.5 46.4 Hold Alam Sutera Realty 560 905 490 2 14.3 Fully Valued Bumi Serpong Damai 1,770 2,674 1,980 6.8 27.6 Buy Ciputra Develop. 1,310 1,634 1,125 7.8 82.6 Fully Valued Summarecon Agung 1,460 1,732 1,780 9 83.5 Buy Lippo Karawaci 1,165 2,211 1,180 6.9 30.3 Hold Pakuwon Jati 515 2,039 530 12.3 89.2 Hold Source: DBS Vickers Agung Podomoro Land : APLN has been focusing on high-rise developments and prides itself as the King of Jakarta superblocks. Most of its projects are in strategic inner city locations. Alam Sutera Realty : Upscale township developer in Serpong and Pasar Kemis (west Jakarta suburb). ASRI is diversifying its revenue base with more commercial properties such as retail malls and office towers. Bumi Serpong Damai : BSDE is Indonesia's largest landed residential property developer. Its core project is developing an integrated satellite city 15km west of Jakarta. BSDE enlarged its investment property portfolio after consolidating DUTI, SMT, & SMW. Ciputra Development : Large scale residential and commercial developer in 20 major cities throughout Indonesia, with most diversified product and consumer range. Established since 1981 and has listed subsidiaries in Ciputra Surya (CTRS) and Ciputra Property (CTRP) Summarecon Agung : SMRA is one of Indonesia most established property developer. It has three existing township developments and several investment properties in its portfolio which generates sizeable recurring income, c.30% of revenues. Lippo Karawaci : LPKR's five business: township, healthcare, retail mall, hospitality and portfolio management. It has listed subsidiary in Lippo Cikarang (LPCK), Gowa Makassar Tourism Development (GMTD) and stakes in First REIT & LMIRT (both listed in Singapore) Pakuwon Jati : Mixed-use property and residential township developer with assets in Jakarta and Surabaya. PWON has balanced portfolio with a large share of recurring revenues from retail malls DBS Group Research . Equity 2 Dec 2014 Indonesia Industry Focus Indonesia Property Sector Refer to important disclosures at the end of this report
Transcript
www.dbsvickers.com ed: SGC / sa: MA
When the going gets tough Pedestrian marketing sales, as predicted
Property is NOT in bubble territory – far from it
Do not expect a breakout year in 2015
Back to fundamentals: BUY SMRA and BSDE
Pedestrian marketing sales to continue. YTD marketing sales have been pedestrian, and developers are on track to meet subdued expectations. 9M14 financial results are largely within our expectations. With the expected slowdown in Indonesia’s economy next year, we expect minimal growth in marketing sales next year, as a steady decline in pre-sold units will continue to offset against the impact of higher land prices at all property development segments.
Not in bubble territory.The property boom in the past four years has raised several questions about whether property bubble is in the horizon. We looked into some indicators and did studies to check the notion. We concluded that Indonesia’s property sector is NOT in bubble territory. However, we predict challenges going forward with the expected cost pressure (due to recent hike in subsidised fuel price), possibility of further tightening and sentiment risk towards Indonesia in general.
Back to fundamentals. We revised our marketing sales, RNAV and earnings forecasts to reflect our view and the YTD achievements. The property sector is trading at 33% discount to RNAV and at +1SD of mean forward PE (still a good entry point for long term investors). We like developers with focused exposure on landed residential and retail malls in both big cities and suburbs. Top picks are SMRA and BSDE which are offering 22% and 11% upside, respectively.
Agung Podomoro 361 609 345 -8.5 46.4 Hold Alam Sutera Realty 560 905 490 2 14.3 Fully Valued Bumi Serpong Damai 1,770 2,674 1,980 6.8 27.6 Buy Ciputra Develop. 1,310 1,634 1,125 7.8 82.6 Fully Valued Summarecon Agung 1,460 1,732 1,780 9 83.5 Buy Lippo Karawaci 1,165 2,211 1,180 6.9 30.3 Hold Pakuwon Jati 515 2,039 530 12.3 89.2 Hold
Source: DBS Vickers
Agung Podomoro Land : APLN has been focusing on high-rise developments and prides itself as the King of Jakarta superblocks. Most of its projects are in strategic inner city locations.
Alam Sutera Realty : Upscale township developer in Serpong and Pasar Kemis (west Jakarta suburb). ASRI is diversifying its revenue base with more commercial properties such as retail malls and office towers.
Bumi Serpong Damai : BSDE is Indonesia's largest landed residential property developer. Its core project is developing an integrated satellite city 15km west of Jakarta. BSDE enlarged its investment property portfolio after consolidating DUTI, SMT, & SMW.
Ciputra Development : Large scale residential and commercial developer in 20 major cities throughout Indonesia, with most diversified product and consumer range. Established since 1981 and has listed subsidiaries in Ciputra Surya (CTRS) and Ciputra Property (CTRP)
Summarecon Agung : SMRA is one of Indonesia most established property developer. It has three existing township developments and several investment properties in its portfolio which generates sizeable recurring income, c.30% of revenues.
Lippo Karawaci : LPKR's five business: township, healthcare, retail mall, hospitality and portfolio management. It has listed subsidiary in Lippo Cikarang (LPCK), Gowa Makassar Tourism Development (GMTD) and stakes in First REIT & LMIRT (both listed in Singapore)
Pakuwon Jati : Mixed-use property and residential township developer with assets in Jakarta and Surabaya. PWON has balanced portfolio with a large share of recurring revenues from retail malls
DBS Group Research . Equity 2 Dec 2014
Indonesia Industry Focus
Indonesia Property Sector Refer to important disclosures at the end of this report
Pedestrian growth so far, as predicted Pedestrian marketing sales achievement Aggregate 9M14 marketing sales registered flat growth y-o-y. This is consistent with what we had expected at the end of last year (Refer to Indonesia Property sector report titled “Patience required” on 19Nov2013). The lower volumes offset the impact of c.15% increase in land prices YTD. Midway through the year, three developers under our coverage revised down their marketing sales guidance set in early 2014, mostly due to slower than expected demand during the election (a political drama that lasted longer than expected) and complications in securing the desired plot ratios for high-rise projects. Marketing sales trend and our FY14/15F projections
-
5,000
10,000
15,000
20,000
25,000
30,000
35,000
40,000
45,000
2009 2010 2011 2012 2013 2014F 2015F
+56% CAGR
flattishRpbn
Source: Companies, DBS Vickers
While developers were either standing pat or lowered their guidance, SMRA revised up their marketing sales by 12.5% following successful launches of apartment towers in Bekasi (east Jakarta suburb). Overall, aggregate FY14 marketing sales guidance were cut by 7%, implying only 4% y-o-y growth. 9M14 marketing sales achievements were pedestrian, averaging 70% of full year guidance. But with several project launches in the launch pipeline for 4Q14, developers are on track to meet their revised marketing sales targets. Marketing sales achievement as of 9M14
3,432 3,530 4,701
5,831
3,856
2,000 3,036
1,568 2,470
1,299
3,369
819
1,000
1,464
-
1,000
2,000
3,000
4,000
5,000
6,000
7,000
8,000
9,000
10,000
ASRI APLN BSDE CTRA LPKR PWON SMRA
Marketing sales achievement Target in 4Q14Rpbn
Source: Companies, DBS Vickers
Marketing sales achievement (largely in-line)
Developer 9M14 (Rpbn)
9M13 (Rpbn)
y-o-y growth
YTD achievement vs revised
guidance (%)
Likeliness to achieve FY14
guidance Remarks
ASRI 3,432 3,279 5% 69% Likely Strong marketing sales from Serpong's commercial land offset the disappointment in Pasar Kemis achievement
APLN 3,530 4,046 -13% 59% Unlikely Full year achievement hinges on successful launches on few new projects namely Plaza Kenari Mas, Pakubuwono Springs apartment and Klender
BSDE 4,701 4,536 4% 78% Definitely Major boost came from commercial landplot pre-sales at BSD City (west Jakarta suburb)
CTRA 5,831 7,482 -22% 63% Unlikely Welcomed boost from Ciputra International (West Jakarta mixed-use project) masked overall weak response towards high-rise units
LPKR 3,856 3,051 26% 82% Definitely Bureaucratic complications in securing higher plot ratios for new hig-rise projects prompted the 32% slash in marketing sales guidance
PWON 2,000 2,061 -3% 67% Likely Surabaya projects (with 64% contribution to total YTD marketing sales) did better than Jakarta's so far
SMRA 3,036 3,000 1% 67% Definitely Great take-up from apartment launches in both Bekasi (east Jakarta suburb) and Kelapa Gading (north Jakarta) should be a good indicator for Serpong apartment demand
Total 26,385 27,455 -4% 69%
Source: Companies, DBS Vickers
Industry Focus
Indonesia Property Sector
Page 4
Full year marketing sales guidance revision summary
Developer Initial FY14 guidance
(Rpbn)
Revised FY14 guidance
(Rpbn)
Revision change
(%)
DBSVI FY14F (Rpbn)
FY14 guidance implied growth
(y-o-y) Remarks
ASRI 5,000 5,000 0% 4,564 4%
APLN 6,500 6,000 -8% 4,559 -6% FY guidance was revised down in September 2014
CTRA 9,959 9,200 -8% 9,145 3% FY guidance was revised down in mid-October 2014
LPKR 6,819 4,675 -31% 4,648 -1% FY guidance was revised down in mid-July 2014
PWON 3,000 3,000 0% 3,126 0% SMRA 4,000 4,500 13% 4,586 22% FY guidance was revised down in June 2014
Total 41,278 38,375 -7% 36,606 4%
Source: Companies, DBS Vickers 9M14 financial results largely in line For most developers, revenue recognition were below both our and consensus expectations. But product mix were largely in line, so 9M14 gross profit margins were within our full year expectations. Nevertheless, developers were able to keep operating costs low in several areas, including sales commission and advertising, which helped to lift operating margins.
Consequently, most developers’ net profit reached more than 75% of our full year expectations. One developer under our coverage, ASRI, has not reported 9M14 financial results due to planned corporate actions.
Source: Companies, DBS Vickers Note: ASRI’s 9M14 results under limited review for planned corporate actions Flurry of corporate actions this year
There were a flurry of fund raising activities by developers this year as they strive to strengthen their healthy balance sheets for further expansion, secure working capital requirement, and manage the refined Loan-to-Value (LTV) regulation (effective Sep 2013). We view these corporate actions as necessary in this environment. As discussed in our Indonesian Banking Sector report (“Easing liquidity indicators” dated 11 Sep 2014), liquidity has been tight this year (tightest in 1Q14 as reflected by the highest levels of loan-to-deposit ratio) as funding costs have risen, but the pressure seem to have eased recently.
Indonesian Banks: Loan-to-deposit ratio trends
60%
65%
70%
75%
80%
85%
90%
95%
100%
2009 2010 2011 2012 2013 1Q14 2Q14 3Q14
Average (Big 4) Average (non Big 4) Industry
At highest level
Source: Bank Indonesia, Companies, DBS Vickers
Industry Focus
Indonesia Property Sector
Page 5
Summary of property developers’ corporate actions in 2014
Developer Ticker Corporate action Date Proceeds Tenor (years) Coupon rate
p.a. Remarks
Alam Sutera ASRI IJ Bond issuance (USD) 22-Jan-14 US$225m 5 (callable after 3) 9% Refinancing
Bumi Serpong Damai BSDE IJ Rights issue 28-Apr-14 Rp1.6tr n/a n/a Plaza Indonesia Realty stakes acquisition
Agung Podomoro Land APLN IJ Bond issuance (IDR) 12-May-14 IDR750bn 5 12.25% Working capital
Pakuwon Jati PWON IJ Bond issuance (USD) 02-Jul-14 US$200m 5 (callable after 3) 7.13% Acquisition of new superblock
Modernland * MDLN IJ Bond issuance (USD) 05-Aug-14 US$190m 5 9.75% Refinanciing
Summarecon Agung SMRA IJ Bond issuance (IDR) 10-Oct-14 IDR1.1tr 5 11.50% Working capital
Source: Companies, DBS Vickers Note: (*) Modernland Realty is not under our coverage
Industry Focus
Indonesia Property Sector
Page 6
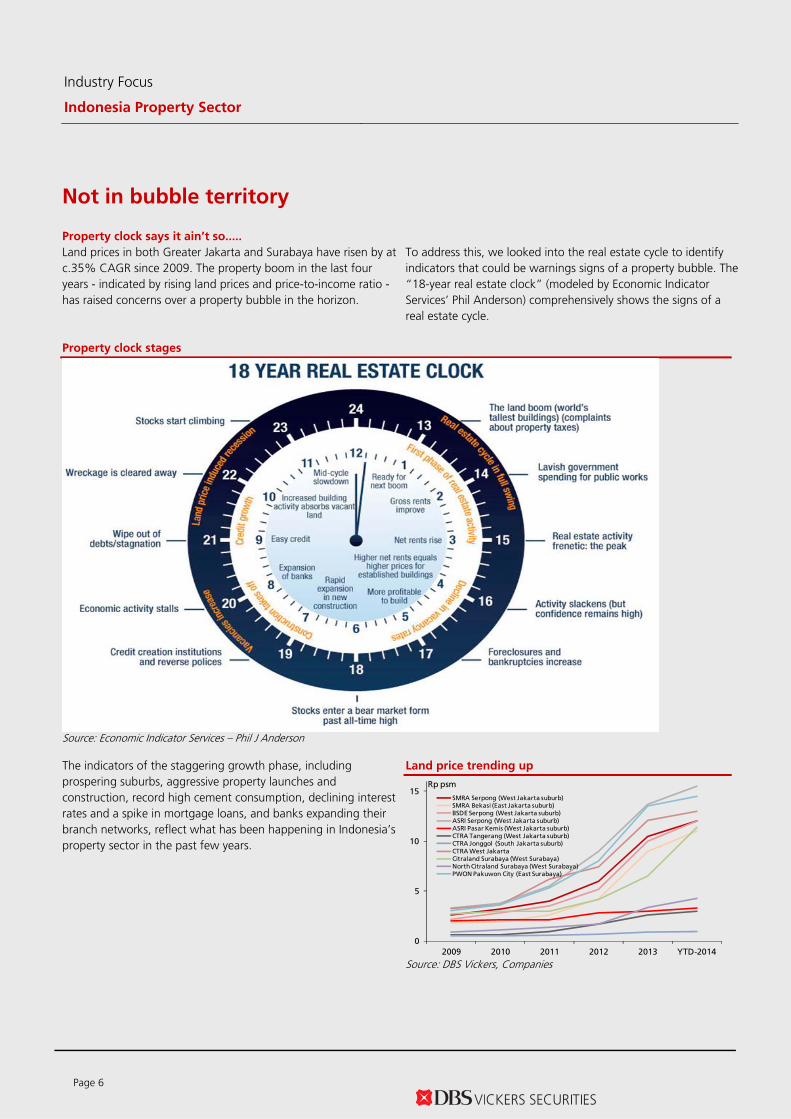
Not in bubble territory Property clock says it ain’t so.....
Land prices in both Greater Jakarta and Surabaya have risen by at c.35% CAGR since 2009. The property boom in the last four years - indicated by rising land prices and price-to-income ratio - has raised concerns over a property bubble in the horizon.
To address this, we looked into the real estate cycle to identify indicators that could be warnings signs of a property bubble. The “18-year real estate clock” (modeled by Economic Indicator Services’ Phil Anderson) comprehensively shows the signs of a real estate cycle.
Property clock stages
Source: Economic Indicator Services – Phil J Anderson The indicators of the staggering growth phase, including prospering suburbs, aggressive property launches and construction, record high cement consumption, declining interest rates and a spike in mortgage loans, and banks expanding their branch networks, reflect what has been happening in Indonesia’s property sector in the past few years.
Land price trending up
0
5
10
15
2009 2010 2011 2012 2013 YTD-2014
SMRA Serpong (West Jakarta suburb)SMRA Bekasi (East Jakarta suburb)BSDE Serpong (West Jakarta suburb)ASRI Serpong (West Jakarta suburb)ASRI Pasar Kemis (West Jakarta suburb)CTRA Tangerang (West Jakarta suburb)CTRA Jonggol (South Jakarta suburb)CTRA West JakartaCitraland Surabaya (West Surabaya)North Citraland Surabaya (West Surabaya)PWON Pakuwon City (East Surabaya)
Rp psm
Source: DBS Vickers, Companies
Industry Focus
Indonesia Property Sector
Page 7
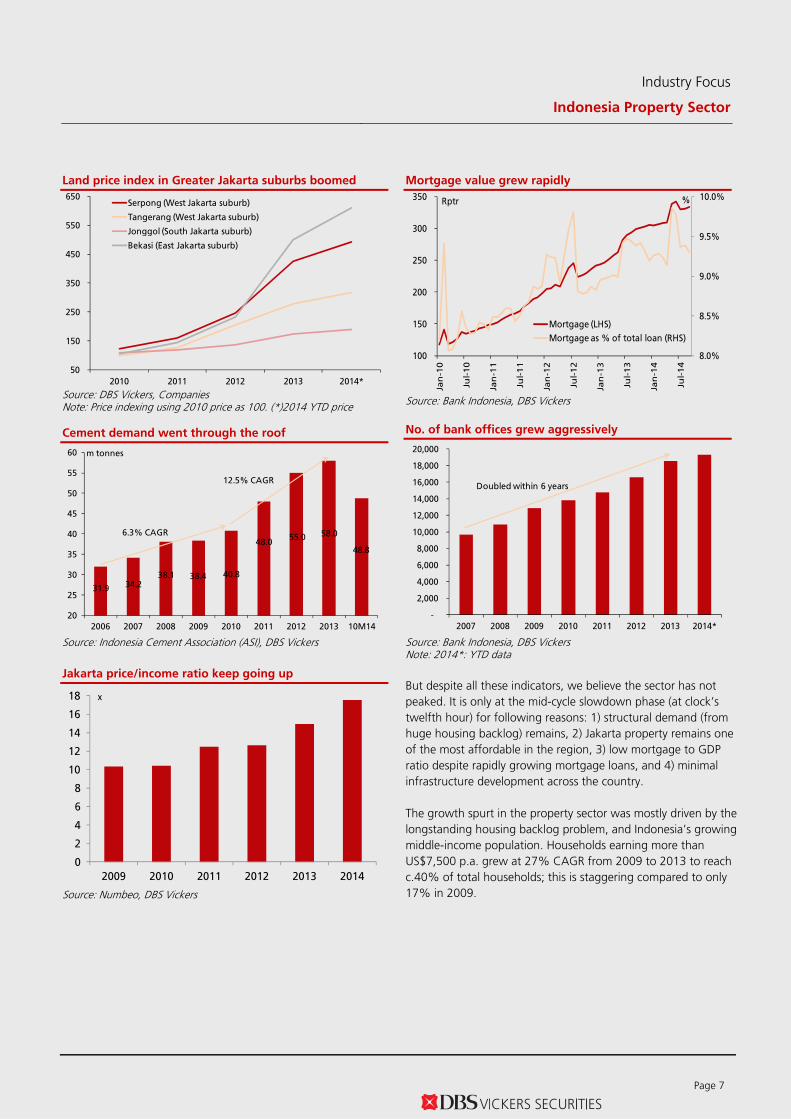
Land price index in Greater Jakarta suburbs boomed
50
150
250
350
450
550
650
2010 2011 2012 2013 2014*
Serpong (West Jakarta suburb)
Tangerang (West Jakarta suburb)
Jonggol (South Jakarta suburb)
Bekasi (East Jakarta suburb)
Source: DBS Vickers, Companies Note: Price indexing using 2010 price as 100. (*)2014 YTD price Cement demand went through the roof
31.9 34.238.1 38.4 40.8
48.055.0 58.0
48.8
20
25
30
35
40
45
50
55
60
2006 2007 2008 2009 2010 2011 2012 2013 10M14
m tonnes
12.5% CAGR
6.3% CAGR
Source: Indonesia Cement Association (ASI), DBS Vickers Jakarta price/income ratio keep going up
0
2
4
6
8
10
12
14
16
18
2009 2010 2011 2012 2013 2014
x
Source: Numbeo, DBS Vickers
Mortgage value grew rapidly
8.0%
8.5%
9.0%
9.5%
10.0%
100
150
200
250
300
350
Jan
-10
Jul-
10
Jan
-11
Jul-
11
Jan
-12
Jul-
12
Jan
-13
Jul-
13
Jan
-14
Jul-
14
Mortgage (LHS)
Mortgage as % of total loan (RHS)
Rptr %
Source: Bank Indonesia, DBS Vickers
No. of bank offices grew aggressively
-
2,000
4,000
6,000
8,000
10,000
12,000
14,000
16,000
18,000
20,000
2007 2008 2009 2010 2011 2012 2013 2014*
Doubled within 6 years
Source: Bank Indonesia, DBS Vickers Note: 2014*: YTD data But despite all these indicators, we believe the sector has not peaked. It is only at the mid-cycle slowdown phase (at clock’s twelfth hour) for following reasons: 1) structural demand (from huge housing backlog) remains, 2) Jakarta property remains one of the most affordable in the region, 3) low mortgage to GDP ratio despite rapidly growing mortgage loans, and 4) minimal infrastructure development across the country. The growth spurt in the property sector was mostly driven by the longstanding housing backlog problem, and Indonesia’s growing middle-income population. Households earning more than US$7,500 p.a. grew at 27% CAGR from 2009 to 2013 to reach c.40% of total households; this is staggering compared to only 17% in 2009.
Industry Focus
Indonesia Property Sector
Page 8
Middle to upper class households grew rapidly
-
10,000
20,000
30,000
40,000
50,000
60,000
70,000
2008 2009 2010 2011 2012 2013
x < US$2,500 US$2,500 ≤ x < US$7,500US$7,500 ≤ x < US$15,000 US$15,000 ≤ x < US$25,000≥US$25,000
no. of household
Source: Euromonitor, DBS Vickers Jakarta’s property is still one of most affordable
17.5
0
5
10
15
20
25
30
35
40 x
Source: Numbeo, DBS Vickers Mortgage to GDP still at low level
Source: Bank Indonesia, Bloomberg Finance L.P, DBS Vickers Note: 2014*: YTD data
Based on CEIC data, Indonesia’s gross construction output grew at 38% CAGR from 2008 to Rp584tr in 2013. But that only represents 6.4% of GDP. Low government spending on public works in the past decade remains the inihibitor of further price surges to ridiculous levels.
Construction spending to GDP ratio remains low
2.4% 2.3%
5.6%5.9%
6.2%6.4%
1.0%
2.0%
3.0%
4.0%
5.0%
6.0%
7.0%
0
100
200
300
400
500
600
700
2008 2009 2010 2011 2012 2013
Gross construction output (LHS)
Construction spending as % of GDP (RHS)Rptr
Source: CEIC, Bloomberg Finance L.P., DBS Vickers Sustainability studies Sustainability indicators (i.e leverage trend and ability to repay debt) are also a group of measure that can help to determine whether the property sector is straddling through the bubble zone. We conducted two tests (Altman Z-score and pre-sales backlog-to-debt studies), and looked at the net gearing trend of developers under our coverage. The Altman Z-score method consists of five performance ratios: working capital to total assets, retained earnings to total assets, EBIT to total assets, market value of equity to total liabilities and sales to total assets. They are combined with certain weights to give a single score. The lower the value, the weaker the sustainability going forward. The threshold score is 1.8. The following chart shows each developer’s score based on our FY14 forecast numbers. Altman Z-score based on our FY14F estimates
-
0.5
1.0
1.5
2.0
2.5
3.0
3.5
4.0
4.5
5.0
BSDE PWON SMRA LPKR CTRA ASRI APLN
1.8
Source: DBS Vickers
Industry Focus
Indonesia Property Sector
Page 9
Besides the Altman Z-score, we also analysed developers’ current cash adequacy against existing interest-bearing debt. The ratio peaked in 2011 but has steadily declined to 2008 levels, showing a positive correlation with property marketing sales growth in the period. The chart also explains why there was a flurry of fund raising actions by property developers this year (as summarised in the previous section). Pre-sales deposits plus cash to debt ratio trend
-0.5
0.0
0.5
1.0
1.5
2.0
2.5
3.0
-10%
0%
10%
20%
30%
40%
50%
60%
70%
2009 2010 2011 2012 2013 2014*
Marketing sales growth (LHS)
Pre-sales deposits plus cash to interest bearing debt ratio (RHS)
Source: DBS Vickers Note: 2014*: annualized numbers Pre-sales deposits plus cash to debt ratio per developer
2009 2010 2011 2012 2013 2014* Source: DBS Vickers, Companies. (*) YTD data Note: The net gearing % is based on aggregate data of 7 developers under our coverage The charts above show that developers will be able to repay existing debts, and only one developer scored below the Altman Z-score 1.8 threshold. Therefore, we would conclude that Indonesia’s property developers will be able to sustain growth going forward, and have strong capacity to repay existing debts (although net gearing has been rising in the past two years). In conclusion, as shown in the property clock cycle, indicators and tests above, the property sector still has room for further growth, albeit moderately, and is still many years away from a bubble state.
Industry Focus
Indonesia Property Sector
Page 10
But, there are challenges ahead Cost pressure
The government’s recent move to increase the price of subsidised fuel by Rp2,000/litre or 31% (amid falling crude oil prices) is seen as long term positive, considering the potential positive impact on both Indonesia’s fiscal and current account balances. Our economist has included the higher fuel prices in his inflation forecast for next year of 6.4% (expects a spike in Dec 2014 before easing from Mar 2015 onwards). The sheer impact of higher construction costs in general will be felt mostly on 2016 earnings, especially for projects launched in 2H14 before the announcement of the fuel subsidy cut. This is due to the time lag between marketing sales and construction starts. Developers would have to adjust construction costs (charges by building contractors) for these new projects to account for higher fuel prices. Besides pressure from the fuel price hike, the increase in the provincial monthly minimum wage (UMP) would also exert upward pressure on developers’ cost of goods sold and operating expenses. Based on newsflow over the past few weeks, 29 out of 33 provinces have capped the increase in UMP at 15%, a level considered reasonable so as not to shock the system (i.e. property development sector). Note that Jakarta’s monthly UMP will rise by 11% to Rp2.7m, while the UMP elsewhere would be between 19% and 54% lower than Jakarta’s. Jakarta’s monthly minimum wage
2.7
0%
5%
10%
15%
20%
25%
30%
35%
40%
45%
50%
0.0
0.5
1.0
1.5
2.0
2.5
3.0
2009 2010 2011 2012 2013 2014 2015
Monthly UMP (LHS) Growth (RHS)Rp m
Source: National Statistic Bureau (BPS), DBS Vickers Considering these two factors, we trimmed developers’ margins by 2-4 ppts across all segments. There will be larger impact on margins for high-rise projects due to several factors, such as longer construction period, quantity of building materials, bigger exposure to materials price in USD, and project complexity.
Slower unit demand growth going forward
In general, property developers’ experienced much slower marketing sales growth this year (discussed in the previous section), in line with the country’s slow GDP growth (5% y-o-y, the slowest in five years). We observed that the number of pre-sold property products (i.e. landed residential, apartments and commercial units) had peaked in 2012 and steadily declined since. We saw a sharp pick-up in demand for apartment units this year because the market offered a lot of smaller units (< 50sqm) in middle-class apartment projects with unit price ranging from Rp400m (US$33k) to Rp750m (US$62k). This shows the affordability ratio is being stretched, although still lower than in regional cities. Pre-sold property units’ trend
-
1,000
2,000
3,000
4,000
5,000
6,000
7,000
8,000
2010 2011 2012 2013 9M14
Landed residential
Apartment
Commercial
unit
Source: Companies, DBS Vickers Note: Total units were the aggregates from Greater Jakarta townships of SMRA, BSDE, ASRI (excl. Pasar Kemis), PWON and CTRA. 9M14 apartment units were boosted by middle class apartment towers by SMRA and ASRI Our economist is projecting 5.5% GDP growth for next year. It is always a good bet to expect land prices and building construction costs to to increase by an average of 12% and 15%, respectively, next year, as property developers still have the the ability to pass-on higher costs and have holding power (i.e. the ability to hold onto a property if the selling price does not meet their expectations). But on the flipside, we should expect transaction volume to drop again next year (as we have witnessed this year) for two reasons: 1) current high property price/income ratio would discount buyers’ ability to purchase property, and 2) the steep drop in the gap between expected capital gains from an owned property, and deposit rates.
Industry Focus
Indonesia Property Sector
Page 11
Greater Jakarta property price growth to deposit rate
ratio
3.2
2.0
1.4
4.1
8.2
8.7
1.8
0
1
2
3
4
5
6
7
8
9
10
2008 2009 2010 2011 2012 2013 2014*
x
Source: Companies, Bank Indonesia, DBS Vickers News of the potential easing of foreign ownership rules in Indonesia has been gathering pace since July, during the presidential election campaign. The immediate implication on the property sector will be a broader buyer base for luxury high rise apartment units, and upside risk to property prices in that segment in the foreseeable future. If this news proves to be true, the beneficiaries would be developers with “premium” price apartments in their portfolio, such as PWON, CTRP (subsidiary of CTRA) and LPKR. However, we believe there has been excessive optimism towards this news. It is unlikely to happen due to the long and arduous process (i.e. “battle” in parliament) to change Indonesia Agraria Law no .5/1960, which covers basic rights to own a property. In addition, there have been media reports that the government is trying to clamp down on number of foreigners (either through nominees or marriage) who own property in Indonesia. Regulations and liquidity tightening risk
It has been slightly more than a year since BI implemented the refined Loan-to-Value (LTV) regulation. Stricter LTV caps and the new disbursement scheme (staggered based on % of completion) for developers had reined in mortgage growth significantly in the six months after Sep 2013. After that, developers have circumvented that regulation by allowing installment of initial down-payment (DP) until buyers are able to apply for a mortgage, offering a larger incentive for either hard cash or cash installment payments, etc. Although the cash installment method remains the favourite among buyers (at more than 50% of transactions), the mortgage portion has now recovered from lows in Jan 2014 to levels seen before Sep 2013.
Indonesia’s maximum Loan-to-Value (LTV) regulation
Source: Bank Indonesia (BI), DBS Vickers Mortgage portion trend
53%41% 44%
22%29%
35% 36% 39% 38% 40%35% 34% 35%
12%
11%14%
15%12%
13% 14% 12% 13% 13%12% 11% 11%
35%
48%42%
63% 59%52% 50% 49% 49% 47%
52% 55% 55%
0%
10%
20%
30%
40%
50%
60%
70%
80%
90%
100%
20
11
20
12
20
13
Jan
14
Fe
b1
4
Ma
r14
Ap
r14
Ma
y1
4
Jun
14
Jul1
4
Au
g1
4
Se
p1
4
Oct
14
Mortgage Cash In-house financing
Source: Ciputra Development (CTRA), DBS Vickers Another road bump for developers (particularly for Jakarta projects) is securing approvals for high-rise projects. Naturally, as the cost of acquiring land gets pricier, developers will ask for higher plot ratios to maximise the value of landbank and maintain margins. However, the process of securing a higher plot ratio can take a while, which could subsequently drag a project’s timeline. The local government (with its authority to grant higher plot ratios) will demand developers to either contribute to build subsidised apartments under a government program or build more road access to improve traffic. The other regulatory risk for property developers (summarised in APPENDIX) is the same as that mentioned in our previous report. BI’s recent surprise move to raise reference rate by 25bps to 7.75% (after staying put for the last 12 months) and lending facility rate by 50bps to 8% (higher than reference rate) is deemed hawkish; a strong signal it wants anchor inflation expectations going forward (i.e. countering subsidised fuel price hike) and to safeguard against risks of excessive money supply. Our economist also noted that with BI keeping the overnight deposit rate (FASBI) rate at 5.75%, liquidity from the financial system will not be absorbed.
Source: Bloomberg Finance L.P, DBS Vickers Although the mild 25bps increase in reference rate will not significantly affect current floating mortgage rates, this could create negative sentiment towards the general property sector (due to negative correlation between those two). A further increase in reference rate would crimp growth ahead. High foreign shareholding in property developer stocks
Foreign ownership in property developers stocks under our coverage remains high at between 53% and 69% of free float, with the exception of APLN which foreign ownership has been declining steadily to current low of 37%). Any signs of weak Indonesia macro condition from foreign investors point of view will cause Indonesian property stock prices to drop, given the high-beta nature and generally small- to mid-market cap size. Foreign ownership trend (as % of freefloat)
53.6%
68.9%
63.0%63.2%65.5%
56.1%
37.2%35%
45%
55%
65%
75%
85%
Jan
-12
Ma
r-1
2
Ma
y-1
2
Jul-
12
Se
p-1
2
No
v-1
2
Jan
-13
Ma
r-1
3
Ma
y-1
3
Jul-
13
Se
p-1
3
No
v-1
3
Jan
-14
Ma
r-1
4
Ma
y-1
4
Jul-
14
Se
p-1
4
BSDE LPKR PWON SMRA CTRA ASRI APLN
Source: Indonesian Central Securities Depository (KSEI), Bloomberg Finance L.P, DBS Vickers
Mild threat from new entrants
Marketing sales had surged between 2009 and 2013, and the attractive cashflows have caught the attention of new entrants with parcels of idle landbank. However, most of them do not have expertise in property development. Hence, we do not see them as credible threats to existing players, as they either target different market segments or are located mostly in the city outskirts. The following are a few examples:
Astra International (ASII) partnered with HK Land to develop mixed-use high-rise development in prime CBD area.
Logistics company AKR Corporindo (AKRA) targets to increase revenue contribution from property to 10% in the next 2-3 years. It currently develops mixed-used project in West Jakarta through its subsidiary AKR Land.
State-owned toll-road company Jasa Marga - through its subsidiary Jasamarga Properti - plans to develop its landbank around its toll road, and to acquire more landbank in Bandung, Cirebon and Surabaya
State-owned construction company Wijaya Karya (WIKA) has property developments (ranging from landed houses to apartments & office towers) across Indonesia, including Jakarta, West Java, Banten, Central Java, East Java, East Kalimantan, and North & South Sulawesi.
State-owned constractor Pembangunan Perumahan (PTPP)’s subsidiary PTPP Properti (set for IPO early next year) are developing two large mixed-use projects: Grand Kamala Lagoon Bekasi and Grand Sungkono Lagoon Surabaya. They have several other projects.
State-owned contractor Adhi Karya’s (ADHI) subsidiary Adhi Persada Properti has investment properties (including Mall Cimone City and Mall Mandau City) and high-rise developments (including Grand Taman Melati Margonda, Grand Dhika City Bekasi, and The Jasmine Park Bandung).
State-owned contractor Waskita Karya (WSKT) has a 51-49 JV with Trinity to develop recently launched Soho/Suites/Office at Alam Sutera (West Jakarta suburb) township.
Industry Focus
Indonesia Property Sector
Page 13
Property segment outlook 2015
Burning prediction for property segments in 2015
Property segment Outlook Key points
Landed residential
Structural long term demand remains from large backlog and urbanization trend
Developers to manage supply to maintain steady price appreciation
Expect stable margins as developers has the ability to pass-on the cost pressures
Retail
Limited supply condition in Jakarta still remains (due to mall moratorium)
Surge in new supply in suburbs to tap on growing population and spending power
Base rental rate to grow steadily between 8-12% annually
High-rise residential
Flurry of apartment launches in non-prime area (i.e. suburbs)
Potential difficulties in securing extended plot ratio to maximise land value
Expect higher units pre-sold mostly small sized apartments but lower marketing sales growth
Office
Expect abundant office space supply in both CBD and other areas
Downswing in office space demand to continue
Expect base rental rate growth to revert back to pre-2009 level
Source: DBS Vickers
Landed residential –plenty of demand to be dispatched
Structural long term demand (especially in large cities) due to large backlog, a young population, and urbanisation, will continue to drive landed residential sales in the next few years. In Greater Jakarta, annual house formation is estimated at ~170k per year, but developers only have the capacity to supply less than 70% of that. Young demographic profile for Indonesia
44%
34%
53%
46%
32%
22% 23%
33%
47%
7%10%
4% 5%8%
15%
25%
9%
6%
0%
10%
20%
30%
40%
50%
60%Below 24 Above 65
Source: CIA World Factbook 2013
Indonesia population growth: Urban vs. rural population
Source: UN, ADB, DBS Vickers In the landed residential segment, we expect property developers to manage supply appropriately to maintain steady price appreciation. Hence, pre-sold units at ongoing projects will continue to decline. Also, we expect developers to pass on most of the cost pressure to maintain their hefty margins. As mentioned in previous sections, we still expect land prices and building construction cost to rise by an average of 12% and 15%, respectively, next year.
Industry Focus
Indonesia Property Sector
Page 14
High-rise residential – volume boost from a rising
number of middle-class apartments in suburbs
For this sector, we shall focus on Greater Jakarta. The positive momentum in strata-title apartment sales will continue into 2015. Take-up rates for existing projects are still high at 95%. A growing middle-income population coupled with traffic jams is contributing to a changing lifestyle that is pushing up demand for apartments. The interesting trend that we are witnessing now is the flurry of apartment launches in non-prime areas (i.e. populated suburban townships). Land prices in those townships, particularly in the Serpong and Bekasi area (refer to suburb land price index in previous section), have surged to critical price-to-cost thresholds that make sense for high-rise developments. Sales of suburban apartment units have surged about five-fold this year (see chart below). However, because of the huge disparity in price and size between apartments in the suburbs and the CBD area, marketing sales growth of the former has been much slower. The average price and size of a suburban apartment unit is Rp500m and 35 sqm, respectively, probably reflecting the buying power of Indonesia’s middle class. Pre-sold apartment units trend
-
500
1,000
1,500
2,000
2,500
3,000
3,500
4,000
4,500
5,000
2010 2011 2012 2013 9M14
Suburb area apartment CBD area apartmentunit
Source: Companies, DBS Vickers Note: Total units were the aggregates from SMRA, BSDE, ASRI, PWON and CTRA. 9M14 apartment units were boosted by middle class apartment towers by SMRA and ASRI
Pre-sold apartment units marketing sales trend
-
500
1,000
1,500
2,000
2,500
3,000
2010 2011 2012 2013 9M14
Suburb area apartment CBD area apartmentRpbn
Source: Companies, DBS Vickers Note: Total marketing sales were the aggregates from SMRA, BSDE, ASRI, PWON and CTRA. 9M14 apartment units were boosted by middle class apartment towers in suburbs by SMRA and ASRI Strata title apartment price trend
10
15
20
25
30
35
40
45
2010 2011 2012 2013 YTD-2014
CBD South Jakarta - outside CBD Non-primeRp m psm
Source: Colliers Considering the above factors and the potential difficulty in securing higher plot ratios for high-rise projects, we are neutral on this segment. Retail mall lease – remains a beacon in the storm
Retail space in Jakarta remains scarce due to the moratorium on new malls. Occupancy rate remained high at 86.1% in 3Q14, down about 3ppts q-o-q basis mostly due to Lippo Mall Puri opening which added 107,200 sqm or c.4% of Jakarta’s retail space supply. The only sizeable new malls (above 25k sqm) to open in Jakarta in the next three years are Pantai Indah Kapuk (PIK) Mall in North Jakarta and Central Park Mall extension in West Jakarta.
Industry Focus
Indonesia Property Sector
Page 15
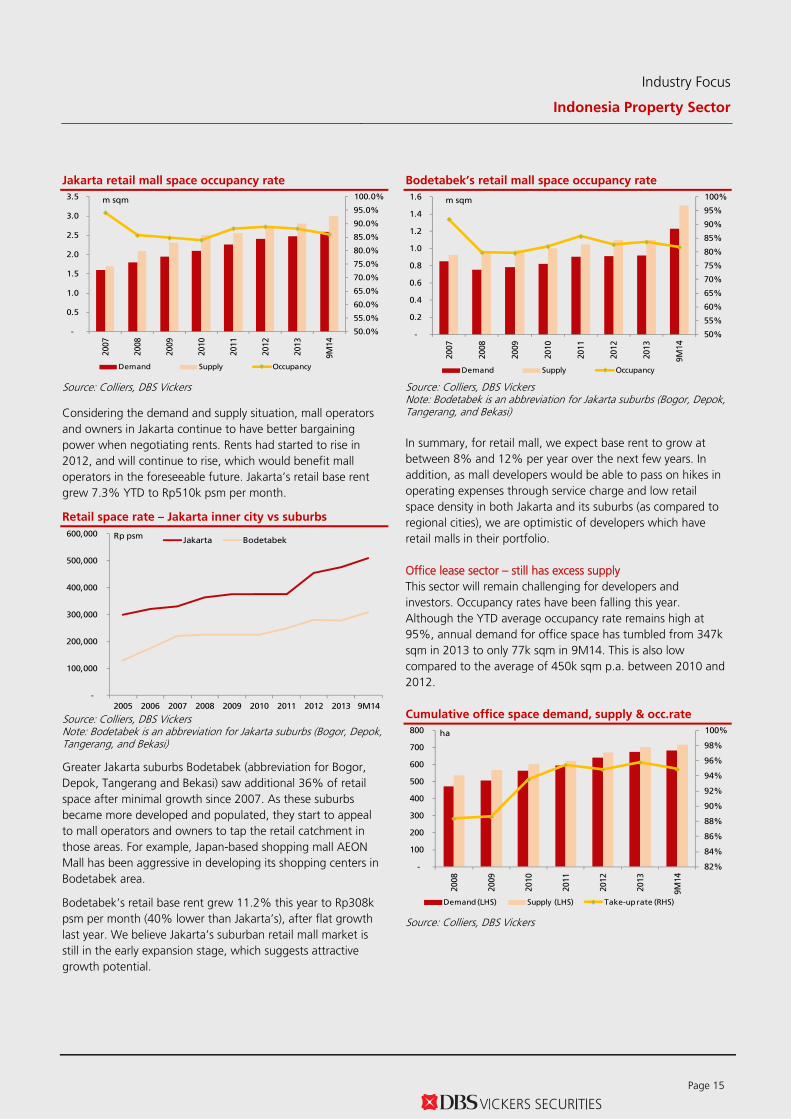
Jakarta retail mall space occupancy rate
50.0%
55.0%
60.0%
65.0%
70.0%
75.0%
80.0%
85.0%
90.0%
95.0%
100.0%
-
0.5
1.0
1.5
2.0
2.5
3.0
3.5
2007
2008
2009
2010
2011
2012
2013
9M
14
Demand Supply Occupancy
m sqm
Source: Colliers, DBS Vickers Considering the demand and supply situation, mall operators and owners in Jakarta continue to have better bargaining power when negotiating rents. Rents had started to rise in 2012, and will continue to rise, which would benefit mall operators in the foreseeable future. Jakarta’s retail base rent grew 7.3% YTD to Rp510k psm per month. Retail space rate – Jakarta inner city vs suburbs
-
100,000
200,000
300,000
400,000
500,000
600,000
2005 2006 2007 2008 2009 2010 2011 2012 2013 9M14
Jakarta BodetabekRp psm
Source: Colliers, DBS Vickers Note: Bodetabek is an abbreviation for Jakarta suburbs (Bogor, Depok, Tangerang, and Bekasi) Greater Jakarta suburbs Bodetabek (abbreviation for Bogor, Depok, Tangerang and Bekasi) saw additional 36% of retail space after minimal growth since 2007. As these suburbs became more developed and populated, they start to appeal to mall operators and owners to tap the retail catchment in those areas. For example, Japan-based shopping mall AEON Mall has been aggressive in developing its shopping centers in Bodetabek area. Bodetabek’s retail base rent grew 11.2% this year to Rp308k psm per month (40% lower than Jakarta’s), after flat growth last year. We believe Jakarta’s suburban retail mall market is still in the early expansion stage, which suggests attractive growth potential.
Bodetabek’s retail mall space occupancy rate
50%
55%
60%
65%
70%
75%
80%
85%
90%
95%
100%
-
0.2
0.4
0.6
0.8
1.0
1.2
1.4
1.6
2007
2008
2009
2010
2011
2012
2013
9M
14
Demand Supply Occupancy
m sqm
Source: Colliers, DBS Vickers Note: Bodetabek is an abbreviation for Jakarta suburbs (Bogor, Depok, Tangerang, and Bekasi) In summary, for retail mall, we expect base rent to grow at between 8% and 12% per year over the next few years. In addition, as mall developers would be able to pass on hikes in operating expenses through service charge and low retail space density in both Jakarta and its suburbs (as compared to regional cities), we are optimistic of developers which have retail malls in their portfolio. Office lease sector – still has excess supply This sector will remain challenging for developers and investors. Occupancy rates have been falling this year. Although the YTD average occupancy rate remains high at 95%, annual demand for office space has tumbled from 347k sqm in 2013 to only 77k sqm in 9M14. This is also low compared to the average of 450k sqm p.a. between 2010 and 2012. Cumulative office space demand, supply & occ.rate
82%
84%
86%
88%
90%
92%
94%
96%
98%
100%
-
100
200
300
400
500
600
700
800
2008
2009
2010
2011
2012
2013
9M
14
Demand (LHS) Supply (LHS) Take-up rate (RHS)
ha
Source: Colliers, DBS Vickers
Industry Focus
Indonesia Property Sector
Page 16
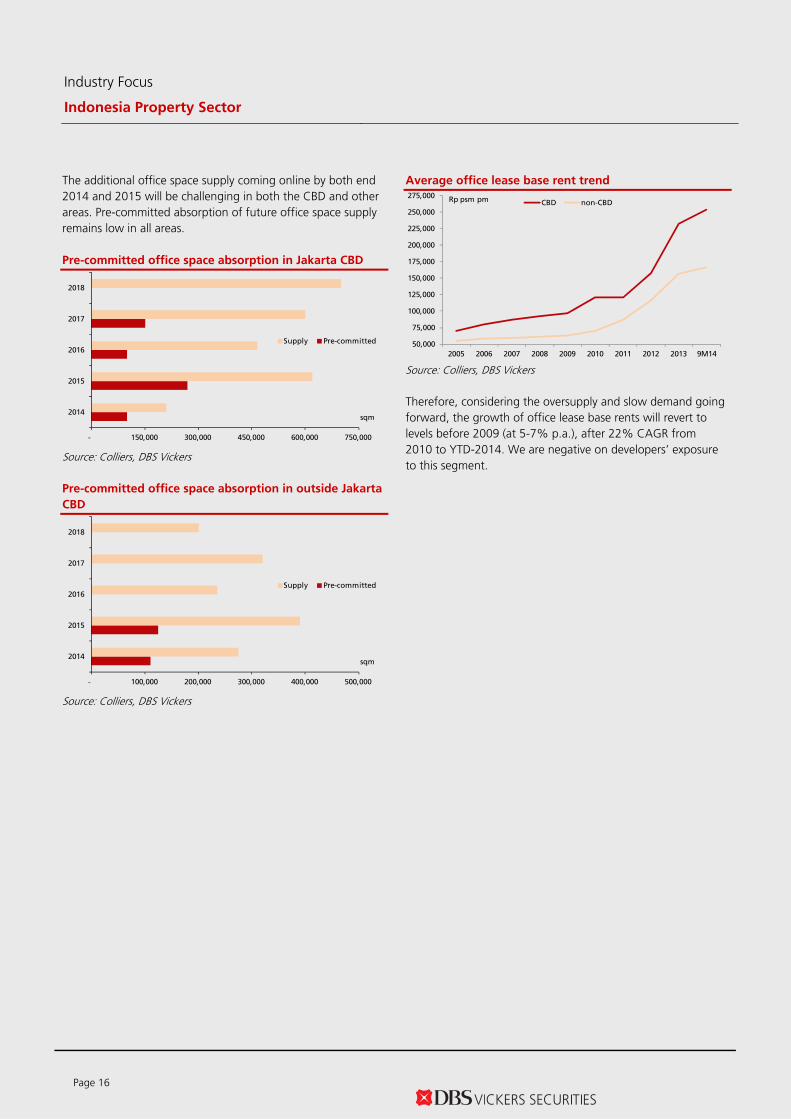
The additional office space supply coming online by both end 2014 and 2015 will be challenging in both the CBD and other areas. Pre-committed absorption of future office space supply remains low in all areas.
Pre-committed office space absorption in Jakarta CBD
- 150,000 300,000 450,000 600,000 750,000
2014
2015
2016
2017
2018
Supply Pre-committed
sqm
Source: Colliers, DBS Vickers Pre-committed office space absorption in outside Jakarta
CBD
- 100,000 200,000 300,000 400,000 500,000
2014
2015
2016
2017
2018
Supply Pre-committed
sqm
Source: Colliers, DBS Vickers
Average office lease base rent trend
50,000
75,000
100,000
125,000
150,000
175,000
200,000
225,000
250,000
275,000
2005 2006 2007 2008 2009 2010 2011 2012 2013 9M14
CBD non-CBDRp psm pm
Source: Colliers, DBS Vickers Therefore, considering the oversupply and slow demand going forward, the growth of office lease base rents will revert to levels before 2009 (at 5-7% p.a.), after 22% CAGR from 2010 to YTD-2014. We are negative on developers’ exposure to this segment.
Industry Focus
Indonesia Property Sector
Page 17
Valuation and recommendation Revisions to marketing sales and RNAV assumptions
We adjusted our marketing sales assumption for all developers to reflect Indonesia’s current macro conditions, YTD achievements, and launches in the pipeline. This changed our RNAV estimates by between minus 7% and 20%. As discussed in previous sections, marketing sales are only expected to inch up next year by 4%. Rising land prices and new projects in the pipeline will offset the impact of a declining number of pre-sold units at existing projects. We estimate marketing sales from existing projects will drop by 30% y-o-y. We also expect 1Q15 marketing sales to be weak compared to full year target (i.e. fewer launches) as developers need time to understand the direction of the property market and material cost movements.
30% of FY15F marketing sales from new projects
30%
-
5,000
10,000
15,000
20,000
25,000
30,000
35,000
40,000
45,000
2010 2011 2012 2013 2014F 2015F
Previous/Existing projects New projectsRpbn
Source: DBS Vickers
Summary changes in RNAV and assumptions
Company Previous RNAV
New RNAV
New assumption
WACC Beta Equity portion
Debt portion
APLN 673 681 12.9% 1.2 60.0% 40.0%
ASRI 839 829 13.2% 1.3 55.0% 45.0%
BSDE 2,927 3,234 13.3% 1.2 75.0% 25.0%
CTRA 1,610 1,620 12.8% 1.1 65.0% 35.0%
LPKR 1,725 1,613 12.9% 1.2 60.0% 40.0%
PWON 595 600 12.7% 1.2 57.5% 42.5%
SMRA 2,126 2,543 13.2% 1.3 60.0% 40.0%
Source: DBS Vickers The changes in marketing sales prompted changes to FY14/15F revenue and net profit estimates. (Refer to changes in APPENDIX)
Introducing sprinkles to current method to derive TP
We derived TPs for each developer based on discount to RNAV. The discount to RNAV for each developer is defined using two factors: 4-years average of historical discount to RNAV and forecasted portion of recurring revenue next year. Assumptions to derive TP of each developers
Company
4-years average
discount to RNAV
Forecasted recurring revenue portion
Discount to RNAV to derive
TP
New TP
APLN 65% 25% 48.7% 345
ASRI 42% 5% 40.3% 490
BSDE 49% 22% 38.6% 1,980
CTRA 36% 16% 30.5% 1,125
LPKR 36% 26%* 26.9% 1,180
PWON 20% 45% 10.7% 530
SMRA 38% 19% 30.4% 1,780
Source: DBS Vickers (* exclude healthcare portion) Back to fundamentals: SMRA and BSDE are top picks in
2015
The property sector is currently trading at 33% discount to RNAV, narrower than its 4-year average of 41%. Valuation is also not rich, at +1SD of mean forward PE compared to the JCI Index’s +1.5SD of mean. Property sector PE band
Source: DBS Vickers, Bloomberg Finance L.P As explained in detail in the 2015 property outlook section, we favour developers with large exposure to landed residential property and retail malls (both Jakarta and its suburbs), and scoring high in the sustainability test. These leaves us with three developers: SMRA, BSDE and PWON. RNAV breakdown per developers
86%
13%
80%73%
34%
21%
76%
3%
16%
4%
5%
7%
10%
5%
3%
41%
8%12%
11%
48%
16%
7%
3%
5% 3%
1%
14%24%
3%2%
5%
6% 3%2% 4%
42%
1%
0%
10%
20%
30%
40%
50%
60%
70%
80%
90%
100%
ASRI APLN BSDE CTRA LPKR PWON SMRA
Landed residential Apartment Retail Mall Office Hotel Others
Source: DBS Vickers
Our top picks in the property sector are SMRA and BSDE which are offering 22% and 11% upside, respectively. We see potential upside to SMRA’s RNAV arising from the planned spin-off of its investment property next year. BSDE has few new projects outside Greater Jakarta to support further growth, in addition to its main project, BSD City township. We also like PWON’s portfolio mix with the largest share of revenue from retail mall operation among peers, and the sustainable growth going forward. However, we have to downgrade PWON to HOLD purely because of limited upside from current level to our TP. Other changes - recommendation and TP - are summarised in the table below. Summary of TP and recommendation changes
Company New TP Previous TP Changes New Rec Previous Rec
1 Max. 70% LTV for mortgage BI Circular No. 14/10/DPNP 03/15/2012 Impact dwindling with availability of developers' in-house financing 2 Refinement for LTV regulation above BI Circular No. 15/40/DKMP 09/24/2013
3 Restriction on fund disbursement by banks to property developers
BI Circular No. 15/40/DKMP 09/24/2013 Property developers have come to agreement on cash disbursements with lenders
4 Enforcement of Right to Use (HGB) land ownership limit
- - Proposal
5 At least 80% goods must be local products on retail malls and modern retailers. (Two-year window for compliance)
Permendag no. 70/M-DAG/PER/12/2013
- Unlikely to be implemented
6 Implementation of balance ratio in housing development
Bloomberg: APLN IJ | Reuters: APLN.JK Refer to important disclosures at the end of this report
HOLD Rp361 JCI : 5,149.89 (Upgrade from FULLY VALUED) Price Target : 12-Month Rp 345 (Prev Rp 325) Potential Catalyst: North Jakarta reclamation project DBSV vs Consensus: Lower Analyst Edward Tanuwijaya +6221 3003 4932 [email protected]
Price Relative
4 0
6 0
8 0
1 0 0
1 2 0
1 4 0
1 6 0
1 8 0
2 0 0
2 2 0
1 8 6 . 3
2 3 6 . 3
2 8 6 . 3
3 3 6 . 3
3 8 6 . 3
4 3 6 . 3
4 8 6 . 3
5 3 6 . 3
N o v -1 0 N o v - 1 1 N o v - 1 2 N o v - 1 3 N o v - 1 4
R e l a t i v e I n d e xR p
A g u n g P o d o m o r o L a n d ( L H S ) R e la t iv e J C I IN D E X ( R H S ) Forecasts and Valuation FY Dec (Rp bn) 2013A 2014F 2015F 2016F
Turnover 4,901 4,980 5,809 7,468 EBITDA 1,728 1,906 2,132 2,831 Pre-tax Profit 1,177 1,283 1,480 2,204 Net Profit 851 784 832 1,193 Net Pft (Pre Ex.) 851 784 832 1,193 EPS (Rp) 42 38 41 58 EPS Pre Ex. (Rp) 42 38 41 58 EPS Gth (%) 5 (8) 6 43 EPS Gth Pre Ex (%) 5 (8) 6 43 Diluted EPS (Rp) 42 38 41 58 Net DPS (Rp) 6 6 6 6 BV Per Share (Rp) 281 313 348 400 PE (X) 8.7 9.4 8.9 6.2 PE Pre Ex. (X) 8.7 9.4 8.9 6.2 P/Cash Flow (X) nm 18.8 11.0 8.8 EV/EBITDA (X) 6.4 6.6 6.5 5.2 Net Div Yield (%) 1.7 1.7 1.6 1.7 P/Book Value (X) 1.3 1.2 1.0 0.9 Net Debt/Equity (X) 0.3 0.4 0.5 0.5 ROAE (%) 15.8 12.9 12.3 15.6 Earnings Rev (%): (10) (5) (14) Consensus EPS (Rp): 40 48 61 Other Broker Recs: B: 5 S: 1 H: 2 ICB Industry : Real Estate ICB Sector: Real Estate Investment & Services Principal Business: APLN has been focusing on high-rise developments and prides itself as the King of Jakarta superblocks. Most of its projects are in strategic inner city locations.
Source of all data: Company, DBS Vickers, Bloomberg Finance L.P.
At A Glance Issued Capital (m shrs) 20,501 Mkt. Cap (Rpbn/US$m) 7,401 / 609 Major Shareholders Indofica (%) 47.3 Jaya Lestari Persada (%) 14.7 Simfoni Gema Lestari (%) 5.1 Free Float (%) 29.9 Avg. Daily Vol.(‘000) 49,113
Industry Focus
Agung Podomoro Land
Let's reclaim Marketing sales in line
Revised assumptions for FY14/15F
Option to buyback 10% of shares
Upgrade to HOLD on valuation
Marketing sales in line. APLN booked remarkable Rp1.5tr marketing sales in October to take 10M14 sales to Rp5tr, or 84% of full year guidance of Rp6tr (-6% y-o-y). The newly launched Pakubuwono Springs apartments were the top contributor at 22% of sales, followed by Orchard Park Batam (20%), Harco Glodok (19%) and PoCy Extension (11%).
Revised assumptions for FY14/15F. The company has not released the latest marketing sales guidance because it has not finalising the targets for 4-5 new projects. However, premised on YTD data and our cautious view for next year, we revised FY14/15 marketing sales assumptions by 13%/(-)8% to Rp5.2tr/Rp4tr and subsequently trimmed FY14/15F earnings by 10%/5%. Our FY15F estimates do not include new projects and the anticipated reclamation project, Pluit City (although management seems confident of securing the reclamation license by the end of this year).
To buyback 10% of shares. At the EGM on 27 Nov, shareholders approved the plan to buyback 10% of issued shares between 28 Nov 2014 and 27 May 2016. This is baffling, as APLN needs huge capex for its planned projects (including reclamation projects).
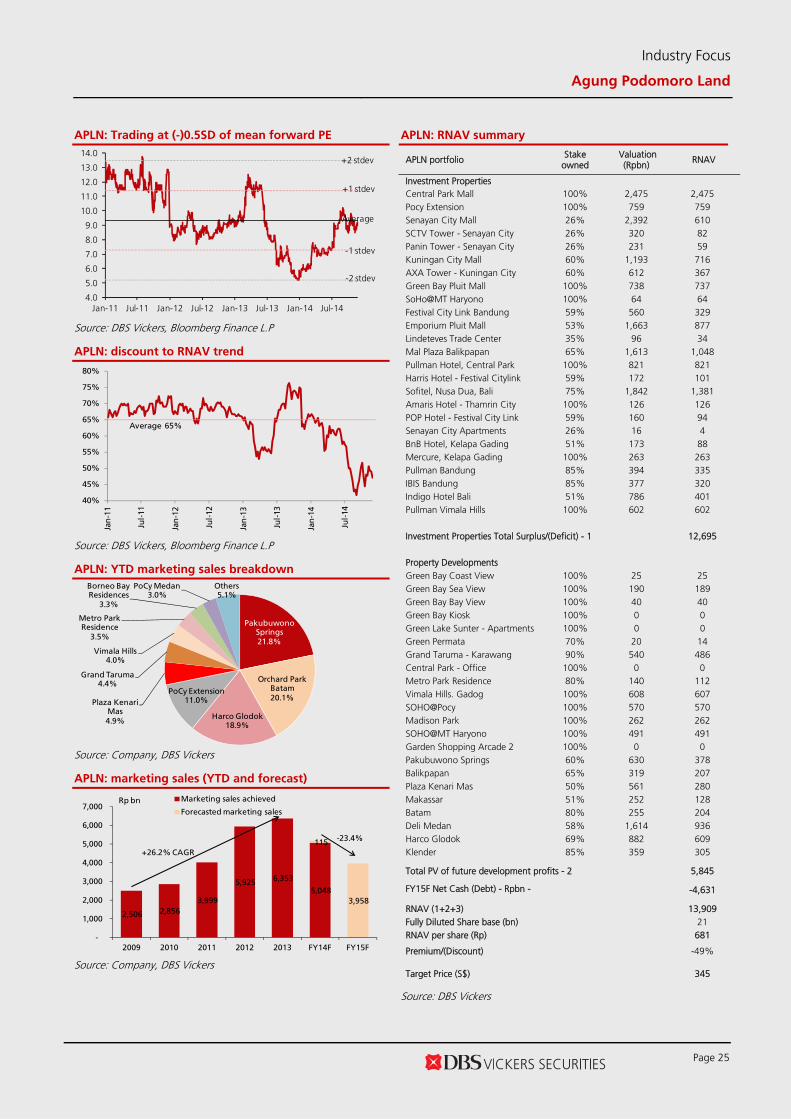
Upgrade to HOLD on valuation only. We nudged up our RNAV by 1% to Rp681/sh (excluding the reclamation projects). We raised TP by 6% to Rp345/sh, based on 49% discount to RNAV. APLN is currently trading at 50% discount to our RNAV and 8.5x FY15F PE (or minus 0.5SD of mean forward PE).
Central Park Mall 100% 2,475 2,475 Pocy Extension 100% 759 759 Senayan City Mall 26% 2,392 610 SCTV Tower - Senayan City 26% 320 82 Panin Tower - Senayan City 26% 231 59 Kuningan City Mall 60% 1,193 716 AXA Tower - Kuningan City 60% 612 367 Green Bay Pluit Mall 100% 738 737 SoHo@MT Haryono 100% 64 64 Festival City Link Bandung 59% 560 329 Emporium Pluit Mall 53% 1,663 877 Lindeteves Trade Center 35% 96 34 Mal Plaza Balikpapan 65% 1,613 1,048 Pullman Hotel, Central Park 100% 821 821 Harris Hotel - Festival Citylink 59% 172 101 Sofitel, Nusa Dua, Bali 75% 1,842 1,381 Amaris Hotel - Thamrin City 100% 126 126 POP Hotel - Festival City Link 59% 160 94 Senayan City Apartments 26% 16 4 BnB Hotel, Kelapa Gading 51% 173 88 Mercure, Kelapa Gading 100% 263 263 Pullman Bandung 85% 394 335 IBIS Bandung 85% 377 320 Indigo Hotel Bali 51% 786 401 Pullman Vimala Hills 100% 602 602
Investment Properties Total Surplus/(Deficit) - 1 12,695
Property Developments Green Bay Coast View 100% 25 25 Green Bay Sea View 100% 190 189 Green Bay Bay View 100% 40 40 Green Bay Kiosk 100% 0 0 Green Lake Sunter - Apartments 100% 0 0 Green Permata 70% 20 14 Grand Taruma - Karawang 90% 540 486 Central Park - Office 100% 0 0 Metro Park Residence 80% 140 112 Vimala Hills. Gadog 100% 608 607 SOHO@Pocy 100% 570 570 Madison Park 100% 262 262 SOHO@MT Haryono 100% 491 491 Garden Shopping Arcade 2 100% 0 0 Pakubuwono Springs 60% 630 378 Balikpapan 65% 319 207 Plaza Kenari Mas 50% 561 280 Makassar 51% 252 128 Batam 80% 255 204 Deli Medan 58% 1,614 936 Harco Glodok 69% 882 609 Klender 85% 359 305
Total PV of future development profits - 2
5,845
FY15F Net Cash (Debt) - Rpbn - 3
-4,631
RNAV (1+2+3) 13,909 Fully Diluted Share base (bn) 21 RNAV per share (Rp) 681
Premium/(Discount)
-49%
Target Price (S$)
345
Source: DBS Vickers
Industry Focus
Agung Podomoro Land
Page 26
Income Statement (Rp bn) Balance Sheet (Rp bn) FY Dec 2013A 2014F 2015F 2016F FY Dec 2013A 2014F 2015F 2016F
Bloomberg: ASRI IJ | Reuters: ASRI.JK Refer to important disclosures at the end of this report
FULLY VALUED Rp560 JCI : 5,149.89 (Downgrade from HOLD) Price Target : 12-Month Rp 490 (Prev Rp 540) Potential Catalyst: Better demand for its office space DBSV vs Consensus: Lower Analyst Edward Tanuwijaya +6221 3003 4932 [email protected]
Price Relative
Forecasts and Valuation FY Dec (Rp bn) 2013A 2014F 2015F 2016F
Turnover 3,684 4,287 4,627 5,054 EBITDA 1,593 1,942 2,092 2,234 Pre-tax Profit 1,082 1,489 1,676 1,827 Net Profit 877 1,141 1,294 1,410 Net Pft (Pre Ex.) 877 1,141 1,294 1,410 EPS (Rp) 45 58 66 72 EPS Pre Ex. (Rp) 45 58 66 72 EPS Gth (%) (26) 30 13 9 EPS Gth Pre Ex (%) (26) 30 13 9 Diluted EPS (Rp) 45 58 66 72 Net DPS (Rp) 15 7 12 13 BV Per Share (Rp) 232 283 338 396 PE (X) 12.5 9.6 8.5 7.8 PE Pre Ex. (X) 12.5 9.6 8.5 7.8 P/Cash Flow (X) 1738.1 95.0 nm 44.6 EV/EBITDA (X) 9.4 7.4 7.2 6.8 Net Div Yield (%) 2.6 1.3 2.1 2.4 P/Book Value (X) 2.4 2.0 1.7 1.4 Net Debt/Equity (X) 0.6 0.4 0.4 0.3 ROAE (%) 20.5 22.5 21.2 19.6 Earnings Rev (%): 3 10 0 Consensus EPS (Rp): 65 70 80 Other Broker Recs: B: 11 S: 1 H: 5 ICB Industry : Real Estate ICB Sector: Real Estate Investment & Services Principal Business: Upscale township developer in Serpong and Pasar Kemis (west Jakarta suburb). ASRI is diversifying its revenue base with more commercial properties such as retail malls and office towers.
Source of all data: Company, DBS Vickers, Bloomberg Finance L.P.
At A Glance Issued Capital (m shrs) 19,649 Mkt. Cap (Rpbn/US$m) 11,004 / 905 Major Shareholders Tangerang Fajar (%) 16.7 Manunggal Prime Develop.
No bragging rights yet Marketing sales in line, driven by sales of
commercial land
Expect corporate action to raise funds
Trimmed FY14/15F marketing sales
Downgrade to FULLY VALUED; no re-rating catalyst
Supported by commercial land sales. 10M14 marketing sales grew 8% y-o-y to Rp3.9tr, reaching 78% of full year guidance. About 60% came from the sale of commercial land in Serpong township, which offset weak demand at Pasar Kemis township. ASRI plans to launch up to two clusters (c.200 units each) at Suvarna Sutera (Pasar Kemis township) to meet its full year target.
Plans to raise more funds. ASRI plans to raise funds through corporate actions. No further details are available at the moment.
Trimmed FY14/15F earnings. After adjusting for the latest data and our cautious view for next year, we cut marketing sales assumptions by 1%/2% to Rp4.5tr/Rp4.9tr for those years. Serpong projects will remain the largest contributors to FY15 marketing sales at c.40% of total. Coupled with adjustments to other assumptions, we trimmed FY14/15F earnings by 3%/10% to Rp1.1tr/Rp1.2tr (about 8% below consensus).
Downgrade to FULLY VALUED. Our TP of Rp490/sh is based on 41% discount to our RNAV estimate of Rp829/sh. ASRI is currently trading at 32% discount to RNAV (narrower than its 4-year average) and at 7.9x FY15F PE (below average mean forward PE).
77
127
177
227
277
327
207.0
407.0
607.0
807.0
1,007.0
1,207.0
Nov-10 Nov-11 Nov-12 Nov-13 Nov-14
Relative IndexRp
Alam Sutera Realty (LHS) Relative JCI INDEX (RHS)
Industry Focus
Alam Sutera Realty
Page 28
ASRI: Trading at below mean forward PE
Source: DBS Vickers, Bloomberg Finance L.P.
ASRI: discount to RNAV trend
Source: DBS Vickers, Bloomberg Finance L.P.
Serpong projects: contribution to marketing sales
Source: Company, DBS Vickers ASRI: marketing sales (YTD and forecast)
Source: Company, DBS Vickers
ASRI: RNAV summary
Portfolio Value (Rpbn) % of total Landbank (ha)
Investment Property 635 3%
Mall @ Alam Sutera 597 3%
Office for lease (CBD) 38 0%
Garuda Wisnu Kencana (Bali) 0 0%
Development properties & Landbank 18,583 97%
Serpong + North Serpong 9,539 50% 624
Pasar Kemis 6,805 35% 1,621
Strata office (CBD) 1,392 7%
Kota Ayodhya 649 3% 2
Cianjur 96 0% 79
Tanjung Pinang (Riau) 28 0% 75
Puncak (South Jakarta suburb) 45 0% 9
Sanur (Bali) 30 0% 6
19,218
Net Debt 2,923 18% RNAV 16,295 100%
Fully Diluted Share base (bn) 19.649 Fully Diluted RNAV per share 829
Bloomberg: BSDE IJ | Reuters: BSDE.JK Refer to important disclosures at the end of this report
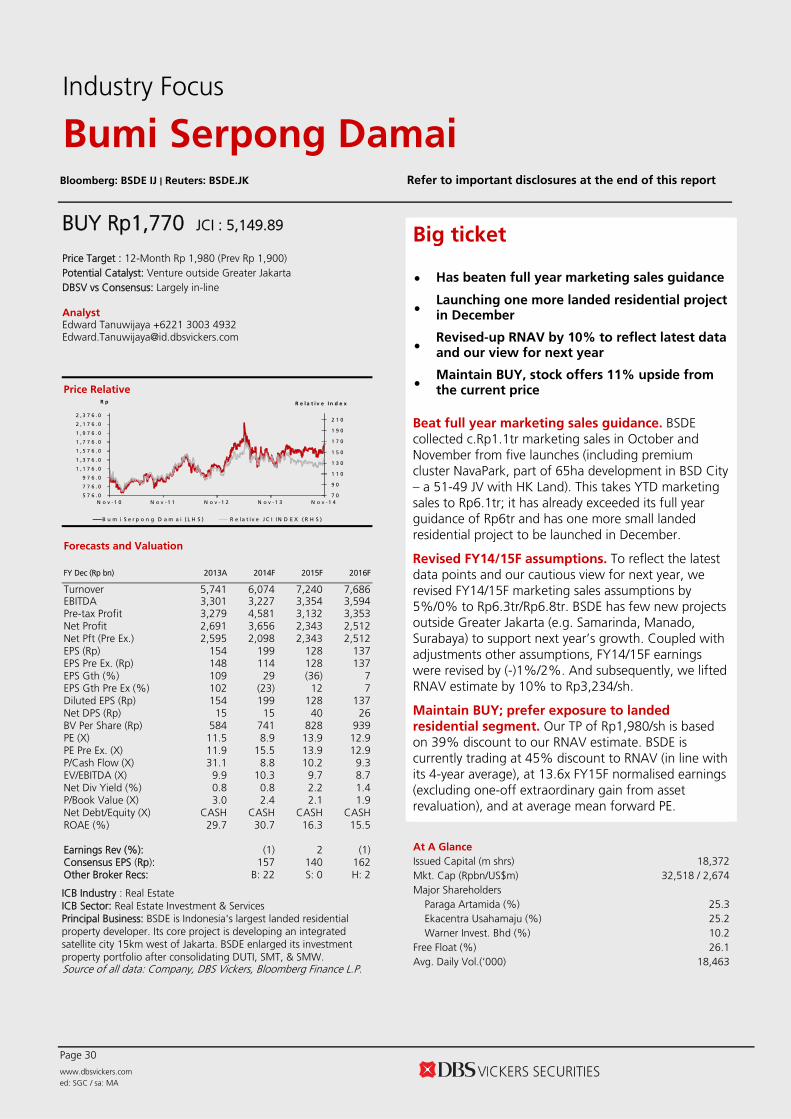
BUY Rp1,770 JCI : 5,149.89 Price Target : 12-Month Rp 1,980 (Prev Rp 1,900) Potential Catalyst: Venture outside Greater Jakarta DBSV vs Consensus: Largely in-line Analyst Edward Tanuwijaya +6221 3003 4932 [email protected]
Price Relative
7 0
9 0
1 1 0
1 3 0
1 5 0
1 7 0
1 9 0
2 1 0
5 7 6 . 0
7 7 6 . 0
9 7 6 . 0
1 , 1 7 6 . 0
1 , 3 7 6 . 0
1 , 5 7 6 . 0
1 , 7 7 6 . 0
1 , 9 7 6 . 0
2 , 1 7 6 . 0
2 , 3 7 6 . 0
N o v -1 0 N o v - 1 1 N o v - 1 2 N o v - 1 3 N o v - 1 4
R e l a t i v e I n d e xR p
B u m i S e r p o n g D a m a i ( L H S ) R e la t iv e J C I IN D E X ( R H S ) Forecasts and Valuation FY Dec (Rp bn) 2013A 2014F 2015F 2016F
Turnover 5,741 6,074 7,240 7,686 EBITDA 3,301 3,227 3,354 3,594 Pre-tax Profit 3,279 4,581 3,132 3,353 Net Profit 2,691 3,656 2,343 2,512 Net Pft (Pre Ex.) 2,595 2,098 2,343 2,512 EPS (Rp) 154 199 128 137 EPS Pre Ex. (Rp) 148 114 128 137 EPS Gth (%) 109 29 (36) 7 EPS Gth Pre Ex (%) 102 (23) 12 7 Diluted EPS (Rp) 154 199 128 137 Net DPS (Rp) 15 15 40 26 BV Per Share (Rp) 584 741 828 939 PE (X) 11.5 8.9 13.9 12.9 PE Pre Ex. (X) 11.9 15.5 13.9 12.9 P/Cash Flow (X) 31.1 8.8 10.2 9.3 EV/EBITDA (X) 9.9 10.3 9.7 8.7 Net Div Yield (%) 0.8 0.8 2.2 1.4 P/Book Value (X) 3.0 2.4 2.1 1.9 Net Debt/Equity (X) CASH CASH CASH CASH ROAE (%) 29.7 30.7 16.3 15.5 Earnings Rev (%): (1) 2 (1) Consensus EPS (Rp): 157 140 162 Other Broker Recs: B: 22 S: 0 H: 2 ICB Industry : Real Estate ICB Sector: Real Estate Investment & Services Principal Business: BSDE is Indonesia's largest landed residential property developer. Its core project is developing an integrated satellite city 15km west of Jakarta. BSDE enlarged its investment property portfolio after consolidating DUTI, SMT, & SMW. Source of all data: Company, DBS Vickers, Bloomberg Finance L.P.
At A Glance Issued Capital (m shrs) 18,372 Mkt. Cap (Rpbn/US$m) 32,518 / 2,674 Major Shareholders Paraga Artamida (%) 25.3 Ekacentra Usahamaju (%) 25.2 Warner Invest. Bhd (%) 10.2 Free Float (%) 26.1 Avg. Daily Vol.(‘000) 18,463
Industry Focus
Bumi Serpong Damai
Big ticket
Has beaten full year marketing sales guidance
Launching one more landed residential projectin December
Revised-up RNAV by 10% to reflect latest data and our view for next year
Maintain BUY, stock offers 11% upside from the current price
Beat full year marketing sales guidance. BSDE collected c.Rp1.1tr marketing sales in October and November from five launches (including premium cluster NavaPark, part of 65ha development in BSD City – a 51-49 JV with HK Land). This takes YTD marketing sales to Rp6.1tr; it has already exceeded its full year guidance of Rp6tr and has one more small landed residential project to be launched in December.
Revised FY14/15F assumptions. To reflect the latest data points and our cautious view for next year, we revised FY14/15F marketing sales assumptions by 5%/0% to Rp6.3tr/Rp6.8tr. BSDE has few new projects outside Greater Jakarta (e.g. Samarinda, Manado, Surabaya) to support next year’s growth. Coupled with adjustments other assumptions, FY14/15F earnings were revised by (-)1%/2%. And subsequently, we lifted RNAV estimate by 10% to Rp3,234/sh.
Maintain BUY; prefer exposure to landed residential segment. Our TP of Rp1,980/sh is based on 39% discount to our RNAV estimate. BSDE is currently trading at 45% discount to RNAV (in line with its 4-year average), at 13.6x FY15F normalised earnings (excluding one-off extraordinary gain from asset revaluation), and at average mean forward PE.
Bloomberg: CTRA IJ | Reuters: CTRA.JK Refer to important disclosures at the end of this report
FULLY VALUED Rp1,310 JCI : 5,149.89 (Downgrade from HOLD) Price Target : 12-Month Rp 1,125 (Prev Rp 1,150) Potential Catalyst: More JO projects DBSV vs Consensus: Lower Analyst Edward Tanuwijaya +6221 3003 4932 [email protected]
Price Relative
7 2
1 2 2
1 7 2
2 2 2
2 7 2
3 2 2
2 6 1 . 0
4 6 1 . 0
6 6 1 . 0
8 6 1 . 0
1 , 0 6 1 . 0
1 , 2 6 1 . 0
1 , 4 6 1 . 0
1 , 6 6 1 . 0
N o v -1 0 N o v - 1 1 N o v - 1 2 N o v - 1 3 N o v - 1 4
R e l a t i v e I n d e xR p
C ip u t r a D e v e lo p m e n t ( L H S ) R e la t iv e J C I IN D E X ( R H S ) Forecasts and Valuation FY Dec (Rp bn) 2013A 2014F 2015F 2016F
Turnover 5,077 7,109 8,340 9,492 EBITDA 1,698 2,438 2,884 3,196 Pre-tax Profit 1,709 2,114 2,552 2,861 Net Profit 977 1,167 1,420 1,585 Net Pft (Pre Ex.) 977 1,167 1,420 1,585 EPS (Rp) 64 77 94 105 EPS Pre Ex. (Rp) 64 77 94 105 EPS Gth (%) 66 19 22 12 EPS Gth Pre Ex (%) 66 19 22 12 Diluted EPS (Rp) 64 77 94 105 Net DPS (Rp) 12 19 23 28 BV Per Share (Rp) 419 477 548 624 PE (X) 20.3 17.0 14.0 12.5 PE Pre Ex. (X) 20.3 17.0 14.0 12.5 P/Cash Flow (X) nm 361.3 nm 188.7 EV/EBITDA (X) 13.3 9.4 7.9 6.9 Net Div Yield (%) 0.9 1.5 1.8 2.1 P/Book Value (X) 3.1 2.7 2.4 2.1 Net Debt/Equity (X) CASH CASH CASH CASH ROAE (%) 16.4 17.2 18.3 17.8 Earnings Rev (%): 2 (7) (9) Consensus EPS (Rp): 24 N/A N/A Other Broker Recs: B: 12 S: 1 H: 4 ICB Industry : Real Estate ICB Sector: Real Estate Investment & Services Principal Business: Large scale residential and commercial developer in 20 major cities throughout Indonesia, with most diversified product and consumer range. Established since 1981 and has listed subsidiaries in Ciputra Surya (CTRS) and Ciputra Property (CTRP)
Source of all data: Company, DBS Vickers, Bloomberg Finance L.P.
At A Glance Issued Capital (m shrs) 15,166 Mkt. Cap (Rpbn/US$m) 19,867 / 1,634 Major Shareholders Sang Pelopor (%) 30.6 Credit Suisse Singapore (%) 8.1 Free Float (%) 61.3 Avg. Daily Vol.(‘000) 17,995
Industry Focus
Ciputra Development
Picking up where it left off
FY14 pre-sales guidance still too high
Indicative 25% pre-sales growth in FY15
Cut FY15F earnings by 7% to reflect our cautious view
Downgrade to FULLY VALUED (after recent surge in share price)
Trimmed FY14 pre-sales guidance. October pre-sales of Rp717bn takes 10M14 pre-sales to Rp6.5tr (down 17% y-o-y), or 71% of its recently reduced FY14 guidance of Rp9.2tr. CTRA targets to net c.Rp2tr pre-sales in the last two months of the year, aided by new launches such as CitraGarden Puri Serang, CitraMaja Raya, CitraGarden City Malang and Ciputra International’s apartment tower. The launch of JO projects in Jakarta (i.e. Fatmawati and Kemayoran mixed-use) will be pushed to next year. CTRA is targeting about 15% pre-sales growth next year.
Revised FY14/15F assumptions . To reflect the latest data and our cautious view for next year, we revised down FY14/15F pre-sales assumptions by 4%/7% to Rp8.68tr/Rp8.77tr. This affected our RNAV estimate slightly to Rp1,620/sh, while FY14/15F earnings were revised by 2%/(-) 7%.
Downgrade to FULLY VALUED (after recent surge in share price). Our TP of Rp1,125/sh is based on 31% discount to our RNAV estimate. The stock price has surged 35% within two months. CTRA is currently trading at 19% discount to RNAV (narrower than its 4-year average of 36%) and at 14x FY15F earnings (average of mean forward PE).
Taman Dayu Pandaan - JO Pandaan Landed Residential 473 JO 473.07 4.9%
CitraLand Bagya City - JO Medan Landed Residential 163 JO 163.43 1.7%
CitraGrand Semarang - JO Semarang Landed Residential 132 JO 132.09 1.4%
Citraland Greenlake Surabaya - JO Surabaya Landed Residential 254 JO 254.12 2.6%
Other JO projects Landed Residential 344 JO 344.06 3.5%
Others (Golf, Club & Hotel and Waterpark) Surabaya Miscellaneous 153 99% 154.49 1.6% 9 730 Net Debt -800 RNAV 10,530 Fully Diluted Share base (m) 1.979 Fully Diluted RNAV per share 5,321 Ciputra Development (CTRA IJ) Development properties & Landbank
CitraRaya Tangerang Jakarta Landed Residential 4,149 100% 4,153 18.3% 696.2
CitraIndah Jonggol Jakarta Landed Residential 1,087 100% 1,087 4.8% 251.5
CitraGarden City Jakarta Jakarta Landed Residential 2,341 100% 2,343 10.3% 111.7
Bloomberg: LPKR IJ | Reuters: LPKR.JK Refer to important disclosures at the end of this report
HOLD Rp1,165 JCI : 5,149.89 Price Target : 12-Month Rp 1,180 (Prev Rp 1,120) Potential Catalyst: Faster timeline for new high-rise projects DBSV vs Consensus: Lower Analyst Edward Tanuwijaya +6221 3003 4932 [email protected]
Price Relative
7 9
9 9
1 1 9
1 3 9
1 5 9
1 7 9
1 9 9
2 1 9
4 6 8 . 0
6 6 8 . 0
8 6 8 . 0
1 , 0 6 8 . 0
1 , 2 6 8 . 0
1 , 4 6 8 . 0
1 , 6 6 8 . 0
1 , 8 6 8 . 0
N o v -1 0 N o v - 1 1 N o v - 1 2 N o v - 1 3 N o v - 1 4
R e l a t i v e I n d e xR p
L ip p o K a r a w a c i ( L H S ) R e la t iv e J C I IN D E X ( R H S ) Forecasts and Valuation FY Dec (Rp bn) 2013A 2014F 2015F 2016F
Turnover 6,666 11,794 9,761 11,399 EBITDA 1,826 3,308 2,342 2,488 Pre-tax Profit 1,925 3,497 2,325 2,346 Net Profit 1,228 2,437 1,327 1,262 Net Pft (Pre Ex.) 1,228 2,437 1,327 1,262 EPS (Rp) 53 106 57 55 EPS Pre Ex. (Rp) 53 106 57 55 EPS Gth (%) 16 98 (46) (5) EPS Gth Pre Ex (%) 16 98 (46) (5) Diluted EPS (Rp) 53 106 57 55 Net DPS (Rp) 12 14 26 14 BV Per Share (Rp) 379 470 501 542 PE (X) 21.9 11.0 20.3 21.3 PE Pre Ex. (X) 21.9 11.0 20.3 21.3 P/Cash Flow (X) nm 48.6 nm nm EV/EBITDA (X) 21.0 10.2 15.6 14.6 Net Div Yield (%) 1.0 1.2 2.3 1.2 P/Book Value (X) 3.1 2.5 2.3 2.2 Net Debt/Equity (X) 0.4 0.1 0.2 0.1 ROAE (%) 16.0 24.9 11.8 10.5 Earnings Rev (%): 97 (6) (13) Consensus EPS (Rp): 75 70 80 Other Broker Recs: B: 10 S: 3 H: 6 ICB Industry : Real Estate ICB Sector: Real Estate Investment & Services Principal Business: LPKR's five business: township, healthcare, retail mall, hospitality and portfolio management. It has listed subsidiary in Lippo Cikarang (LPCK), Gowa Makassar Tourism Development (GMTD) and stakes in First REIT & LMIRT (both listed in Singapore)
Source of all data: Company, DBS Vickers, Bloomberg Finance L.P.
At A Glance Issued Capital (m shrs) 23,078 Mkt. Cap (Rpbn/US$m) 26,886 / 2,211 Major Shareholders Pacific Asia Holdings (%) 17.9 Free Float (%) 82.1 Avg. Daily Vol.(‘000) 91,734
Industry Focus
Lippo Karawaci
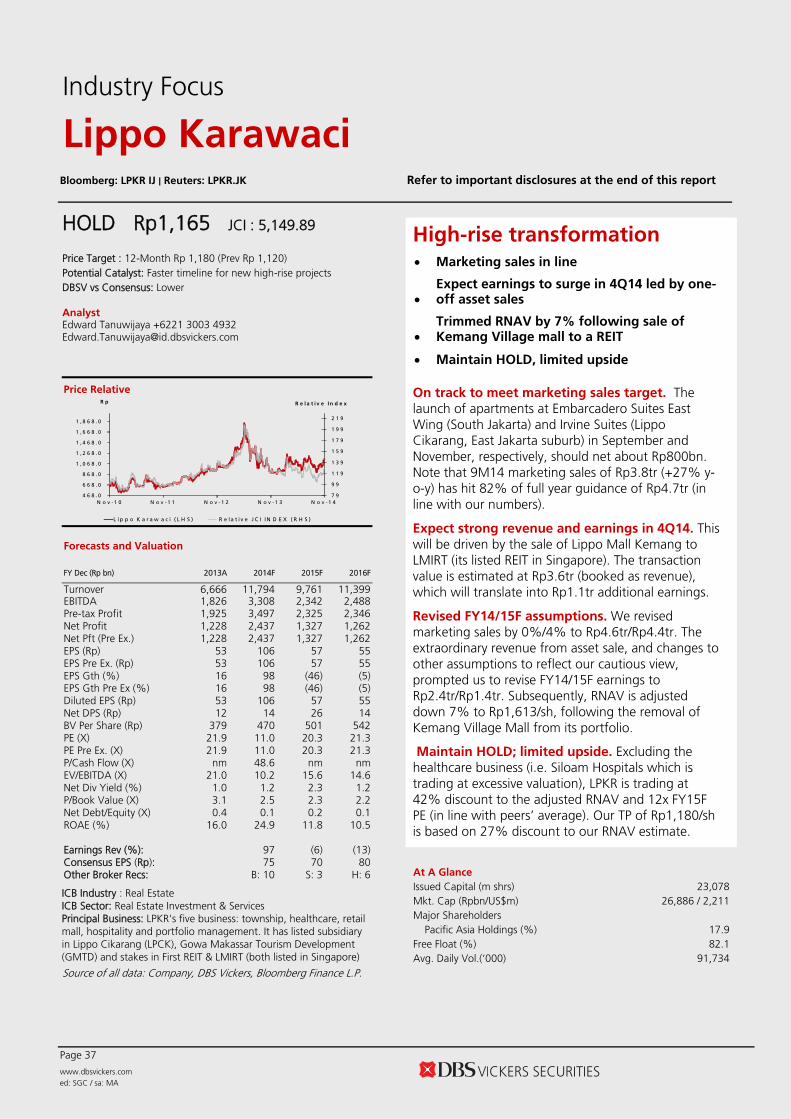
High-rise transformation Marketing sales in line
Expect earnings to surge in 4Q14 led by one-off asset sales
Trimmed RNAV by 7% following sale of Kemang Village mall to a REIT
Maintain HOLD, limited upside
On track to meet marketing sales target. The launch of apartments at Embarcadero Suites East Wing (South Jakarta) and Irvine Suites (Lippo Cikarang, East Jakarta suburb) in September and November, respectively, should net about Rp800bn. Note that 9M14 marketing sales of Rp3.8tr (+27% y-o-y) has hit 82% of full year guidance of Rp4.7tr (in line with our numbers).
Expect strong revenue and earnings in 4Q14. This will be driven by the sale of Lippo Mall Kemang to LMIRT (its listed REIT in Singapore). The transaction value is estimated at Rp3.6tr (booked as revenue), which will translate into Rp1.1tr additional earnings.
Revised FY14/15F assumptions. We revised marketing sales by 0%/4% to Rp4.6tr/Rp4.4tr. The extraordinary revenue from asset sale, and changes to other assumptions to reflect our cautious view, prompted us to revise FY14/15F earnings to Rp2.4tr/Rp1.4tr. Subsequently, RNAV is adjusted down 7% to Rp1,613/sh, following the removal of Kemang Village Mall from its portfolio.
Maintain HOLD; limited upside. Excluding the healthcare business (i.e. Siloam Hospitals which is trading at excessive valuation), LPKR is trading at 42% discount to the adjusted RNAV and 12x FY15F PE (in line with peers’ average). Our TP of Rp1,180/sh is based on 27% discount to our RNAV estimate.
Bloomberg: PWON IJ | Reuters: PWON.JK Refer to important disclosures at the end of this report
HOLD Rp515 JCI : 5,149.89 (Downgrade from BUY) Price Target : 12-Month Rp 530 (Prev Rp 475) Potential Catalyst: TB Simatupang project launch DBSV vs Consensus: Higher Analyst Edward Tanuwijaya +6221 3003 4932 [email protected]
Price Relative
6 7
8 7
1 0 7
1 2 7
1 4 7
1 6 7
1 8 7
2 0 7
1 5 5 . 7
2 0 5 . 7
2 5 5 . 7
3 0 5 . 7
3 5 5 . 7
4 0 5 . 7
4 5 5 . 7
5 0 5 . 7
5 5 5 . 7
N o v -1 0 N o v - 1 1 N o v - 1 2 N o v - 1 3 N o v - 1 4
R e l a t i v e I n d e xR p
P a k u w o n J a t i ( L H S ) R e la t iv e J C I IN D E X ( R H S ) Forecasts and Valuation FY Dec (Rp bn) 2013A 2014F 2015F 2016F
Turnover 3,030 4,166 5,476 6,587 EBITDA 1,700 2,282 3,024 3,648 Pre-tax Profit 1,331 2,078 2,461 3,137 Net Profit 1,133 1,778 2,047 2,666 Net Pft (Pre Ex.) 1,133 1,679 2,047 2,666 EPS (Rp) 24 37 39 50 EPS Pre Ex. (Rp) 24 35 39 50 EPS Gth (%) 51 57 5 30 EPS Gth Pre Ex (%) 51 48 11 30 Diluted EPS (Rp) 24 37 39 50 Net DPS (Rp) 4 5 7 8 BV Per Share (Rp) 80 113 135 177 PE (X) 21.9 13.9 13.3 10.2 PE Pre Ex. (X) 21.9 14.8 13.3 10.2 P/Cash Flow (X) 20.3 13.3 12.1 9.4 EV/EBITDA (X) 14.7 12.6 10.0 7.6 Net Div Yield (%) 0.7 0.9 1.3 1.5 P/Book Value (X) 6.4 4.6 3.8 2.9 Net Debt/Equity (X) CASH 0.7 0.4 0.0 ROAE (%) 33.4 38.2 32.6 32.3 Earnings Rev (%): 3 (3) (1) Consensus EPS (Rp): 40 41 52 Other Broker Recs: B: 9 S: 1 H: 2 ICB Industry : Real Estate ICB Sector: Real Estate Investment & Services Principal Business: Mixed-use property and residential township developer with assets in Jakarta and Surabaya. PWON has balanced portfolio with a large share of recurring revenues from retail malls
Source of all data: Company, DBS Vickers, Bloomberg Finance L.P.
At A Glance Issued Capital (m shrs) 48,160 Mkt. Cap (Rpbn/US$m) 24,802 / 2,039 Major Shareholders Pakuwon family (%) 52.0 Free Float (%) 20.8 Avg. Daily Vol.(‘000) 70,630
Industry Focus
Pakuwon Jati
Keeping an even keel
YTD marketing sales within expectation
Expect recently acquired Pakuwon Permai (PP)’s projects to lift marketing sales and recurring revenues
Downgrade to HOLD as recent rally has reduced upside
Marketing sales at 85% of full year target. Indicative 10M14 marketing sales of Rp2.56tr, reached 85% of full year guidance (Rp3tr). Apartment units were the main contributor at Rp1.76tr (69% of total sales), followed by landed houses Rp768bn (30%), and office space Rp32bn (1%). The remaining marketing sales will come from new township Grand Pakuwon (in West Jakarta suburb) and Kota Kasablanka apartments. Boost from new superblock. We forecast an extra Rp396bn marketing sales in FY15F from newly acquired superblock Pakuwon Indah apartments. In addition to marketing sales, PP’s existing investment properties will add Rp555.3bn (about 10% of total FY15F revenue), implying 31% CAGR in recurring revenue over 2013-2015. Downgrade to HOLD following recent rally. We nudged up our RNAV estimate by 1% to Rp600/sh. Our TP of Rp530/sh is based on 12% discount to RNAV. We remain positive on PWON as it registers the largest share of revenue from retail mall operations among property developers. However, the stock has risen 25% since our last report “More superblock!” dated 15 Oct 2014, and upside has been reduced significantly.
Bloomberg: SMRA IJ | Reuters: SMRA.JK Refer to important disclosures at the end of this report
BUY Rp1,460 JCI : 5,149.89 Price Target : 12-Month Rp 1,780 (Prev Rp 1,520) Potential Catalyst: Spinning-off investment properties DBSV vs Consensus: Higher Analyst Edward Tanuwijaya +6221 3003 4932 [email protected]
Price Relative
7 1
9 1
1 1 1
1 3 1
1 5 1
1 7 1
1 9 1
2 1 1
3 8 2 . 5
5 8 2 . 5
7 8 2 . 5
9 8 2 . 5
1 , 1 8 2 . 5
1 , 3 8 2 . 5
1 , 5 8 2 . 5
N o v -1 0 N o v - 1 1 N o v - 1 2 N o v - 1 3 N o v - 1 4
R e l a t i v e I n d e xR p
S u m m a r e c o n A g u n g ( L H S ) R e la t iv e J C I IN D E X ( R H S ) Forecasts and Valuation FY Dec (Rp bn) 2013A 2014F 2015F 2016F
Turnover 4,094 4,719 5,863 6,425 EBITDA 1,497 1,810 2,080 2,266 Pre-tax Profit 1,319 1,484 1,747 2,002 Net Profit 1,102 1,237 1,440 1,667 Net Pft (Pre Ex.) 1,102 1,237 1,440 1,667 EPS (Rp) 76 86 100 116 EPS Pre Ex. (Rp) 76 86 100 116 EPS Gth (%) (34) 12 16 16 EPS Gth Pre Ex (%) (34) 12 16 16 Diluted EPS (Rp) 76 86 100 116 Net DPS (Rp) 21 23 30 35 BV Per Share (Rp) 307 370 439 520 PE (X) 19.1 17.0 14.6 12.6 PE Pre Ex. (X) 19.1 17.0 14.6 12.6 P/Cash Flow (X) 36.2 13.6 11.5 9.4 EV/EBITDA (X) 14.2 11.5 9.2 7.8 Net Div Yield (%) 1.5 1.6 2.1 2.4 P/Book Value (X) 4.8 3.9 3.3 2.8 Net Debt/Equity (X) CASH CASH CASH CASH ROAE (%) 27.3 25.3 24.7 24.1 Earnings Rev (%): 4 5 4 Consensus EPS (Rp): 81 91 107 Other Broker Recs: B: 22 S: 0 H: 3 ICB Industry : Real Estate ICB Sector: Real Estate Principal Business: SMRA is one of Indonesia most established property developer. It has three existing township developments and several investment properties in its portfolio which generates sizeable recurring income, c.30% of revenues.
Source of all data: Company, DBS Vickers, Bloomberg Finance L.P.
At A Glance Issued Capital (m shrs) 14,427 Mkt. Cap (Rpbn/US$m) 21,063 / 1,732 Major Shareholders Semarop Agung (%) 26.2 Sinarmegah Jaya (%) 8.6 Free Float (%) 65.2 Avg. Daily Vol.(‘000) 22,484
Industry Focus
Summarecon Agung
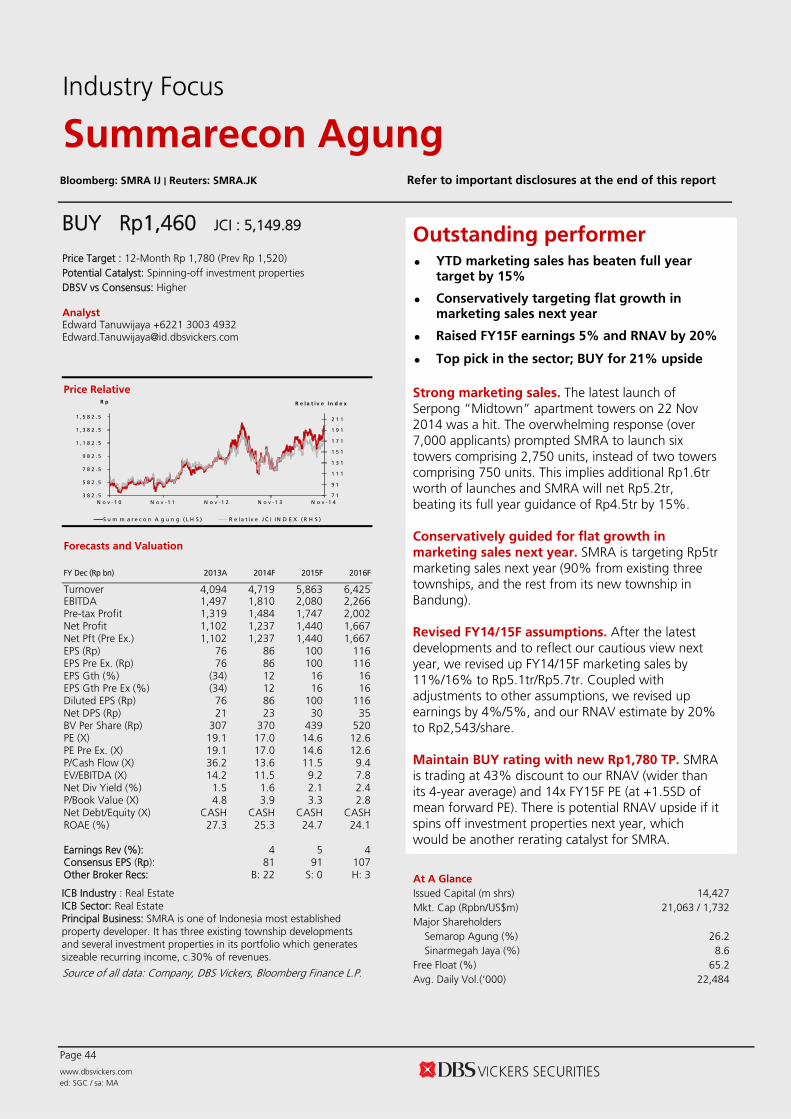
Outstanding performer YTD marketing sales has beaten full year
target by 15%
Conservatively targeting flat growth in marketing sales next year
Raised FY15F earnings 5% and RNAV by 20%
Top pick in the sector; BUY for 21% upside
Strong marketing sales. The latest launch of Serpong “Midtown” apartment towers on 22 Nov 2014 was a hit. The overwhelming response (over 7,000 applicants) prompted SMRA to launch six towers comprising 2,750 units, instead of two towers comprising 750 units. This implies additional Rp1.6tr worth of launches and SMRA will net Rp5.2tr, beating its full year guidance of Rp4.5tr by 15%. Conservatively guided for flat growth in marketing sales next year. SMRA is targeting Rp5tr marketing sales next year (90% from existing three townships, and the rest from its new township in Bandung). Revised FY14/15F assumptions. After the latest developments and to reflect our cautious view next year, we revised up FY14/15F marketing sales by 11%/16% to Rp5.1tr/Rp5.7tr. Coupled with adjustments to other assumptions, we revised up earnings by 4%/5%, and our RNAV estimate by 20% to Rp2,543/share. Maintain BUY rating with new Rp1,780 TP. SMRA is trading at 43% discount to our RNAV (wider than its 4-year average) and 14x FY15F PE (at +1.5SD of mean forward PE). There is potential RNAV upside if it spins off investment properties next year, which would be another rerating catalyst for SMRA.
DBSV recommendations are based an Absolute Total Return* Rating system, defined as follows:
STRONG BUY (>20% total return over the next 3 months, with identifiable share price catalysts within this time frame)
BUY (>15% total return over the next 12 months for small caps, >10% for large caps)
HOLD (-10% to +15% total return over the next 12 months for small caps, -10% to +10% for large caps)
FULLY VALUED (negative total return i.e. > -10% over the next 12 months)
SELL (negative total return of > -20% over the next 3 months, with identifiable catalysts within this time frame)
* Share price appreciation + dividends
GENERAL DISCLOSURE/DISCLAIMER This report is prepared by PT. DBS Vickers Securities Indonesia ("DBSVI"), a direct wholly-owned subsidiary of DBS Vickers Securities Holdings Pte Ltd ("DBSVH"). This report is intended for clients of DBSV Group only and no part of this document may be (i) copied, photocopied or duplicated in any form or by any means or (ii) redistributed without the prior written consent of DBSVI.
The research set out in this report is based on information obtained from sources believed to be reliable, but we (which collectively refers to DBSVI and/or DBSVH) do not make any representation or warranty as to its accuracy, completeness or correctness. Opinions expressed are subject to change without notice. This document is prepared for general circulation. Any recommendation contained in this document does not have regard to the specific investment objectives, financial situation and the particular needs of any specific addressee. This document is for the information of addressees only and is not to be taken in substitution for the exercise of judgment by addressees, who should obtain separate independent legal or financial advice. DBSVI accepts no liability whatsoever for any direct, indirect and/or consequential loss (including any claims for loss of profit) arising from any use of and/or reliance upon this document and/or further communication given in relation to this document. This document is not to be construed as an offer or a solicitation of an offer to buy or sell any securities. DBSVH is a wholly-owned subsidiary of DBS Bank Ltd. DBS Bank Ltd along with its affiliates and/or persons associated with any of them may from time to time have interests in the securities mentioned in this document. DBSVI, DBS Bank Ltd and their associates, their directors, and/or employees may have positions in, and may effect transactions in securities mentioned herein and may also perform or seek to perform broking, investment banking and other banking services for these companies. Any valuations, opinions, estimates, forecasts, ratings or risk assessments herein constitutes a judgment as of the date of this report, and there can be no assurance that future results or events will be consistent with any such valuations, opinions, estimates, forecasts, ratings or risk assessments. The information in this document is subject to change without notice, its accuracy is not guaranteed, it may be incomplete or condensed and it may not contain all material information concerning the company (or companies) referred to in this report. The valuations, opinions, estimates, forecasts, ratings or risk assessments described in this report were based upon a number of estimates and assumptions and are inherently subject to significant uncertainties and contingencies. It can be expected that one or more of the estimates on which the valuations, opinions, estimates, forecasts, ratings or risk assessments were based will not materialize or will vary significantly from actual results. Therefore, the inclusion of the valuations, opinions, estimates, forecasts, ratings or risk assessments described herein IS NOT TO BE RELIED UPON as a representation and/or warranty by DBSVI and/or DBSVH (and/or any persons associated with the aforesaid entities), that: (a) such valuations, opinions, estimates, forecasts, ratings or risk assessments or their underlying assumptions will be achieved, and (b) there is any assurance that future results or events will be consistent with any such valuations, opinions, estimates, forecasts, ratings or risk assessments stated therein. Any assumptions made in this report that refers to commodities, are for the purposes of making forecasts for the company (or companies) mentioned herein. They are not to be construed as recommendations to trade in the physical commodity or in the futures contract relating to the commodity referred to in this report. DBS Vickers Securities (USA) Inc ("DBSVUSA")"), a U.S.-registered broker-dealer, does not have its own investment banking or research department, nor has it participated in any investment banking transaction as a manager or co-manager in the past twelve months. ANALYST CERTIFICATION The research analyst primarily responsible for the content of this research report, in part or in whole, certifies that the views about the companies and their securities expressed in this report accurately reflect his/her personal views. The analyst also certifies that no part of his/her compensation was, is, or will be, directly, or indirectly, related to specific recommendations or views expressed in this report. As of the date the report is published, the analyst and his / her spouse and/or relatives who are financially dependent on the analyst, do not hold interests in the securities recommended in this report (“interest” includes direct or indirect ownership of securities, directorships and trustee positions).
COMPANY-SPECIFIC / REGULATORY DISCLOSURES
1. PT. DBS Vickers Securities Indonesia ("DBSVI") do not have a proprietary position in the mentioned company recommended in this report as of 1 December 2014.
2. DBSVI, DBSVS, DBS Bank Ltd and/or other affiliates of DBS Vickers Securities (USA) Inc ("DBSVUSA"), a U.S.-registered broker-dealer, may beneficially own a total of 1% or more of any class of common equity securities of as of 1 December 2014.
3. Compensation for investment banking services:
Industry Focus
Indonesia Property Sector
Page 48
DBSVI, DBSVS, DBS Bank Ltd and/or other affiliates of DBSVUSA may have received compensation, within the past 12 months, and within the next 3 months may receive or intends to seek compensation for investment banking services from the subject companies. DBSVUSA does not have its own investment banking or research department, nor has it participated in any investment banking transaction as a manager or co-manager in the past twelve months. Any US persons wishing to obtain further information, including any clarification on disclosures in this disclaimer, or to effect a transaction in any security discussed in this document should contact DBSVUSA exclusively.
RESTRICTIONS ON DISTRIBUTION General This report is not directed to, or intended for distribution to or use by, any person or entity who is a citizen or resident of or
located in any locality, state, country or other jurisdiction where such distribution, publication, availability or use would be contrary to law or regulation.
Australia This report is not for distribution into Australia.
Hong Kong This report is being distributed in Hong Kong by DBS Vickers (Hong Kong) Limited which is licensed and regulated by the Hong Kong Securities and Futures Commission.
Indonesia This report is being distributed in Indonesia by PT DBS Vickers Securities Indonesia.
Malaysia This report is distributed in Malaysia by AllianceDBS Research Sdn Bhd ("ADBSR") (formerly known as HwangDBS Vickers Research Sdn Bhd). Recipients of this report, received from ADBSR are to contact the undersigned at 603-2604 3333 in respect of any matters arising from or in connection with this report. In addition to the General Disclosure/Disclaimer found at the preceding page, recipients of this report are advised that ADBSR (the preparer of this report), its holding company Alliance Investment Bank Berhad, their respective connected and associated corporations, affiliates, their directors, officers, employees, agents and parties related or associated with any of them may have positions in, and may effect transactions in the securities mentioned herein and may also perform or seek to perform broking, investment banking/corporate advisory and other services for the subject companies. They may also have received compensation and/or seek to obtain compensation for broking, investment banking/corporate advisory and other services from the subject companies.
Wong Ming Tek, Executive Director, ADBSR
Singapore This report is distributed in Singapore by DBS Bank Ltd (Company Regn. No. 196800306E) or DBSVS (Company Regn No. 198600294G), both of which are Exempt Financial Advisers as defined in the Financial Advisers Act and regulated by the Monetary Authority of Singapore. DBS Bank Ltd and/or DBSVS, may distribute reports produced by its respective foreign entities, affiliates or other foreign research houses pursuant to an arrangement under Regulation 32C of the Financial Advisers Regulations. Where the report is distributed in Singapore to a person who is not an Accredited Investor, Expert Investor or an Institutional Investor, DBS Bank Ltd accepts legal responsibility for the contents of the report to such persons only to the extent required by law. Singapore recipients should contact DBS Bank Ltd at 6327 2288 for matters arising from, or in connection with the report.
Thailand This report is being distributed in Thailand by DBS Vickers Securities (Thailand) Co Ltd. Research reports distributed are only intended for institutional clients only and no other person may act upon it.
United Kingdom
This report is being distributed in the UK by DBS Vickers Securities (UK) Ltd, who is an authorised person in the meaning of the Financial Services and Markets Act and is regulated by The Financial Conduct Authority. Research distributed in the UK is intended only for institutional clients.
Dubai
This research report is being distributed in The Dubai International Financial Centre (“DIFC”) by DBS Bank Ltd., (DIFC Branch) having its office at PO Box 506538, 3rd Floor, Building 3, East Wing, Gate Precinct, Dubai International Financial Centre (DIFC), Dubai, United Arab Emirates. DBS Bank Ltd., (DIFC Branch) is regulated by The Dubai Financial Services Authority. This research report is intended only for professional clients (as defined in the DFSA rulebook) and no other person may act upon it.
United States Neither this report nor any copy hereof may be taken or distributed into the United States or to any U.S. person except in compliance with any applicable U.S. laws and regulations. It is being distributed in the United States by DBSVUSA, which accepts responsibility for its contents. Any U.S. person receiving this report who wishes to effect transactions in any securities referred to herein should contact DBSVUSA directly and not its affiliate.
Other jurisdictions
In any other jurisdictions, except if otherwise restricted by laws or regulations, this report is intended only for qualified, professional, institutional or sophisticated investors as defined in the laws and regulations of such jurisdictions.
PT. DBS Vickers Securities Indonesia
DBS Bank Tower, Ciputra World 1, 32/F Jl. Prof. Dr. Satrio Kav. 3-5, Jakarta 10350, Indonesia
Tel. 6221-3003 4900, Fax: 6221-3003 4943
Industry Focus
Indonesia Property Sector
Page 49
Asian Equities Sales, Sales Trading and Research Contacts
Sales Heads Tel: Email: Singapore Kenneth Tang 65-6398 6951 [email protected] Hong Kong Andrew Au 852-2820 4992 [email protected] London Graham Booth 44-20-7618 1881 [email protected] New York Elaine Yu 1-212-826 3553 [email protected] Thailand Narisara Viseskosin 662 657 7759 [email protected] Sales Trading Contacts Tel: Email: Singapore Loh Chong Jin 65-6398 6927 [email protected] Hong Kong Franco Law 852-2971 1828 [email protected] London Charles Davies 44 20 7618 1883 [email protected] New York Brenda Wong 1 212 826 3558 [email protected] Research Contacts Tel: Email: Regional Timothy Wong 65-6682 3691 [email protected] Singapore Janice Chua 65-6682 3692 [email protected] Hong Kong Carol Wu 852-2863 8841 [email protected] Malaysia Wong Ming Tek 603-2711 0956 [email protected] Thailand Chanpen Sirithanarattanakul 662-657 7824 [email protected] Indonesia Maynard Priajaya Arif 6221-3003 4930 [email protected] DBS Vickers Securities – Regional Offices HONG KONG MALAYSIA SINGAPORE DBS Vickers (Hong Kong) Ltd Hwang-DBS Vickers Research Sdn Bhd DBS Vickers Securities (Singapore) Pte Ltd 18th Floor Man Yee Building Suite 26.03, 26Floor Menara Keck Seng 2 Marina Boulevard 68 Des Voeux Road Central 203 Jalan Bukit Bintang Level 40, Marina Bay Financial Central Tower 3 Central, Hong Kong 55100 Kuala Lumpur Singapore 018982 Tel: 852-2820 4888 Tel: 60-3-2711 2222 Tel: 65-6327 2288 Fax: 852-2868 1523 Fax: 60-3-2711 2333 Participant of the Stock Exchange of Hong Kong INDONESIA THAILAND PT DBS Vickers Securities (Indonesia) DBS Vickers Securities (Thailand) Co Ltd DBS Bank Tower 15th Floor Siam Tower Ciputra World 1, 32/F 989 Rama 1 Road Jl. Prof. Dr. Satrio Kav. 3-5 Pathumwan, Bangkok 10330 Jakarta 12940, Indonesia Tel: 66-2-658 1222 Phone: 62 21 3003 4900 Fax: 66-2-658 1269 UNITED STATES UNITED KINGDOM DBS Vickers Securities (USA) Inc DBS Vickers Securities (UK) Ltd 777 Third Avenue 4th Floor Paternoster House Suite 26A 65 St Paul's Churchyard New York, New York 10017 London EC4M 8AB United Kingdom Tel: 1-212-826 1888 Tel: 44-20-7618 1888 Fax: 1-212-826 8704 Fax: 44-20-7618 1900 Member of FINRA and SIPC Regulated by The Financial Services Authority