30
Indonesia’s Leading and Preferred Petrochemical Company PT Chandra Asri Petrochemical Tbk Company Presentation CGS-CIMB 13th Annual Indonesia Conference Bali, 28 June 2019
Indonesia’s Leading and Preferred Petrochemical Company
PT Chandra Asri Petrochemical TbkCompany Presentation
CGS-CIMB 13th Annual Indonesia Conference Bali, 28 June 2019

IMPORTANT NOTICE: This document contains forward-looking statements concerning thefinancial condition, results of operations and business of PT Chandra Asri Petrochemical Tbk. Allstatements other than statements of historical fact are, or may be deemed to be, forward-lookingstatements. Forward-looking statements are statements of future expectations that are based onmanagement’s current expectations and assumptions and involve known and unknown risks anduncertainties that could cause actual results, performance or events to differ materially fromthose expressed or implied in these statements. All forward-looking statements contained in thisdocument are expressly qualified in their entirety. Readers should not place undue reliance onforward-looking statements. Neither PT Chandra Asri Petrochemical Tbk nor any of itssubsidiaries undertake any obligation to publicly update or revise any forward-looking statementas a result of new information, future events or other information. In light of these risks, resultscould differ materially from those stated, implied or inferred from the forward looking statementscontained in this document.
2
Disclaimer
01
Company Overview
02
Business Performance
03
Strategic Priorities
2019Outlook
Contents
3
Indonesia’s Leading & Preferred Petrochemical Company
CompanyOverview1
4
5
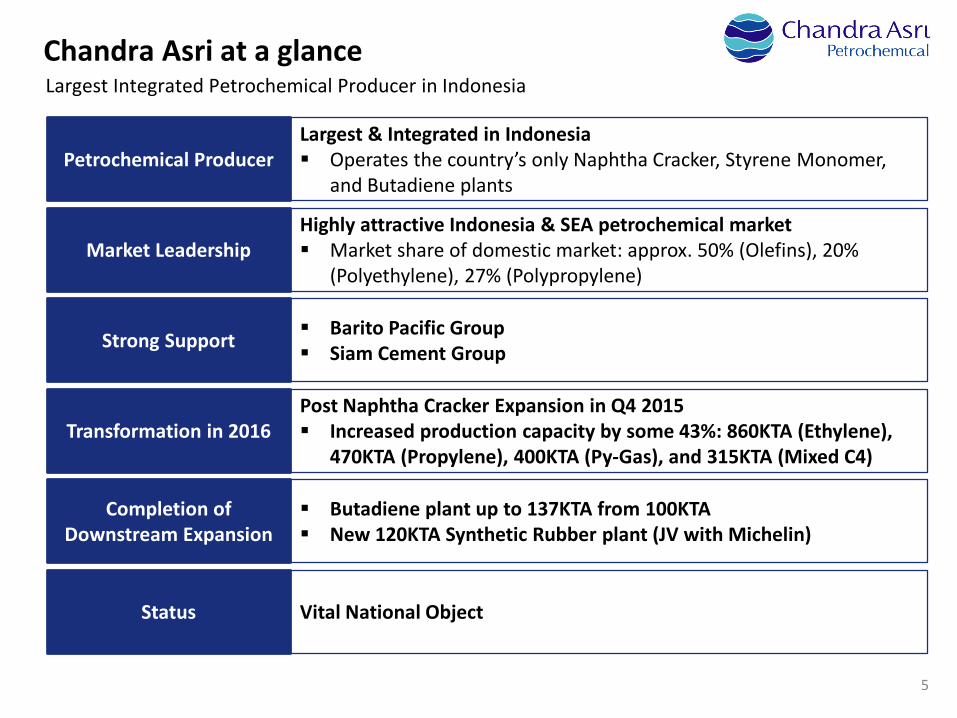
Petrochemical ProducerLargest & Integrated in Indonesia Operates the country’s only Naphtha Cracker, Styrene Monomer,
and Butadiene plants
Market LeadershipHighly attractive Indonesia & SEA petrochemical market Market share of domestic market: approx. 50% (Olefins), 20%
(Polyethylene), 27% (Polypropylene)
Strong Support Barito Pacific Group Siam Cement Group
Transformation in 2016Post Naphtha Cracker Expansion in Q4 2015 Increased production capacity by some 43%: 860KTA (Ethylene),
470KTA (Propylene), 400KTA (Py-Gas), and 315KTA (Mixed C4)
Completion of Downstream Expansion
Butadiene plant up to 137KTA from 100KTA New 120KTA Synthetic Rubber plant (JV with Michelin)
Status Vital National Object
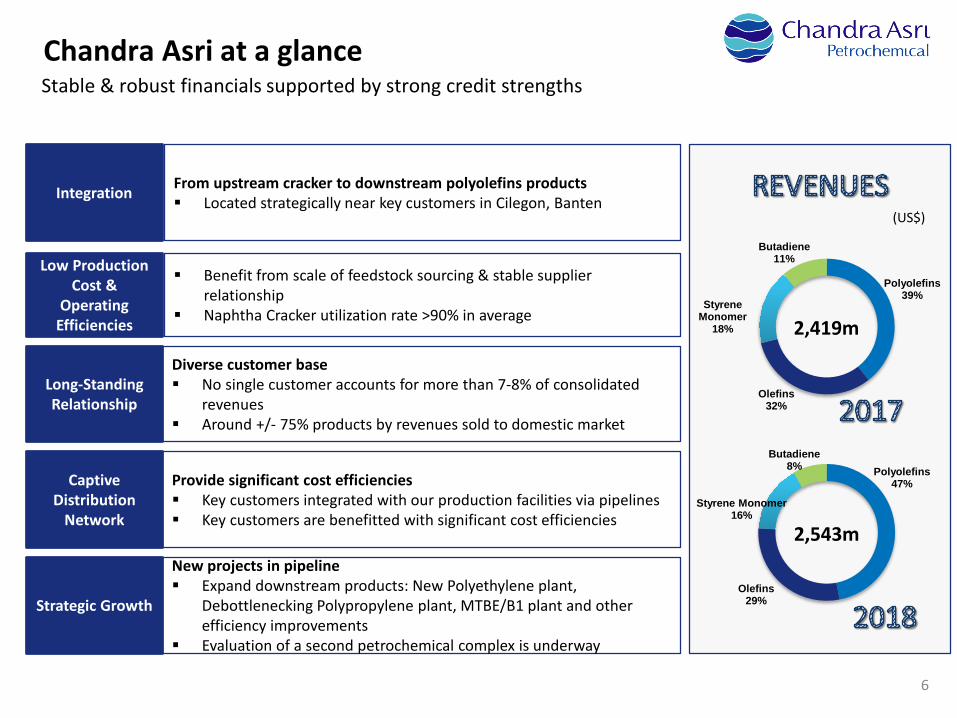
Chandra Asri at a glanceLargest Integrated Petrochemical Producer in Indonesia
6
Integration From upstream cracker to downstream polyolefins products Located strategically near key customers in Cilegon, Banten
Low Production Cost &
Operating Efficiencies
Benefit from scale of feedstock sourcing & stable supplier relationship
Naphtha Cracker utilization rate >90% in average
Long-Standing Relationship
Diverse customer base No single customer accounts for more than 7-8% of consolidated
revenues Around +/- 75% products by revenues sold to domestic market
Captive Distribution
Network
Provide significant cost efficiencies Key customers integrated with our production facilities via pipelines Key customers are benefitted with significant cost efficiencies
Strategic Growth
New projects in pipeline Expand downstream products: New Polyethylene plant,
Debottlenecking Polypropylene plant, MTBE/B1 plant and other efficiency improvements
Evaluation of a second petrochemical complex is underway
Stable & robust financials supported by strong credit strengths
Polyolefins39%
Olefins32%
Styrene Monomer
18%
Butadiene11%
2,419m
Polyolefins47%
Olefins29%
Styrene Monomer16%
Butadiene8%
2,543m
Chandra Asri at a glance
(US$)
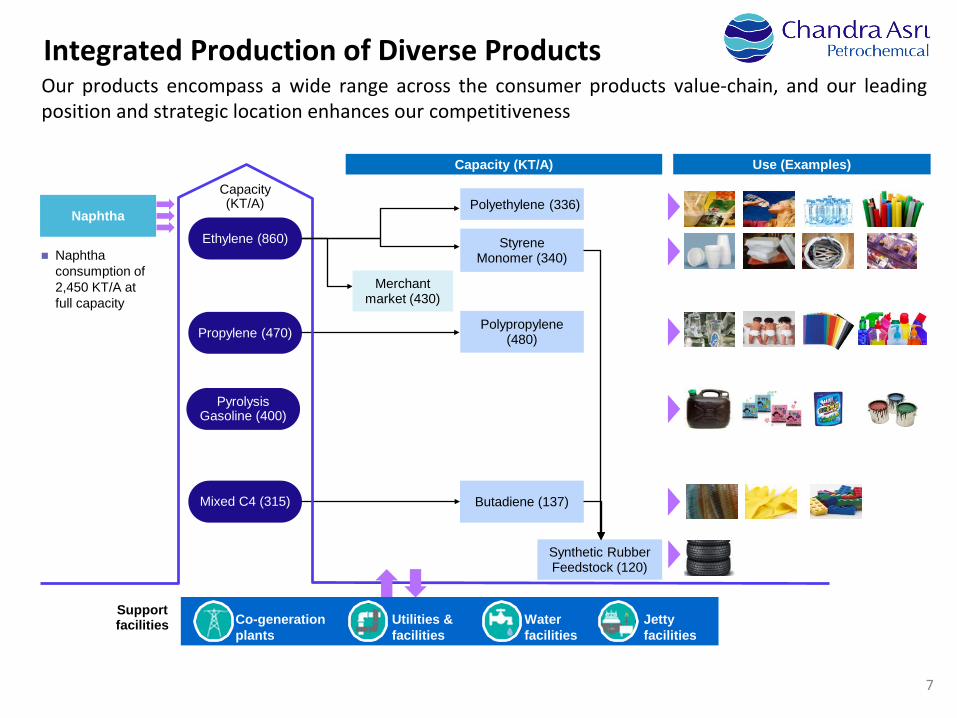
Integrated Production of Diverse Products
Ethylene (860)
Propylene (470)
PyrolysisGasoline (400)
Mixed C4 (315)
Polypropylene (480)
Capacity (KT/A) Use (Examples)
Naphtha consumption of 2,450 KT/A at full capacity
Polyethylene (336)
Styrene Monomer (340)
Naphtha
Co-generation plants
Utilities & facilities
Water facilities
Jetty facilities
Support facilities
Butadiene (137)
(KT/A)
Merchant market (430)
Capacity
Synthetic Rubber Feedstock (120)
7
Our products encompass a wide range across the consumer products value-chain, and our leadingposition and strategic location enhances our competitiveness
8
CapacityPolytama Others Total
('000 tons per year)
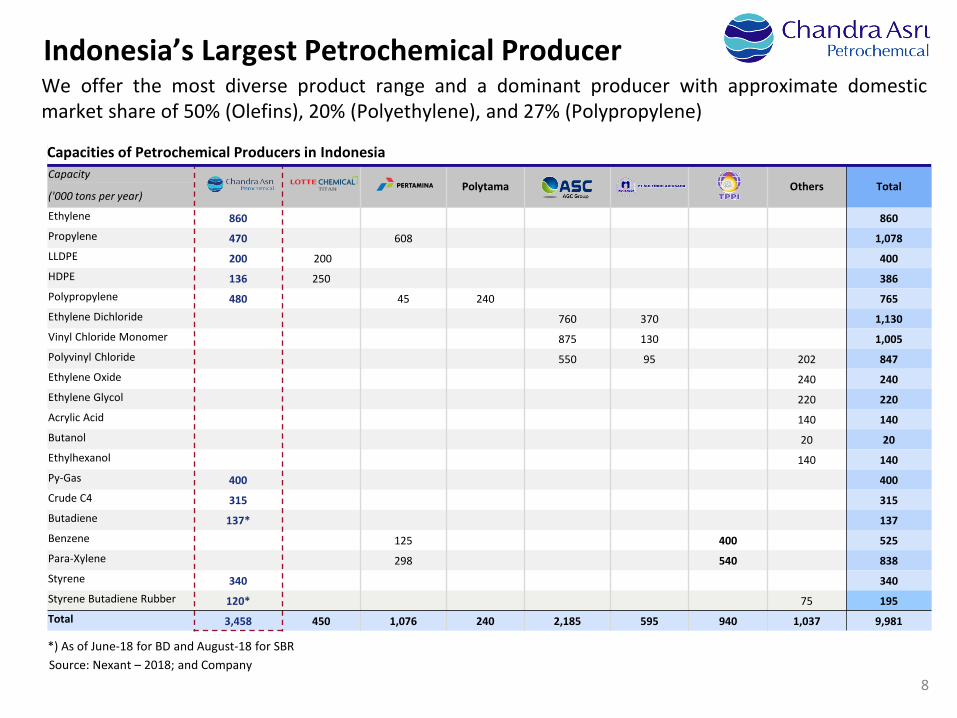
Ethylene 860 860Propylene 470 608 1,078LLDPE 200 200 400HDPE 136 250 386Polypropylene 480 45 240 765Ethylene Dichloride 760 370 1,130Vinyl Chloride Monomer 875 130 1,005Polyvinyl Chloride 550 95 202 847Ethylene Oxide 240 240Ethylene Glycol 220 220Acrylic Acid 140 140Butanol 20 20Ethylhexanol 140 140Py-Gas 400 400Crude C4 315 315Butadiene 137* 137Benzene 125 400 525Para-Xylene 298 540 838Styrene 340 340Styrene Butadiene Rubber 120* 75 195Total 3,458 450 1,076 240 2,185 595 940 1,037 9,981
Indonesia’s Largest Petrochemical Producer
Capacities of Petrochemical Producers in Indonesia
*) As of June-18 for BD and August-18 for SBRSource: Nexant – 2018; and Company
We offer the most diverse product range and a dominant producer with approximate domesticmarket share of 50% (Olefins), 20% (Polyethylene), and 27% (Polypropylene)
9
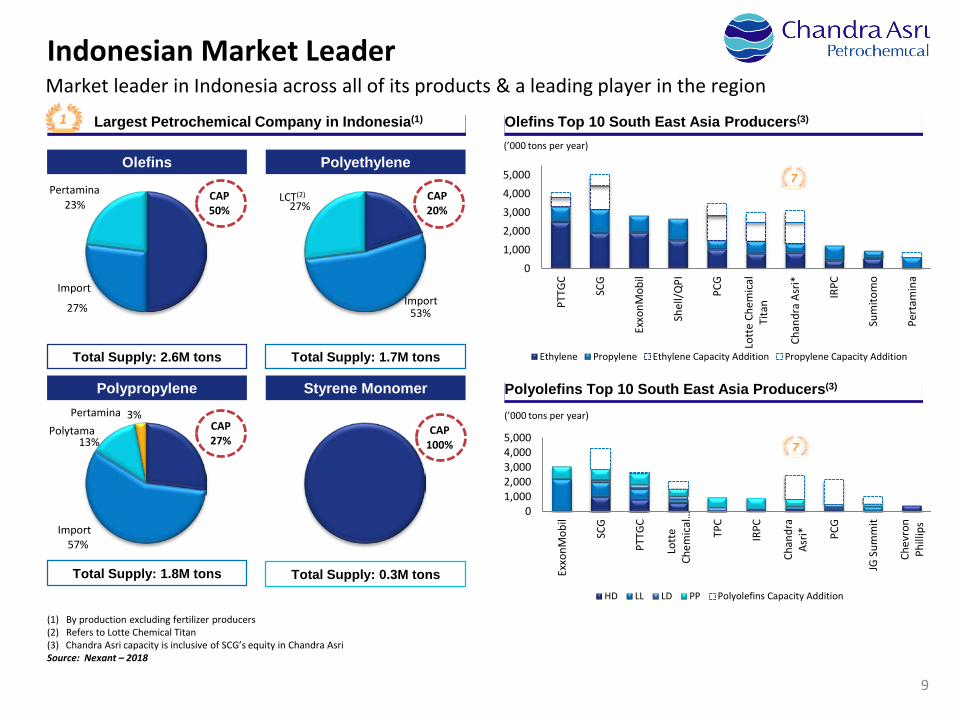
Indonesian Market LeaderMarket leader in Indonesia across all of its products & a leading player in the region
CAP50%
27%
23%
Import
Pertamina
Polyolefins Top 10 South East Asia Producers(3)
Largest Petrochemical Company in Indonesia(1)1 Olefins Top 10 South East Asia Producers(3)
Olefins Polyethylene
Polypropylene Styrene Monomer
Total Supply: 1.7M tons
Total Supply: 1.8M tons Total Supply: 0.3M tons
Total Supply: 2.6M tons
CAP20%
53%
27%
Import
LCT(2)
CAP27%
57%
13%
3%
Import
PolytamaPertamina
CAP100%
(1) By production excluding fertilizer producers(2) Refers to Lotte Chemical Titan(3) Chandra Asri capacity is inclusive of SCG’s equity in Chandra AsriSource: Nexant – 2018
01,0002,0003,0004,0005,000
PTTG
C
SCG
Exxo
nMob
il
Shel
l/QPI
PCG
Lott
e Ch
emic
alTi
tan
Chan
dra
Asri*
IRPC
Sum
itom
o
Pert
amin
a
Ethylene Propylene Ethylene Capacity Addition Propylene Capacity Addition
(’000 tons per year)
7
01,0002,0003,0004,0005,000
Exxo
nMob
il
SCG
PTTG
C
Lott
eCh
emic
al…
TPC
IRPC
Chan
dra
Asri* PC
G
JG S
umm
it
Chev
ron
Phill
ips
HD LL LD PP Polyolefins Capacity Addition
(’000 tons per year)
7
10
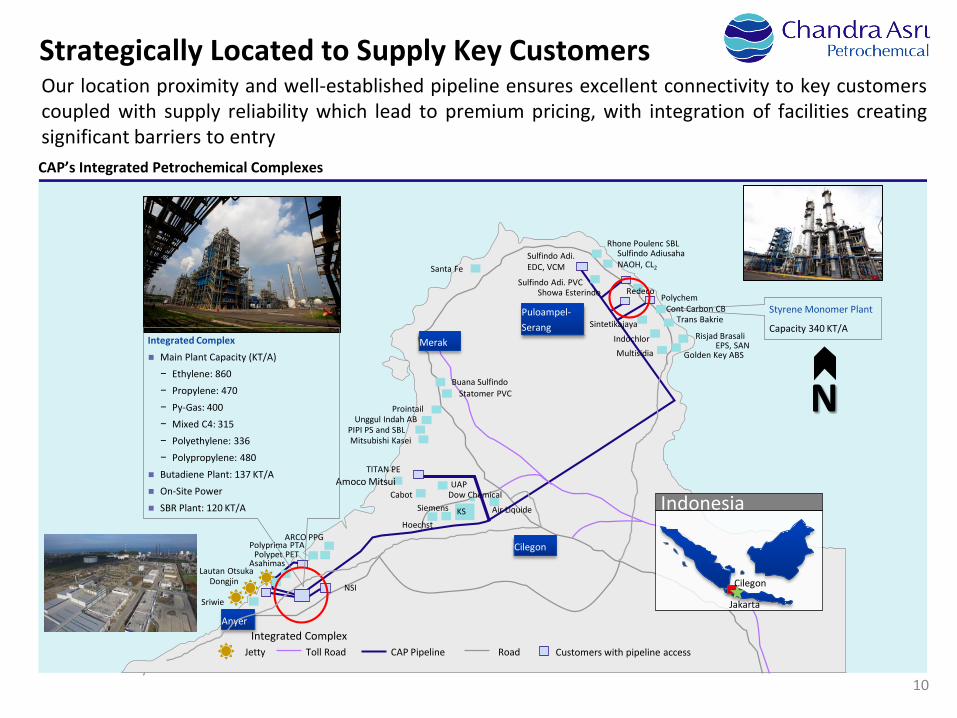
Strategically Located to Supply Key Customers
CAP’s Integrated Petrochemical Complexes
Cilegon
Merak
Jetty CAP PipelineToll Road Road
Puloampel-Serang
Styrene Monomer Plant
Capacity 340 KT/A
Sriwie
DongjinLautan Otsuka
AsahimasPolypet PET
Polyprima PTAARCO PPG
Amoco MitsuiTITAN PE
Mitsubishi KaseiPIPI PS and SBL
Unggul Indah ABProintail
Statomer PVCBuana Sulfindo
Santa Fe
Rhone Poulenc SBLSulfindo Adiusaha NAOH, CL2
Golden Key ABSMultisidia
Risjad BrasaliEPS, SAN
Trans BakrieCont Carbon CB
Indochlor
Sintetikajaya
Showa Esterindo Sulfindo Adi. PVC
PolychemRedeco
CabotSiemens
HoechstKS
Dow Chemical
Air Liquide
UAP
Customers with pipeline access
NSI
Sulfindo Adi. EDC, VCM
Indonesia
Cilegon
Integrated ComplexAnyer
N
Integrated Complex Main Plant Capacity (KT/A)− Ethylene: 860− Propylene: 470− Py-Gas: 400− Mixed C4: 315− Polyethylene: 336− Polypropylene: 480
Butadiene Plant: 137 KT/A On-Site Power SBR Plant: 120 KT/A
Jakarta
Our location proximity and well-established pipeline ensures excellent connectivity to key customerscoupled with supply reliability which lead to premium pricing, with integration of facilities creatingsignificant barriers to entry
11
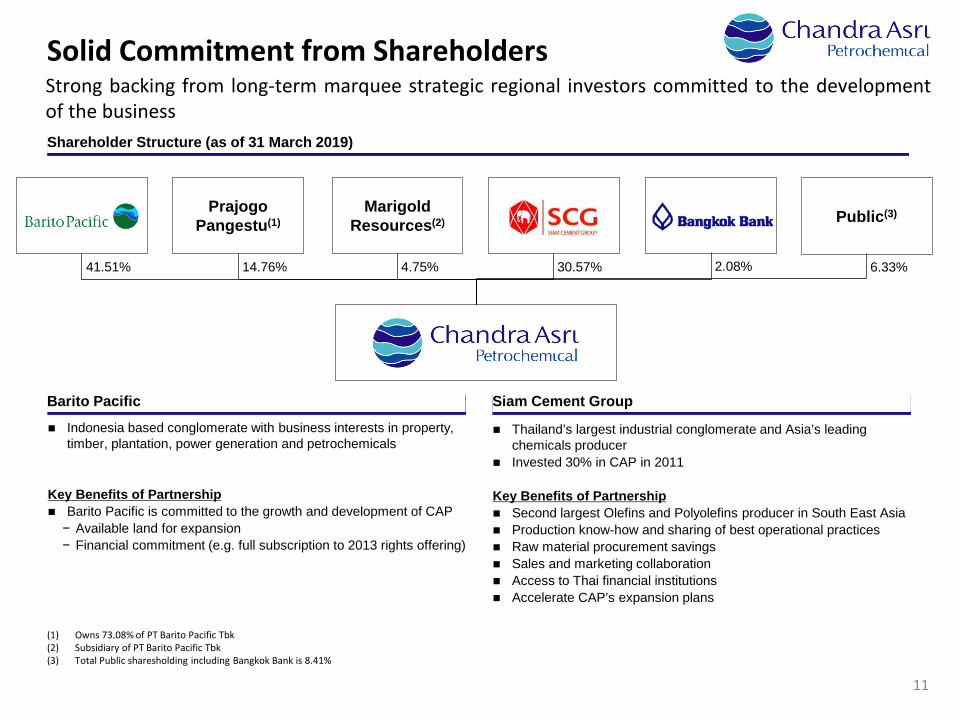
Solid Commitment from ShareholdersStrong backing from long-term marquee strategic regional investors committed to the developmentof the businessShareholder Structure (as of 31 March 2019)
41.51% 2.08%30.57%
PrajogoPangestu(1)
MarigoldResources(2)
4.75%14.76%
(1) Owns 73.08% of PT Barito Pacific Tbk(2) Subsidiary of PT Barito Pacific Tbk(3) Total Public sharesholding including Bangkok Bank is 8.41%
Indonesia based conglomerate with business interests in property, timber, plantation, power generation and petrochemicals
Key Benefits of Partnership Barito Pacific is committed to the growth and development of CAP− Available land for expansion− Financial commitment (e.g. full subscription to 2013 rights offering)
Barito Pacific Siam Cement Group
Thailand’s largest industrial conglomerate and Asia’s leading chemicals producer
Invested 30% in CAP in 2011
Key Benefits of Partnership Second largest Olefins and Polyolefins producer in South East Asia Production know-how and sharing of best operational practices Raw material procurement savings Sales and marketing collaboration Access to Thai financial institutions Accelerate CAP’s expansion plans
Public(3)
6.33%
12(1) Representative of SCG(2) Appointed since September 2018
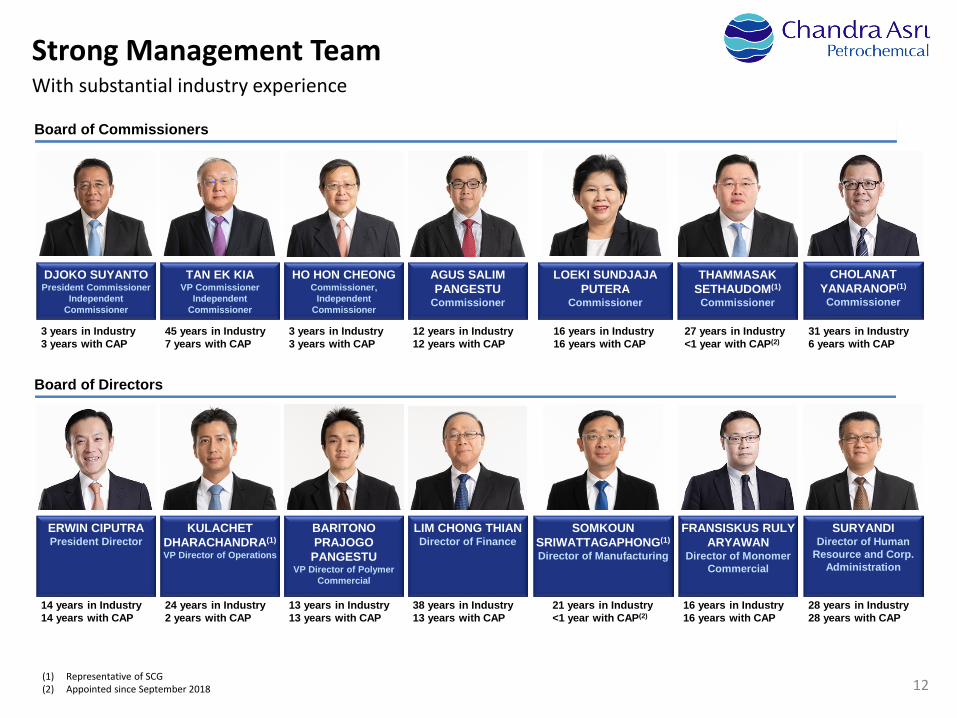
DJOKO SUYANTOPresident Commissioner
Independent Commissioner
3 years in Industry3 years with CAP
TAN EK KIAVP Commissioner
IndependentCommissioner
45 years in Industry7 years with CAP
HO HON CHEONGCommissioner,
Independent Commissioner
3 years in Industry3 years with CAP
LOEKI SUNDJAJA PUTERA
Commissioner
16 years in Industry16 years with CAP
AGUS SALIM PANGESTU
Commissioner
12 years in Industry12 years with CAP
THAMMASAK SETHAUDOM(1)
Commissioner
27 years in Industry<1 year with CAP(2)
CHOLANAT YANARANOP(1)
Commissioner
31 years in Industry6 years with CAP
ERWIN CIPUTRAPresident Director
14 years in Industry14 years with CAP
KULACHET DHARACHANDRA(1)
VP Director of Operations
24 years in Industry2 years with CAP
BARITONO PRAJOGO
PANGESTUVP Director of Polymer
Commercial
13 years in Industry13 years with CAP
LIM CHONG THIANDirector of Finance
38 years in Industry13 years with CAP
SOMKOUN SRIWATTAGAPHONG(1)
Director of Manufacturing
21 years in Industry<1 year with CAP(2)
FRANSISKUS RULY ARYAWAN
Director of Monomer Commercial
16 years in Industry16 years with CAP
SURYANDIDirector of Human
Resource and Corp. Administration
28 years in Industry28 years with CAP
Board of Directors
Board of Commissioners
Strong Management TeamWith substantial industry experience
13
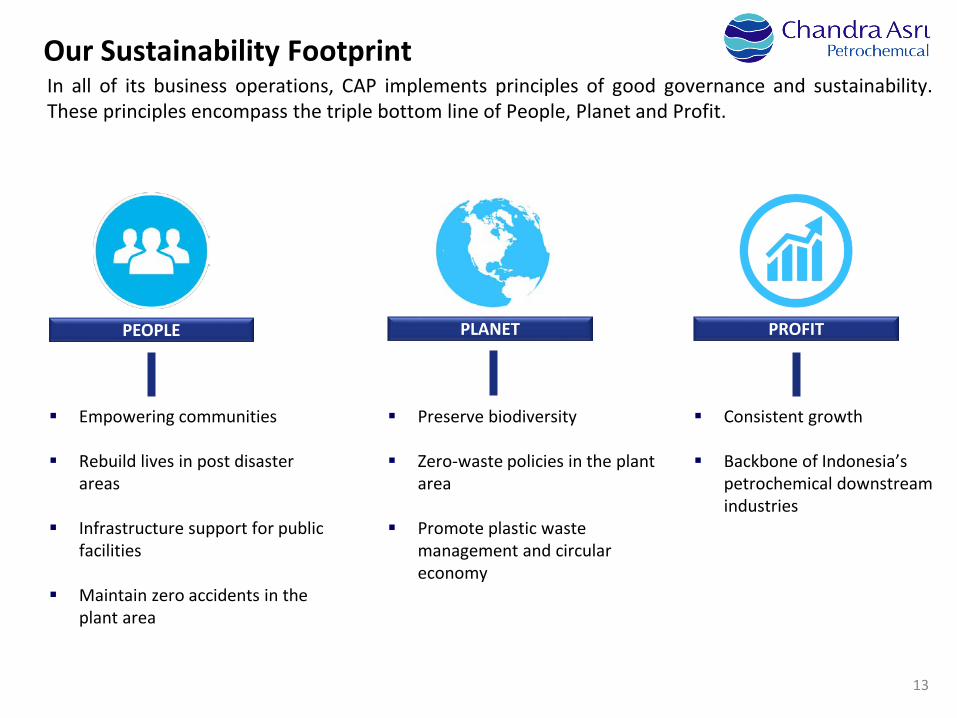
Our Sustainability FootprintIn all of its business operations, CAP implements principles of good governance and sustainability.These principles encompass the triple bottom line of People, Planet and Profit.
Empowering communities
Rebuild lives in post disaster areas
Infrastructure support for public facilities
Maintain zero accidents in the plant area
Preserve biodiversity
Zero-waste policies in the plant area
Promote plastic waste management and circular economy
Consistent growth
Backbone of Indonesia’s petrochemical downstream industries
PEOPLE PLANET PROFIT
14
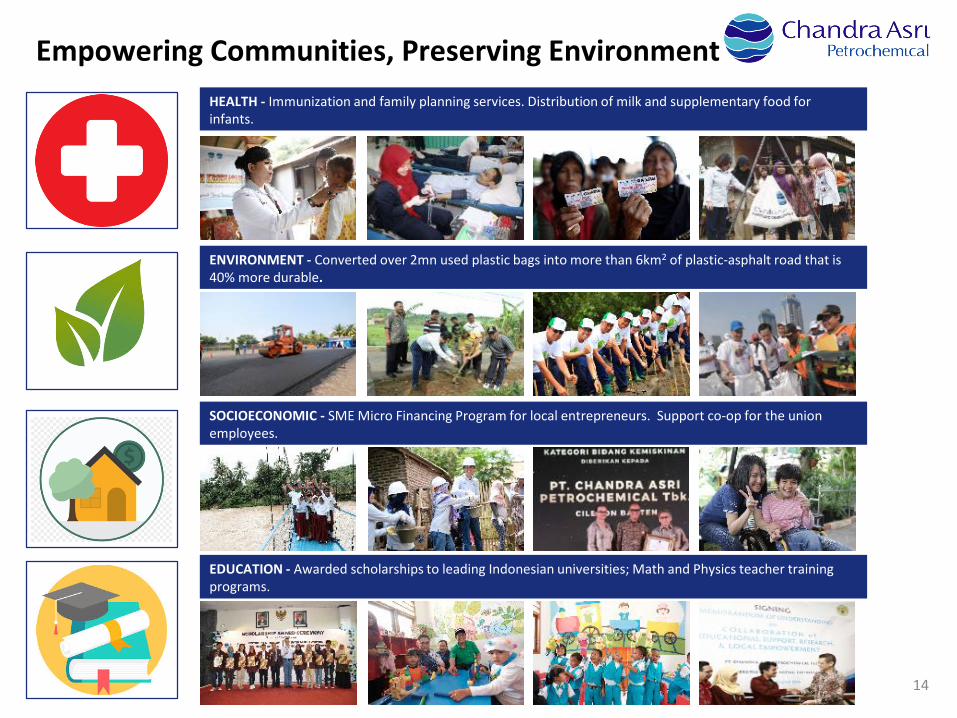
Empowering Communities, Preserving EnvironmentHEALTH - Immunization and family planning services. Distribution of milk and supplementary food for infants.
ENVIRONMENT - Converted over 2mn used plastic bags into more than 6km2 of plastic-asphalt road that is 40% more durable.
SOCIOECONOMIC - SME Micro Financing Program for local entrepreneurs. Support co-op for the union employees.
EDUCATION - Awarded scholarships to leading Indonesian universities; Math and Physics teacher training programs.
15
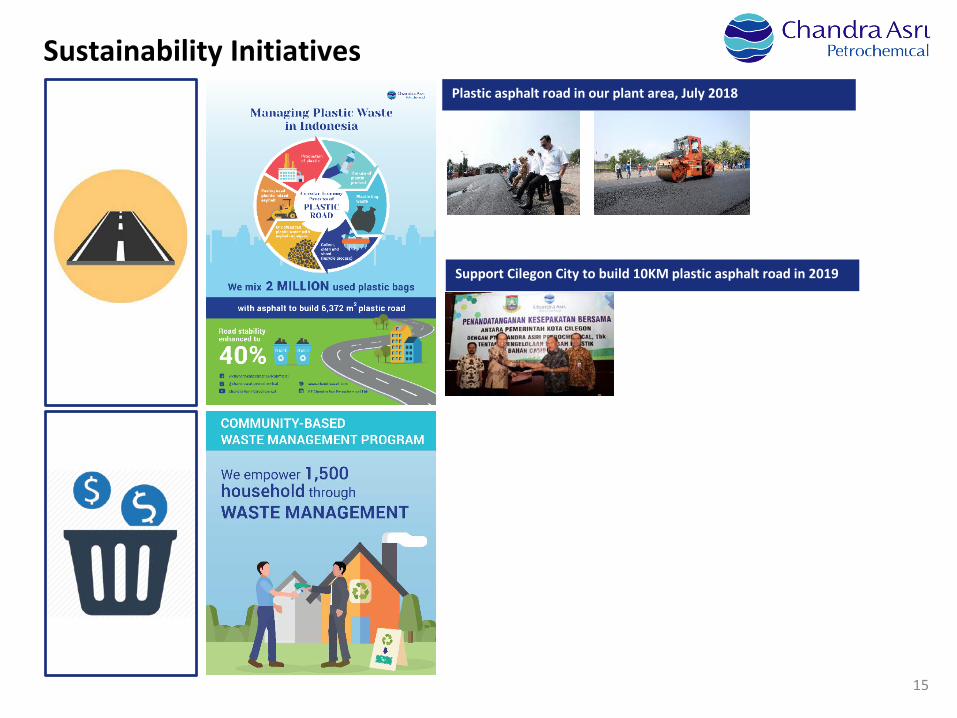
Sustainability InitiativesPlastic asphalt road in our plant area, July 2018
Support Cilegon City to build 10KM plastic asphalt road in 2019
Indonesia’s Leading & Preferred Petrochemical Company
BusinessPerformance2
16
17
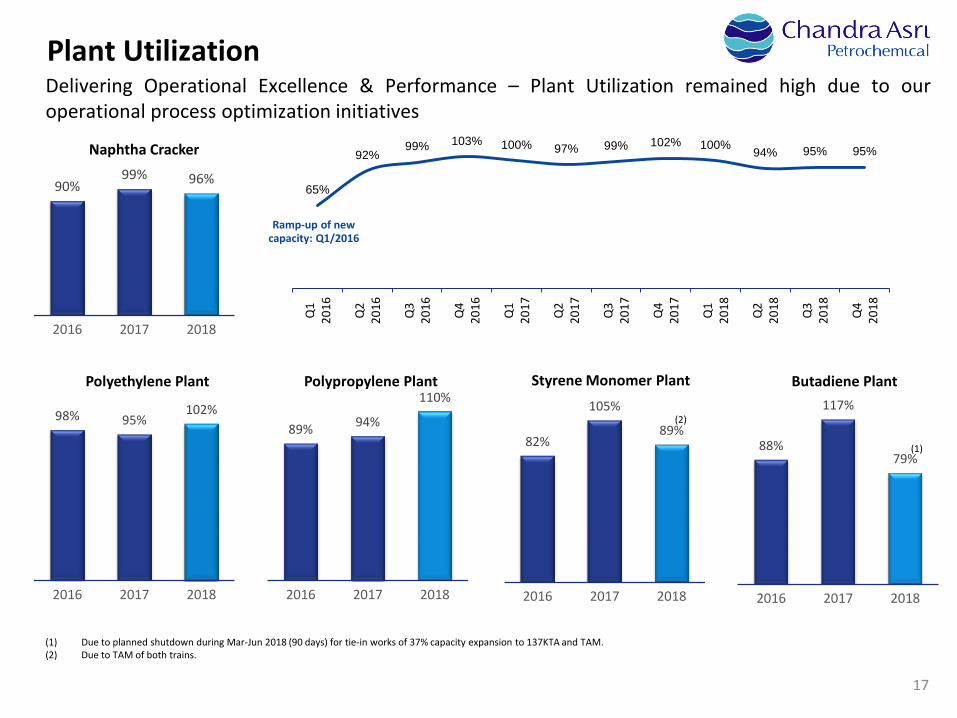
Plant UtilizationDelivering Operational Excellence & Performance – Plant Utilization remained high due to ouroperational process optimization initiatives
Polyethylene Plant
Naphtha Cracker
Polypropylene Plant Styrene Monomer Plant Butadiene Plant
98% 95% 102%
2016 2017 2018
89% 94%
110%
2016 2017 2018
82%
105%
89%
2016 2017 2018
88%
117%
79%
2016 2017 2018
65%
92%99% 103% 100% 97% 99% 102% 100% 94% 95% 95%
Q1
2016 Q2
2016 Q3
2016 Q4
2016 Q1
2017 Q2
2017 Q3
2017 Q4
2017 Q1
2018 Q2
2018 Q3
2018 Q4
2018
90%99% 96%
2016 2017 2018
(1)
(1) Due to planned shutdown during Mar-Jun 2018 (90 days) for tie-in works of 37% capacity expansion to 137KTA and TAM.(2) Due to TAM of both trains.
(2)
Ramp-up of new capacity: Q1/2016

18
Production & Sales Volume
Polypropylene Plant
Naphtha Cracker Polyethylene Plant
Styrene Monomer Plant Butadiene Plant
771855 829
381450 405
2016 2017 2018Prod Sales
329 320 343316 327 342
2016 2017 2018Prod Sales
428 451526
427 439528
2016 2017 2018Prod Sales
276
356303
276
349303
2016 2017 2018Prod Sales
88117
9685
11894
2016 2017 2018Prod Sales
(KT) (KT)
(KT) (KT) (KT)
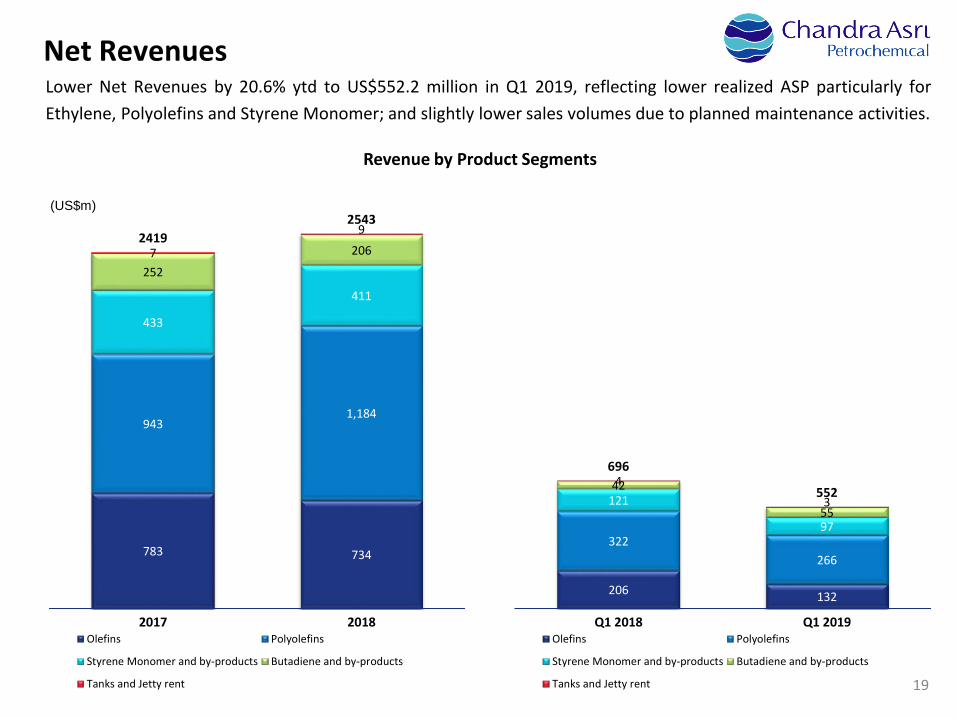
783 734
943 1,184
433
411
252
206 7
9 24192543
2017 2018Olefins Polyolefins
Styrene Monomer and by-products Butadiene and by-products
Tanks and Jetty rent
(US$m)
19
Net RevenuesLower Net Revenues by 20.6% ytd to US$552.2 million in Q1 2019, reflecting lower realized ASP particularly forEthylene, Polyolefins and Styrene Monomer; and slightly lower sales volumes due to planned maintenance activities.
•Revenue by Product Segments
206 132
322 266
121
97
42
55
4
3
696
552
Q1 2018 Q1 2019Olefins Polyolefins
Styrene Monomer and by-products Butadiene and by-products
Tanks and Jetty rent
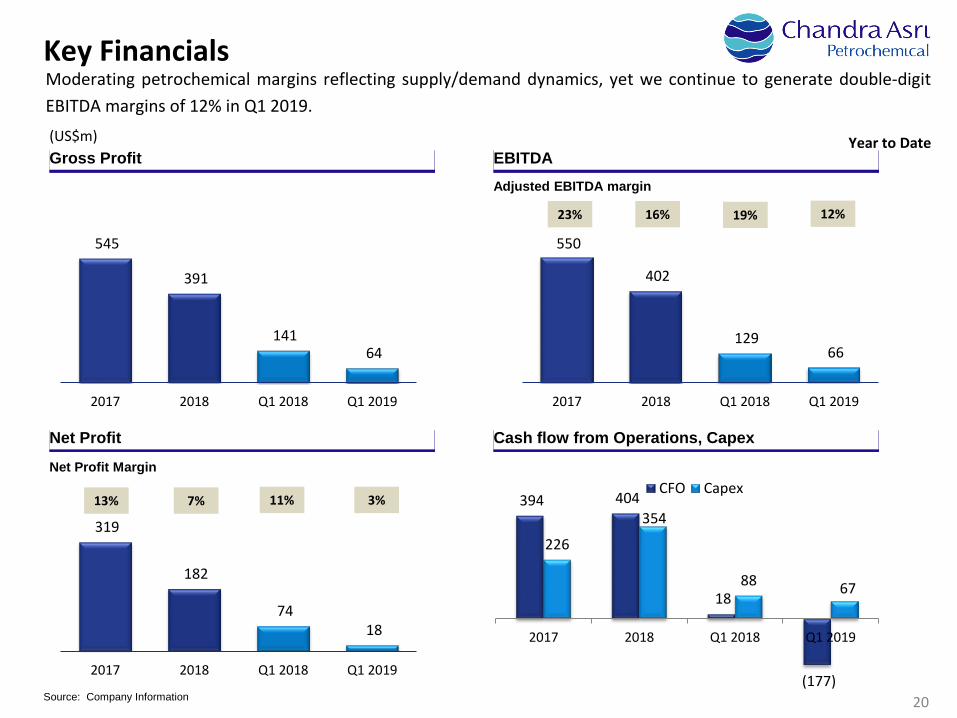
319
182
74 18
2017 2018 Q1 2018 Q1 2019
20
Key Financials
Source: Company Information
Gross Profit EBITDA
Net Profit Cash flow from Operations, Capex
Adjusted EBITDA margin
Net Profit Margin
Year to Date
545
391
141 64
2017 2018 Q1 2018 Q1 2019
394 404
18
(177)
226
354
88 67
2017 2018 Q1 2018 Q1 2019
CFO Capex
550
402
129 66
2017 2018 Q1 2018 Q1 2019
(US$m)
12%19%
3%11%
Moderating petrochemical margins reflecting supply/demand dynamics, yet we continue to generate double-digitEBITDA margins of 12% in Q1 2019.
16%23%
7%13%
21
Key Financials
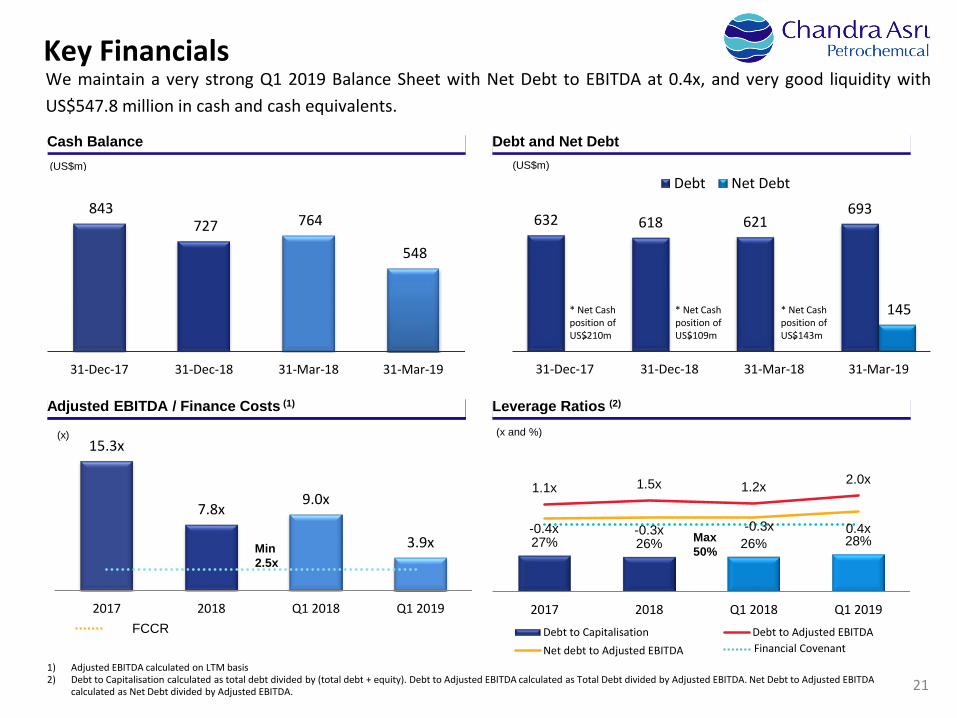
27% 26% 26% 28%
1.1x 1.5x 1.2x 2.0x
-0.4x -0.3x -0.3x 0.4x
2017 2018 Q1 2018 Q1 2019Debt to Capitalisation Debt to Adjusted EBITDANet debt to Adjusted EBITDA
15.3x
7.8x9.0x
3.9x
2017 2018 Q1 2018 Q1 2019
(x)
Cash Balance Debt and Net Debt
Adjusted EBITDA / Finance Costs (1) Leverage Ratios (2)
Min2.5x
Max50%
FCCRFinancial Covenant
(x and %)
843 727 764
548
31-Dec-17 31-Dec-18 31-Mar-18 31-Mar-19
(US$m)
632 618 621693
- - -
145
31-Dec-17 31-Dec-18 31-Mar-18 31-Mar-19
Debt Net Debt(US$m)
* Net Cash position of US$109m
1) Adjusted EBITDA calculated on LTM basis2) Debt to Capitalisation calculated as total debt divided by (total debt + equity). Debt to Adjusted EBITDA calculated as Total Debt divided by Adjusted EBITDA. Net Debt to Adjusted EBITDA
calculated as Net Debt divided by Adjusted EBITDA.
We maintain a very strong Q1 2019 Balance Sheet with Net Debt to EBITDA at 0.4x, and very good liquidity withUS$547.8 million in cash and cash equivalents.
* Net Cash position of US$210m
* Net Cash position of US$143m
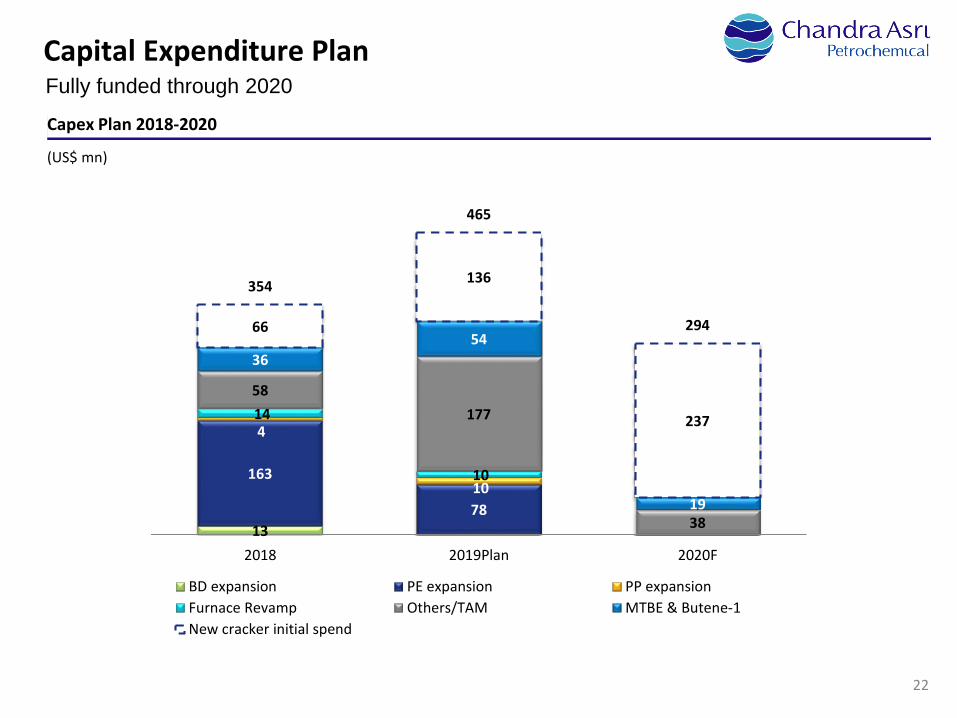
22
Capital Expenditure Plan Fully funded through 2020
Capex Plan 2018-2020
(US$ mn)
13
163
78
4
10
14
10
58177
38
3654
19
66
136
237
354
465
294
2018 2019Plan 2020F
BD expansion PE expansion PP expansionFurnace Revamp Others/TAM MTBE & Butene-1New cracker initial spend
Indonesia’s Leading & Preferred Petrochemical Company
Strategic Priorities3
26
24
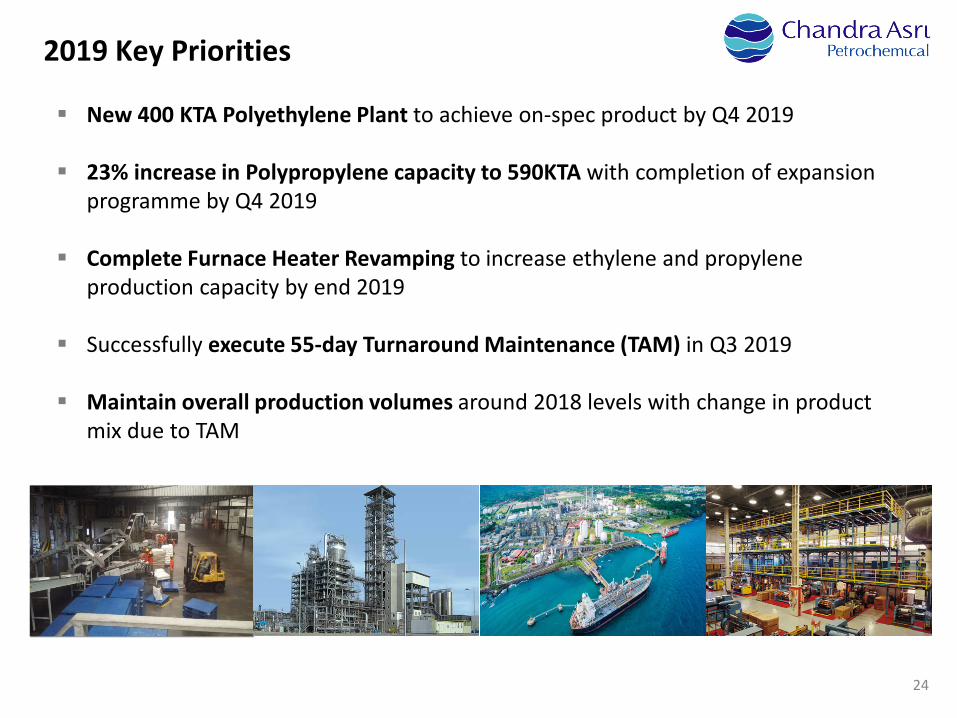
2019 Key Priorities
New 400 KTA Polyethylene Plant to achieve on-spec product by Q4 2019
23% increase in Polypropylene capacity to 590KTA with completion of expansion programme by Q4 2019
Complete Furnace Heater Revamping to increase ethylene and propylene production capacity by end 2019
Successfully execute 55-day Turnaround Maintenance (TAM) in Q3 2019
Maintain overall production volumes around 2018 levels with change in product mix due to TAM
25
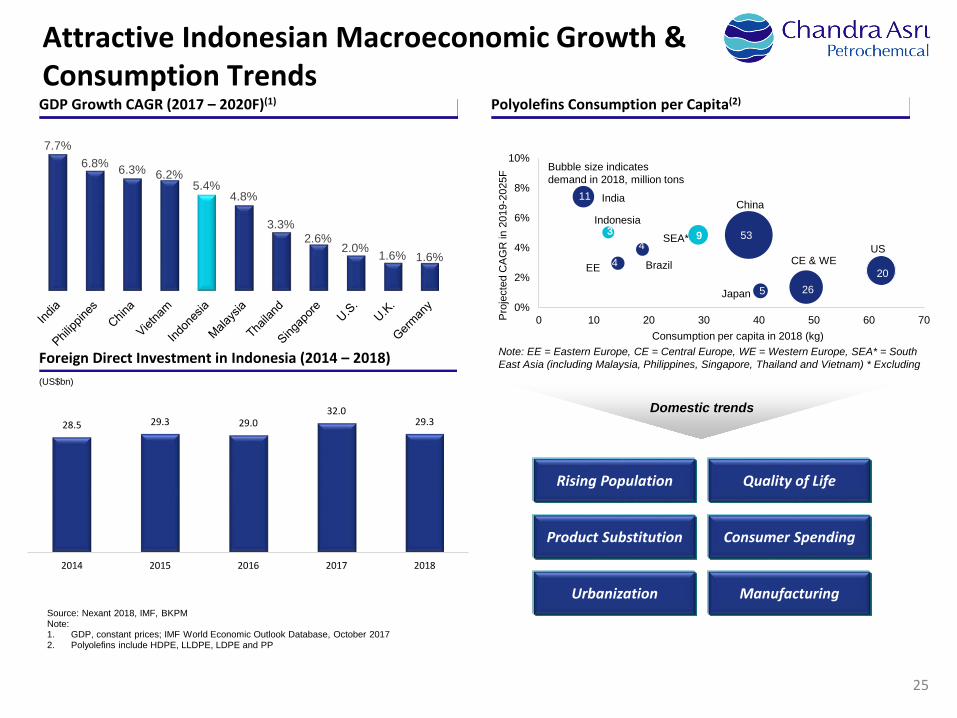
Attractive Indonesian Macroeconomic Growth & Consumption Trends
Source: Nexant 2018, IMF, BKPMNote:1. GDP, constant prices; IMF World Economic Outlook Database, October 20172. Polyolefins include HDPE, LLDPE, LDPE and PP
Polyolefins Consumption per Capita(2)GDP Growth CAGR (2017 – 2020F)(1)
Foreign Direct Investment in Indonesia (2014 – 2018)(US$bn)
Product Substitution Consumer Spending
Quality of LifeRising Population
Domestic trends
Urbanization Manufacturing
7.7%6.8% 6.3% 6.2%
5.4%4.8%
3.3%2.6%
2.0% 1.6% 1.6%US
Indonesia
India
0%
2%
4%
6%
8%
10%
0 10 20 30 40 50 60 70Proj
ecte
d C
AGR
in 2
019-
2025
F
Consumption per capita in 2018 (kg)
Bubble size indicates demand in 2018, million tons
11
53
2026
49
5
SEA*3
Brazil4
Note: EE = Eastern Europe, CE = Central Europe, WE = Western Europe, SEA* = South East Asia (including Malaysia, Philippines, Singapore, Thailand and Vietnam) * Excluding
EE
China
Japan
CE & WE
28.5 29.3 29.032.0
29.3
2014 2015 2016 2017 2018
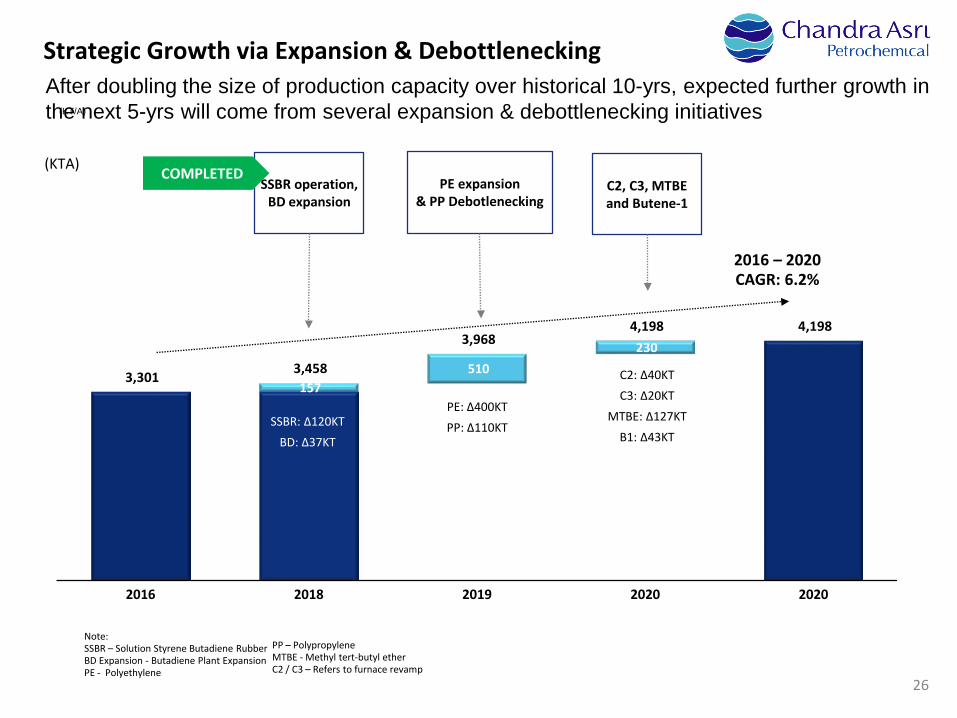
157 510
230
3,301 3,458
3,968 4,198 4,198
2016 2018 2019 2020 2020
(KT/A)
26
Strategic Growth via Expansion & DebottleneckingAfter doubling the size of production capacity over historical 10-yrs, expected further growth in the next 5-yrs will come from several expansion & debottlenecking initiatives
2016 – 2020 CAGR: 6.2%
SSBR operation, BD expansion
C2, C3, MTBE and Butene-1
PE expansion& PP Debotlenecking
Note: SSBR – Solution Styrene Butadiene RubberBD Expansion - Butadiene Plant ExpansionPE - Polyethylene
PP – PolypropyleneMTBE - Methyl tert-butyl ether C2 / C3 – Refers to furnace revamp
COMPLETED(KTA)
SSBR: ∆120KTBD: ∆37KT
PE: ∆400KTPP: ∆110KT
C2: ∆40KTC3: ∆20KT
MTBE: ∆127KTB1: ∆43KT
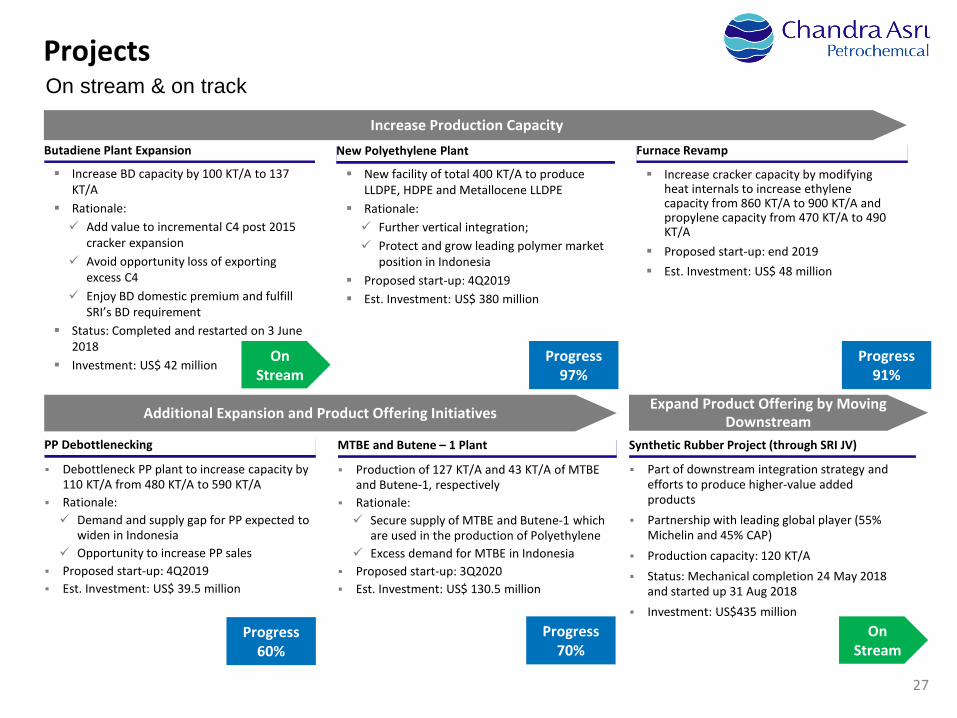
27
ProjectsOn stream & on track
Furnace Revamp
Increase BD capacity by 100 KT/A to 137 KT/A
Rationale: Add value to incremental C4 post 2015
cracker expansion Avoid opportunity loss of exporting
excess C4 Enjoy BD domestic premium and fulfill
SRI’s BD requirement Status: Completed and restarted on 3 June
2018 Investment: US$ 42 million
Butadiene Plant Expansion
Increase cracker capacity by modifying heat internals to increase ethylene capacity from 860 KT/A to 900 KT/A and propylene capacity from 470 KT/A to 490 KT/A
Proposed start-up: end 2019 Est. Investment: US$ 48 million
New facility of total 400 KT/A to produce LLDPE, HDPE and Metallocene LLDPE
Rationale: Further vertical integration; Protect and grow leading polymer market
position in Indonesia Proposed start-up: 4Q2019 Est. Investment: US$ 380 million
New Polyethylene Plant
Increase Production Capacity
Additional Expansion and Product Offering Initiatives
Production of 127 KT/A and 43 KT/A of MTBE and Butene-1, respectively
Rationale: Secure supply of MTBE and Butene-1 which
are used in the production of Polyethylene Excess demand for MTBE in Indonesia
Proposed start-up: 3Q2020 Est. Investment: US$ 130.5 million
MTBE and Butene – 1 PlantPP Debottlenecking
Debottleneck PP plant to increase capacity by 110 KT/A from 480 KT/A to 590 KT/A
Rationale: Demand and supply gap for PP expected to
widen in Indonesia Opportunity to increase PP sales
Proposed start-up: 4Q2019 Est. Investment: US$ 39.5 million
Expand Product Offering by Moving Downstream
Synthetic Rubber Project (through SRI JV)
Part of downstream integration strategy and efforts to produce higher-value added products
Partnership with leading global player (55% Michelin and 45% CAP)
Production capacity: 120 KT/A Status: Mechanical completion 24 May 2018
and started up 31 Aug 2018 Investment: US$435 million
Progress 60%
Progress 70%
Progress 97%
Progress 91%
On Stream
On Stream
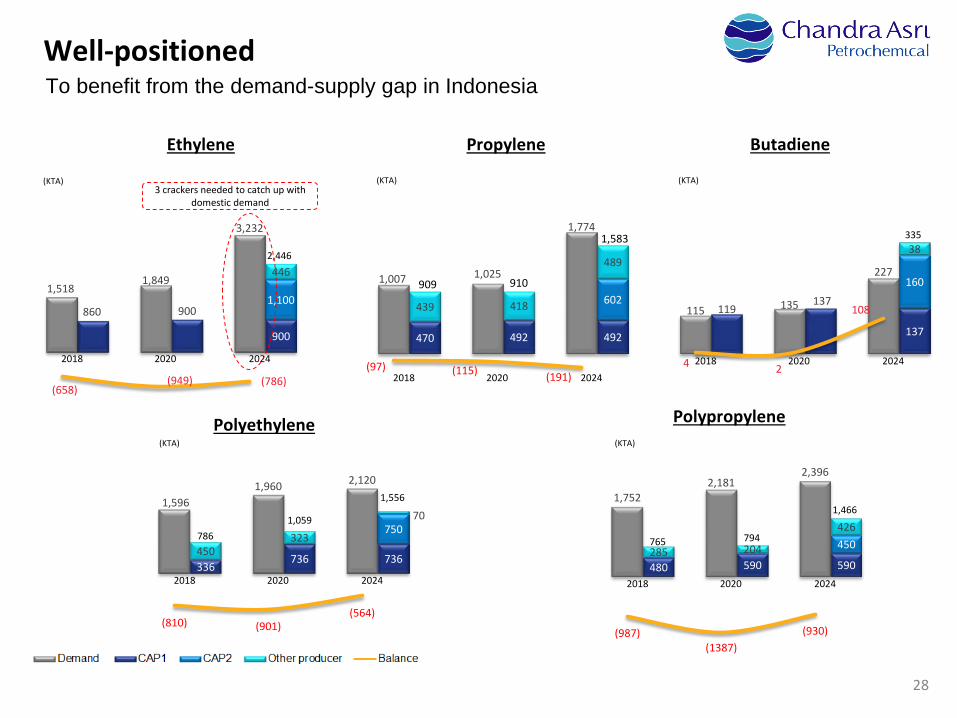
28
Well-positionedTo benefit from the demand-supply gap in Indonesia
Polyethylene Polypropylene
Ethylene Propylene Butadiene
1,5181,849
3,232
860 900
900
1,100
446
(658)(949) (786)
2,446
2018 2020 2024
(KTA)3 crackers needed to catch up with
domestic demand
(KTA)
1,007 1,025
1,774
470 492 492
602439 418
489
(97) (115) (191)
1,583
2018 2020 2024
910909
(KTA)
115 135
227
119137
137
160
38
4 2
108
335
2018 2020 2024
1,5961,960 2,120
336736 736
750
450323
70
(810) (901)(564)
1,556
2018 2020 2024
1,059786
(KTA)
1,7522,181
2,396
480 590 590
450285 204
426
(987)(1387)
(930)
1,466
2018 2020 2024
794765
(KTA)
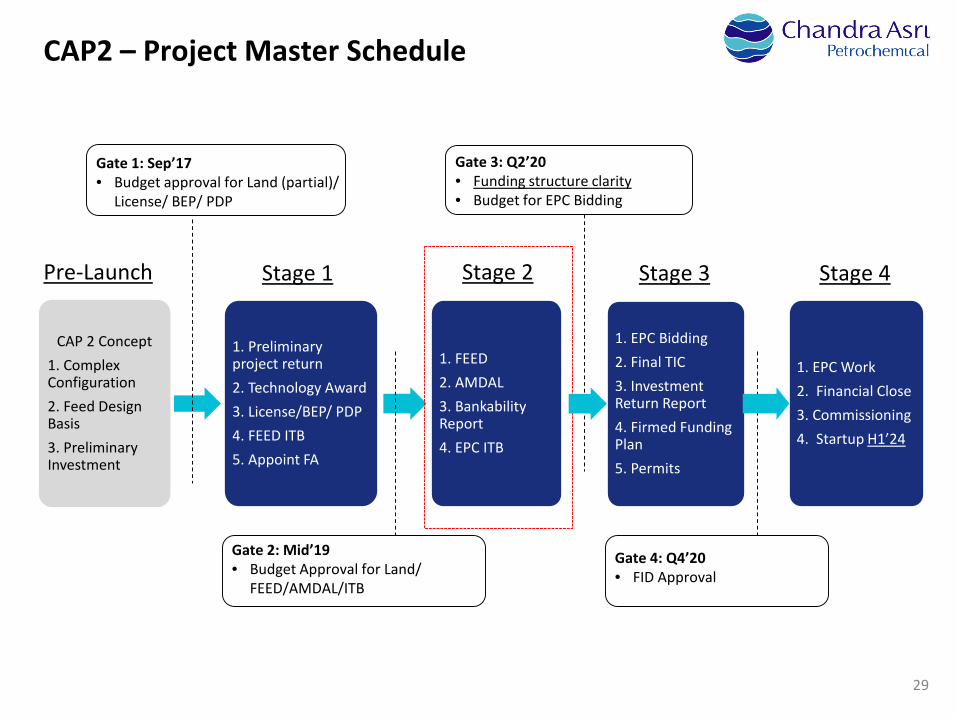
29
CAP2 – Project Master Schedule
Gate 3: Q2’20• Funding structure clarity• Budget for EPC Bidding
Gate 1: Sep’17• Budget approval for Land (partial)/
License/ BEP/ PDP
CAP 2 Concept1. Complex Configuration2. Feed Design Basis3. Preliminary Investment
1. Preliminary project return2. Technology Award3. License/BEP/ PDP4. FEED ITB5. Appoint FA
1. FEED2. AMDAL3. Bankability Report4. EPC ITB
1. EPC Bidding2. Final TIC3. Investment Return Report4. Firmed Funding Plan5. Permits
1. EPC Work2. Financial Close3. Commissioning4. Startup H1’24
Gate 2: Mid’19• Budget Approval for Land/
FEED/AMDAL/ITB
Gate 4: Q4’20• FID Approval
Pre-Launch Stage 1 Stage 2 Stage 3 Stage 4
30
For more information please contact:Head Office Address:PT Chandra Asri Petrochemical TbkWisma Barito Pacific Tower A, 7th FloorJl. Let. Jend. S. Parman Kav. 62-63Jakarta 11410
Investor Relations Contact:Harry M. Tamin, Head of Investor RelationsTelephone: +62 (21) 530 7950Faximile: +62 (21) 530 8930 Email: [email protected]
Corporate Website:www.chandra-asri.com
PT Chandra Asri Petrochemical Tbk28 June 2019Company Presentation
CGS-CIMB 13th Annual Indonesia Conference


