1 INDONESIAN TRADE LIBERALIZATION: ESTIMATING THE GAINS Tubagus Feridhanusetyawan and Mari Pangestu * Center for Strategic and International Studies (CSIS), Jakarta Indonesia has undergone comprehensive trade liberalization, by participating in multilateral and regional trade arrangements and by conducting unilateral liberalization. This paper evaluates the different paths of liberalization that Indonesia has undertaken, and quantitatively measures the effects of trade liberalization on the economy. It considers several liberalization scenarios, focusing on the impact of unilateral liberalization and regional liberalization schemes through APEC and AFTA, in addition to the multilateral trade liberalization through the Uruguay Round (UR). The results show that the full implementation of the UR and APEC would greatly benefit Indonesia. The study also shows that the benefit from having unilateral liberalization, in addition to the UR commitment, would lead to large welfare gains. On the other hand, the creation of AFTA is expected to contribute little additional welfare gain to Indonesia or to the other ASEAN member countries. INTRODUCTION Since the mid 1980s Indonesia has undergone comprehensive trade liberalization. The instigating force was initially unilateral efforts to deregulate its trade and investment regime as a response to adverse external developments, namely the decline in oil prices. Strong political will to undertake deregulation paved the way also for Indonesia's active participation in the formation of the ASEAN Free Trade Area (AFTA) by 2008, later accelerated to 2003 and then to 2002. Subsequently in 1994, the year it hosted the APEC meeting in Bogor, Indonesia emerged as the champion of concerted unilateral liberalization, giving APEC the legacy of the Bogor goals of free trade and investment by year 2010/2020. On top of these driving forces for trade and investment liberalization, Indonesia also had to fulfil its multilateral commitments under the Uruguay Round (UR) Agreement. As part of its UR commitment, Indonesia has been reducing its border tariffs, opening its markets, and reducing domestic taxes and subsidies, especially in the agricultural sector. The aim of this paper is to evaluate analytically the different paths of liberalization that Indonesia has undertaken, using a quantitative economic * This paper is updated from Feridhanusetyawan, Pangestu and Erwidodo (2000), which used a similar data set but different trade liberalization scenarios.
Transcript
1
INDONESIAN TRADE LIBERALIZATION: ESTIMATING THE GAINS
Tubagus Feridhanusetyawan and Mari Pangestu*
Center for Strategic and International Studies (CSIS), Jakarta
Indonesia has undergone comprehensive trade liberalization, by participating in multilateral and regional trade arrangements and by conducting unilateral liberalization. This paper evaluates the different paths of liberalization that Indonesia has undertaken, and quantitatively measures the effects of trade liberalization on the economy. It considers several liberalization scenarios, focusing on the impact of unilateral liberalization and regional liberalization schemes through APEC and AFTA, in addition to the multilateral trade liberalization through the Uruguay Round (UR). The results show that the full implementation of the UR and APEC would greatly benefit Indonesia. The study also shows that the benefit from having unilateral liberalization, in addition to the UR commitment, would lead to large welfare gains. On the other hand, the creation of AFTA is expected to contribute little additional welfare gain to Indonesia or to the other ASEAN member countries.
INTRODUCTION
Since the mid 1980s Indonesia has undergone comprehensive trade liberalization. The instigating force was initially unilateral efforts to deregulate its trade and investment regime as a response to adverse external developments, namely the decline in oil prices. Strong political will to undertake deregulation paved the way also for Indonesia's active participation in the formation of the ASEAN Free Trade Area (AFTA) by 2008, later accelerated to 2003 and then to 2002. Subsequently in 1994, the year it hosted the APEC meeting in Bogor, Indonesia emerged as the champion of concerted unilateral liberalization, giving APEC the legacy of the Bogor goals of free trade and investment by year 2010/2020. On top of these driving forces for trade and investment liberalization, Indonesia also had to fulfil its multilateral commitments under the Uruguay Round (UR) Agreement. As part of its UR commitment, Indonesia has been reducing its border tariffs, opening its markets, and reducing domestic taxes and subsidies, especially in the agricultural sector.
The aim of this paper is to evaluate analytically the different paths of liberalization that Indonesia has undertaken, using a quantitative economic
* This paper is updated from Feridhanusetyawan, Pangestu and Erwidodo (2000), which used a similar data set but different trade liberalization scenarios.
2
model to estimate the effects of each path on the economies of the Asia Pacific region in general and Indonesia in particular. The objective of such an exercise is to compare the gains from different paths to liberalization, and assess which set of paths will bring optimal benefits to Indonesia. Various studies using a similar modeling framework have been conducted before, and some of them also focus on agricultural liberalization in the Asia Pacific region.1 The contribution of this paper is to focus on the impact on Indonesia of unilateral liberalization, and of regional liberalization efforts through APEC and AFTA, as well as that of multilateral trade liberalization. The focus of the paper is on Indonesia, even though the model treats Indonesia as part of an interdependent world economy. The paper considers several liberalization scenarios, which are combinations of unilateral, UR, APEC and AFTA initiatives, and compares the impact of each scenario on welfare, output and resource allocation in the economy.
The paper is organized as follows. The first part discusses various pressures for trade liberalization that Indonesia has experienced, and its responses to these. This includes discussion of efforts through the unilateral, UR, APEC and AFTA processes. The second part presents the modeling framework in a computable general equilibrium model, including the development of scenarios to represent various schemes of trade liberalization. The third part presents the results of the simulation. The paper closes with a number of conclusions and recommendations.
Pressures for Trade Liberalization
Trade and investment policies have undergone fundamental changes in Indonesia along with changing patterns of development strategy over the last three decades: from an inward looking import substitution strategy during the oil boom in the early 1970s, to limited liberalization and deregulation in the early 1980s, and extensive deregulation and liberalization after the end of oil boom in the mid 1980s. External pressure to liberalize came from the acceleration of regional efforts in the late 1980s and first half of the 1990s, as well as its commitments under the Uruguay Round Agreement and creation of the WTO at the end of 1994 (effective beginning in 1995).
1 Other studies of trade liberalization in Asia Pacific that use a similar framework include APEC (1997); APEC (1999; Anderson et al. (1997); and Young and Huff (1997). For previous studies on Indonesia see Erwidodo and Feridhanusetyawan (1997); and Feridhanusetyawan (1997).
3
Unilateral Liberalization.2 The need to diversify Indonesia’s economic base away from dependence on oil led to dramatic deregulation efforts beginning in 1985. During the years 1985–90, tariffs were rationalized and reduced across the board, and some non-tariff barriers (NTBs) were removed, especially import licensing and import monopolies. As a result, average unweighted tariffs declined from 27% in 1986 to 20% by 1992. NTBs as a percentage of tariff lines had declined from 32% to 17% by 1990 and to 5% by 1992; as a percentage of imports they fell from 43% in 1986 to 13% by 1990. Other important reforms included revamping and replacing the corrupt customs service with a private Swiss surveying company (Société Générale de Surveillance, SGS) (Pangestu 1996). The duty drawback scheme for exporters was improved substantially, and more liberal treatment with regard to foreign ownership and exemption from duties and VAT was given to export-oriented investments. Investment restrictions, especially export-oriented investments, were also reduced. The results of trade and investment reforms were positive in terms of rapid growth of non-oil exports, consequent diversification of Indonesia's export base, and inflows of export-oriented domestic and foreign investments. Growth has also tended to be in the sectors in which Indonesia has comparative advantage, especially unskilled labour-intensive sectors.
However, by 1991 progress on unilateral reforms had slowed because of the difficulty of reducing protection and removing non-tariff barriers in politically sensitive sectors such as agriculture (e.g. sugar, wheat flour, soybean, garlic, cloves, milk and dairy products), and in several manufacturing products such as motor vehicles, plastic and cement.3 A wave of unilateral investment and trade reforms began again in 1994 and this appeared to be influenced by Indonesia's external commitments. In 1994 dramatic liberalization of foreign ownership restrictions and divestment
2 For comprehensive discussion of Indonesia’s economic deregulation and liberalization see Pangestu (1996) and Feridhanusetyawan (2001).
3 Several non-transparent preferential policies emerged during this period. Among the controversial cases were a clove monopoly and restrictions on inter-island trade in oranges from West Kalimantan in 1991 (Nasution 1991), the increased tariff surcharge on propylene and ethylene imports in 1993 (McLeod 1993), and exemptions from the 35 per cent luxury tax for the national car, the Timor (Bird 1996). All of these cases were related to the president’s family and/or cronies.
4
requirements were undertaken, related to the fact that Indonesia was hosting the APEC meeting in that year. In the May 1995 a comprehensive program of tariff reductions (64% of tariff lines) was announced, and for the first time, contained schedule for tariff reduction for the 1995-2003 period. By the year 2003, the Government announced that all tariffs, except those on motor vehicle components and products, would be set at a maximum of 10 per cent, with most falling in the 0-5 per cent range. This announced schedule was influenced by the AFTA schedule that the government had to prepare, albeit tariffs for intra ASEAN trade under AFTA were falling to a lower target rate of 0-5%. This was followed up by another trade liberalization package in 1996, bringing down average unweighted tariffs to 12%, and non-tariff barriers to around 3% of tariff lines and 12% of imports.
Prior to the crisis, therefore, trade and investment liberalization had made considerable progress. Since the crisis further liberalization, including of the agriculture sector, has been undertaken under the Letters of Intent (LOI) to the IMF. For a large number of tariff lines the 2003 targets had already been realised in 1998/99. There were some inconsistencies, however, such as the cases of rice and the role of the Logistics Agency (BULOG). Before the crisis, BULOG had the monopoly on rice imports, but under the LOI this monopoly was revoked and replaced by a 30% tariff.
In June 1999, separately from the IMF package, the government announced a major trade liberalization program in relation to the most protected manufacturing sector, motor vehicles. It comprised removal of local content requirements, reduction of tariffs on imported cars and components, and simplification of licensing procedures. The reforms were aimed at developing an efficient and globally competitive motor vehicle sector.
The Uruguay Round and the WTO.4 The completion of the GATT Uruguay Round negotiations in 1994 was followed by the establishment of the WTO on January 1, 1995. Indonesia’s commitments to the WTO can be summarized under six major areas. The first is the binding of a majority of tariffs across-the-board at the ceiling rate of 40%. These bindings cover 95% of all tariff items and 92% of all imports. This commitment had little impact on actual trade liberalization because the average tariff line was already around 15% in 1994.
4 See Stephenson and Pangestu (1996).
5
The second area is the agriculture sector, with tariffication and binding of all agricultural items, and a reduction in tariffs of at least 10% per line item, or about 24% overall, over the 10 years from 1994. In addition, as part of the Trade Related Investment Measures (TRIMS) agreement, the local content requirement for milk products was to be notified to the WTO and eliminated by the end of 2000. Indonesia did in fact notify its local content regulations, and agreed to eliminate them by 2000. In terms of minimum market access, Indonesia agreed to the import of 70,000 tons of rice annually (at a 90% tariff). Rice subsidies were still allowed. As was the case with many other countries, the tariffication and bound rates for agriculture tariffs in the WTO agreement were well above the actual level of tariffs for agricultural products. Finally under the UR agreement, the special status of BULOG as a state trading enterprise dealing with strategic food items was notified and maintained under the provision on ‘green box measures’ (dealing with domestic support and not regarded as non-tariff measures).5
The third area is the commitment to remove non-tariff-barriers (NTBs), such as various import licensing schemes, in the 10 years from 1994. The most common NTBs to be removed are the Import Producer licences for iron and steel products, engine and engine parts, heavy transport equipment, and electronic products. Others include Approved Importer and Approved Sole Agent licences, which were applied to various industries from food-related subsectors to lubricants.
The fourth area is the elimination of all import surcharges on items included in Indonesia’s market access offer over a 10-year period from 1994. In fact, as already mentioned, Indonesia has unilaterally accelerated its liberalization measures in this area under two deregulation packages in June 1994 and 1995.
The fifth area is the commitment to liberalize, or to the binding of existing market access opportunities, for five services sectors, namely telecommunications, industrial services, tourism, financial services and banking.
The last area is the commitment to remove local content regulations under the TRIMS (Trade Related Investment Measures), with the local content
5 Since the crisis and with Indonesia coming under the IMF program of assistance, under the Letters of Intent most of the import monopolies for agriculture products under Bulog has been removed. However, Bulog remains a State Trading Company from the perspective of the WTO.
6
requirements for motor vehicles and agricultural products being notified in 1995 and removed by the end of 2000. However, the government appeared to take a step backward in its liberalization commitment through the passage of a controversial national car policy in 1996 which reinstated the requirement for certain local content elements along with other policies that appeared to violate MFN and national treatment under the GATT rules.
One important characteristic of the WTO agreement that is expected to benefit Indonesia is the elimination of bilateral quotas under the MFA (Multifibre Arrangement). Under the UR all bilateral import quotas on textiles and garments are to be removed by 2005, and the only trade restrictions in place will be bound tariffs. Since Indonesia is an important textile and clothing exporter, it could be a major beneficiary of the elimination of the MFA.
Another important characteristic of the Uruguay Round agreement is its progressive agricultural liberalization. Other international trade agreements, many of which are more progressive than the UR in terms of eliminating barriers on non-agricultural products, often exclude or have minimum commitments for agricultural liberalization. APEC, for instance, is more extensive in its border tariff reductions, yet lacks any real program for removal of other distortions in the agricultural sector. Hence, the success of the UR in including agriculture in its agreement has become the primary source of efficiency gains from this sector. Prior to this agreement, trading economies could impose inefficient and costly barriers since the sector was not regulated under GATT or the WTO rules.
Apart from greater access to external markets, Indonesia should also benefit from its participation in the WTO because of pressure to impose internal discipline, for example by reducing domestic distortions in agriculture, refraining from imposing higher tariffs on the bound items committed in the WTO, and further reducing tariffs on the remaining sensitive and exempted items.6
6 The Indonesian government learned a lesson on the role of external WTO discipline in the PT Timor national car case. In 1996, the company, which was owned by former President Suharto's youngest son, had been given the special privilege of importing its components duty free as it had been designated a ‘national car’ and was going to achieve a certain percentage of local content within a specified period. The major WTO members, led by Japan, took the case to the WTO dispute settlement panel; Indonesia lost and was required to change the discriminatory treatment that had favoured PT Timor at the expense of other existing car manufacturers.
7
Asia Pacific Economic Cooperation. At this stage, economic cooperation under APEC (Asia Pacific Economic Cooperation) remains informal, in the sense that none of the decisions taken in APEC are made through a process of negotiations or are binding. APEC was created in 1989 in order to bring the countries of the Western Pacific closer to the Eastern Pacific region. In the wake of trade tensions between the US and Japan, there was serious concern over the possibility of trade conflicts occurring between the western and eastern sides of the Pacific Ocean. However, the main impetus for APEC came in 1993, with the first Leaders Meeting in Seattle providing a vision of free trade and investment in the region. In the following year Indonesia hosted the APEC meeting, contributing to the APEC process by setting the long-term goal of free and open trade and investment in the Asia Pacific region by 2010 for developed economies and 2020 for developing members. In 1994, the architecture of APEC was also introduced, namely the three pillars of trade and investment liberalization (TILF), trade and investment facilitation, and economic and technical cooperation (ECOTECH). The APEC non-binding investment principles, intended to ensure equal treatment between domestic and foreign investors regardless of origin, were introduced in the same year, andfor a country that has traditionally been nationalist and clearly saw foreign investment as a playing a supplementary roleIndonesia played a major role in ensuring that they were adopted. Their acceptance (in spite of their being non binding), was a major breakthrough for Indonesia and other APEC members.
The framework and action agenda for APEC-style liberalization, facilitation and cooperation were set in the following two years, 1995 and 1996. The APEC process did not adopt the preferential regional liberalization route, but instead envisaged a process of ‘unilateral concerted liberalization’, which means that members voluntarily undertake unilateral liberalization toward all countries, not just APEC members (i.e on a Most Favoured Nation basis). APEC contributes to the process through confidence building and peer pressure on all members to act similarly. The process relies on there being ‘champions’ who voluntarily undertake these unilateral liberalization efforts, and often the economy hosting the APEC meeting will take on the champion role. The APEC process clearly had an influence on the trade and investment liberalization that Indonesia undertook in 1994 and also in 1995.
Members are also asked to provide individual action plans annually to indicate the unilateral schedule of liberalization, facilitation and, more
8
recently, ECOTECH. The voluntary and non-binding nature of APEC has often been criticized as not amounting to much by way of pressure and discipline to undertake desirable trade liberalization and accompanying reforms. However, the experience of the mid 1990s shows that the APEC process had a role to play in confidence building and peer pressure to undertake concerted unilateral liberalization. An unmeasurable benefit of APEC is the extent of capacity and knowledge building regarding trade and investment liberalization and facilitation that occurs just through attendance at the meetings, interacting and having to come up with positions and principles in an informal, non-negotiating and non-binding setting.
APEC has also been seen as instrumental in acting as catalyst for the WTO. In 1993 the Informal APEC Leaders Meeting was purported to have served as a warning signal to Europe, leading to the possibility of discussions and compromises to overcome the deadlock in agriculture, which had been one of the main obstacles to the completion of the Uruguay Round. In 1996 APEC was also able to provide the critical mass to launch negotiations under the WTO that led to the Information Technology Agreement (ITA) to reduce tariffs on Information Technology products.7
ASEAN and AFTA. The Association of Southeast Asian Nations (ASEAN) has existed since 1967, but it was only in January 1992 that its members agreed to the formation of an ASEAN Free Trade Area (AFTA). Originally, 15 commodity groups were chosen to be on the fast track for tariff reduction,8 including sensitive agricultural commodities like vegetable oils. Under the fast track, products with tariffs greater than 20% have their tariffs immediately reduced to 20%, and to 0–5% within 10 years, while fast track products with tariffs at 20% or below have their tariffs reduced to 0–5% within seven years. To qualify for the CEPT (Common Effective Preferential Tariff), the goods must satisfy the ASEAN content requirement of 40%, referring to both single country and cumulative ASEAN content. It should be noted that unprocessed agricultural products were initially excluded.
7 Riding on the success of the ITA, there were further attempts to push sectoral liberalization under WTO through the Early Voluntary Sectoral Liberalization (EVSL) program. This was unsuccessful because EVSL was not suited to the APEC process. Negotiation of which sectors to include and what was to be included in each sector could not take place under the APEC umbrella, so this initiative has not taken off.
8 The fast track products are: vegetable oils, chemicals, fertilizers, rubber products, pulp and paper, wooden and rattan furniture, gems and jewellery products, cement, pharmaceuticals, plastics, leather products, textiles, ceramics and glass products, copper cathodes, and electronics.
9
Various factors, including the commitments under the UR, progress in APEC and unilateral liberalization, contributed to a process of acceleration and deepening of AFTA and ASEAN cooperation, with the timetable for tariff reductions being brought forward to 2002. This meant that for about 90% of tariff lines the tariff rates were to be 5% or less by 2000. Subsequently, tariff reductions on a number of additional products were also accelerated to 2000, which means that 88% of tariff lines were to be in the 0–5% tariff range by the year 2000.
The product coverage of the CEPT was broadened to include unprocessed agricultural products. This meant that by 2000 all goods were basically under CEPT coverage, the only exceptions being those classified under general exclusions. Unprocessed agricultural products were then categorized in either the inclusion (CEPT), temporary exclusion, or sensitive list. Items in the sensitive list were to be liberalized under a separate schedule, but it was intended to go beyond ASEAN’s commitments in agriculture under the WTO. Based on tentative lists, close to 70% were to be on the inclusion list. The temporary exclusion list was also to be phased into the inclusion list by 2003. There has been agreement that the sensitive list should be kept to a minimum; up to 2000 it comprised around 10% of the tariff lines in unprocessed agricultural products.
Despite accelerated progress recently, difficulties have been experienced in reaching agreement on the agricultural items that will be included in the temporary exclusion and sensitive lists, and on the time limit by which all items are phased into the inclusion list. At the ASEAN summit in 1995, for example, Indonesia reintroduced 15 agricultural products to its sensitive list that had earlier been in the temporary exclusion list. The majority of these products are items that were coordinated by BULOG, including rice, sugar, wheat flour and soybeans.
Indonesia's decision to postpone the liberalization of these 15 food items dominated the 10th AFTA Council meeting in Jakarta in September 1996. Indonesia, supported by the Philippines, refused to accept a 2010 deadline for including rice and sugar in the CEPT scheme. In addition to the sensitive list, Indonesia created a new list called the ‘very sensitive list’ and included these two items in that list. Indonesia and the Philippines demanded that the 2010 deadline be pushed back by 10 years. On the other side, Thailand insisted that all unprocessed agricultural commodities be phased into the scheme by 1
10
January 2003 and be totally liberalized by 2010. By the end of the meeting, it was agreed that the liberalization of the sensitive agricultural commodities will begin in January 2003 and end in 2010, but that Indonesia and the Philippines would be allowed some flexibility on the ending tariff rates and utilization of safeguards (i.e. temporary protection measures) in 2010. With such flexibility, Indonesia can still maintain import tariffs on rice and sugar above 5% after 2010 and introduce safeguard measures intended to protect domestic producers.
Apart from the setback in agricultural liberalization, a discipline was also introduced into the use of temporary exclusion lists, with the requirement that all goods that had been temporarily excluded from tariff reductions be phased into the CEPT by 1 January 2001. Products in the temporary exclusion list were to be transferred to the inclusion list in five equal instalments of 20% beginning 1 January 1996. There have also been indications of further broadening, especially to include new issues that have been included in the WTO such as services, investment, and intellectual property rights.
Furthermore, progress has been made in customs harmonization, including the implementation of a ‘green lane’, or no custom inspection, for CEPT products to speed up customs clearance of shipments. The target for tariff nomenclature was to be harmonized at HS8-digit level by 1997, the GATT valuation system was adopted in 1997, and an ASEAN Agreement on Customs was drafted to strengthen the commitment to customs harmonization.
Finally, there was a widening of ASEAN membership. Vietnam became the seventh member in July, 1995 after agreeing to grant MFN and national treatment to ASEAN member countries and to promote transparency in its trade regime. Vietnam was allowed to accede to AFTA immediately, although with flexible terms whereby it had a time frame of 10 years (1996-2006) to reduce tariffs, Vietnam offered to reduce tariffs on 857 lines—28% of the total—upon its entry to the CEPT scheme on 1 January 1996. At the December 1996 Summit, it was agreed to include Cambodia, Laos and Myanmar in ASEAN. In the Ministerial Meeting in July 1997, Laos and Myanmar were formally admitted to become the eighth and ninth members. However, the admission of Cambodia at the time was postponed due to the political turmoil in the region. Finally, in December 1998, at the Sixth ASEAN Summit, ASEAN
11
leaders decided to allow Cambodia to enter, and in April 1999 it was formally accepted as the tenth member.
In addition to the decision to accept Cambodia as a member, the Sixth ASEAN Summit in Hanoi also adopted The Hanoi Plan of Action (HPA), a document that was drafted to realize ‘the ASEAN Vision 2020’. ASEAN Vision 2020 is a document describing an ideal form of cooperation among Southeast Asian nations, adopted in the Second ASEAN Informal Summit held in Kuala Lumpur on December 1997. Among the topics discussed in the HPA is AFTA. In the document, ASEAN leaders agree to accelerate the implementation of AFTA by maximizing the number of tariff lines whose CEPT tariff rates shall be reduced to 0-5% by the year 2000 (2003 for Vietnam and 2005 for Laos and Myanmar). This means that by January 2000, more than 85% of products will have 0–5% tariffs. The leaders also agreed to maximize the number of tariff lines whose CEPT tariff rates were to be reduced to 0% by 2003 (2006 for Vietnam and 2008 for Laos and Myanmar).
Despite these bold measures, some ASEAN members were reluctant to open up their markets fully. Malaysia, for instance, wanted to delay the implementation of tariff cuts that were due to commence in 2000. Particularly, Malaysia would like to exempt motor vehicles from the inclusion list of sectors to be liberalized next year. Nevertheless, AFTA members, as a group, seemed to be intent upon liberalizing the region. In the joint statement from the AFTA Council meeting, ASEAN economic leaders plan to eliminate import duties on all products by 2015 for the six original ASEAN members (Brunei Darussalam, Indonesia, Malaysia, Philippine, Singapore, and Thailand) and by 2018 for the newer members (Laos, Myanmar, Vietnam, and Cambodia). As an interim measure, ASEAN countries were to reduce tariffs on 60% of their products to 0% by the year 2003.9
Comparing the Processes of Liberalization
The most effective process of liberalization is unilateral. However, from Indonesia's experience, regional commitments and efforts have complemented the unilateral process. The multilateral process under the WTO has been important in placing some discipline on the types of trade and
9 Joint Press Statement of the 13th Meeting of the AFTA Council, 29 September 1999 in Singapore. Can be obtained in http://www.asean.or.id/summit/
12
investment policies that a country like Indonesia could use. It has helped to keep the unilateral liberalization process on track and has imposed a discipline on a mutually agreed set of multilateral rules of the game.
In pursuing their liberalization goals, APEC, WTO, and AFTA utilize different approaches. The WTO uses a legalistic approach in which a liberalization agreement is legally binding and signatories face potential sanctions if they fail to implement their commitments. APEC promoted liberalization by adopting ‘concerted unilateral liberalization’. In essence, this mechanism allowed APEC economies to achieve the goal decided in the 1994 Bogor Meeting – free and open trade and investment by 2010 for developed economies, and 2020 for developing economies – through unilateral liberalization plans or Individual Action Plans (IAPs). These IAPs can be implemented according to each economy’s domestic policy objectives and would be reviewed jointly by all APEC members in order to achieve the Bogor targets. On the surface, AFTA looks like the WTO in the sense that its members have jointly set and committed to the tariff reduction scheme leading to a common tariff level within a certain period of time. It is supposed to be a binding commitment, but unlike the WTO, it is not clear what the sanctions are from violating the AFTA commitments. Therefore it plays a much weaker disciplining role.
The voluntary mechanism of APEC was deemed best at the time, given the initial resistance from the Asian members to the more legalistic approach.10 One of the arguments was the fact that it would take years to change APEC into a negotiating body such as the WTO, and that would mean losing the momentum provided by the Bogor Declaration. The voluntary mechanism had so far been successful in pushing for tariff liberalization towards the Bogor target. However, the challenge now is how to push this process along.
In terms of tariff reductions, WTO, APEC and AFTA have different targets. In terms of average tariff, the Bogor goal of APEC for example allowed a more rapid tariff reduction than the UR commitments among APEC member economies11. As such, all individual APEC economies are well on track of
10 This resistance against making APEC more formal can be seen from the original understanding that APEC would not be institutionalized into a negotiating body like the WTO.
11 See PECC (1995), Pangestu, Findlay, Intal, and Parker (1996), Yamazawa (1997), Pangestu and Stephenson (1996).
13
going towards the Bogor goal. Their tariff reductions are, for the most part, faster and deeper than their UR commitments.
Table 1. Comparing the WTO, APEC and AFTA
WTO APEC AFTA Nature of the agreement
Formal negotiations and binding commitments; clear sanctions and dispute settlement mechanism
Voluntary; Concerted unilateral liberalization
Formal negotiations and binding commitments; sanctions and dispute settlement mechanism are unclear
Regional Coverage
Worldwide Regional (18 original, plus 3 new members)
Regional (6 original plus 4 new members)
Sectoral Coverage
Explicit on sectors such as agriculture, textiles and clothing, and services
The Bogor goal is not sector specific. The sectoral EVSL approach failed to materialize.
Little progress in sensitive sectors such as agriculture and motor vehicles.
Trade Liberalization Measures
Applied by and to all WTO members, different speed of reduction for developed and developing country members Reductions and binding of border tariffs, export subsidy, and domestic support. Tariffication of NTBs, especially for the agricultural and textiles and clothing sectors.
Open liberalism based on MFN (Most Favored Nation) basis. Average tariff reductions only. For the most part, tariff reduction through the Bogor Declaration is faster than under the UR.
Creation of preferential trading agreement among members Mostly tariff reductions, incorporated in the CEPT scheme. Slower speed of reduction for the new 4 ASEAN members
Compared with the WTO and APEC, AFTA is more far reaching in terms of tariff reductions, since the targeted 0–5% tariffs will be achieved sooner than would be the case under the other two schemes. However unlike WTO commitments and voluntary unilateral liberalization under APEC, tariff reduction under AFTA is only applicable to the AFTA member economies. In reality however, due to rapid progress in unilateral liberalization in each of the AFTA member economies, the difference between the preferential AFTA
14
tariff and the MFN tariff for non AFTA economies is small so that the percentage of intra ASEAN trade conducted at the preferential AFTA tariff is very small (Soesastro, 2001).
The WTO is more comprehensive than either AFTA or APEC, however, if one goes beyond tariff liberalization. AFTA and APEC concentrate mostly on tariff reduction, while under the WTO, there is already the commitment to eliminate domestic distortions, non-tariff barriers, dumping, and even other possible discriminatory actions. Furthermore, unlike the WTO, there is no clear agenda for agricultural liberalization under AFTA. Another important difference between the WTO, and AFTA and APEC, as mentioned already, is that given its binding nature, the WTO is more effective in ensuring that the liberalization and reforms undertaken under its commitments remain on track.
MODELLING TRADE LIBERALIZATION
The impact of international trade liberalization on Indonesia’s economy in this paper is modeled using a global computable general equilibrium (CGE) model known as the Global Trade Analysis Project (GTAP)12. GTAP relies on a frequently updated database. This study uses the third version of the database, for two reasons. First, the tariff lines in version 3 of the database are based on 1994 data and therefore are more realistic in representing the situation when the UR and other regional arrangements were launched in the early 1990s. Tariff rates in version 4 of the database (based on 1996 data) are much lower than those in version 3, partly because of rapid worldwide tariff reductions between 1993 and 1996 due to the UR commitments made in 1994. Therefore it was decided to apply the tariff reduction committed in 1994 on 1994 tariff data, rather than 1996 data, to capture the real impact of UR liberalization. Second, the GTAP database version 3 has a built-in calculated tariff reduction between pre- and post- UR tariffs, so that the impact of UR tariff reductions can be modeled more precisely.
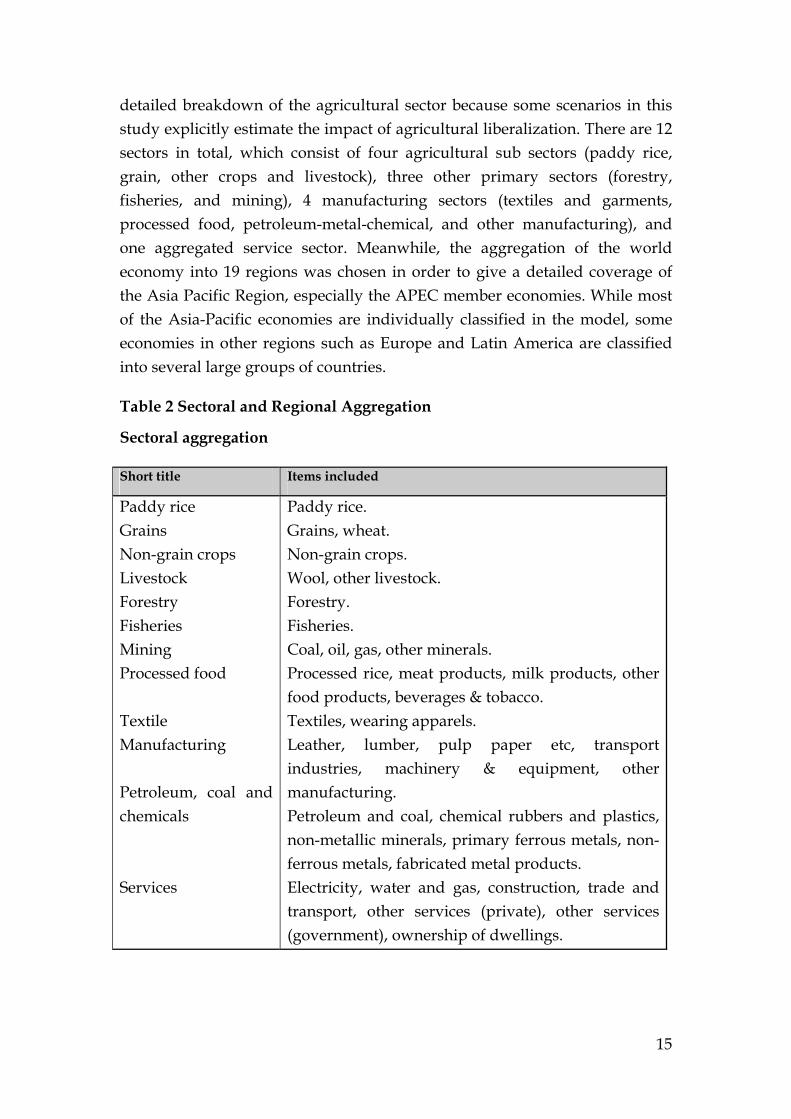
To model the impact of trade liberalization in this global CGE model, the world economy is aggregated into 19 regions and 12 commodities. Table 2 presents the complete sectoral and regional aggregations from the original 30 regions and 37 commodities. The sectoral aggregation selected uses a more
12 Full documentation of the model and data can be found in Hertel(1997)
15
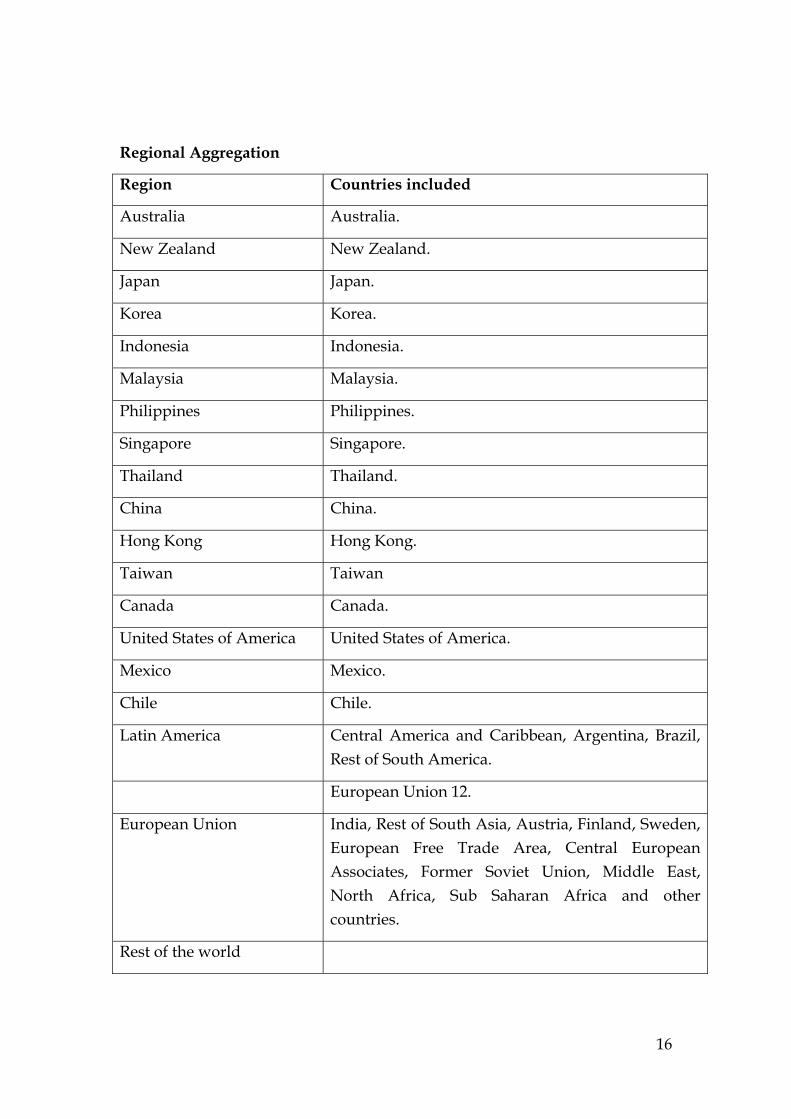
detailed breakdown of the agricultural sector because some scenarios in this study explicitly estimate the impact of agricultural liberalization. There are 12 sectors in total, which consist of four agricultural sub sectors (paddy rice, grain, other crops and livestock), three other primary sectors (forestry, fisheries, and mining), 4 manufacturing sectors (textiles and garments, processed food, petroleum-metal-chemical, and other manufacturing), and one aggregated service sector. Meanwhile, the aggregation of the world economy into 19 regions was chosen in order to give a detailed coverage of the Asia Pacific Region, especially the APEC member economies. While most of the Asia-Pacific economies are individually classified in the model, some economies in other regions such as Europe and Latin America are classified into several large groups of countries.
Paddy rice. Grains, wheat. Non-grain crops. Wool, other livestock. Forestry. Fisheries. Coal, oil, gas, other minerals. Processed rice, meat products, milk products, other food products, beverages & tobacco. Textiles, wearing apparels. Leather, lumber, pulp paper etc, transport industries, machinery & equipment, other manufacturing. Petroleum and coal, chemical rubbers and plastics, non-metallic minerals, primary ferrous metals, non-ferrous metals, fabricated metal products. Electricity, water and gas, construction, trade and transport, other services (private), other services (government), ownership of dwellings.
16
Regional Aggregation
Region Countries included
Australia Australia.
New Zealand New Zealand.
Japan Japan.
Korea Korea.
Indonesia Indonesia.
Malaysia Malaysia.
Philippines Philippines.
Singapore Singapore.
Thailand Thailand.
China China.
Hong Kong Hong Kong.
Taiwan Taiwan
Canada Canada.
United States of America United States of America.
Mexico Mexico.
Chile Chile.
Latin America Central America and Caribbean, Argentina, Brazil, Rest of South America.
European Union 12.
European Union India, Rest of South Asia, Austria, Finland, Sweden, European Free Trade Area, Central European Associates, Former Soviet Union, Middle East, North Africa, Sub Saharan Africa and other countries.
Rest of the world
17
We model a range of trade liberalisation approaches. The idea is to simulate what would happen if each approach was followed, and what would happen if the existing agreements were expanded to include the agricultural sector. Initially we consider the impact of full implementation by all countries of the UR. This serves as a benchmark for results from other simulations, because almost every economy participates, and because the UR import tariff reductions are smaller than the commitments under APEC and AFTA. In other words, the UR scenario is the minimum liberalization scheme that every region (other than China and Taiwan) has committed to.
In accordance with the UR commitments, four different shocks are applied:
(i) domestic tax and/or subsidy reductions in the agricultural sub-sectors by 20% in developed countries and 13% in developing countries;
(ii) agricultural export tax or subsidy reduction by 36% in developed countries and 24% in developing countries;
(iii) border tariff reductions, both in agricultural and non-agricultural commodities. The reductions for these border tariffs are calculated using the pre- and post-UR tariff data available in the GTAP version 3 database;
(iv) elimination of MFA quotas by cutting the export tariff equivalent of the quota, which is also provided by the GTAP data.
Note that in all scenarios, there is no trade liberalization in services. In other words, there is no shock applied to services sector.
The first of the remaining trade policy scenarios assumes full implementation of the UR elsewhere plus unilateral liberalization by Indonesia, such that the tariff reduction goes further, setting a 5% across the board import tariff on both agricultural and non-agricultural commodities. The second such scenario simulates the impact of AFTA in combination with the UR. The first variant of this scenario excludes liberalization of the agriculture sector (simply following the UR commitments), while the second includes it.
Whereas the UR includes reductions of domestic distortions, export taxes and import tariffs, AFTA only requires reductions of import tariffs, although these are much greater. Meanwhile, compared with APEC, AFTA’s schedule for tariff reductions and the implementation of the free trade zone in 2003 is faster than APEC’s, with its end dates of 2010 and 2020. However, in terms of
18
coverage, AFTA is more restrictive because tariff reductions are applied only to intra-ASEAN trade, while tariffs on imports from non-ASEAN members are maintained.
To model the combined impact of UR and AFTA trade liberalization, domestic subsidy and export tax reductions in agriculture are applied in accordance with the UR commitments, while import tariff reductions follow the AFTA scheme. Border tariffs between ASEAN member economies are reduced to zero, while tariffs between ASEAN and non-ASEAN economies are maintained at the level committed for the UR. In other words, the model simulates the formation of ASEAN as a free trade area that maintains some trade barriers against non-ASEAN member economies.
The third scenario is a combination of the UR and APEC schemes, focusing on the contribution of APEC to regional economies if it were to be applied in addition to the UR commitments. Similar to the first AFTA scenario, reductions in domestic and export subsidies in agriculture are applied in accordance with the UR commitments, while import tariff reductions are calculated based on the APEC commitments: the Bogor goal of achieving zero-tariffs in 2010 for developed, and 2020 for developing, economies of APEC.13 Since GTAP is a static model, this study more specifically models the outcome in 2010 when all tariffs of developed economies in APEC are assumed to be zero, while those in APEC’s developing economies are assumed to be 5%. As before, the first variant of this scenario excludes liberalization of the agriculture sector (simply following the UR commitments), while the second includes it. Unlike AFTA, under which only intra-ASEAN tariffs are reduced, tariff reductions by all APEC member economies are applied on a Most Favored Nation (MFN) basis, in line with the open regionalism spirit of APEC.
13 The Bogor Declaration specifies that free trade and investment in the region should be achieved by 2010 for developed economies and 2020 for developing economies without defining specifically what this implies. Thus far economies it seems that the accepted norm is for each economy to translate what the Bogor targets means for their economy.
19
RESULTS Welfare
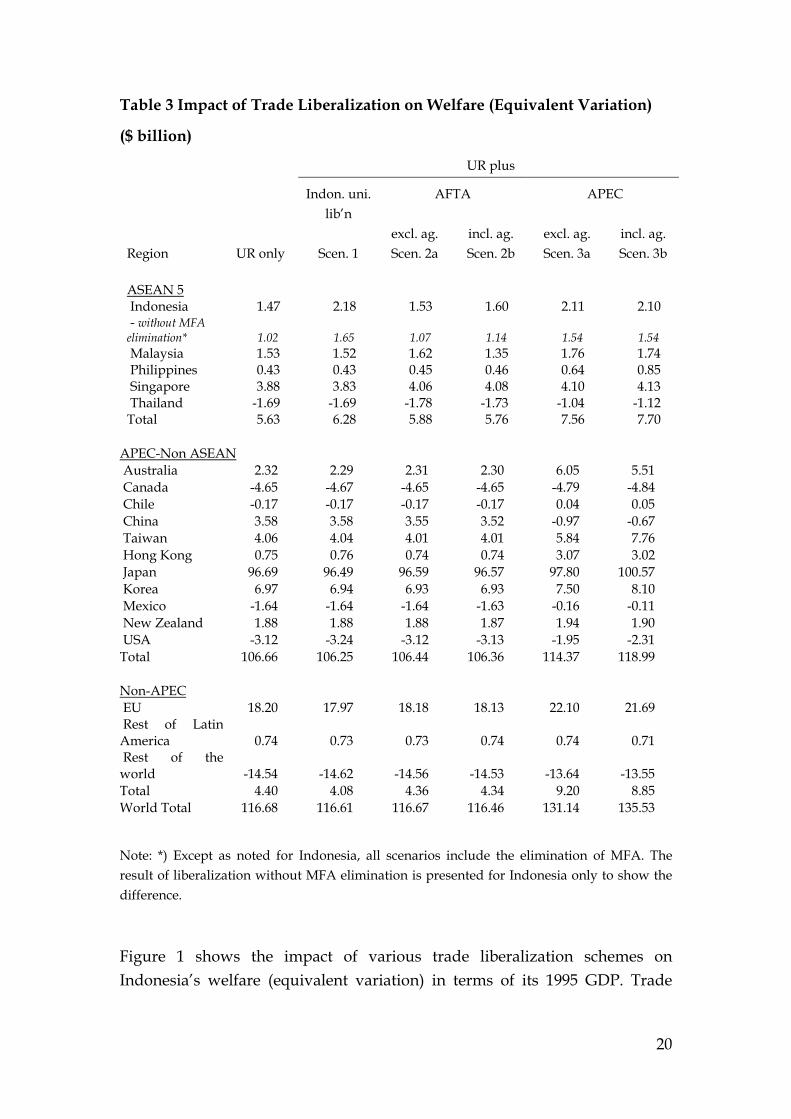
The CGE approach permits a comparison of the effects of different trade liberalization scenarios on the economy.14 The impact of trade liberalization under the various scenarios on welfare, measured as the value of equivalent variation,15 is presented in Table 3. The effects should be interpreted as welfare changes (increases or decreases) compared with the case without any trade liberalization. To compare the welfare gains between different economies, these gains are expressed relative to GDP in Figures 1, 2 and 3. The results in general confirm the conventional wisdom that a more liberal trade regime leads to bigger welfare gains. Broader country participation, larger tariff reductions, and wider sectoral coverage also enhance the benefit of trade liberalization.
The welfare gain to Indonesia as a result of participating in the UR is estimated at about $1.5 billion (Table 3).16 A significant part of this gain comes from the elimination of the MFA quotas: without this, the estimated welfare gain would be only about $1 billion.17 The gain would increase significantly, to around $2.2 billion, if Indonesia decided unilaterally to reduce all of its tariffs to 5%. In other words, by unilaterally liberalizing trade, the potential welfare gain increases by more than one third. The gain from UR liberalization plus participation in APEC—around $2.1 billion—is roughly the same as that from unilateral liberalization. By contrast, the benefit from participation in AFTA, over and above the benefits from UR liberalization, is negligible.
14 The effect of a shock (such as trade liberalization) on the economic equilibrium depends on various assumptions such as functional forms and behavioral parameters used in the model.
15 Equivalent Variation is the amount of money that would have to be given to the consumer when he/she faces the initial price, to make him/her as well off as he/she would be facing the new price with his/her initial income. It is the change in income that would be equivalent to the price change in terms of its welfare impact.
16 This gain is larger than Feridhanusetyawan (1997) and Erwidodo and Feridhanusetyawan (1997), who used the earlier version of the GTAP database and assumed a smaller degree of tariff reduction.
17 The five scenarios were re-simulated assuming the MFA remains in place. Full details are not reported here, except for Indonesia (Table 3 and Figure 1).
20
Table 3 Impact of Trade Liberalization on Welfare (Equivalent Variation)
APEC-Non ASEAN Australia 2.32 2.29 2.31 2.30 6.05 5.51 Canada -4.65 -4.67 -4.65 -4.65 -4.79 -4.84 Chile -0.17 -0.17 -0.17 -0.17 0.04 0.05 China 3.58 3.58 3.55 3.52 -0.97 -0.67 Taiwan 4.06 4.04 4.01 4.01 5.84 7.76 Hong Kong 0.75 0.76 0.74 0.74 3.07 3.02 Japan 96.69 96.49 96.59 96.57 97.80 100.57 Korea 6.97 6.94 6.93 6.93 7.50 8.10 Mexico -1.64 -1.64 -1.64 -1.63 -0.16 -0.11 New Zealand 1.88 1.88 1.88 1.87 1.94 1.90 USA -3.12 -3.24 -3.12 -3.13 -1.95 -2.31 Total 106.66 106.25 106.44 106.36 114.37 118.99 Non-APEC EU 18.20 17.97 18.18 18.13 22.10 21.69 Rest of Latin America 0.74 0.73 0.73 0.74 0.74 0.71 Rest of the world -14.54 -14.62 -14.56 -14.53 -13.64 -13.55 Total 4.40 4.08 4.36 4.34 9.20 8.85 World Total 116.68 116.61 116.67 116.46 131.14 135.53
Note: *) Except as noted for Indonesia, all scenarios include the elimination of MFA. The result of liberalization without MFA elimination is presented for Indonesia only to show the difference.
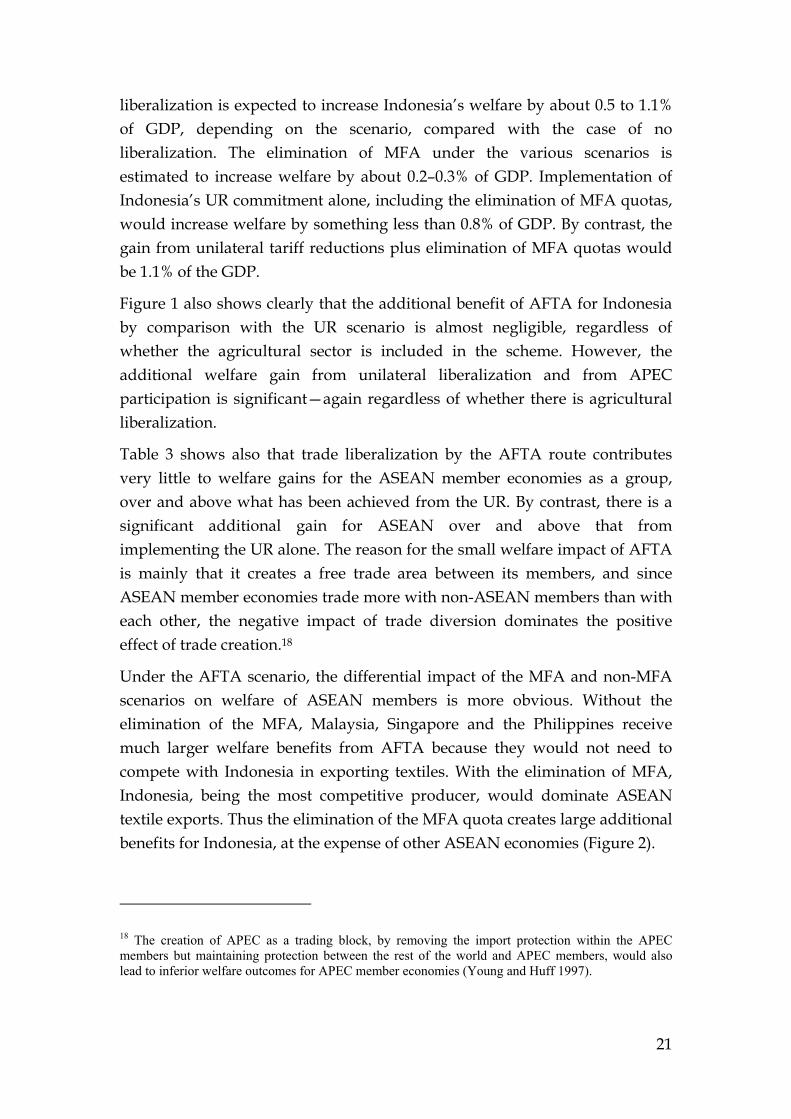
Figure 1 shows the impact of various trade liberalization schemes on Indonesia’s welfare (equivalent variation) in terms of its 1995 GDP. Trade
21
liberalization is expected to increase Indonesia’s welfare by about 0.5 to 1.1% of GDP, depending on the scenario, compared with the case of no liberalization. The elimination of MFA under the various scenarios is estimated to increase welfare by about 0.2–0.3% of GDP. Implementation of Indonesia’s UR commitment alone, including the elimination of MFA quotas, would increase welfare by something less than 0.8% of GDP. By contrast, the gain from unilateral tariff reductions plus elimination of MFA quotas would be 1.1% of the GDP.
Figure 1 also shows clearly that the additional benefit of AFTA for Indonesia by comparison with the UR scenario is almost negligible, regardless of whether the agricultural sector is included in the scheme. However, the additional welfare gain from unilateral liberalization and from APEC participation is significant—again regardless of whether there is agricultural liberalization.
Table 3 shows also that trade liberalization by the AFTA route contributes very little to welfare gains for the ASEAN member economies as a group, over and above what has been achieved from the UR. By contrast, there is a significant additional gain for ASEAN over and above that from implementing the UR alone. The reason for the small welfare impact of AFTA is mainly that it creates a free trade area between its members, and since ASEAN member economies trade more with non-ASEAN members than with each other, the negative impact of trade diversion dominates the positive effect of trade creation.18
Under the AFTA scenario, the differential impact of the MFA and non-MFA scenarios on welfare of ASEAN members is more obvious. Without the elimination of the MFA, Malaysia, Singapore and the Philippines receive much larger welfare benefits from AFTA because they would not need to compete with Indonesia in exporting textiles. With the elimination of MFA, Indonesia, being the most competitive producer, would dominate ASEAN textile exports. Thus the elimination of the MFA quota creates large additional benefits for Indonesia, at the expense of other ASEAN economies (Figure 2).
18 The creation of APEC as a trading block, by removing the import protection within the APEC members but maintaining protection between the rest of the world and APEC members, would also lead to inferior welfare outcomes for APEC member economies (Young and Huff 1997).
22
Figure 1. Welfare Impact of Trade Liberalization: Indonesia
Welfare Impact of Trade Liberalization: Indonesia
0.0
0.2
0.4
0.6
0.8
1.0
1.2
Uruguay Round(Base Scenario)
UR + IndonesiaUnilateral Lib.(Scenario 1)
UR - AFTAExcluding
Agriculture(Scenario 2)
UR - AFTAIncluding
Agriculture(Scenario 3)
UR - APECExcluding
Agriculture(Scenario 4)
UR - APEC,Including
Agriculture(Scenario 5)
perc
ent o
f 199
5 G
DP
With MFA Elimination Without MFA Elimination
Figure 2. Welfare Impact of Trade Liberalization: Other ASEAN members
Welfare Impact of Trade Liberalization: Other ASEAN Members
0.0
0.2
0.4
0.6
0.8
1.0
1.2
1.4
1.6
Uruguay Round(Base Scenario)
UR + IndonesiaUnilateral Lib.(Scenario 1)
UR - AFTAExcluding
Agriculture(Scenario 2)
UR - AFTAIncluding
Agriculture(Scenario 3)
UR - APECExcluding
Agriculture(Scenario 4)
UR - APEC,Including
Agriculture(Scenario 5)
perc
ent o
f 199
5 G
DP
With MFA Elimination Without MFA Elimination
Note: Calculated as aggregate equivalent variation divided by aggregate GDP for Malaysia, Singapore, Philippine, and Thailand.
23
The inclusion of the agricultural sector in the AFTA liberalisation scenario results in a slight reduction in the aggregate welfare gain for all ASEAN members. There is some additional benefit to Indonesia, which becomes the major agricultural exporting country in ASEAN as a consequence of becoming more competitive in agriculture relative the other members. The gains to Malaysia become noticeably smaller due to trade diversion, while the other members are largely unaffected. That is, AFTA makes it cheaper for other ASEAN economies to import agricultural products from Indonesia due to the maintenance of high tariffs against more efficient non-ASEAN producers.
The additional benefit from implementing APEC in addition to the UR is much larger than from implementing AFTA. For Indonesia, the additional gain would be about $0.64 billion, equivalent to about 43% of the gain from the UR alone. The aggregate additional welfare gain for the five ASEAN member economies would be about $2 billion. For the non-ASEAN APEC economies, the total welfare gain from implementing the UR would be around $107 billion, but if APEC is implemented as well the gain would increase to $114 billion ($119 billion if agricultural liberalisation is included). The impact of this liberalization scenario for non-APEC economies is also positive, but much smaller.
Larger tariff reductions in agricultural products through APEC, beyond what has been committed through the WTO, would benefit net importers of agricultural products. The inclusion of agriculture in tariff reductions through APEC would increase welfare in Japan, Taiwan, and Korea, while the total benefit for the APEC economies overall would be relatively small. The gain from agricultural liberalization comes mostly from the UR, especially in the form of reductions in domestic distortions.
Figure 3 compares the welfare effects of trade liberalization in terms of 1995 GDP among the Asia Pacific economies. The result shows that the implementation of the UR would lead to positive welfare gains for most economies, even including China and Taiwan, which have not participated in the UR. The welfare gains from participating in the URcome mostly from the increase in efficiency as a result of greater market access and reduced distortions in the economy, mainly in terms of reductions of border tariffs in all sectors, and other domestic distortions in the agricultural sector as required by the UR scheme.
24
Figure 3. Impact of Trade Liberalization on Welfare in Asia-Pacific Economies (UR and UR+APEC)
Welfare Impact of Trade Liberalization: UR and UR+APEC
-2
-1
0
1
2
3
4
5
6
7
Indo
nesia
Mala
ysia
Phil
ippine
s
Sing
apore
Tha
iland
Aus
tralia
Can
ada
Chil
e
Chin
a
Taiw
an
Hon
g Kon
g
Jap
an
Kore
a
Mex
ico
New
Zealan
d U
SA E
U
Res
t of L
atin A
merica
Res
t of th
e worl
d
perc
ent o
f 199
5 G
DP
UR Scenario UR+APEC Scenario (Inc. agriculture)
One clear pattern from Figure 3 is the significant contribution of APEC to welfare, in addition to that from the UR. Measured as a percentage of their GDP, small open economies like Singapore, Hong Kong, Taiwan, and New Zealand tend to get the highest benefit from trade liberalization. Welfare in Singapore is expected to increase by 6% of GDP, while those of Hong Kong, Taiwan, Zealand are around 3%. The gain for Singapore is larger than for other countries because its trade is much larger relative to GDP. For example, the value of Singapore exports is about the same as GDP. The gain for China is small because in this study China is not yet included in the WTO in this scenario. While Taiwan is in the same position as China with respect to WTO accession, the gain for Taiwan is quite large because it has been more open and has liberalized its economy as if it were in the WTO.
Figure 3 also shows that the welfare gains from the UR and APEC for some countries, like Thailand, Canada and Mexico are negative.19 Decomposition analysis of the changes in welfare can be conducted to explain these results. In
19 Implementation of APEC roughly offsets the losses to Mexico from the UR.
25
a CGE model there are several potential sources of welfare change from trade liberalization. Following Huff and Hertel (1996), welfare changes can be disaggregated into three components: allocative efficiency effects, terms of trade effects, and marginal utility of income effects. Allocative efficiency effects are generally positive, so that trade liberalization improves efficiency of resource allocation within the domestic economy. On the other hand, the terms of trade—the relative price of exports over imports—may improve or deteriorate, depending on a country’s own and other countries’ liberalization. If the change in the terms of trade is negative and relatively large, then there is a possibility that the welfare loss from the deteriorating terms of trade might dominate the benefit from increasing the efficiency of domestic resource allocation. Finally, the assumption in the model of non-homothetic household preferences results in changes in consumption patterns when income changes, depending on whether goods are superior or inferior. When policy shocks lead to increases (decreases) in household income, the proportion of income spent on inferior (superior) goods decreases (increases), implying more (less) income available for all other goods, and creating additional positive (negative) effects on welfare. In the case of homothetic preferences, there is no additional welfare effect from the changes in marginal utility of income, because consumption patterns do not change.20
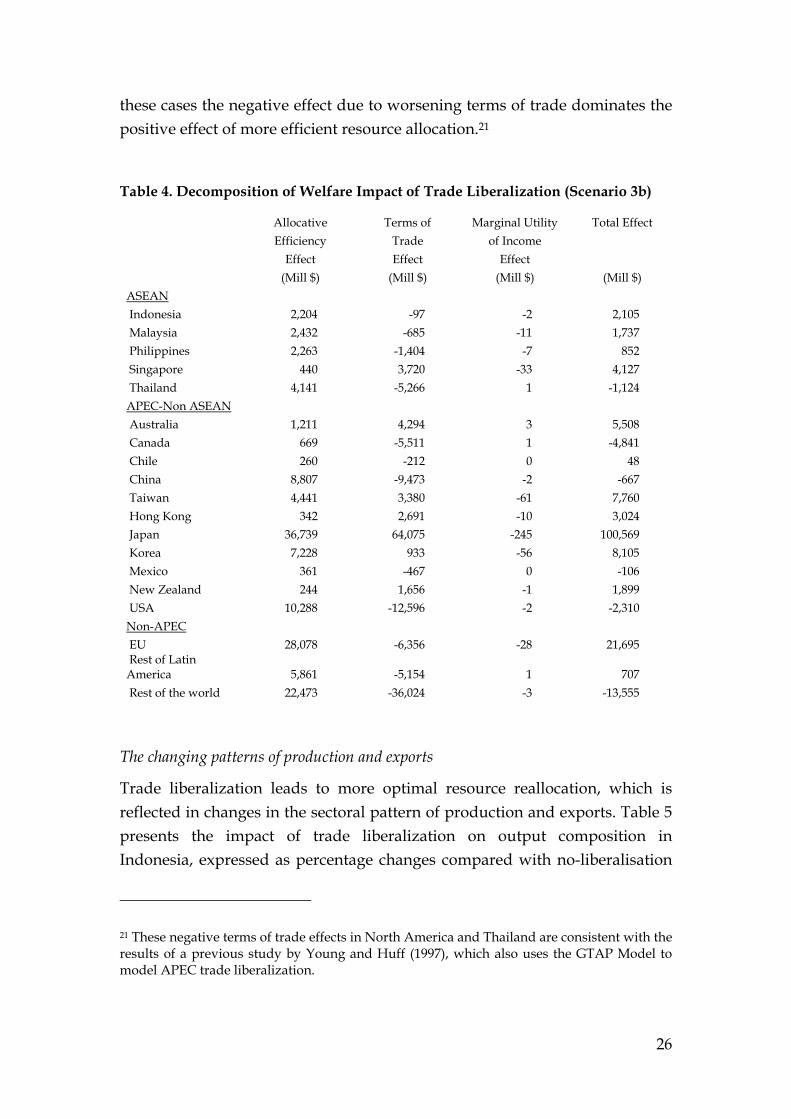
Table 4 presents the decomposition of welfare effects based on the results of trade liberalization scenario 3a (UR plus APEC, including agriculture). For most of the countries, the results show that changes in welfare are mostly dominated by allocative efficiency and terms of trade effects; the contribution from the change in marginal utility is negligible. For Indonesia, however, the decomposition of welfare effects shows that the welfare gain for Indonesia comes mostly from better resource allocation while the contribution of the terms of trade and the marginal utility of income are small. The decomposition of welfare effects also provides some explanation for the small welfare impact of trade liberalization in some cases—for example, Thailand, Canada, the United States and China. Based on the simulation results, trade liberalization would lead to worsening terms of trade in those economies. In
20 A detailed technical derivation of the welfare decomposition can be found in Huff and Hertel (1996).
26
these cases the negative effect due to worsening terms of trade dominates the positive effect of more efficient resource allocation.21
Table 4. Decomposition of Welfare Impact of Trade Liberalization (Scenario 3b)
Allocative Terms of Marginal Utility Total Effect Efficiency Trade of Income Effect Effect Effect (Mill $) (Mill $) (Mill $) (Mill $) ASEAN Indonesia 2,204 -97 -2 2,105 Malaysia 2,432 -685 -11 1,737 Philippines 2,263 -1,404 -7 852 Singapore 440 3,720 -33 4,127 Thailand 4,141 -5,266 1 -1,124 APEC-Non ASEAN Australia 1,211 4,294 3 5,508 Canada 669 -5,511 1 -4,841 Chile 260 -212 0 48 China 8,807 -9,473 -2 -667 Taiwan 4,441 3,380 -61 7,760 Hong Kong 342 2,691 -10 3,024 Japan 36,739 64,075 -245 100,569 Korea 7,228 933 -56 8,105 Mexico 361 -467 0 -106 New Zealand 244 1,656 -1 1,899 USA 10,288 -12,596 -2 -2,310 Non-APEC EU 28,078 -6,356 -28 21,695 Rest of Latin America 5,861 -5,154 1 707 Rest of the world 22,473 -36,024 -3 -13,555
The changing patterns of production and exports
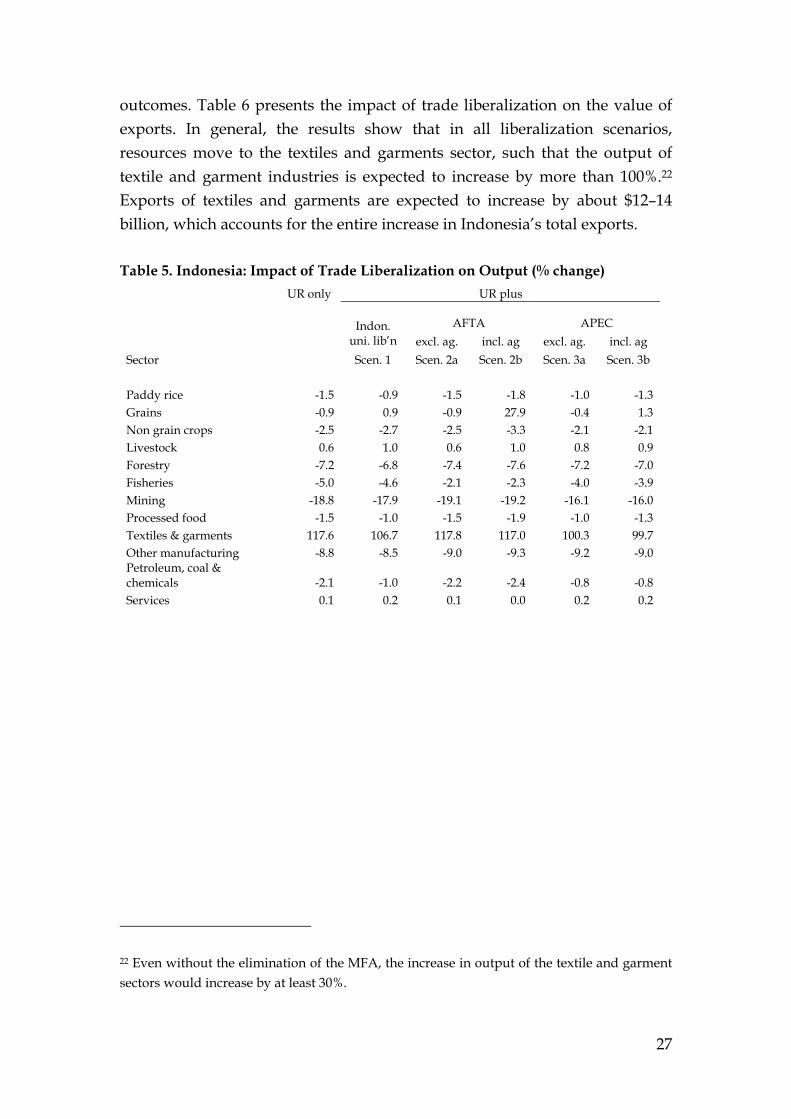
Trade liberalization leads to more optimal resource reallocation, which is reflected in changes in the sectoral pattern of production and exports. Table 5 presents the impact of trade liberalization on output composition in Indonesia, expressed as percentage changes compared with no-liberalisation
21 These negative terms of trade effects in North America and Thailand are consistent with the results of a previous study by Young and Huff (1997), which also uses the GTAP Model to model APEC trade liberalization.
27
outcomes. Table 6 presents the impact of trade liberalization on the value of exports. In general, the results show that in all liberalization scenarios, resources move to the textiles and garments sector, such that the output of textile and garment industries is expected to increase by more than 100%.22 Exports of textiles and garments are expected to increase by about $12–14 billion, which accounts for the entire increase in Indonesia’s total exports. Table 5. Indonesia: Impact of Trade Liberalization on Output (% change)
UR only UR plus
AFTA APEC
Indon. uni. lib’n excl. ag. incl. ag excl. ag. incl. ag
In the agricultural sector, the output of paddy rice and non-grain crops is expected to decline by 0.9 (Scen. 1) to 1.8% (Scen. 2b),, while that of other grains (such as corn and soybean) is expected to increase with agricultural liberalization through AFTA. With the inclusion of agriculture in AFTA, Indonesia becomes a major grain producer in ASEAN, and its grain sector output is expected to increase by about 28%. Under this liberalization scheme (scenario 2b), Indonesia’s annual grain exports are expected to increase by $271 million. Exports of agricultural commodities from traditional agricultural exporters such as Australia and the US to ASEAN would decline when import tariffs for agricultural exports from other ASEAN economies are reduced under AFTA. To a lesser extent, a similar trend is expected in the livestock sector, the output of which is expected to increase by 0.6 to 1%. Exports are expected to increase by $47 million in liberalization scenario 2b and by about $23–27 million in other scenarios.
By looking at the results of all scenarios in Table 5 and 6, the output of the mining sector in Indonesia is estimated to decline by about more than 16% while exports are expected to decline by about $2.4–2.7 billion with trade
29
liberalization. Similar trends are observed in many other Asian countries. In almost all Asia-Pacific countries, both output and exports of the mining sector tend to decline, while imports tend to increase. In contrast, output and exports of mining from the US, Canada, Latin America and the Rest of the World are expected to increase.
The study finds that in all scenarios, labor and capital in Indonesia tend to move, in particular, to the textile and garment industries, bearing in mind that factor inputs are assumed to be identical across sectors. In the agricultural sector, the use of land tends to shift from paddy rice to grain crops and livestock. The shift of resources out of the mining, forestry, and fisheries sectors, for example, causes the decline in production in those sectors. The model assumes that labor and capital, as primary inputs, are immobile between countries/regions. Thus in moving to the new equilibrium in a certain scenario, wages and the rental price of capital inputs are expected to increase by about 7.5–8.1% and 6.3–6.5%, respectively, in real terms [in which countries?].
Trade liberalization has the potential to [it doesn’t necessarily do this] lead to more optimal patterns of trade among regions, and it is not surprising that Indonesia’s exports increase in all liberalization scenarios considered here, by 29–37%. The trade balance [this is ambiguous. Do you mean the trade deficit, or surplus?] is expected to increase by $433 million to $454 million, depending on the scenario. In other words, both exports and imports are expected to increase, but the increase in exports is greater. In the GTAP model the change in each country’s trade balance is equal to the change in the balance between saving and investment [is this right?] in that country. A higher trade balance means that the change in saving is larger than the changes in investment in terms of magnitude.23
It is interesting to note that the increase in Indonesia’s exports under UR plus AFTA liberalization is expected to be larger than that of UR plus APEC. This is reflected in the larger exports of Indonesia’s manufacturing products (textiles and garments, petroleum-chemicals based manufacturing, and other
23 This is based on standard economic closure where trade balance equals saving minus investment. This study utilizes one of the standard GTAP closures in which the changes in rates of return on investment are equalized across countries. In other words, the model would distribute a change in global saving across regions or countries in such a way that all expected regional rates of return change by the same percentage.
30
manufacturing) when an ASEAN trading block is created. This confirms the notion that trade diversion effect of AFTA is expected to be large.
While the increase in textile and garment exports is expected, the increase could be overestimated because potential competition from China has not been not taken into account. In this simulation, China and Taiwan are not yet included in the WTO (although they are assumed to follow the APEC tariff reduction scheme), and therefore the potential benefit from MFA liberalization is not yet extended to these two economies.
The effect of the elimination of MFA is also clear from the pattern of Indonesia’s manufacturing exports. Without the elimination of MFA, increases in exports are more evenly distributed among several manufacturing commodities, and less concentrated on textiles and garments. In other words, without the elimination of MFA, exports of other manufacturing commodities would be larger. Under liberalization scenario 2a for example, textile and garment exports are expected to increase by just $5.5 billion without the elimination of MFA, compared with $14.1 billion with its elimination (Table 6). Meanwhile, exports of other manufacturing commodities would increase by $3.0 billion, compared with just $1.5 billion when MFA is eliminated. The increase in exports of petroleum, coal and chemical manufacturing products would also be higher, at about $676 million, if MFA were not eliminated.
CONCLUSIONS
The estimated gains from liberalization are consistent with the results from various studies of trade liberalization in the Asia-Pacific region: larger tariff cuts and wider coverage of trade liberalization would generally lead to bigger welfare gains. The benefit of trade liberalization is reflected in the increases in welfare, wages and other factor prices that result from the more optimal patterns of production, exports and imports. However, the welfare gain from agricultural liberalization comes mostly from the implementation of the Uruguay round commitment, which includes the removal of domestic distortions in agriculture.
Among the existing liberalization commitments in the Asia Pacific region, the implementation of the two major commitments, namely the UR and APEC, would greatly benefit Indonesia. The benefit from the Uruguay Round comes from greater market access due to general tariff reductions and from
31
reductions in domestic distortions in agriculture. In addition to this, the elimination of MFA is expected to provide a large additional welfare gain. The contribution of APEC comes mostly from tariff reductions in the manufacturing sector in general. The study also shows that the benefit from unilateral liberalization by Indonesia, in addition to other countries implementing their UR commitments, would lead to a larger welfare gain for Indonesia. The additional benefit from pursuing unilateral liberalization to the extent assumed here is comparable with the full implementation of the UR plus APEC.
The creation of AFTA, on the other hand, is expected to contribute little additional welfare gain for Indonesia, nor for other ASEAN member economies. This is because ASEAN as a free trade area and market is small, and because most trade by the ASEAN members is with non-ASEAN countries. Thus, while tariff reductions under the preferential CEPT are more extensive compared with the UR and APEC, because the tariff reduction is applied only to the ASEAN members, the expected gains are small. The conclusion is that ASEAN would benefit and gain more by pursuing more open and non-discriminatory trade liberalization through unilateral liberalization, APEC or the new round of the WTO. In practice, the benefit of the AFTA process is precisely that it has influenced the process of unilateral liberalization in many of the ASEAN members. The fact that they had to submit schedules of tariff reduction to be achieved by certain times greatly influenced their own unilateral process of tariff reduction. Therefore, the gains from AFTA cannot be measured simply by looking at the gains from the AFTA scenario alone.
In the Indonesian case, the biggest expansion is expected to take place in the textile and garment sector, at the expense of the mining sector. Even without the elimination of MFA the gain is significant. Trade liberalization tends to move resources from primary sectors such as mining and agriculture to other sectors, especially manufacturing. Of course this has to do also with the assumption in the model that factor inputs are identical in nature, and perfectly mobile across sectors. Thus with trade liberalization, Indonesia's comparative advantage in the textile and garment industries, and to a lesser extent in general manufacturing should become clearer. The predicted impact of agricultural liberalization on Indonesia’s trade pattern is generally modest, except with the implementation of agricultural liberalization in AFTA, which
32
makes Indonesia potentially the major producer of agricultural commodities in ASEAN.
REFERENCES APEC. 1997. The Impact of Trade Liberalization in APEC. Economic Committee of
APEC, APEC Secretariat, Singapore.
APEC. 1999. The Impact of Trade Liberalization on Labor Markets in the Asia Pacific Region, Report by Network for Economic Development Management, Human Resource Development Working Group, APEC Secretariat, Singapore.
Anderson, K. 1996. ‘China’s accession to the WTO.’ Chapter 14 in Strengthening the Global Trading System by Kym Anderson, Centre for International Economic Studies, University of Adelaide, Adelaide, Australia.
Anderson, Kym, Betina Dimaranan, Tom Hertel and Will Martin. 1997. ‘Economic Growth and Policy Reform in the APEC Region: Trade and Welfare Implications by 2005.’ Asia Pacific Economic Review 3(1) pp.1-18.
Bird, Kelly. 1996. ‘Survey of Recent Developments.’ Bulletin of Indonesian Economic Studies. Vol. 32, No. 1, April 1996.
Erwidodo and Tubagus Feridhanusetyawan. 1997. ‘Indonesia’s Agriculture: Facing the APEC and WTO.’ The Indonesian Quarterly Vol. XXV. No. 3.
Feridhanusetyawan, Tubagus. 1997. ‘Trade Liberalization in Asia Pacific: A Global CGE Approach.’ The Indonesian Quarterly Vol. XXV no. 4.
Feridhanusetyawan, Tubagus, Mari Pangestu,. Erwidodo. 2000. ‘Trade Liberalization in the Asia Pacific: The Benefit for Indonesia.’ Report to the ACIAR Indonesia Research Project no. 9449 on the Linkages between Indonesia’s Agricultural Production, Trade and Environment. Paper presented at the conference on the Linkage between Indonesia’s Agricultural Production, Trade and Environment at the Centre for Strategic and International Studies, Jakarta, June 12, 2000.
Feridhanusetyawan, Tubagus (2001). ‘Indonesia’s Trade Policy and Performance: An Overview.’ Working paper for the CSIS-Columbia Research Project on Economic Institution Building in a Global Economy. CSIS. April 2001.
Hertel, Thomas W. (editor). 1997. Global Trade Analysis: Modeling and Applications. Cambridge University Press.
Huff, K. M. and T. W. Hertel. 1996. ‘Decomposing Welfare Changes in the GTAP Model,’ GTAP Technical Paper, No. 5. July.
McLeod, Ross. 1993. ‘Survey of Recent Developments.’ Bulletin of Indonesian Economic Studies. Vol. 29. No. 2, August.
33
Nasution, Anwar. 1991. ‘Survey of Recent Developments.’ Bulletin of Indonesian Economic Studies. Vol. 27. No. 2. August.
Pangestu, Mari. 1996. Economic Reform, Deregulation and Privatization, Centre for Strategic and International Studies, Jakarta
Pangestu, Mari, Christopher Findlay, Poncianto Intal, Jr and Stephen Parker (eds). 1996. Perpectives on the Manila Action Plan for APEC. Pacific Economic Cooperation Council (PECC).
Pangestu, Mari and Sherry Stephenson. 1996. ‘Evaluation of Uruguay Round Commitments by APEC Members’ in Priority Issues in Trade and Investment Liberalization: Implication for the Asia Pacific Region, edited by Bijit Bora and Mari Pangestu. Pacific Economic Cooperation Council (PECC)
PECC (Pacific Economic Cooperation Council). 1995. Milestones in APEC Liberalization: A Map of Market Opening Measures by APEC Economies
Hadi Soesastro, ‘Whither ASEAN Plus Three’, Paper presented at the PECC Trade Policy Forum, Seminar on Regional Trading Arrangements, Bangkok, 12-13 June, 2001.
Stephenson, Sherry and Mari Pangestu. 1996. ‘Indonesia and the Emerging Trading Environment.’ Report for the Asian Development Bank, August 1996.
Yamazawa, Ippei. 1997. APEC's Progress Toward the Bogor Target: A Quantitative Assessment of Individual Action Plans. Japan National Committe for Pacific Economic Cooperation.
Young, Linda M. and Karen M. Huff. 1977. ‘Free Trade in the Pacific Rim: On What Basis?’ in Global Trade Analysis: Modeling and Applications. Edited by Thomas W. Hertel. Cambridge University Press.