35
INDONESIA’S NON INDONESIA’S NON-BANK BANK ERIC SUGANDI ECONOMIST GLOBAL RESEARCH AUGUST 2011 K FINANCE INSTITUTIONS K FINANCE INSTITUTIONS
INDONESIA’S NONINDONESIA’S NON--BANK FINANCE INSTITUTIONSBANK FINANCE INSTITUTIONS
ERIC SUGANDIECONOMIST
GLOBAL RESEARCH
AUGUST 2011
BANK FINANCE INSTITUTIONSBANK FINANCE INSTITUTIONS

KEY DRIVERS OF GROWTHKEY DRIVERS OF GROWTHKEY DRIVERS OF GROWTHKEY DRIVERS OF GROWTH
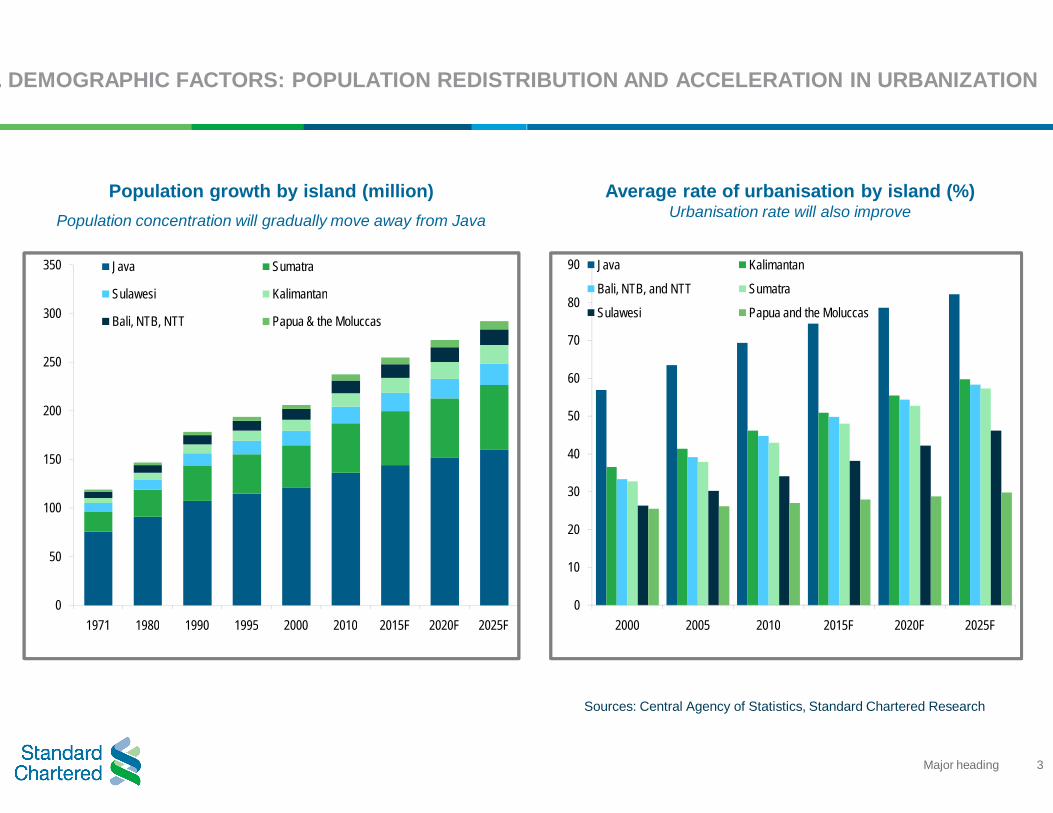
1. DEMOGRAPHIC FACTORS: POPULATION REDISTRIBUTION AND ACCELERATION IN URBANIZATION
0
50
100
150
200
250
300
350
1971 1980 1990 1995 2000 2010 2015F 2020F 2025F
Java Sumatra
Sulawesi Kalimantan
Bali, NTB, NTT Papua & the Moluccas
Population growth by island (million)Population concentration will gradually move away from Java
3Major heading
1. DEMOGRAPHIC FACTORS: POPULATION REDISTRIBUTION AND ACCELERATION IN URBANIZATION
Sources: Central Agency of Statistics, Standard Chartered Research
0
10
20
30
40
50
60
70
80
90
2000 2005 2010 2015F 2020F 2025F
Java Kalimantan
Bali, NTB, and NTT Sumatra
Sulawesi Papua and the Moluccas
Average rate of urbanisation by island (%) Urbanisation rate will also improve
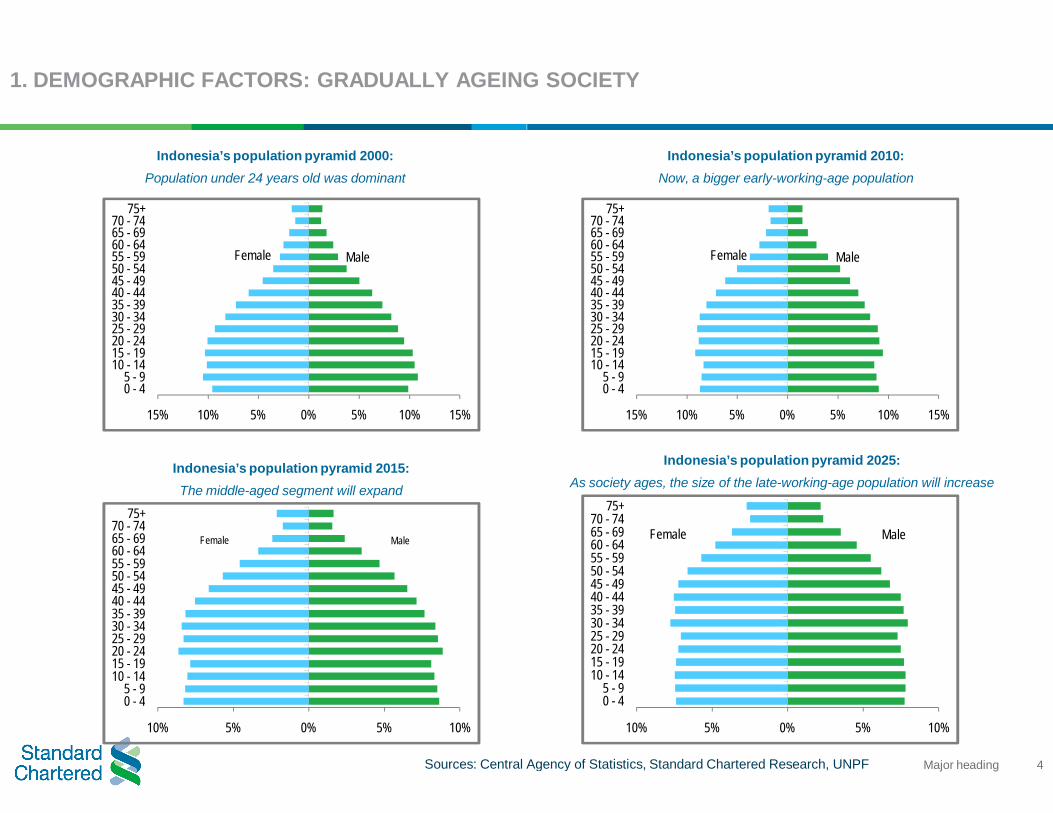
1. DEMOGRAPHIC FACTORS: GRADUALLY AGEING SOCIETY
Sources: Central Agency of Statistics,
Female Male
15% 10% 5% 0% 5% 10% 15%
0 - 45 - 9
10 - 1415 - 1920 - 2425 - 2930 - 3435 - 3940 - 4445 - 4950 - 5455 - 5960 - 6465 - 6970 - 74
75+
Female Male
10% 5% 0% 5% 10%
0 - 45 - 9
10 - 1415 - 1920 - 2425 - 2930 - 3435 - 3940 - 4445 - 4950 - 5455 - 5960 - 6465 - 6970 - 74
75+
Indonesia’s population pyramid 2000:Population under 24 years old was dominant
Indonesia’s population pyramid 2015:The middle-aged segment will expand
4Major heading
1. DEMOGRAPHIC FACTORS: GRADUALLY AGEING SOCIETY
Central Agency of Statistics, Standard Chartered Research, UNPF
Female Male
15% 10% 5% 0% 5% 10% 15%
0 - 45 - 9
10 - 1415 - 1920 - 2425 - 2930 - 3435 - 3940 - 4445 - 4950 - 5455 - 5960 - 6465 - 6970 - 74
75+
Female Male
10% 5% 0% 5% 10%
0 - 45 - 9
10 - 1415 - 1920 - 2425 - 2930 - 3435 - 3940 - 4445 - 4950 - 5455 - 5960 - 6465 - 6970 - 74
75+
Indonesia’s population pyramid 2010:Now, a bigger early-working-age population
Indonesia’s population pyramid 2025:As society ages, the size of the late-working-age population will increase
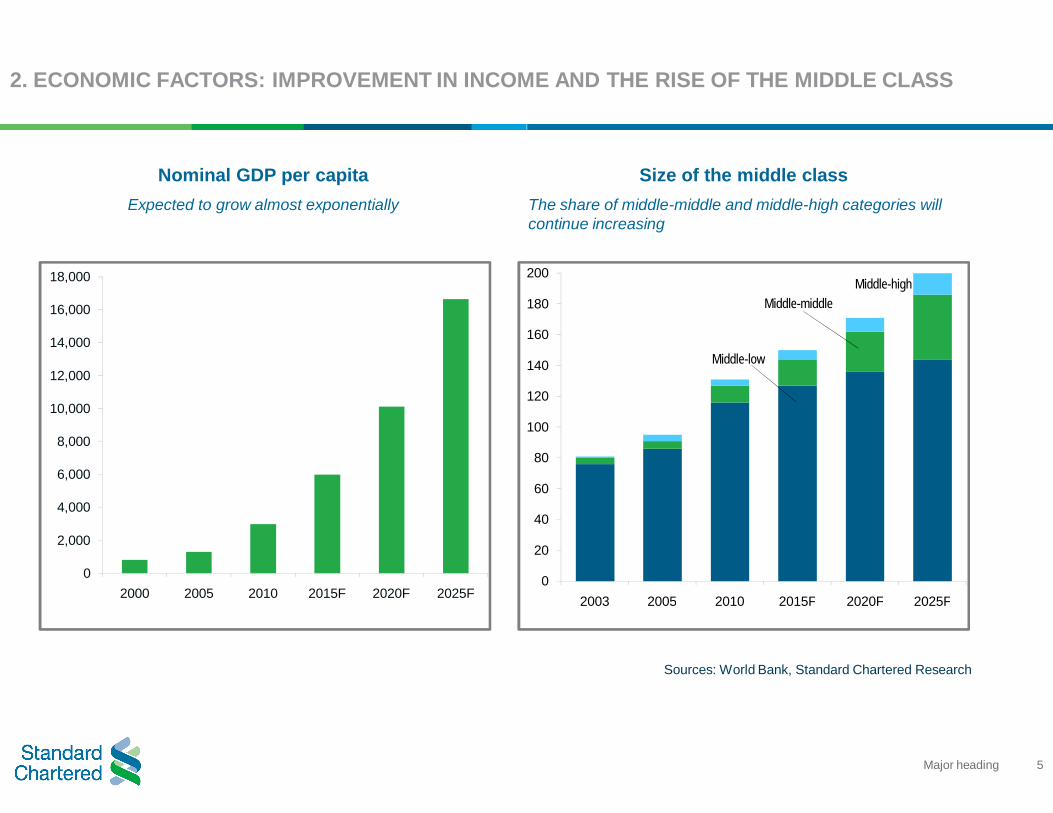
2. ECONOMIC FACTORS: IMPROVEMENT IN INCOME AND THE RISE OF THE MIDDLE CLASS
0
2,000
4,000
6,000
8,000
10,000
12,000
14,000
16,000
18,000
2000 2005 2010 2015F 2020F 2025F
Nominal GDP per capitaExpected to grow almost exponentially
5Major heading
2. ECONOMIC FACTORS: IMPROVEMENT IN INCOME AND THE RISE OF THE MIDDLE CLASS
Sources: World Bank, Standard Chartered Research
Middle-low
Middle-middleMiddle-high
0
20
40
60
80
100
120
140
160
180
200
2003 2005 2010 2015F 2020F 2025F
Size of the middle classThe share of middle-middle and middle-high categories will continue increasing
3. DEVELOPMENT OF ISLAMIC FINANCIAL MARKET
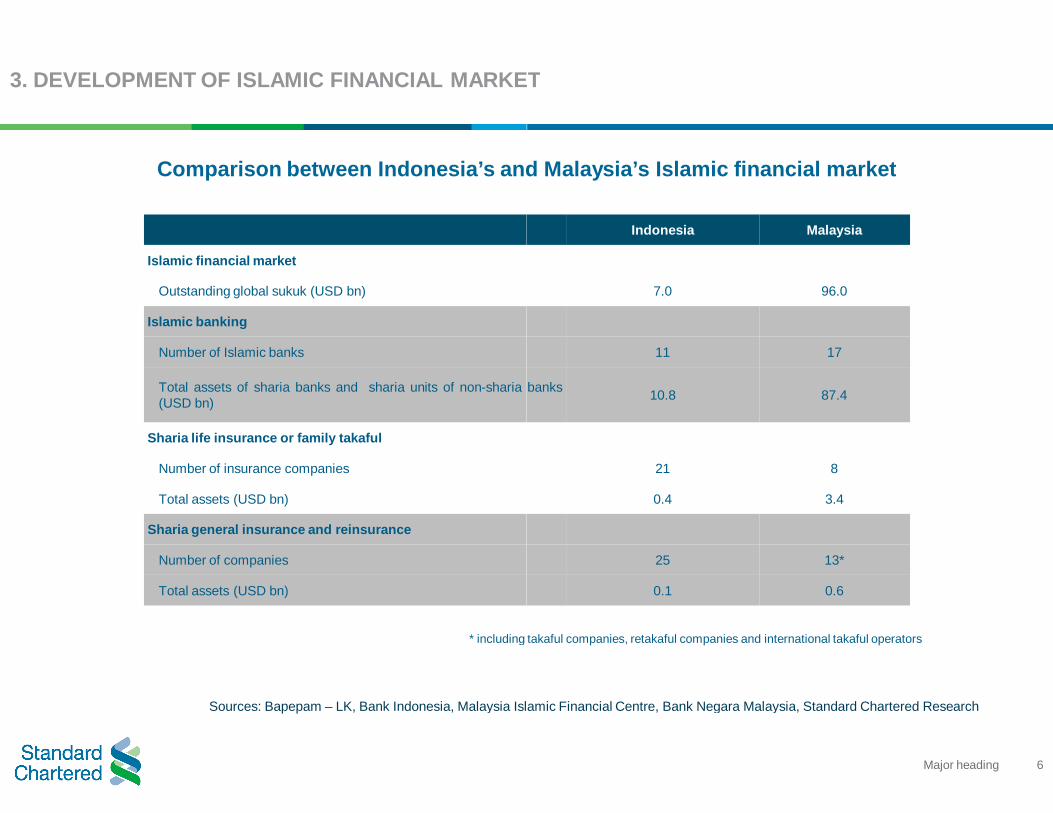
Islamic financial market
Outstanding global sukuk (USD bn)
Islamic banking
Number of Islamic banks
Total assets of sharia banks and sharia units of non-sharia(USD bn)
Sharia life insurance or family takaful
Number of insurance companies
Total assets (USD bn)
Sharia general insurance and reinsurance
Number of companies
Total assets (USD bn)
* including
Comparison between Indonesia’s and Malaysia’s Islamic financial market
Sources: Bapepam – LK, Bank Indonesia, Malaysia Islamic Financial Centre, Bank Negara Malaysia, Standard Chartered Research
6Major heading
3. DEVELOPMENT OF ISLAMIC FINANCIAL MARKET
Indonesia Malaysia
7.0 96.0
11 17
banks 10.8 87.4
21 8
0.4 3.4
25 13*
0.1 0.6
* including takaful companies, retakaful companies and international takaful operators
Comparison between Indonesia’s and Malaysia’s Islamic financial market
LK, Bank Indonesia, Malaysia Islamic Financial Centre, Bank Negara Malaysia, Standard Chartered Research
3. DEVELOPMENT OF ISLAMIC FINANCIAL MARKET: INSURANCE
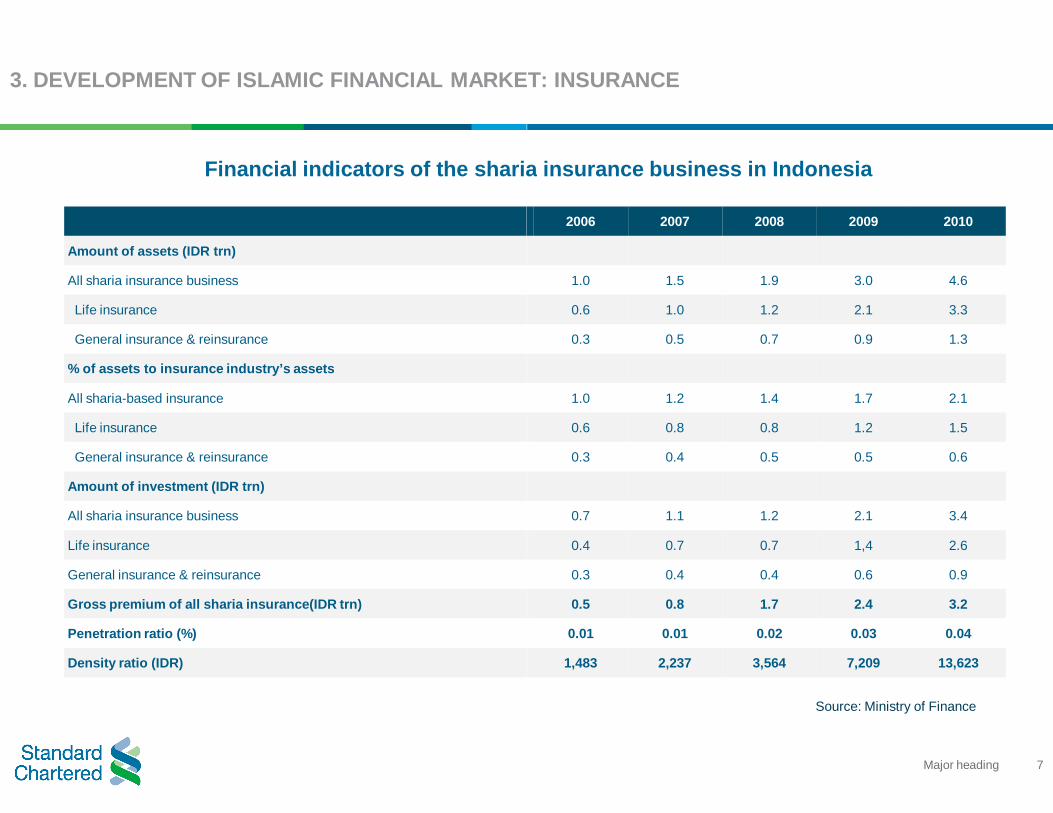
Amount of assets (IDR trn)
All sharia insurance business
Life insurance
General insurance & reinsurance
% of assets to insurance industry’s assets
All sharia-based insurance
Life insurance
General insurance & reinsurance
Amount of investment (IDR trn)
All sharia insurance business
Life insurance
General insurance & reinsurance
Gross premium of all sharia insurance(IDR trn)
Penetration ratio (%)
Density ratio (IDR)
Financial indicators of the sharia
7Major heading
3. DEVELOPMENT OF ISLAMIC FINANCIAL MARKET: INSURANCE
2006 2007 2008 2009 2010
1.0 1.5 1.9 3.0 4.6
0.6 1.0 1.2 2.1 3.3
0.3 0.5 0.7 0.9 1.3
1.0 1.2 1.4 1.7 2.1
0.6 0.8 0.8 1.2 1.5
0.3 0.4 0.5 0.5 0.6
0.7 1.1 1.2 2.1 3.4
0.4 0.7 0.7 1,4 2.6
0.3 0.4 0.4 0.6 0.9
0.5 0.8 1.7 2.4 3.2
0.01 0.01 0.02 0.03 0.04
1,483 2,237 3,564 7,209 13,623
Source: Ministry of Finance
sharia insurance business in Indonesia
3. DEVELOPMENT OF ISLAMIC FINANCE: FINANCE COMPANIES
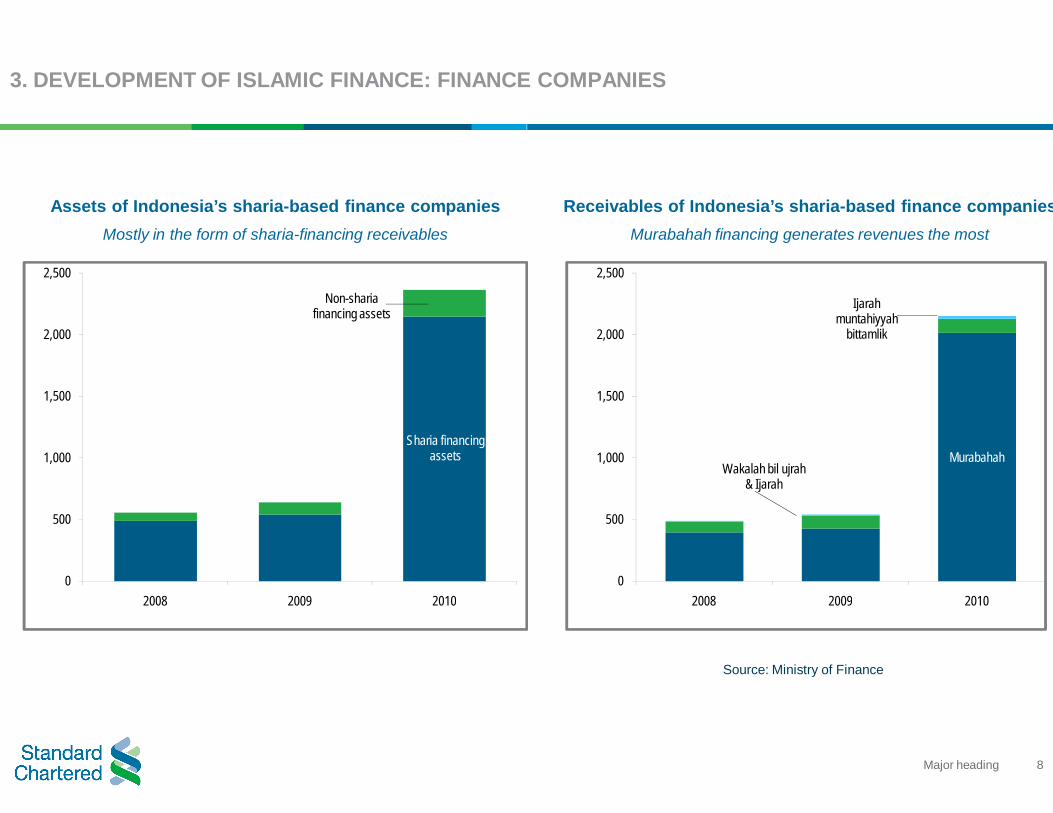
Sharia financing assets
Non-sharia financing assets
0
500
1,000
1,500
2,000
2,500
2008 2009 2010
Assets of Indonesia’s sharia-based finance companies Mostly in the form of sharia-financing receivables
8Major heading
3. DEVELOPMENT OF ISLAMIC FINANCE: FINANCE COMPANIES
Murabahah
Ijarah muntahiyyah
bittamlik
Wakalah bil ujrah & Ijarah
0
500
1,000
1,500
2,000
2,500
2008 2009 2010
based finance companies Receivables of Indonesia’s sharia-based finance companies Murabahah financing generates revenues the most
Source: Ministry of Finance
4. INFRASTRUCTURE DEVELOPMENT AND SOCIAL SECURITY NET
INFRASTRUCTURE DEVELOPMENT
1. Rapid infrastructure development could lead
2. Infrastructure development will acceleratehouseholds’ purchasing power
3. Transport infrastructure development enhancesmarket segments to decentralise
SOCIAL SECURITY NET
1. Health protection
2. Protection against work accidents
3. Annuity provisions
4. Pension funds
5. Life insurance
9Major heading
4. INFRASTRUCTURE DEVELOPMENT AND SOCIAL SECURITY NET
Source: Ministry of Finance
lead to more NBFI financing
accelerate economic development and improve
enhances labour mobility, thus allowing NBFI
NBFI BUSINESSESNBFI BUSINESSESNBFI BUSINESSESNBFI BUSINESSES

INSURANCEINSURANCEINSURANCEINSURANCE
INSURANCE
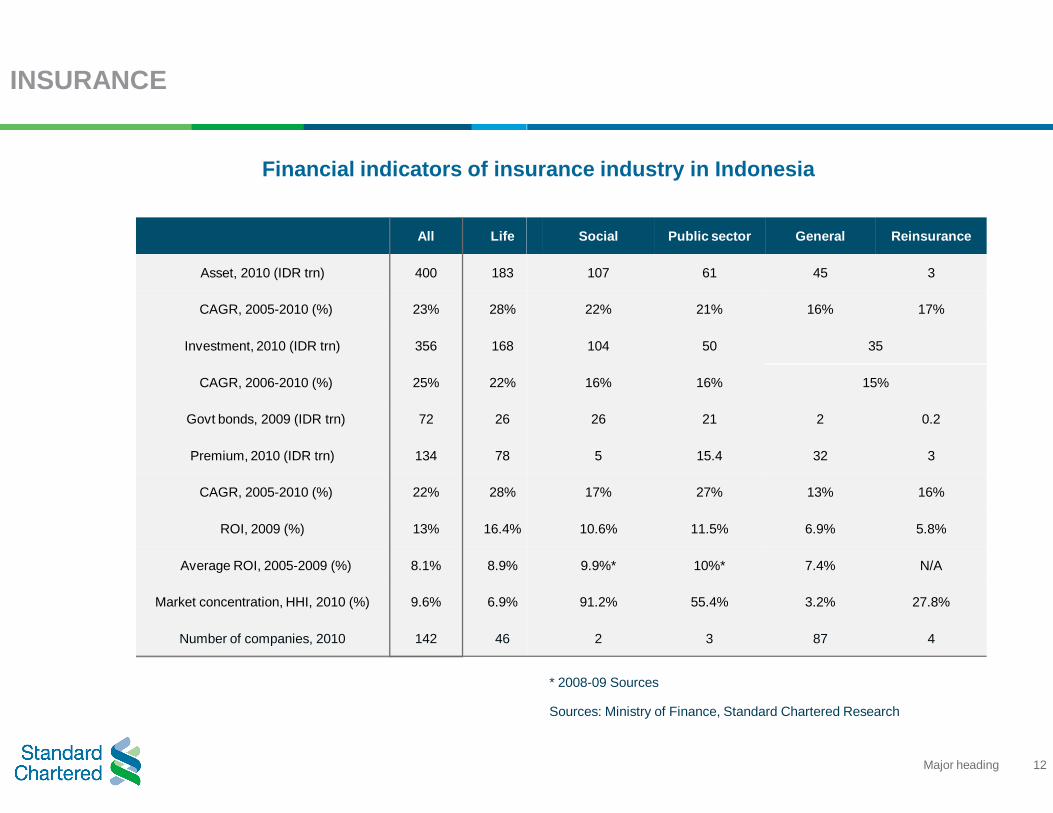
All Life
Asset, 2010 (IDR trn) 400 183
CAGR, 2005-2010 (%) 23% 28%
Investment, 2010 (IDR trn) 356 168
CAGR, 2006-2010 (%) 25% 22%
Govt bonds, 2009 (IDR trn) 72 26
Premium, 2010 (IDR trn) 134 78
CAGR, 2005-2010 (%) 22% 28%
ROI, 2009 (%) 13% 16.4%
Average ROI, 2005-2009 (%) 8.1% 8.9%
Market concentration, HHI, 2010 (%) 9.6% 6.9%
Number of companies, 2010 142 46
Financial indicators of insurance industry in Indonesia
12Major heading
* 2008-09 Sources
Social Public sector General Reinsurance
107 61 45 3
22% 21% 16% 17%
104 50 35
16% 16% 15%
26 21 2 0.2
5 15.4 32 3
17% 27% 13% 16%
10.6% 11.5% 6.9% 5.8%
9.9%* 10%* 7.4% N/A
91.2% 55.4% 3.2% 27.8%
2 3 87 4
Financial indicators of insurance industry in Indonesia
Sources: Ministry of Finance, Standard Chartered Research
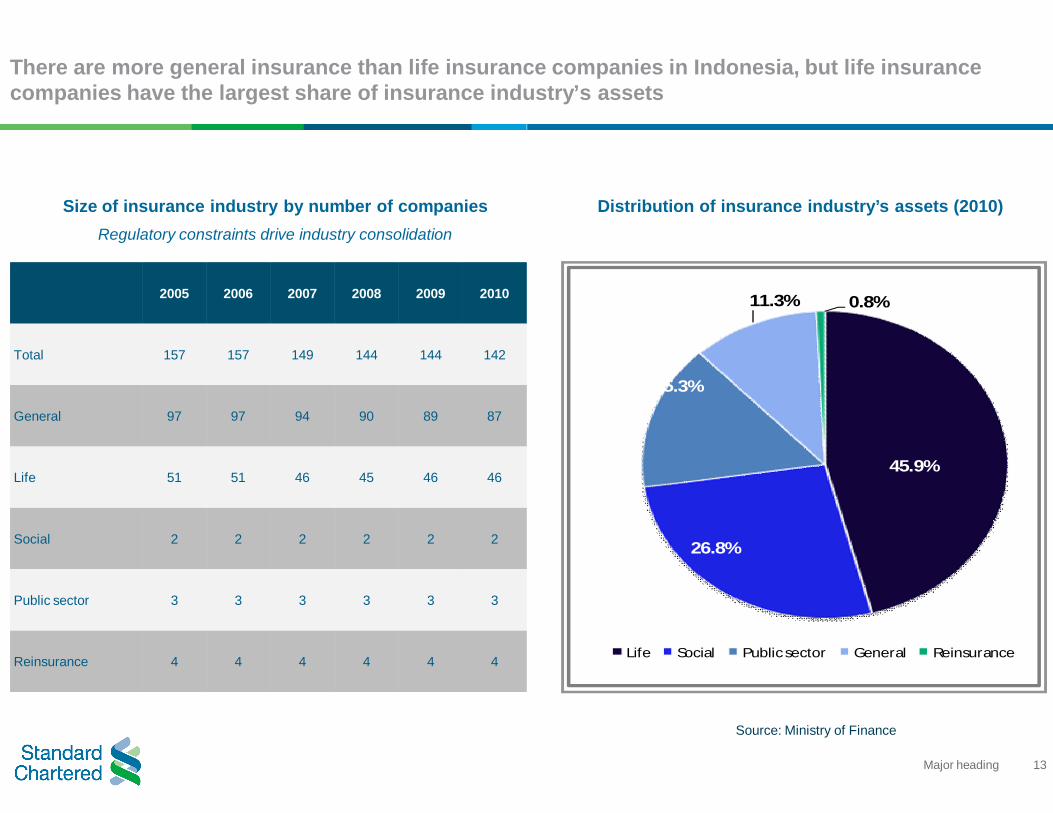
There are more general insurance than life insurance companies in Indonesia, but life insurance companies have the largest share of insurance industry’s assets
2005 2006 2007 2008 2009 2010
Total 157 157 149 144 144 142
General 97 97 94 90 89 87
Life 51 51 46 45 46 46
Social 2 2 2 2 2 2
Public sector 3 3 3 3 3 3
Reinsurance 4 4 4 4 4 4
Size of insurance industry by number of companiesRegulatory constraints drive industry consolidation
13Major heading
There are more general insurance than life insurance companies in Indonesia, but life insurance companies have the largest share of insurance industry’s assets
Source: Ministry of Finance
45.9%
26.8%
15.3%
11.3% 0.8%
Life Social Public sector General Reinsurance
Distribution of insurance industry’s assets (2010)
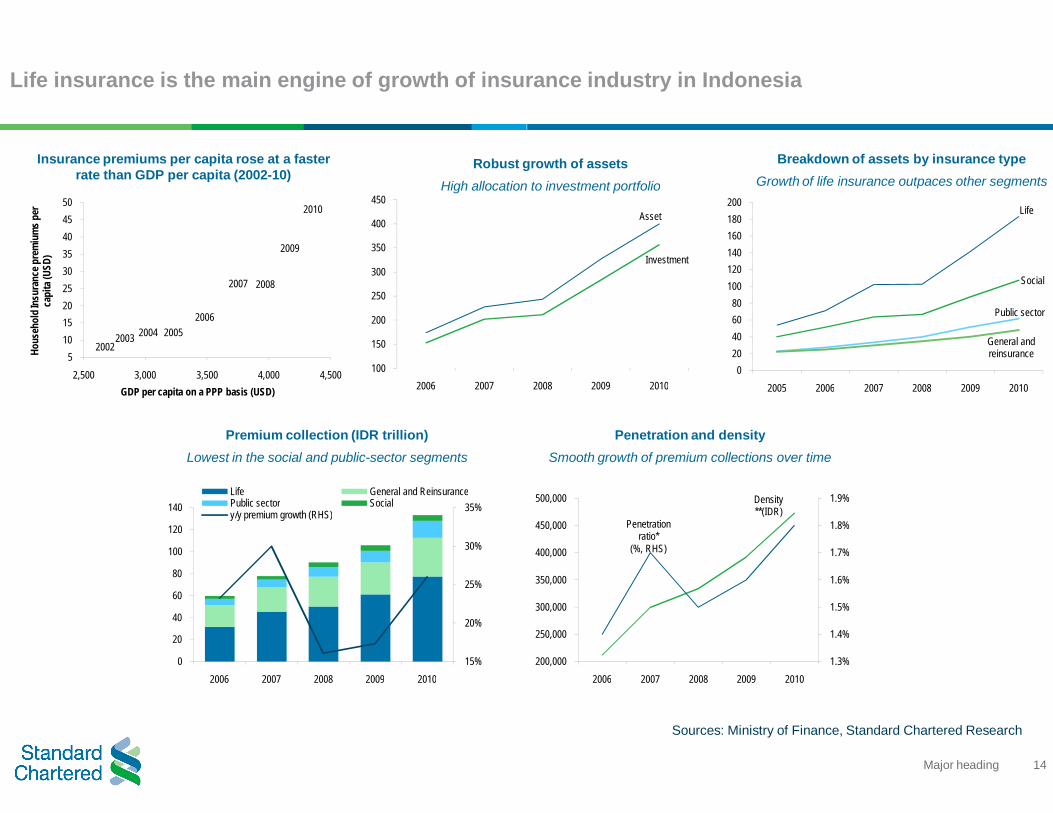
Life insurance is the main engine of growth of insurance industry in Indonesia
20022003 2004 2005
2006
2007 2008
2009
2010
5101520253035404550
2,500 3,000 3,500 4,000 4,500
Hous
ehol
d Ins
uran
ce p
rem
ium
s per
ca
pita
(USD
)
GDP per capita on a PPP basis (USD)
100
150
200
250
300
350
400
450
2006 2007
15%
20%
25%
30%
35%
0
20
40
60
80
100
120
140
2006 2007 2008 2009 2010
Life General and ReinsurancePublic sector Socialy/y premium growth (RHS)
Insurance premiums per capita rose at a faster rate than GDP per capita (2002-10)
Robust growth of assetsHigh allocation to investment portfolio
Premium collection (IDR trillion)Lowest in the social and public-sector segments
14Major heading
Life insurance is the main engine of growth of insurance industry in Indonesia
Sources: Ministry of Finance, Standard Chartered Research
Asset
Investment
2008 2009 2010
Life
Social
Public sector
General and reinsurance
020406080
100120140160180200
2005 2006 2007 2008 2009 2010
Robust growth of assetsHigh allocation to investment portfolio
Breakdown of assets by insurance typeGrowth of life insurance outpaces other segments
Density **(IDR)
Penetration ratio*
(%, RHS)
1.3%
1.4%
1.5%
1.6%
1.7%
1.8%
1.9%
200,000
250,000
300,000
350,000
400,000
450,000
500,000
2006 2007 2008 2009 2010
Penetration and densitySmooth growth of premium collections over time
INSURANCE: LIFE INSURANCE
0% 2% 4% 6% 8% 10% 12%
Indolife
AXA
Sinar Mas
Allianz
Bumiputera …
Manulife
AIA
Prudential
5
15
25
35
45
55
65
75
85
2005 2006 2007
0 5 10 15 20 25 30
Investment linked
Endowment
Term life
Health
Whole life
Others
0
10
20
30
40
50
2005 2006
Term life EndowmentPersonal accident Investment
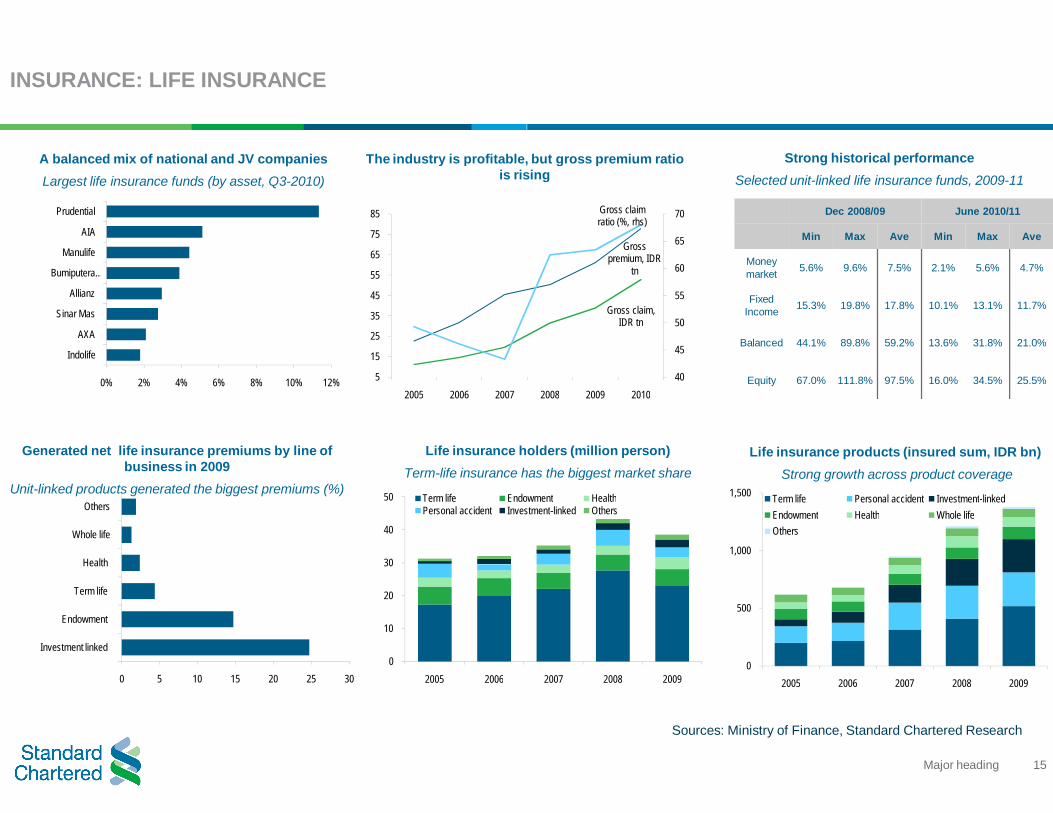
A balanced mix of national and JV companiesLargest life insurance funds (by asset, Q3-2010)
The industry is profitable, but gross premium ratio is rising
Generated net life insurance premiums by line of business in 2009
Unit-linked products generated the biggest premiums (%)
Life insurance holders (million person)Term-life insurance has the biggest market share
15Major heading
Sources: Ministry of Finance, Standard Chartered Research
Gross premium, IDR
tn
Gross claim, IDR tn
Gross claim ratio (%, rhs)
40
45
50
55
60
65
70
2008 2009 2010
2007 2008 2009
Endowment HealthInvestment-linked Others
Dec 2008/09 June 2010/11
Min Max Ave Min Max Ave
Money market 5.6% 9.6% 7.5% 2.1% 5.6% 4.7%
Fixed Income 15.3% 19.8% 17.8% 10.1% 13.1% 11.7%
Balanced 44.1% 89.8% 59.2% 13.6% 31.8% 21.0%
Equity 67.0% 111.8% 97.5% 16.0% 34.5% 25.5%
0
500
1,000
1,500
2005 2006 2007 2008 2009
Term life Personal accident Investment-linkedEndowment Health Whole lifeOthers
The industry is profitable, but gross premium ratio is rising
Strong historical performanceSelected unit-linked life insurance funds, 2009-11
Life insurance holders (million person)life insurance has the biggest market share
Life insurance products (insured sum, IDR bn)Strong growth across product coverage
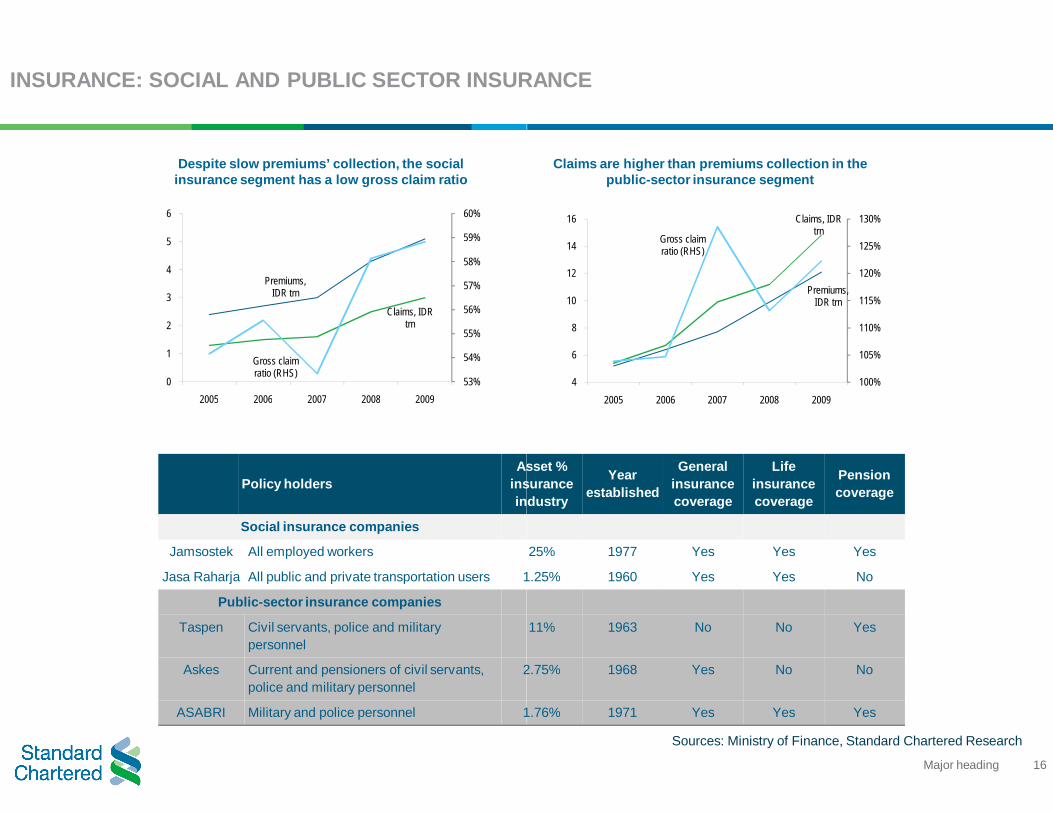
INSURANCE: SOCIAL AND PUBLIC SECTOR INSURANCE
Premiums, IDR trn
Claims, IDR trn
Gross claim ratio (RHS)
53%
54%
55%
56%
57%
58%
59%
60%
0
1
2
3
4
5
6
2005 2006 2007 2008 2009
Policy holdersAsset %
insurance industry
Social insurance companies
Jamsostek All employed workers
Jasa Raharja All public and private transportation users 1.25%
Public-sector insurance companies
Taspen Civil servants, police and military personnel
Askes Current and pensioners of civil servants, police and military personnel
2.75%
ASABRI Military and police personnel 1.76%
Despite slow premiums’ collection, the social insurance segment has a low gross claim ratio
16Major heading
INSURANCE: SOCIAL AND PUBLIC SECTOR INSURANCE
Sources: Ministry of Finance, Standard Chartered Research
Premiums, IDR trn
Claims, IDR trn
Gross claim ratio (RHS)
100%
105%
110%
115%
120%
125%
130%
4
6
8
10
12
14
16
2005 2006 2007 2008 2009
Asset % insurance industry
Yearestablished
General insurance coverage
Life insurance coverage
Pension coverage
25% 1977 Yes Yes Yes
1.25% 1960 Yes Yes No
11% 1963 No No Yes
2.75% 1968 Yes No No
1.76% 1971 Yes Yes Yes
Claims are higher than premiums collection in the public-sector insurance segment

INSURANCE: GENERAL INSURANCE AND REINSURANCE
Sources: Ministry of Finance, Standard Chartered Research
Gross premiums,
IDR trn
Gross claims, IDR trn
Gross claim ratio (%, rhs)
3536373839404142434445
5
10
15
20
25
30
35
40
2005 2006 2007 2008 2009 2010
0
5
10
15
2005 2006
AutomotivePersonal accident & healthCredit and surety bond
Govt and CB
Securities
Deposit
Corporate bonds
Stocks
Mutual Fund
Direct Placement
0
20
40
60
80
100
120
140
Life insurance Social Insurance
Public sector General insurance
Reinsurance
Profitability of general insurance and reinsurance companies (premiums versus claims growth)
General insurance coverage (IDR trillion)Dominance of the auto industry
Investment composition by insurance fund, 2009 Social and public-sector funds are more risk-averse
(IDR trillion)
17Major heading
INSURANCE: GENERAL INSURANCE AND REINSURANCE
Sources: Ministry of Finance, Standard Chartered Research
2007 2008 2009
PropertyPersonal accident & health Cargo
Energy
Corp bonds and MTN
Deposit
Equity
Government bonds and SBI
Mutual Fund0%
5%
10%
15%
20%
25%
30%
35%
40%
45%
2003 2004 2005 2006 2007 2008 2009 Q4 2010*
general insurance
mutual funds
DB pension fundsDC pension funds
life insurance
pension funds of insurance companies
banks (including BI)
offshore <2Y
offshore 2-5Y offshore >5Y
1Y
250150
50
0
2
4
6
8
10
Y 5Y 10Y 15Y 20Y 25Y 30Y
Yield
(%)
General insurance coverage (IDR trillion)Dominance of the auto industry
The evolution of the investment portfolioAllocation across asset classes is converging
The size and positioning of insurance funds along the government bond yield curve (2011)

PENSION FUNDSPENSION FUNDSPENSION FUNDSPENSION FUNDS
PENSION FUNDS
All
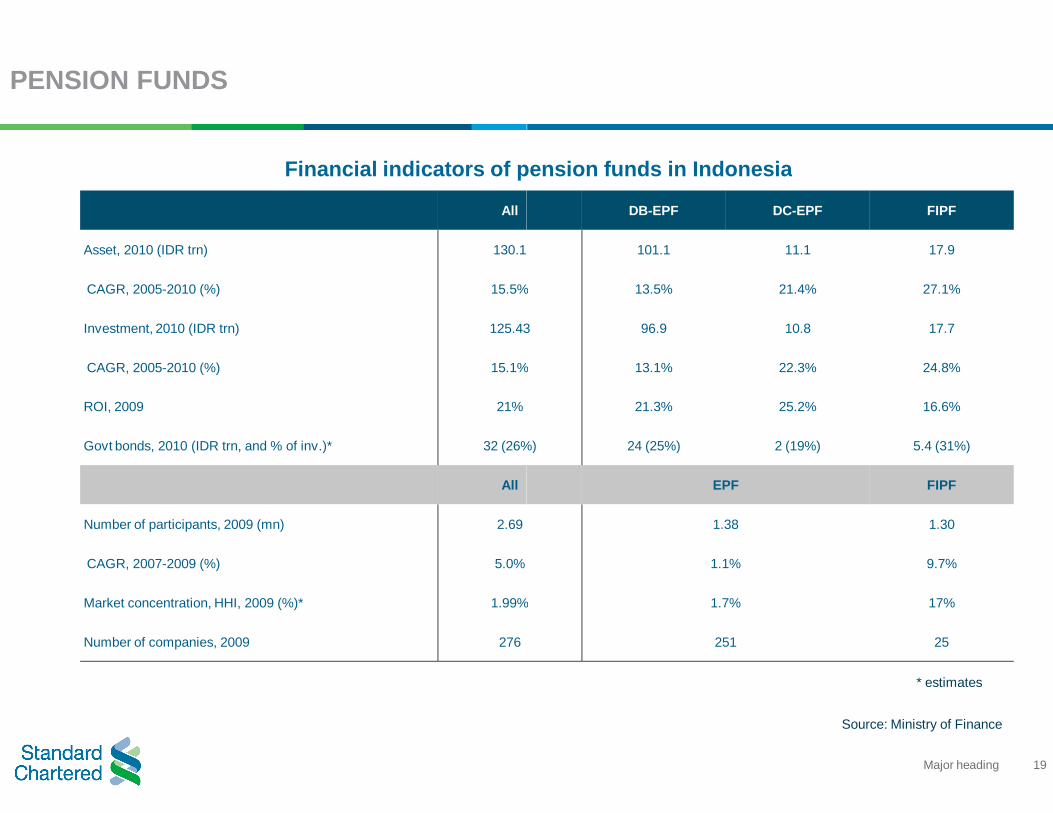
Asset, 2010 (IDR trn) 130.1
CAGR, 2005-2010 (%) 15.5%
Investment, 2010 (IDR trn) 125.43
CAGR, 2005-2010 (%) 15.1%
ROI, 2009 21%
Govt bonds, 2010 (IDR trn, and % of inv.)* 32 (26%)
All
Number of participants, 2009 (mn) 2.69
CAGR, 2007-2009 (%) 5.0%
Market concentration, HHI, 2009 (%)* 1.99%
Number of companies, 2009 276
Financial indicators of pension funds in Indonesia
19Major heading
DB-EPF DC-EPF FIPF
101.1 11.1 17.9
15.5% 13.5% 21.4% 27.1%
125.43 96.9 10.8 17.7
15.1% 13.1% 22.3% 24.8%
21.3% 25.2% 16.6%
32 (26%) 24 (25%) 2 (19%) 5.4 (31%)
EPF FIPF
1.38 1.30
1.1% 9.7%
1.99% 1.7% 17%
251 25
* estimates
Source: Ministry of Finance
Financial indicators of pension funds in Indonesia

FI-administered pension funds (FIPFs) are driving the industry growth, although most of industry’s assets are still concentrated in defined-benefit employee provident funds (DB
≥ 120%
100% ≤ and < 120%
75% ≤ and < 100%
50% ≤ and < 75%
< 50%
0% 10%
FI pension funds
Employer pension funds
1.05
1.10
1.15
1.20
1.25
1.30
1.35
1.40
1.45
1.50
2007 2008 2009 2010
DB
0
20
40
60
80
100
2005 2006 2007
< 1,000
1,000 - 5,000
5,001 - 10,000
10,001 -50,000
> 50,000
00.10.20.30.40.50.60.70.80.9
1
EPF FIPF
Growth of pension fund participantsFIPFs are driving industry penetration
Breakdown of asset size (IDR trillion)DB-EPFs still dominate in terms of asset size
Funds by number of participants in 2009EPFs are typically smaller firms
Funding ratio of DB
20Major heading
administered pension funds (FIPFs) are driving the industry growth, although most of industry’s benefit employee provident funds (DB-EPF)
Sources: Ministry of Finance, Standard Chartered Research
10% 20% 30% 40% 50%
≥ 120%
100% ≤ and < 120%
75% ≤ and < 100%
50% ≤ and < 75%
< 50%
0% 10% 20% 30% 40% 50%
DB-EPF
DC-EPF
FIPF
2008 2009 20100.0
0.2
0.4
0.6
0.8
1.0
1.2
1.4
1.6
2007 2008 2009 2010
Active EPF Passive EPFActive FIPF Passive FIPF
Breakdown of asset size (IDR trillion)EPFs still dominate in terms of asset size
Breakdown of participants (million persons)High active participations in FIPFs
Funding ratio of DB-EPF (% of companies) Solvency ratio of DB-EPF (% of companies)

MUTUAL FUNDSMUTUAL FUNDSMUTUAL FUNDSMUTUAL FUNDS
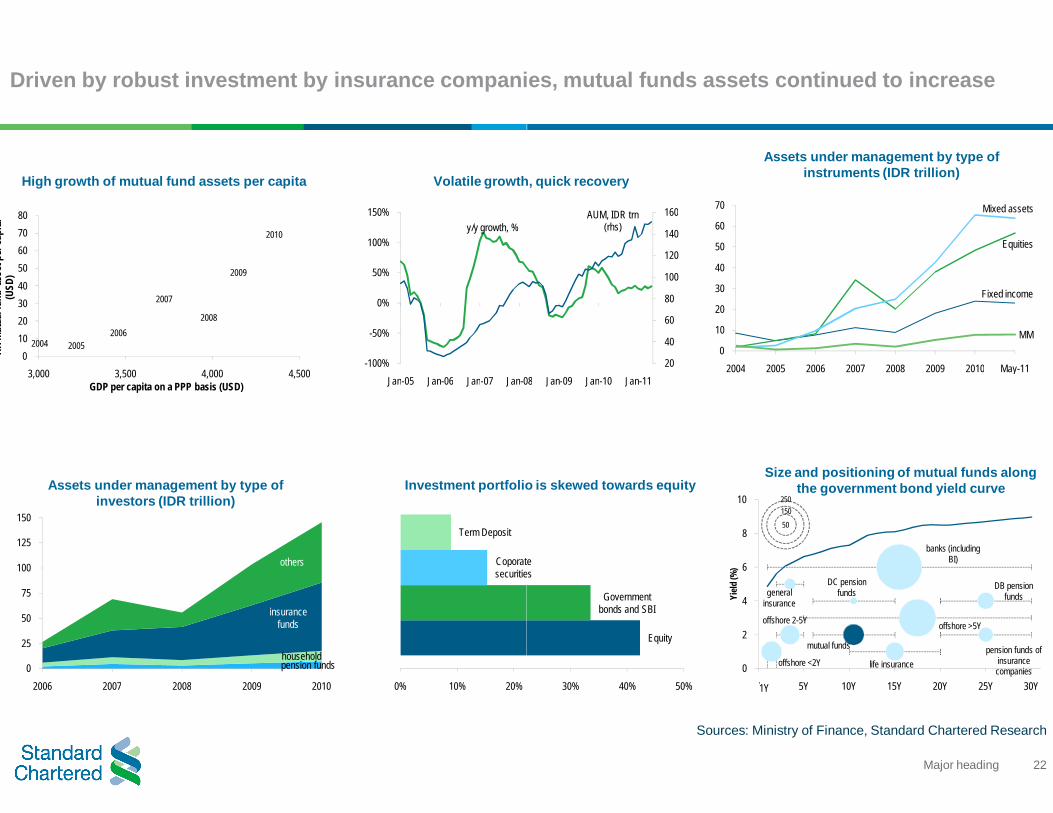
Driven by robust investment by insurance companies, mutual funds assets continued to increase
2004 20052006
2007
2008
2009
2010
01020304050607080
3,000 3,500 4,000 4,500
HH m
utua
l fun
d as
set p
er ca
pita
(U
SD)
GDP per capita on a PPP basis (USD)
y/y growth, %
-100%
-50%
0%
50%
100%
150%
Jan-05 Jan-06 Jan-07 Jan-08
pension fundshousehold
insurance funds
others
0
25
50
75
100
125
150
2006 2007 2008 2009 2010
High growth of mutual fund assets per capita Volatile growth, quick recovery
Assets under management by type of investors (IDR trillion)
Coporate securities
Term Deposit
0% 10% 20%
Investment portfolio is skewed towards equity
22Major heading
Driven by robust investment by insurance companies, mutual funds assets continued to increase
Sources: Ministry of Finance, Standard Chartered Research
AUM, IDR trn (rhs)
20
40
60
80
100
120
140
160
08 Jan-09 Jan-10 Jan-11
Fixed income
Equities
Mixed assets
MM0
10
20
30
40
50
60
70
2004 2005 2006 2007 2008 2009 2010 May-11
Volatile growth, quick recovery
Assets under management by type of instruments (IDR trillion)
Equity
Government bonds and SBI
Coporate securities
30% 40% 50%
Investment portfolio is skewed towards equity
general insurance
mutual funds
DB pension funds
DC pension funds
life insurancepension funds of
insurance companies
banks (including BI)
offshore <2Y
offshore 2-5Y offshore >5Y
1Y
25015050
0
2
4
6
8
10
Y 5Y 10Y 15Y 20Y 25Y 30Y
Yield
(%)
Size and positioning of mutual funds along the government bond yield curve
FINANCE COMPANIESFINANCE COMPANIESFINANCE COMPANIESFINANCE COMPANIES
Finance companies’ total assets and financing activities continue to expand
1) Total assets (IDR trn)
Cash and cash equivalent
Receivables from financing activities
Investment
Other assets
2) Liabilities (IDR trn)
Current liabilities
Borrowings
Issued bonds
Subordinated loans
Other liabilities
3) Equities = 1 – 2 (IDR trn)
Capital
Retained earnings
Other equities
Net profits
Financial indicators of finance companies in Indonesia
24Major heading
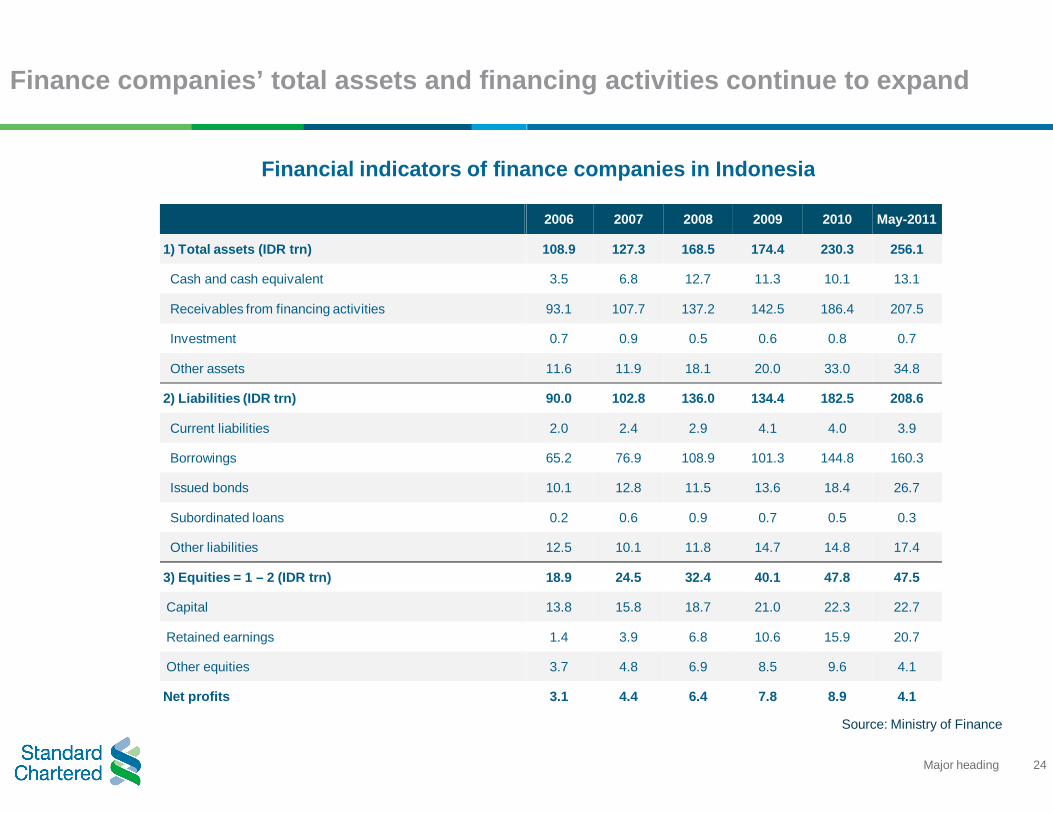
Finance companies’ total assets and financing activities continue to expand
Source: Ministry of Finance
2006 2007 2008 2009 2010 May-2011
108.9 127.3 168.5 174.4 230.3 256.1
3.5 6.8 12.7 11.3 10.1 13.1
93.1 107.7 137.2 142.5 186.4 207.5
0.7 0.9 0.5 0.6 0.8 0.7
11.6 11.9 18.1 20.0 33.0 34.8
90.0 102.8 136.0 134.4 182.5 208.6
2.0 2.4 2.9 4.1 4.0 3.9
65.2 76.9 108.9 101.3 144.8 160.3
10.1 12.8 11.5 13.6 18.4 26.7
0.2 0.6 0.9 0.7 0.5 0.3
12.5 10.1 11.8 14.7 14.8 17.4
18.9 24.5 32.4 40.1 47.8 47.5
13.8 15.8 18.7 21.0 22.3 22.7
1.4 3.9 6.8 10.6 15.9 20.7
3.7 4.8 6.9 8.5 9.6 4.1
3.1 4.4 6.4 7.8 8.9 4.1
Financial indicators of finance companies in Indonesia
Major finance companies in Indonesia mostly focus on automotive financing
Financial summary of major finance companies in Indonesia
Financing (IDR trn)
Market share(%)
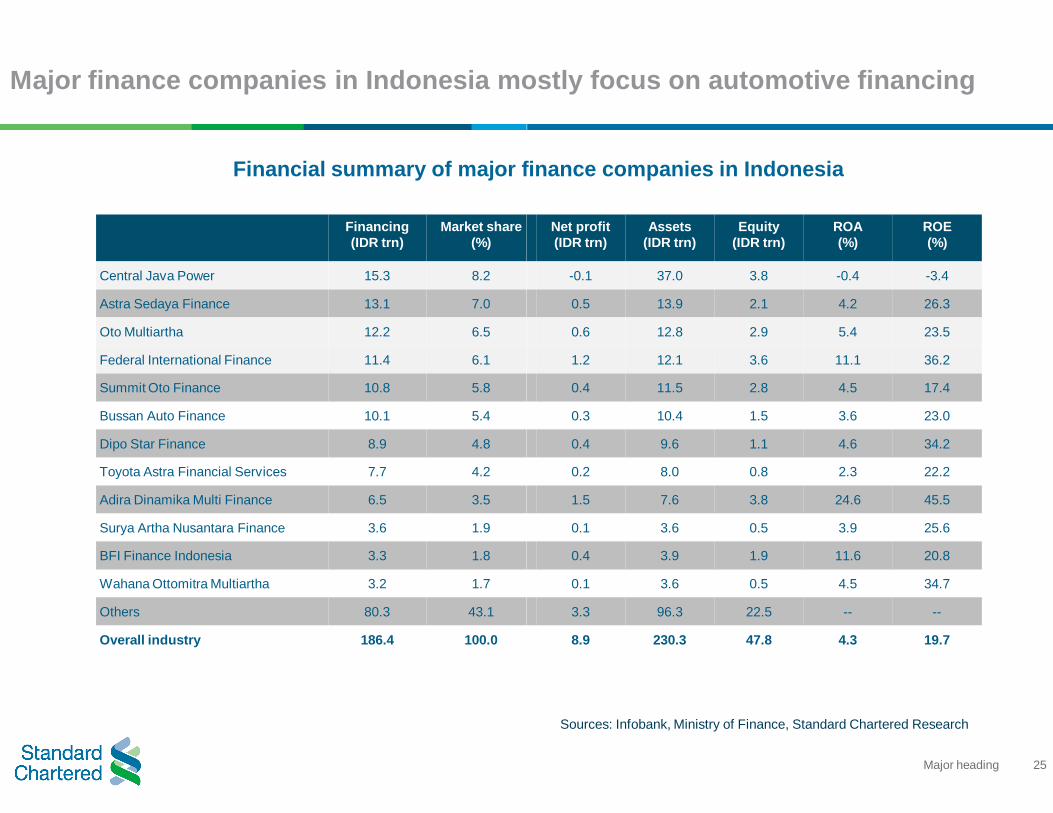
Central Java Power 15.3 8.2
Astra Sedaya Finance 13.1 7.0
Oto Multiartha 12.2 6.5
Federal International Finance 11.4 6.1
Summit Oto Finance 10.8 5.8
Bussan Auto Finance 10.1 5.4
Dipo Star Finance 8.9 4.8
Toyota Astra Financial Services 7.7 4.2
Adira Dinamika Multi Finance 6.5 3.5
Surya Artha Nusantara Finance 3.6 1.9
BFI Finance Indonesia 3.3 1.8
Wahana Ottomitra Multiartha 3.2 1.7
Others 80.3 43.1
Overall industry 186.4 100.0
25Major heading
Major finance companies in Indonesia mostly focus on automotive financing
Sources: Infobank, Ministry of Finance, Standard Chartered Research
Financial summary of major finance companies in Indonesia
Net profit(IDR trn)
Assets(IDR trn)
Equity(IDR trn)
ROA(%)
ROE(%)
-0.1 37.0 3.8 -0.4 -3.4
0.5 13.9 2.1 4.2 26.3
0.6 12.8 2.9 5.4 23.5
1.2 12.1 3.6 11.1 36.2
0.4 11.5 2.8 4.5 17.4
0.3 10.4 1.5 3.6 23.0
0.4 9.6 1.1 4.6 34.2
0.2 8.0 0.8 2.3 22.2
1.5 7.6 3.8 24.6 45.5
0.1 3.6 0.5 3.9 25.6
0.4 3.9 1.9 11.6 20.8
0.1 3.6 0.5 4.5 34.7
3.3 96.3 22.5 -- --
8.9 230.3 47.8 4.3 19.7
FINANCE COMPANIES BY LINE OF BUSINESS: CONSUMER FINANCE
0
20
40
60
80
100
120
140
160
2000 2001 2002 2003 2004 2005 2006 2007 2008 2009 2010 May-11
20%
30%
40%
50%
60%
70%
80%
2000 2001 2002 2003 2004
0% 10% 20% 30% 40% 50% 60% 70% 80%
Consumption
Trading
Agriculture
Social services
Transportation
Business services
Others
-20%
0%
20%
40%
60%
80%
100%
2001 2002 2003 2004 2005
Sources: Ministry of Finance, Bank Indonesia, media reports, Standard Chartered Research
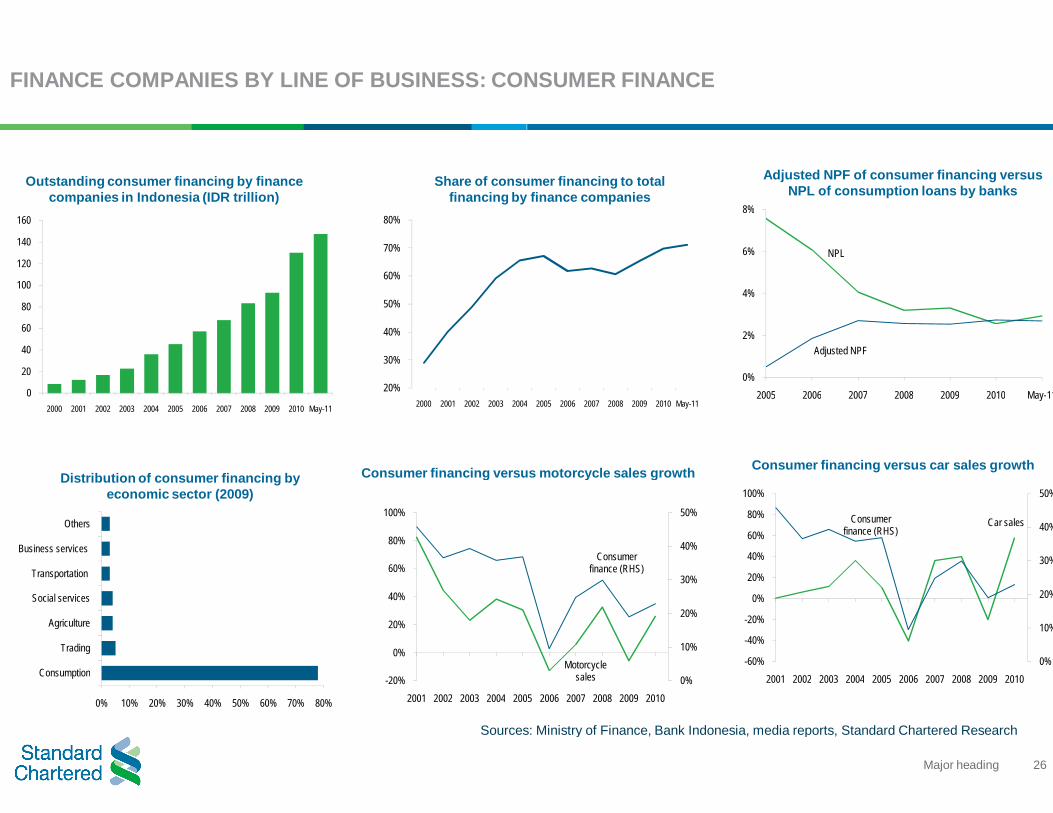
Outstanding consumer financing by finance companies in Indonesia (IDR trillion)
Share of consumer financing to total financing by finance companies
Distribution of consumer financing by economic sector (2009)
Consumer financing versus motorcycle sales growth
26Major heading
FINANCE COMPANIES BY LINE OF BUSINESS: CONSUMER FINANCE
2004 2005 2006 2007 2008 2009 2010 May-11
NPL
Adjusted NPF
0%
2%
4%
6%
8%
2005 2006 2007 2008 2009 2010 May-11
Motorcycle sales
Consumer finance (RHS)
0%
10%
20%
30%
40%
50%
2005 2006 2007 2008 2009 2010
Car salesConsumer finance (RHS)
0%
10%
20%
30%
40%
50%
-60%
-40%
-20%
0%
20%
40%
60%
80%
100%
2001 2002 2003 2004 2005 2006 2007 2008 2009 2010
Sources: Ministry of Finance, Bank Indonesia, media reports, Standard Chartered Research
Share of consumer financing to total financing by finance companies
Adjusted NPF of consumer financing versus NPL of consumption loans by banks
Consumer financing versus motorcycle sales growth Consumer financing versus car sales growth
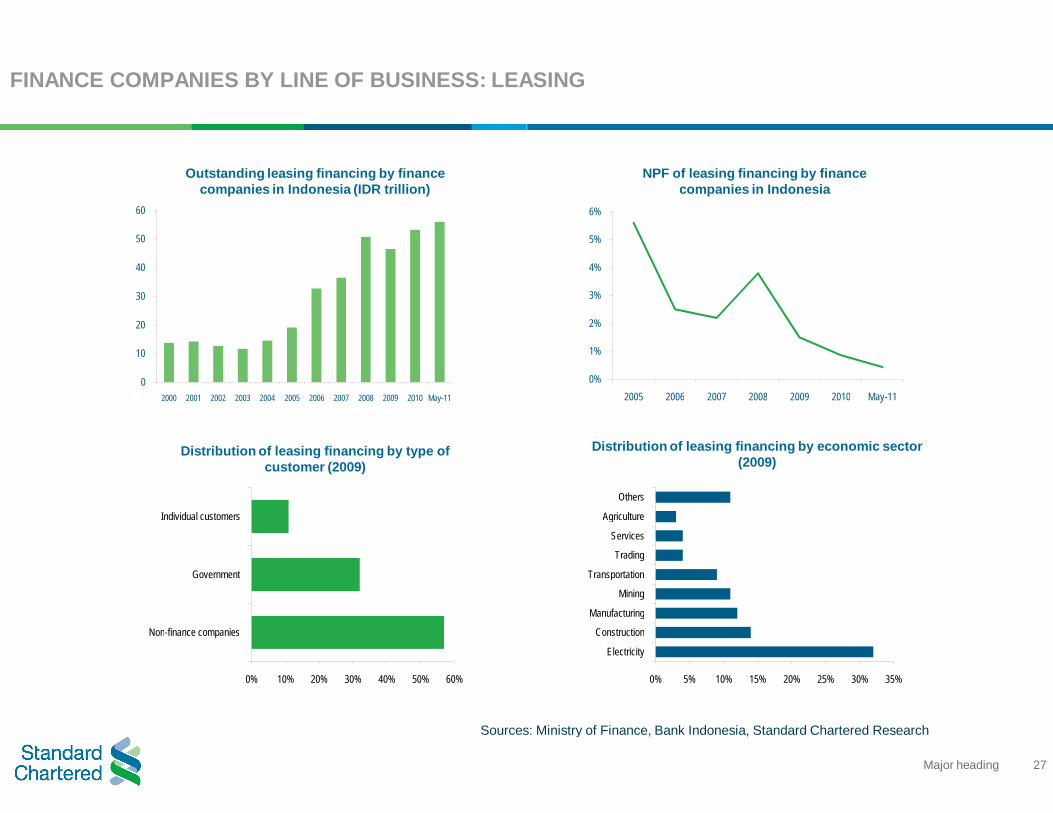
FINANCE COMPANIES BY LINE OF BUSINESS: LEASING
Sources: Ministry of Finance, Bank Indonesia, Standard Chartered Research
0
10
20
30
40
50
60
2000 2001 2002 2003 2004 2005 2006 2007 2008 2009 2010 May-11
0% 10% 20% 30% 40% 50% 60%
Non-finance companies
Government
Individual customers
Outstanding leasing financing by finance companies in Indonesia (IDR trillion)
Distribution of leasing financing by type of customer (2009)
27Major heading
FINANCE COMPANIES BY LINE OF BUSINESS: LEASING
Sources: Ministry of Finance, Bank Indonesia, Standard Chartered Research
0%
1%
2%
3%
4%
5%
6%
2005 2006 2007 2008 2009 2010 May-11
0% 5% 10% 15% 20% 25% 30% 35%
Electricity
Construction
Manufacturing
Mining
Transportation
Trading
Services
Agriculture
Others
NPF of leasing financing by finance companies in Indonesia
Distribution of leasing financing by economic sector (2009)
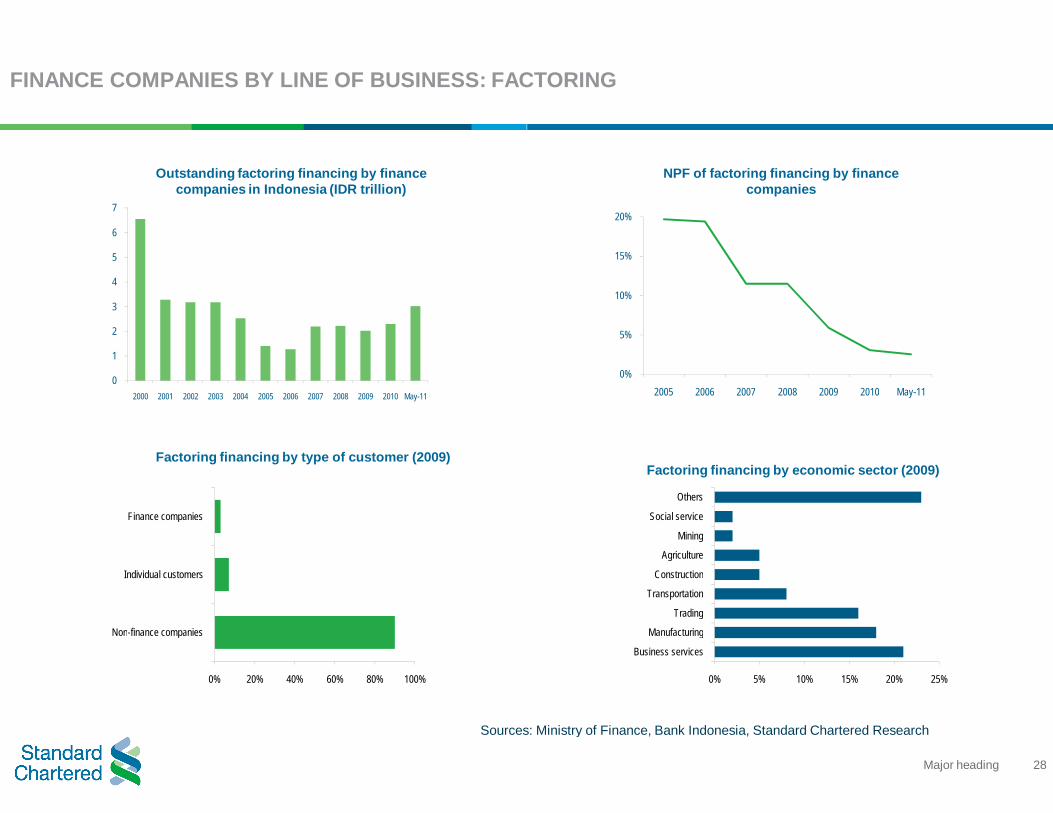
FINANCE COMPANIES BY LINE OF BUSINESS: FACTORING
Sources: Ministry of Finance, Bank Indonesia, Standard Chartered Research
0
1
2
3
4
5
6
7
2000 2001 2002 2003 2004 2005 2006 2007 2008 2009 2010 May-11
0% 20% 40% 60% 80% 100%
Non-finance companies
Individual customers
Finance companies
Outstanding factoring financing by finance companies in Indonesia (IDR trillion)
Factoring financing by type of customer (2009)
28Major heading
FINANCE COMPANIES BY LINE OF BUSINESS: FACTORING
Sources: Ministry of Finance, Bank Indonesia, Standard Chartered Research
0%
5%
10%
15%
20%
2005 2006 2007 2008 2009 2010 May-11
0% 5% 10% 15% 20% 25%
Business services
Manufacturing
Trading
Transportation
Construction
Agriculture
Mining
Social service
Others
NPF of factoring financing by finance companies
Factoring financing by economic sector (2009)
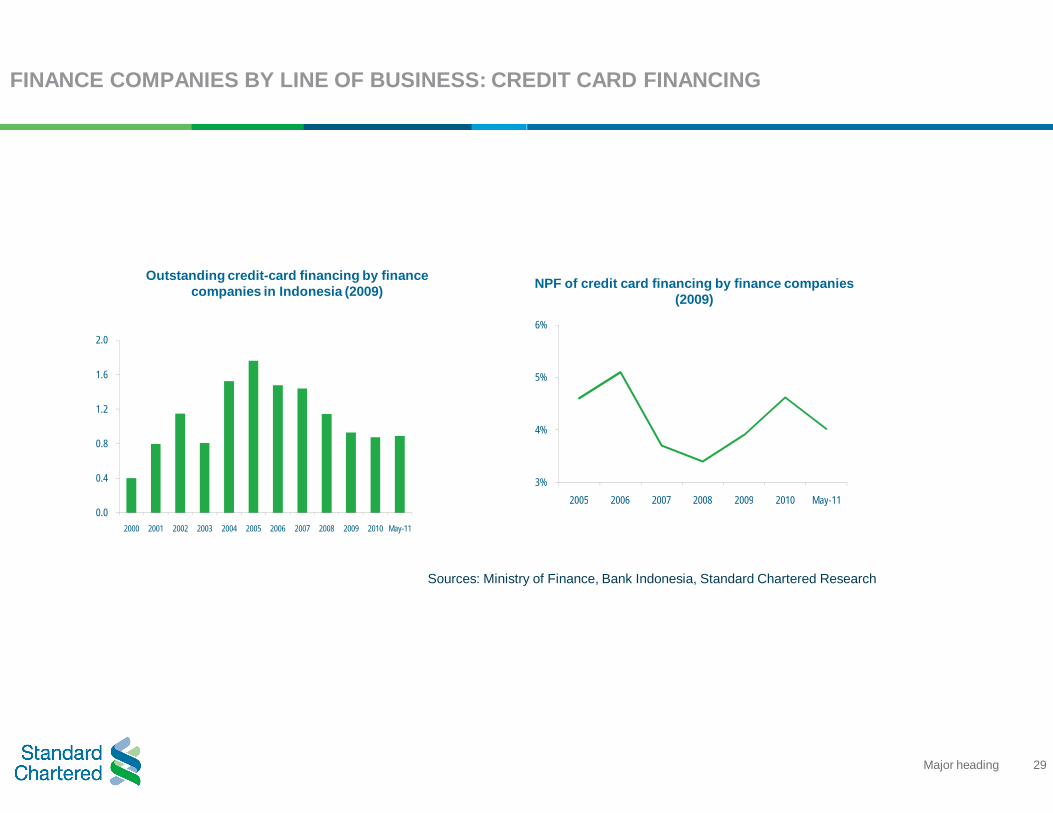
FINANCE COMPANIES BY LINE OF BUSINESS: CREDIT CARD FINANCING
Sources: Ministry of Finance, Bank Indonesia, Standard Chartered Research
0.0
0.4
0.8
1.2
1.6
2.0
2000 2001 2002 2003 2004 2005 2006 2007 2008 2009 2010 May-11
Outstanding credit-card financing by finance companies in Indonesia (2009)
29Major heading
FINANCE COMPANIES BY LINE OF BUSINESS: CREDIT CARD FINANCING
Sources: Ministry of Finance, Bank Indonesia, Standard Chartered Research
3%
4%
5%
6%
2005 2006 2007 2008 2009 2010 May-11
NPF of credit card financing by finance companies (2009)
GOVERNMENT REGULATIONSGOVERNMENT REGULATIONSGOVERNMENT REGULATIONSGOVERNMENT REGULATIONS
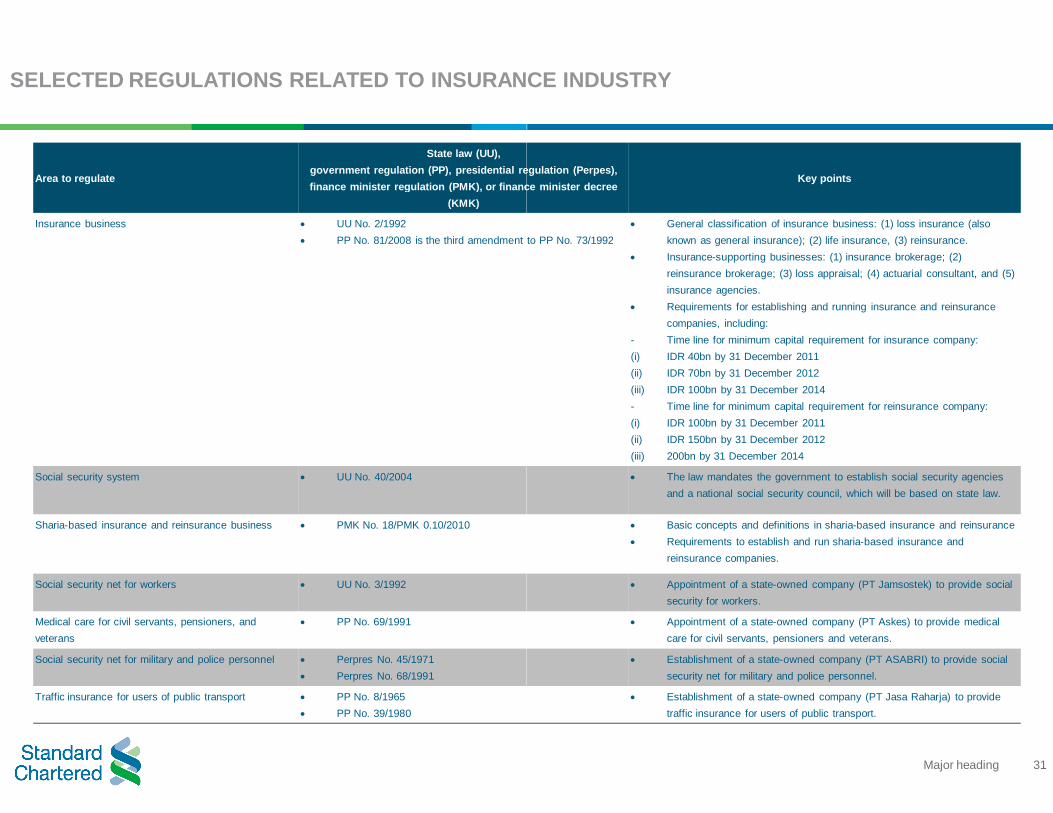
SELECTED REGULATIONS RELATED TO INSURANCE INDUSTRY
Area to regulate
State law (UU), government regulation (PP), presidential regulation (finance minister regulation (PMK), or finance minister decree
(KMK)
Insurance business UU No. 2/1992 PP No. 81/2008 is the third amendment to PP No. 73/1992
Social security system UU No. 40/2004
Sharia-based insurance and reinsurance business PMK No. 18/PMK 0.10/2010
Social security net for workers UU No. 3/1992
Medical care for civil servants, pensioners, and veterans
PP No. 69/1991
Social security net for military and police personnel Perpres No. 45/1971 Perpres No. 68/1991
Traffic insurance for users of public transport PP No. 8/1965 PP No. 39/1980
31Major heading
SELECTED REGULATIONS RELATED TO INSURANCE INDUSTRY
government regulation (PP), presidential regulation (Perpes), finance minister regulation (PMK), or finance minister decree
Key points
PP No. 81/2008 is the third amendment to PP No. 73/1992 General classification of insurance business: (1) loss insurance (also
known as general insurance); (2) life insurance, (3) reinsurance. Insurance-supporting businesses: (1) insurance brokerage; (2)
reinsurance brokerage; (3) loss appraisal; (4) actuarial consultant, and (5) insurance agencies.
Requirements for establishing and running insurance and reinsurance companies, including:
- Time line for minimum capital requirement for insurance company:(i) IDR 40bn by 31 December 2011 (ii) IDR 70bn by 31 December 2012(iii) IDR 100bn by 31 December 2014- Time line for minimum capital requirement for reinsurance company:(i) IDR 100bn by 31 December 2011 (ii) IDR 150bn by 31 December 2012(iii) 200bn by 31 December 2014
The law mandates the government to establish social security agencies and a national social security council, which will be based on state law.
Basic concepts and definitions in sharia-based insurance and reinsurance Requirements to establish and run sharia-based insurance and
reinsurance companies.
Appointment of a state-owned company (PT Jamsostek) to provide social security for workers.
Appointment of a state-owned company (PT Askes) to provide medical care for civil servants, pensioners and veterans.
Establishment of a state-owned company (PT ASABRI) to provide social security net for military and police personnel.
Establishment of a state-owned company (PT Jasa Raharja) to provide traffic insurance for users of public transport.
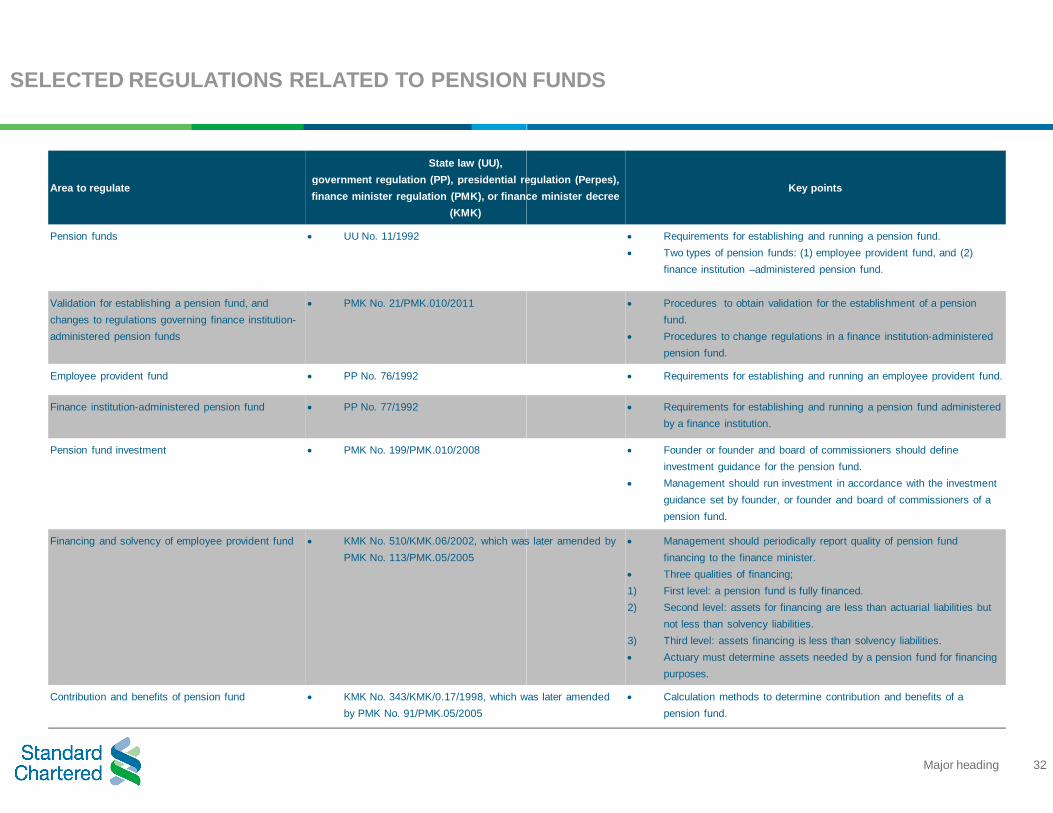
SELECTED REGULATIONS RELATED TO PENSION FUNDS
Area to regulate
State law (UU),government regulation (PP), presidential regulation (finance minister regulation (PMK), or finance minister decree
(KMK)
Pension funds UU No. 11/1992
Validation for establishing a pension fund, and changes to regulations governing finance institution-administered pension funds
PMK No. 21/PMK.010/2011
Employee provident fund PP No. 76/1992
Finance institution-administered pension fund PP No. 77/1992
Pension fund investment PMK No. 199/PMK.010/2008
Financing and solvency of employee provident fund KMK No. 510/KMK.06/2002, which was later amended by PMK No. 113/PMK.05/2005
Contribution and benefits of pension fund KMK No. 343/KMK/0.17/1998, which was later amended by PMK No. 91/PMK.05/2005
32Major heading
SELECTED REGULATIONS RELATED TO PENSION FUNDS
government regulation (PP), presidential regulation (Perpes), finance minister regulation (PMK), or finance minister decree
Key points
Requirements for establishing and running a pension fund. Two types of pension funds: (1) employee provident fund, and (2)
finance institution –administered pension fund.
Procedures to obtain validation for the establishment of a pension fund.
Procedures to change regulations in a finance institution-administered pension fund.
Requirements for establishing and running an employee provident fund.
Requirements for establishing and running a pension fund administered by a finance institution.
Founder or founder and board of commissioners should define investment guidance for the pension fund.
Management should run investment in accordance with the investment guidance set by founder, or founder and board of commissioners of a pension fund.
KMK No. 510/KMK.06/2002, which was later amended by Management should periodically report quality of pension fund financing to the finance minister.
Three qualities of financing;1) First level: a pension fund is fully financed.2) Second level: assets for financing are less than actuarial liabilities but
not less than solvency liabilities.3) Third level: assets financing is less than solvency liabilities. Actuary must determine assets needed by a pension fund for financing
purposes.
KMK No. 343/KMK/0.17/1998, which was later amended Calculation methods to determine contribution and benefits of a pension fund.
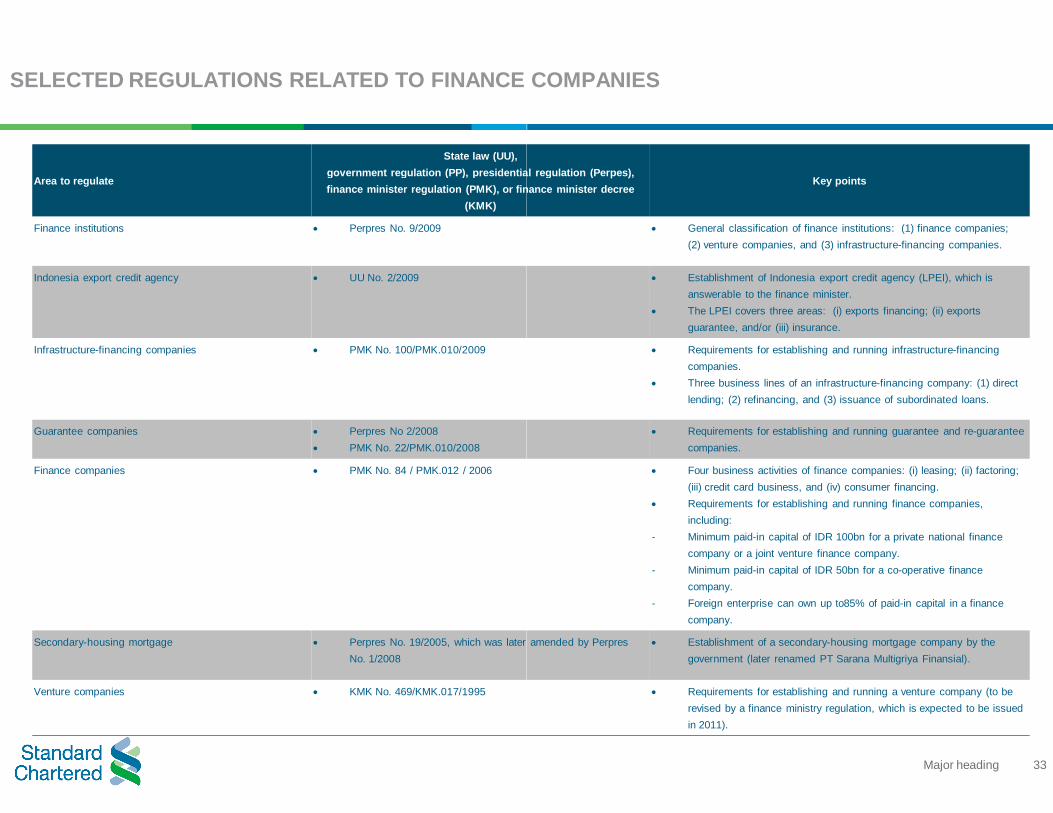
SELECTED REGULATIONS RELATED TO FINANCE COMPANIES
Area to regulate
State law (UU),government regulation (PP), presidential regulation (finance minister regulation (PMK), or finance minister decree
(KMK)
Finance institutions Perpres No. 9/2009
Indonesia export credit agency UU No. 2/2009
Infrastructure-financing companies PMK No. 100/PMK.010/2009
Guarantee companies Perpres No 2/2008 PMK No. 22/PMK.010/2008
Finance companies PMK No. 84 / PMK.012 / 2006
Secondary-housing mortgage Perpres No. 19/2005, which was later amended by No. 1/2008
Venture companies KMK No. 469/KMK.017/1995
33Major heading
SELECTED REGULATIONS RELATED TO FINANCE COMPANIES
government regulation (PP), presidential regulation (Perpes), finance minister regulation (PMK), or finance minister decree
Key points
General classification of finance institutions: (1) finance companies; (2) venture companies, and (3) infrastructure-financing companies.
Establishment of Indonesia export credit agency (LPEI), which is answerable to the finance minister.
The LPEI covers three areas: (i) exports financing; (ii) exports guarantee, and/or (iii) insurance.
Requirements for establishing and running infrastructure-financing companies.
Three business lines of an infrastructure-financing company: (1) direct lending; (2) refinancing, and (3) issuance of subordinated loans.
Requirements for establishing and running guarantee and re-guarantee companies.
Four business activities of finance companies: (i) leasing; (ii) factoring; (iii) credit card business, and (iv) consumer financing.
Requirements for establishing and running finance companies, including:
- Minimum paid-in capital of IDR 100bn for a private national finance company or a joint venture finance company.
- Minimum paid-in capital of IDR 50bn for a co-operative finance company.
- Foreign enterprise can own up to85% of paid-in capital in a finance company.
No. 19/2005, which was later amended by Perpres Establishment of a secondary-housing mortgage company by the government (later renamed PT Sarana Multigriya Finansial).
Requirements for establishing and running a venture company (to be revised by a finance ministry regulation, which is expected to be issued in 2011).
Global Disclaimer (page 1 of 2)Regulatory disclosure
Subject companies: --
Standard Chartered Bank and/or its affiliate(s) has received compensation from this company for the provision of investment banking or financial advisory services within the past year: --.
SCB makes no representation or warranty of any kind, express, implied or statutory regarding this document or any information contained or referred to on the document.
If you are receiving this document in any of the countries listed below, please note the following:
United Kingdom: Standard Chartered Bank ("SCB") is authorised and regulated in the United Kingdom by the Financial Services Authority ("FSA"). This communication is not directed at Retail Clients in the European Economic Area as defined by Directive 2004/39/EC. Nothing in this document constitutes a personal recommendation or investment advice as defined by Directive 2004/39/EC.
Australia: The Australian Financial Services Licence for SCB is Licence No: 246833 with the following Australian Registered Business Number (ARBN : 097571778). Australian investors should note that this document was prepared for wholesale investors only (as defined by Australian Corporations legislation).
China: This document is being distributed in China by, and is attributable to, Standard Chartered Bank (China) Limited which is mainly regulated by China Banking Regulatory Commission (CBRC), State Administration of Foreign Exchange (SAFE), and People’s Bank of China (PBoC).
Hong Kong: This document is being distributed in Hong Kong by, and is attributable to, Standard Chartered Bank (Hong Kong) Limited which is regulated by the Hong Kong Monetary Authority.
Japan: This document is being distributed to the Specified Investors, as defined by the Financial Instruments and Exchange Law of Japan (FIEL), for information only and not for the purpose of soliciting any Financial Instruments Transactions as defined by the FIEL or any Specified Deposits, etc. as defined by the Banking Law of Japan.
Singapore: This document is being distributed in Singapore by SCB Singapore branch only to accredited investors, expert investors or institutional investors, as defined in the Securities and Futures Act, Chapter 289 of Singapore. Recipients in Singapore should contact SCB Singapore branch in relation to any matters arising from, or in connection with, this document.
South Africa: SCB is licensed as a Financial Services Provider in terms of Section 8 of the Financial Advisory and Intermediary Services Act 37 of 2002. SCB is a Registered Credit provider in terms of the National Credit Act 34 of 2005 under registration number NCRCP4.
UAE (DIFC): SCB is regulated in the Dubai International Financial Centre by the Dubai Financial Services Authority. This document is intended for use only by Professional Clients and should not be relied upon by or be distributed to Retail Clients.
United States: Except for any documents relating to foreign exchange, FX or global FX, Rates or Commodities, distribution of this document in the United States or to US persons is intended to be solely to major institutional investors as defined in Rule 15a-6(a)(2) under the US Securities Act of 1934. All US persons that receive this document by their acceptance thereof represent and agree that they are a major institutional investor and understand the risks involved in executing transactions in securities. Any US recipient of this document wanting additional information or to effect any transaction in any security or financial instrument mentioned herein, must do so by contacting a registered representative of Standard Chartered Securities (North America) Inc., 1 Madison Avenue, New York, N.Y. 10010, US, tel + 1 212 667 1000.
WE DO NOT OFFER OR SELL SECURITIES TO U.S. PERSONS UNLESS EITHER (A) THOSE SECURITIES ARE REGISTERED FOR SALE WITH THE U.S. SECURITIES AND EXCHANGE COMMISSION AND WITH ALL APPROPRIATE U.S. STATE AUTHORITIES; OR (B) THE SECURITIES OR THE SPECIFIC TRANSACTION QUALIFY FOR AN EXEMPTION UNDER THE U.S. FEDERAL AND STATE SECURITIES LAWS NOR DO WE OFFER OR SELL SECURITIES TO U.S. PERSONS UNLESS (i) WE, OUR AFFILIATED COMPANY AND THE APPROPRIATE PERSONNEL ARE PROPERLY REGISTERED OR LICENSED TO CONDUCT BUSINESS; OR (ii) WE, OUR AFFILIATED COMPANY AND THE APPROPRIATE PERSONNEL QUALIFY FOR EXEMPTIONS UNDER APPLICABLE U.S. FEDERAL AND STATE LAWS.
Global Disclaimer (page 2 of 2)The information on this document is provided for information purposes only. It does not constitute any offer, recommendation or solicitation to any person to enter into any transaction or adopt any hedging, trading or investment strategy, nor does it constitute any prediction of likely future movements in rates or prices or any representation that any such future movements will not exceed those shown in any illustration. Users of this document should seek advice regarding the appropriateness of investing in any securities, financial instruments or investment strategies referred to on this document and should understand that statements regarding future prospects may not be realised. Opinions, projections and estimates are subject to change without notice.
The value and income of any of the securities or financial instruments mentioned in this document can fall as well as rise and an investor may get back less than invested. Foreign-currency denominated securities and financial instruments are subject to fluctuation in exchange rates that could have a positive or adverse effect on the value, price or income of such securities and financial instruments.
Past performance is not indicative of comparable future results and no representation or warranty is made regarding future performance.
SCB is not a legal or tax adviser, and is not purporting to provide you with legal or tax advice. If you have any queries as to the legal or tax implications of any investment you should seek independent legal and/or tax advice.
SCB, and/or a connected company, may have a position in any of the instruments or currencies mentioned in this document. SCB has in place policies and procedures and physical information walls between its Research Department and differing public and private business functions to help ensure confidential information, including ‘inside’ information is not publicly disclosed unless in line with its policies and procedures and the rules of its regulators. You are advised to make your own independent judgment with respect to any matter contained herein.
SCB and/or any member of the SCB group of companies may at any time, to the extent permitted by applicable law and/or regulation, be long or short any securities or financial instruments referred to on the website or have a material interest in any such securities or related investment, or may be the only market maker in relation to such investments, or provide, or have provided advice, investment banking or other services, to issuers of such investments.
SCB accepts no liability and will not be liable for any loss or damage arising directly or indirectly (including special, incidental or consequential loss or damage) from your use of this document, howsoever arising, and including any loss, damage or expense arising from, but not limited to, any defect, error, imperfection, fault, mistake or inaccuracy with this document, its contents or associated services, or due to any unavailability of the document or any part thereof or any contents or associated services.
Copyright: Standard Chartered Bank 2010. Copyright in all materials, text, articles and information contained herein is the property of, and may only be reproduced with permission of an authorised signatory of, Standard Chartered Bank. Copyright in materials created by third parties and the rights under copyright of such parties is hereby acknowledged. Copyright in all other materials not belonging to third parties and copyright in these materials as a compilation vests and shall remain at all times copyright of Standard Chartered Bank and should not be reproduced or used except for business purposes on behalf of Standard Chartered Bank or save with the express prior written consent of an authorised signatory of Standard Chartered Bank. All rights reserved. © Standard Chartered Bank 2010.
Regulation AC Disclosure:
The research analyst or analysts responsible for the content of this research report certify that: (1) the views expressed and attributed to the research analyst or Analysts in the research report accurately reflect their personal opinion(s) about the subject securities and issuers and/or other subject matter as appropriate; and, (2) No part of his or her compensation was, is or will be directly or indirectly related to the specific recommendations or views contained in this research report. On a general basis, the efficacy of recommendations is a factor in the performance appraisals of analysts.
Data available as of 7 August 2011. This document is released on 9 August 2011


