Indoor Location Sensing Using Geo-Magnetism Jaewoo Chung 1 , Matt Donahoe 1 , Chris Schmandt 1 , Ig-Jae Kim 1 , Pedram Razavai 2 , Micaela Wiseman 2 MIT Media Laboratory 20 Ames St. Cambridge, MA 02139 1 {jaewoo, donahoe, geek, ijkim}@media.mit.edu, 2 {prazavi, wiseman}@mit.edu ABSTRACT We present an indoor positioning system that measures location using disturbances of the Earth's magnetic field caused by structural steel elements in a building. The presence of these large steel members warps the geomagnetic field in a way that is spatially varying but temporally stable. To localize, we measure the magnetic field using an array of e-compasses and compare the measurement with a previously obtained magnetic map. We demonstrate accuracy within 1 meter 88% of the time in experiments in two buildings and across multiple floors within the buildings. We discuss several constraint techniques that can maintain accuracy as the sample space increases. Categories and Subject Description C.3 [Special-purpose and application-based systems]: Real- time and embedded system General Terms Measurement, Performance, Experimentation, Design. Keywords Positioning System, Indoor positioning system, Magnetic field, Magnetic fingerprint, Systems for location determination, Wearable computing and innovative mobile devices, Guiding light. 1. INTRODUCTION In order to provide accurate guidance, navigation systems require accurate measurements for user position and orientation. There are a number of successful strategies for outdoor navigation, like GPS, but indoor navigation must necessarily use different sensing techniques. Indoor localization has relied on other infrastructures [4, 12], such as wireless access points and Bluetooth beacons. We have been developing a handheld projector-based AR navigation assistance system, Guiding Light, for pedestrian navigation inside buildings [19]. Such a service requires a positioning system that delivers both accurate location as well as direction; otherwise the information projected onto a floor or on a wall may cause confusion due to improper mapping of the real and augmented views. We have observed that e-compasses behave erratically inside buildings because steel and concrete skeletons distort the geomagnetic field: the compass doesn’t point to the correct direction – our data shows an average of 45 o error from the ground truth direction, and this error varies with location. As we mapped the distortions in order to calibrate our e-compasses, we noticed that the distortions differ among locations. By using these distortions as map features, we can localize the user. Although previous work has explored using magnetic field measurements as a positioning tool, their methods rely on odometry sensors or constrained movement models [8,9,10,11]. We will discuss the differences between our approach and previous magnetic field-based tools in more detail in the related work section. The scope of this work covers i) results of identifying the characteristics of magnetic field signatures as reference fingerprints to locations, ii) the performance of the positioning system using only magnetic fingerprint matching, and iii) a simple method for reducing outliers and rejecting bad samples. In the paper we will present our system in two design phases; i) the initial system design for investigating the characteristics of the indoor magnetic field and ii) the system design for a pedestrian navigation system. In the pedestrian system design, we further present results of the system evaluation in different indoor environments to provide insights about the performance of our fingerprint method. Lastly, we will present an experiment testing the stability of a building’s influence on measurements of the earth’s magnetic field and its relationship with our system’s performance. Permission to make digital or hard copies of all or part of this work for personal or classroom use is granted without fee provided that copies are not made or distributed for profit or commercial advantage and that copies bear this notice and the full citation on the first page. To copy otherwise, or republish, to post on servers or to redistribute to lists, requires prior specific permission and/or a fee. MobiSys’11, June 28–July 1, 2011, Bethesda, Maryland, USA. Copyright 2011 ACM 978-1-4503-0643-0/11/06...$10.00. 141
Transcript
Indoor Location Sensing Using Geo-Magnetism Jaewoo Chung1, Matt Donahoe1, Chris Schmandt1, Ig-Jae Kim1,
Pedram Razavai2, Micaela Wiseman2 MIT Media Laboratory
ABSTRACT We present an indoor positioning system that measures location using disturbances of the Earth's magnetic field caused by structural steel elements in a building. The presence of these large steel members warps the geomagnetic field in a way that is spatially varying but temporally stable. To localize, we measure the magnetic field using an array of e-compasses and compare the measurement with a previously obtained magnetic map. We demonstrate accuracy within 1 meter 88% of the time in experiments in two buildings and across multiple floors within the buildings. We discuss several constraint techniques that can maintain accuracy as the sample space increases.
Categories and Subject Description C.3 [Special-purpose and application-based systems]: Real-time and embedded system
General Terms Measurement, Performance, Experimentation, Design.
Keywords Positioning System, Indoor positioning system, Magnetic field, Magnetic fingerprint, Systems for location determination, Wearable computing and innovative mobile devices, Guiding light.
1. INTRODUCTION In order to provide accurate guidance, navigation systems require accurate measurements for user position and orientation.
There are a number of successful strategies for outdoor navigation, like GPS, but indoor navigation must necessarily use different sensing techniques. Indoor
localization has relied on other infrastructures [4, 12], such as wireless access points and Bluetooth beacons.
We have been developing a handheld projector-based AR navigation assistance system, Guiding Light, for pedestrian navigation inside buildings [19]. Such a service requires a positioning system that delivers both accurate location as well as direction; otherwise the information projected onto a floor or on a wall may cause confusion due to improper mapping of the real and augmented views.
We have observed that e-compasses behave erratically inside buildings because steel and concrete skeletons distort the geomagnetic field: the compass doesn’t point to the correct direction – our data shows an average of 45o error from the ground truth direction, and this error varies with location. As we mapped the distortions in order to calibrate our e-compasses, we noticed that the distortions differ among locations. By using these distortions as map features, we can localize the user.
Although previous work has explored using magnetic field measurements as a positioning tool, their methods rely on odometry sensors or constrained movement models [8,9,10,11]. We will discuss the differences between our approach and previous magnetic field-based tools in more detail in the related work section.
The scope of this work covers i) results of identifying the characteristics of magnetic field signatures as reference fingerprints to locations, ii) the performance of the positioning system using only magnetic fingerprint matching, and iii) a simple method for reducing outliers and rejecting bad samples.
In the paper we will present our system in two design phases; i) the initial system design for investigating the characteristics of the indoor magnetic field and ii) the system design for a pedestrian navigation system. In the pedestrian system design, we further present results of the system evaluation in different indoor environments to provide insights about the performance of our fingerprint method. Lastly, we will present an experiment testing the stability of a building’s influence on measurements of the earth’s magnetic field and its relationship with our system’s performance.
Permission to make digital or hard copies of all or part of this work for personal or classroom use is granted without fee provided that copies are not made or distributed for profit or commercial advantage and that copies bear this notice and the full citation on the first page. To copy otherwise, or republish, to post on servers or to redistribute to lists, requires prior specific permission and/or a fee. MobiSys’11, June 28–July 1, 2011, Bethesda, Maryland, USA. Copyright 2011 ACM 978-1-4503-0643-0/11/06...$10.00.
141
2. RELATED WORK
Positioning systems are a core technology in mobile computing to provide the foundation for context-aware services, and there exist many such commercially available positioning technologies.
For outdoor environments, GPS is a widely used positioning system that relies on signal time-of-flight between orbiting satellites and a receiver. The technique does not provide orientation measurement, but moving direction can be inferred from a sequence of position updates. Unfortunately, GPS requires line of sight between the receiver and the satellites in order to provide accurate position, and thus the technique does not work well indoors [2].
A few technologies have been developed for indoor positioning. The first indoor badge location sensing system, Active Badge [17], was introduced by Want et al. in 1992. Want developed a cellular proximity system that uses diffuse infrared LEDs which emit a unique identifier periodically. The signal is picked up by nearby infrared sensors around the building to identify the location of the badge. A descendant system, Active Bat [18], uses ultrasound time-of-flight lateration to measure an object’s location within 9 cm of its true position for 95 percent of the measurements.
Recently, the most popular and inexpensive technology is WLAN (802.11)-based positioning. This approach uses two methods for localization: triangulation by measuring signal strength, or times of arrival from known access points (APs), and a fingerprint method to measure relative signal strength from nearby APs when the positions of the APs are unknown. The fingerprint method relies on a map of fingerprints (RSSI distribution) of corresponding locations in order to infer location [3, 4, 5].
While the technologies mentioned above require specific types of devices installed in the environment, computer vision-based positioning systems [7] use visual information in the environment to map and track positions. Through optical input devices, such as cameras, visual features are extracted as spatial references, forming a 3D map. Newly acquired visual features are compared with the map to infer location and camera orientation. These systems can provide centimeter-level accuracy, but the main disadvantage of vision-based tracking is the computation power required. It can be difficult to run in real time on power-constrained devices such as mobile phones.
Instead of using the visual features of an environment as a reference, we can use the unique features of the indoor magnetic field to create a map. This requires less computation power and memory than computer vision, though the accuracy is lower. Using magnetic signatures for localization is a new approach which appears only a handful of times in recent literature.
Using a single electronic compass (that measures in only one plane) mounted on a robot, Siiksakulchai, Thongchai,
Wilkes, and Kawamura [8] developed a localization system using the heading information of a magnetic sensor. Their system collected data and compared the experimental headings to what they actually should have been. At each location, they used the heading error from the current data as well as that from nine previous data points to create a distinctive signature that was then stored. This approach limits their work to localization only in corridors as the robot had to first pass through the same nine points in order to accurately recognize a location's signature. The benefit was that, initially placed anywhere, their robot could eventually determine its position. It requires little computation time or use of memory in order to get the robot to recognize its location.
Haverinen and Kemppainen [9] used a very similar approach – equipping a robot with a single magnetic sensor that measured in all three planes. They ran their robot through a corridor and had it collect data at set locations to create a map of the hallway. They used Monte Carlo Localization (a particle filter) to accurately determine its location from any starting point. The maximum error was about 28 centimeters, though on average the robot needed to travel 25 meters in order to localize itself.
Navarro and Benet [10] extended the idea of magnetic mapping to a two-dimensional area, using a single magnetic compass that measured in one plane. In order to create the two-dimensional map of the magnetic field, they relied on odometry to associate a certain location with unique magnetic readings. They treated the magnetic field as a continuous function in order to estimate magnetic field data at un-sampled points through bilinear interpolation. Then, running the robot in the environment, they used the current data about the magnetic field (and no data memorized from previous timesteps) to compare to the magnetic map to successfully correct positioning errors due to odometry failings.
In our work, we tried to investigate a self-localization approach that does not use odometry or any other model relying on data that are difficult to obtain from pedestrian motion.
3. SYSTEM
Our current system consists of a server that contains a magnetic fingerprint map and a client device that measures the magnetic signature of its current location. When the client collects the signature, it sends the data to the server for localization. The server compares the measurement with all the fingerprints stored in its map and reports back the position associated with the closest matching fingerprint. The server and client communicate via HTTP or via serial port when connected by mini-USB.
142
Figure 1. Initial design of the client device for detecting magnetic signatures
Two separate processes, mapping and tracking, are required in order to infer a location, but the same device can be used for both. Our device design changed over the course of this project as we learned more about the problem. The initial device was designed to capture the magnetic signature with maximum accuracy, while the later system is designed for mobility and faster measurement. Detailed description will be provided in the later sections.
3.1 The Observed Characteristics of Indoor Magnetic Fields
a. A diagram of a sensor rotating around a circle
in 100 steps. Steps 0, 25, 50, 75 are 90o apart.
b. Four heading directions measured at four steps.
c. Bias controlled with step 0.
Figure 2. Distortion of magnetic field measured in a corridor inside a building. The y-axis indicates the deviation error from true direction, and the x-axis indicates location along the corridor.
Our investigation started with measuring the magnetic field inside a building along a ~25 meter corridor every 60 centimeters from a height of 1 meter. Our device is shown in Figure 1. The purpose of the system is to map magnetic field distortion.
We used an electronic compass (HMC6343 – 3 axes magnetic sensor with internal tilt compensated algorithm [17]) to measure the heading of the sensor. While measuring the heading, we used a stepper motor to rotate the sensor in a 5 cm diameter circle with 100 steps per rotation. We compared the measured heading with the actual heading.
As seen in Figure 2b, the deviation in heading varies significantly with position along the corridor. We suspect that the deviation errors correlate with the nearby building structure. It is important to notice that the variations between the four directions are also not equal. This means that the deviations occur on both large and small scales, otherwise we should see fluctuating parallel lines. Figure 2.c amplifies the independent variation from other varying lines by subtracting the value of Step 0.
3.2 Initial Investigation for the System Design
To investigate the feasibility of using the fingerprints corresponding to positions, we built a system to collect two
5 cm
90o
0o
270o
Step 0
Step 75
Step 50
Step 25
180o
5 cm
Turn 360o
in 100 steps
Stepper Motor
Microcontroller and Bluetooth
Magnetic Sensor
Heading
143
datasets: one for creating the magnetic field fingerprint map, and the other for testing the localization performance. The goal of the investigation is to measure the sensitivity of the magnetic signature to determine the resolution of the fingerprint corresponding to accuracy of the system.
The measurement was conducted in a lab building (shown in Figure 3) that houses machine shops, machine rooms for servers, and desktop computers –very similar to settings in a computer science lab. The framework of the building consists of steel and concrete. For fingerprint mapping, as we continued to use the same method we collected data every 60 cm along the corridor 1 m above the floor around a 5 cm diameter circle every 3.6 degrees parallel to the floor. In this measurement, magnetic field B was measured with a three-dimensional vector m = {mx my mz} produced from the HMC6343. Locations and directions are indexed on each collected data such that data can be identified with the indices EL,K = {m0,1 …m0,99 …m59,0 …m59,99} where L is the index for location along the corridor and K is the index for direction. We have collected a total of 60 location points X 100 directions = 6,000 data features.
3.2.1 Algorithm
Our primary method for finding location is based on calculating the least root mean square (RMS) difference between each location point d in the test dataset and the map dataset E. The following
Figure 3. A magnitude map (in units of μT) of the magnetic field inside the experiment area is shown at the left side of the figure.
expression also accommodates the principal method we used with finding the nearest neighbor; given a map dataset E and target location fingerprint d, then a nearest neighbor of d, d’ is defined as:
Equation 1.
where di is the ith feature component (i.e., m) of d. Then, the difference between the location index (ground truth) of test dataset and the index of the nearest neighbor d’ in the map dataset E are used to estimate the accuracy of this method.
We computed the RMS differences with 8 different combinations of m in d where dk = {m1... mk} with common denominator k = {100, 50, 25, 20, 10, 5, 4, 2} to ensure that the distance between indices of the feature component is equal. For example, an instance of d5 can be {m1, m21, m41, m61, m81} or {m2, m22, m42, m62, m82}, where the degree difference between indices is 72o. In our analysis, we computed all combinations in the map dataset corresponding to dk in order to find the correlation between the number of features and accuracy. The purpose of this analysis is to estimate the most cost-effective number of sensors that can be placed in a circumference, which has been emulated by a stepper motor collecting data around the circle.
3.2.2 Initial findings
Figure 4. Normalized confusion matrix of RMS error with k=4. The x- and y-axes indicate the ground truth and predicted locations, respectively.
40 m
144
Figure 5. Results of mean errors produced from a function of K - number of feature vectors used in a fingerprint.
3.2.3 Result The confusion matrix of RMS errors between the map dataset and test data set using d4, as shown in Figure 4, provides us an overview of how well localization using the magnetic fingerprint method would work. As seen in Figure 4, most of the lowest RMS differences are along the line where x and y match, but there are some outliers. In total, our method has an errmean = 3.05 m, errsd = 4.09 m errmax = 15 m, and 70 % of the predicted data had errors of less than 2 meters.
Figure 5 provides overall errmean with varying dk. With varying k, the most cost effective number of sensors is 5, as the slope of errmean increases noticeably when it passes k = 5.
Since a magnetic reading depends on position and orientation, we can use our fingerprint map to predict the orientation as well. Using the fingerprint with lowest RMS to predict the heading, our result shows that predicted heading has a mean angle difference from the true heading of 4.017º (SD = 4.6º) as shown in Figure 6.
Encouraged by the promising results of this analysis, we built a more portable device that can perform localizations in real time. In the next section we will provide an evaluation of this system and show the performance across several environments in the building.
Figure 6. The blue graph plots raw heading directions directly extracted from the sensor reading. The red graph shows the heading directions predicted by the system. The x-axis represents locations along the corridor and the y-axis represents the heading error in terms of degree.
4. SYSTEM FOR PEDESTRIAN LOCALIZATION
With the new design, we have extended the map to include a larger area in two different buildings that are connected through two pathways. The goals of this design are i) to extend the system to provide a wearable device for humans; ii) to use the system on a larger scale; iii) to compare the performance within different structural environments, such as corridors and an atrium; and iv) to compare the fingerprint maps between similar corridors on different floors.
4.1 System Description and Setup for Evaluation
We have created a prototype with 4 sensors (Figure 7) of the same type used in the previous chapter, with an
ATmega328-based microcontroller (Arduino Pro [18]) with communication capability via either Bluetooth or mini-USB cable with baud rate of 115200. The magnetic data, m = {mx, my, mz}, are extracted from the 4 sensors via the I2C protocol every 100ms. The size of m is 6 bytes, and the total size of a sample is 28 (24 + 4) bytes including two label indices, L and D, which are 2 bytes each. The collected data were sent to a laptop computer via a USB cable.
145
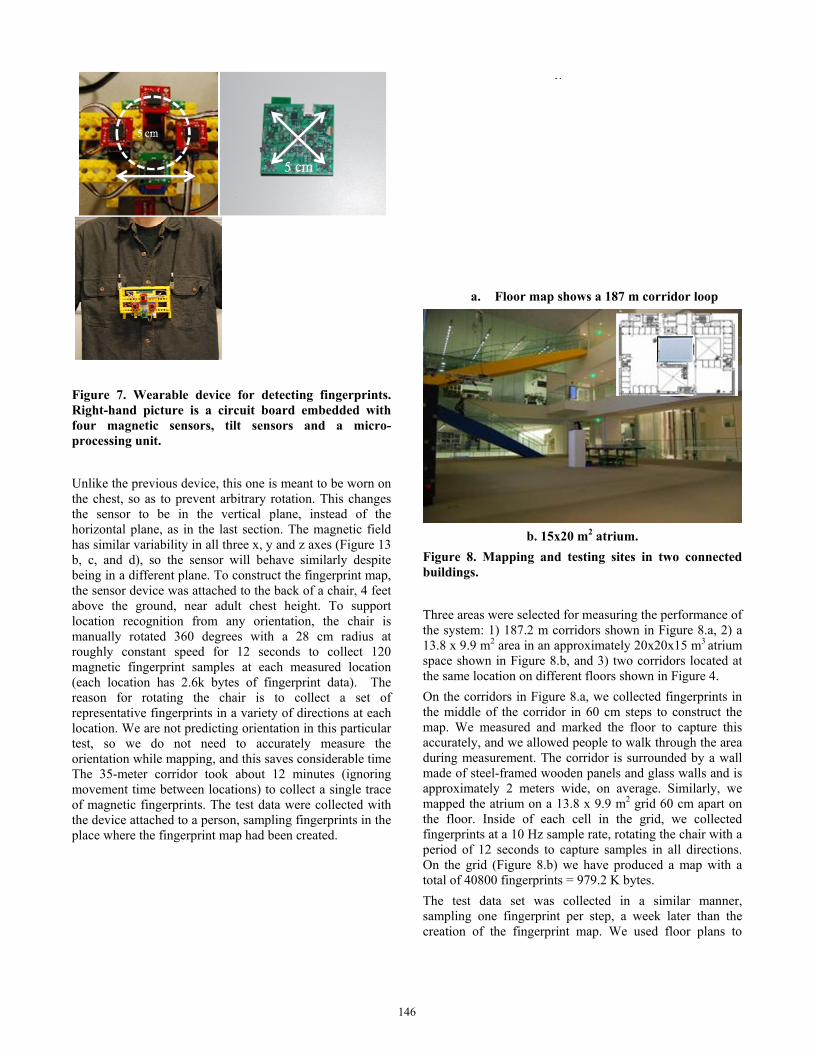
Figure 7. Wearable device for detecting fingerprints. Right-hand picture is a circuit board embedded with four magnetic sensors, tilt sensors and a micro-processing unit.
Unlike the previous device, this one is meant to be worn on the chest, so as to prevent arbitrary rotation. This changes the sensor to be in the vertical plane, instead of the horizontal plane, as in the last section. The magnetic field has similar variability in all three x, y and z axes (Figure 13 b, c, and d), so the sensor will behave similarly despite being in a different plane. To construct the fingerprint map, the sensor device was attached to the back of a chair, 4 feet above the ground, near adult chest height. To support location recognition from any orientation, the chair is manually rotated 360 degrees with a 28 cm radius at roughly constant speed for 12 seconds to collect 120 magnetic fingerprint samples at each measured location (each location has 2.6k bytes of fingerprint data). The reason for rotating the chair is to collect a set of representative fingerprints in a variety of directions at each location. We are not predicting orientation in this particular test, so we do not need to accurately measure the orientation while mapping, and this saves considerable time The 35-meter corridor took about 12 minutes (ignoring movement time between locations) to collect a single trace of magnetic fingerprints. The test data were collected with the device attached to a person, sampling fingerprints in the place where the fingerprint map had been created.
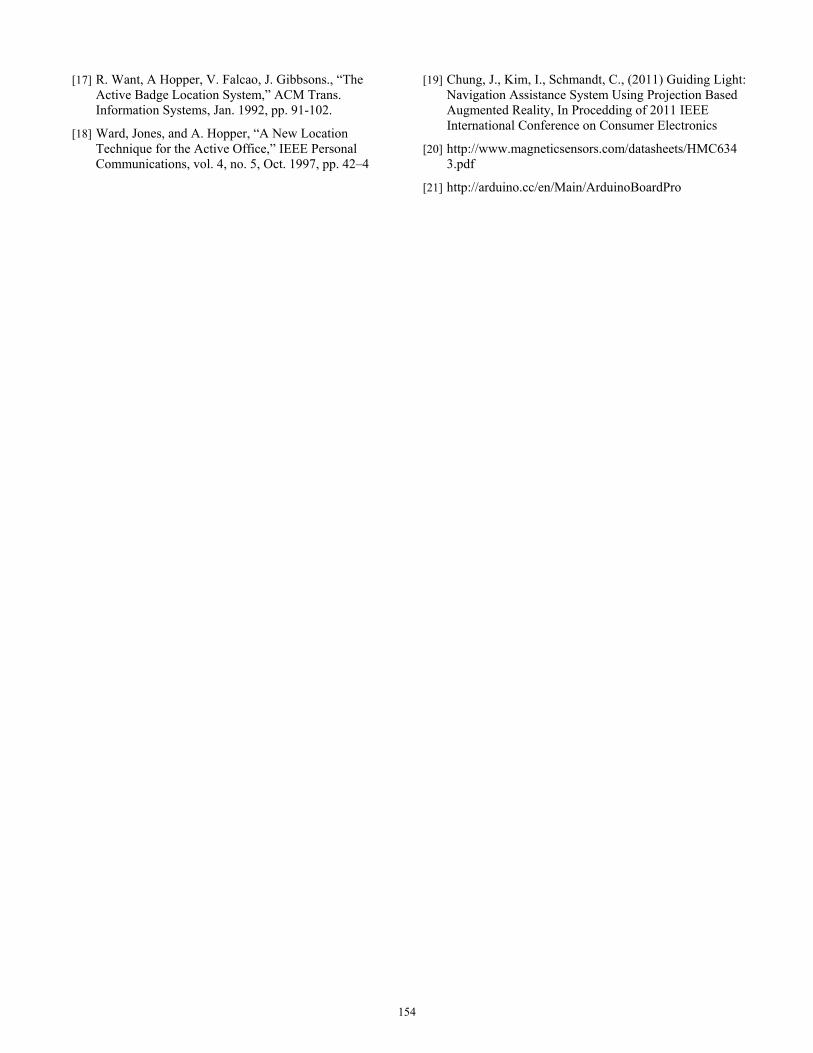
a. Floor map shows a 187 m corridor loop
b. 15x20 m2 atrium.
Figure 8. Mapping and testing sites in two connected buildings.
Three areas were selected for measuring the performance of the system: 1) 187.2 m corridors shown in Figure 8.a, 2) a 13.8 x 9.9 m2 area in an approximately 20x20x15 m3 atrium space shown in Figure 8.b, and 3) two corridors located at the same location on different floors shown in Figure 4.
On the corridors in Figure 8.a, we collected fingerprints in the middle of the corridor in 60 cm steps to construct the map. We measured and marked the floor to capture this accurately, and we allowed people to walk through the area during measurement. The corridor is surrounded by a wall made of steel-framed wooden panels and glass walls and is approximately 2 meters wide, on average. Similarly, we mapped the atrium on a 13.8 x 9.9 m2 grid 60 cm apart on the floor. Inside of each cell in the grid, we collected fingerprints at a 10 Hz sample rate, rotating the chair with a period of 12 seconds to capture samples in all directions. On the grid (Figure 8.b) we have produced a map with a total of 40800 fingerprints = 979.2 K bytes.
The test data set was collected in a similar manner, sampling one fingerprint per step, a week later than the creation of the fingerprint map. We used floor plans to
146
estimate the coordinates of the fingerprint locations. Both map and test data were collected during the daytime.
We used a modified version of the RMS-based nearest neighbor searching algorithm for localization that was used in the previous section. As we use 4 sensors for sampling fingerprints, the data structure of the system is changed such that d contains four 3-dimensional vectors, draw = [mx1,
my1, mz1, mx2, my2, mz2, mx3, my3, mz3,mx4, my4, mz4]. In addition, the data structure of the fingerprint map is defined as EL,K = [d1,1 …d1,k…dL,1 …dL,k] where L is the index for location along the corridor and K is the component ID collected at location L.
In addition to raw vectors, we also consider using the unit vector u, and norm n, defined as follows:
4.2 Evaluation
4.2.1 Results of performance in corridors and atrium Figure 9 shows predicted versus actual point index for the corridor and atrium. Most of the points are correctly identified; however, there are some outliers which cause a large mean error, , and a large standard deviation of . The atrium had slightly worse performance, but a point index can be misleading since we measured in a grid: adjacent points in a grid will not necessarily have consecutive indices. To get a better sense of performance, we calculated error distances.
a. Least RMS errors in corridors
Table 1 summarizes the localization experiment with the nearest neighbor searching algorithm. The result is computed based on 310 test data points compared to 37200 fingerprints in the map data set for the corridor experiment; 408 test data points were compared to 40800 fingerprints for the atrium experiment.
b. Least RMS errors in atrium
Figure 9. The graphs show the results of measuring performance of the system in terms of RMS error in the corridors (a) and the atrium (b). The x- and y-axes indicate location indexes of the ground truth position and the predicted position, respectively.3
The results of the experiments (applying no speed or moving direction constraints) using the entire search space are: errmean= 6.28 m ( errsd = 12.80 m, errmax = 52.60 m) for the corridor and errmean = 2.84 m ( errsd = 3.39 m, errmax = 12.82 m) for the atrium. The mean and deviation for the corridor are larger since the covered area is larger, encompassing 178m of corridors in two buildings. The overall performance looks better in the atrium experiment as the errmean is small. However, the corridor experiment has more room to produce an outlier far (maximum 73 meters) from the true position, whereas the maximum outlier the atrium can produce is small (15 meters). Search space in radius (m)
Searching amount in map (%)
Err mean (m)
Err SD (m) Err max (m)
Failure rate (%)
Corridor experiment
>72 100 6.28 12.80 52.60 0
40 78 4.50 9.89 39.82 0
30 56 2.81 6.82 28.55 0
20 32 1.25 3.63 19.45 0
10 12 0.48 1.43 9.91 0
5 6.2 0.26 0.62 4.96 0
Atrium experiment
>15 100 2.84 3.39 12.83 0
9 82 2.24 2.91 8.99 0
6 50 1.36 1.75 5.80 0
3 17 0.64 0.85 2.99 0
1 1.9 0.18 0.29 0.80 0
Table 1. The table shows the result of localization performance in terms of Err between ground truth and predicted location.
147
The histogram (Figure 10) of error distribution for both experiments shows that 75.7 % of the predicted positions have an error less than 1m. In our result, Err mean correlates linearly with the number of locations in the search space.
a. Corridor
b. Atrium
Figure 10. Histogram of distance error.
Two general methods can be applied to reduce error: i) adding additional localization information via an external source and ii) applying constraint models in the algorithm, such as simple parameter adjustment or building a model, i.e., particle filters [15]. For additional localization,
Bluetooth beacons or 802.11-based positioning systems (3–30 meter accuracy range) with an update rate in the range of a few seconds [4] can be used to filter outliers. Accuracy ranging from 2.5 to 8 meters in corridors and 2 to 5 meters in open spaces is observed from our informal experiments using the 802.11 RSSI fingerprint method [5]. The result of the experiment with varying limits on search space, shown in Table 1, provides a possibility for potential enhancement of localization performance with a supporting localization assistant.
In our study, we applied constraints in our searching algorithm to reduce outliers. The table shows the result of applying constraints in our nearest neighbor (NN) algorithm by i) varying the search space from the last known position and ii) filtering the predicted position by adding conditions in our algorithm. In addition to draw, we compute using dnorm and dunit_vector to get the estimated position. The location results produced by the three different vectors are compared, and if they are close, we accept the position. This is defined as: |L’raw↔L’norm| ≤ 1 or |L’raw↔L’unit vector| ≤ 1, where L’ is a location index of d’ as defined in Equation 1 in the previous section. To get an initial position, we use the strategy of expanding the search space to its maximum and then reducing it to the target search space size.
Table 2. The table shows the result of the modified algorithm.
The result of overall performance of applying constraints is listed in Table 2. The algorithm effectively filtered the noise : 88 % of the predictions fall under 1 meter of error in the case of the full search space in the corridor, and 86.6% do for the atrium.
Search area in diameter (m)
Searching amount in Map (%)
Err mean (m)
Err SD (m)
Err max (m)
Failure rate (%)
Corridor experiment
>72 100 4.96 13.94 70.59 24
40 78 1.65 6.15 45.72 43
30 56 0.66 3.22 27.18 44
20 32 0.32 1.15 28.77 40
10 12 2.74 7.01 9.918 28
5 6.2 0.23 0.56 4.96 4
Atrium experiment
>15 100 0.96 2.17 11.32 57
9 82 0.61 1.75 9.69 73
6 50 1.63 3.07 12.30 78
3 17 2.65 3.77 12.40 78
1 1.9 6.75 4.30 15.19 62
148
a. Corridor
b. Atrium
Figure 11. Reduction of error using filters shown in the histogram of distance error.
Since this filter rejects inaccurate predictions caused by noisy measurements, multiple rejections can lower the update frequency. However, in our real-time tests, the device was able to produce updates faster than 1Hz. Using a search area constraint in our model can make it sensitive to noise and, more importantly, increases the likelihood of
falling into the local minimum problem [16]. However, a
more advanced model (such as a particle filter) could avoid this issue, at the cost of more computation power.
Figure 12. Cumulative distribution function of distance error produced by the system. The graphs compare the four results shown in Figures 10 and 11.
4.2.2 Results of comparing overlapping corridors on different floors Since overlapping sections of a building share the same or similar underlying steel structure, we wanted to compare the magnetic readings on different floors. We measured the magnetic vector along two overlapping corridors on adjacent floors in the building. Figure 13 shows the magnitude difference on each floor. Although the peaks of the varying magnitude of the magnetic field along the corridors show correlation, the magnitude of the field does not.
We also examined the fingerprint difference between floors using a dataset with 120 location points, 60 points from each floor. We tested in the corridor shown in Figure 3 (and Figure 9.c) and the corridor directly underneath on the 2nd floor. The basic layout along the corridor is the same, but some parts of the walls along the corridor are glass.
The result of the experiment shows that no points were mistakenly predicted to be on the wrong floor.
True location
Predicted location 2nd Floor 3rd Floor
2nd Floor 1.0 0
3rd Floor 0 1.0
Although we cannot generalize this result as the size of the experiment is small, our result suggests that the overlapping locations on different floors may have different magnetic signatures.
149
a. ||m||
b.mx
c. my
d. mz
Figure 13. Comparing the traces of magentic field measurements on the 2nd and 3rd floors, but in similar positions projected on the (x,y,z) plane.
Indoor magnetic field stability
The stability of the geo magnetic field inside of a building is critical to determining the long-term performance of our system. Since the field can be affected by many different elements, we examined 1) the magnetic field’s stability inside of a building over time, 2) the effect of moving objects on system performance, and 3) the effect of objects carried by the user.
To examine this stability over time, we collected three datasets of 60 fingerprints along a corridor. Each dataset is collected at the same location but at different times. The
collected data are considered as a vector set, Minit, M2_week, and M6_month, where Minit and M2_week were taken two weeks apart and Minit and M6_month were taken a six month apart. We examine the similarity between the sets in terms of angle differences (Equation 2) and magnitude differences (Equation 3) as defined below:
Equation 2.
150
Equation 3.
Figure 14. The graph represents the magnitude of the magnetic fields ||Minit||, ||M2_week|| and ||M6_month||. The x-axis represents the location index number, and the y-axis represents magnitude in µT.
The result of our analysis shows that CosineSimilarity(Minit, M2_week) = 0.9997, and CosineSimilarity(Minit, M6_month) = 0.9977. For the similarity of the magnitude, it shows Magnitude(M6_month, Minit) = 0.99 and Magnitude(M2_week, Minit) = 1.01. This result, as shown in Figure 14, validates that the magnetic field did not change over a six month period.
To examine the effects near moving objects, we tested several scenarios. We first measured the effect that a moving elevator has on localization by calculating RMS error as a function of distance from the elevator. We did this both with and without the elevator in place. Then, we tested the effect of smaller mobile objects by fixing the sensor location and measuring RMS error as the object is brought closer to the sensor. More specifically, we measured the effect of a work-bench (Figure 15.a), a laptop (15” MacBook Pro 2008 model), a mobile phone (Samsung Galaxy S) and a wrist watch (Figure 15.b). Finally, we tested the effect of furniture rearrangement in a room sampling the fingerprints, with furniture in the room (Figure 15.c), and then with furniture removed (Figure 15.d).
We compared the RMS errors caused by objects to RMS distances between fingerprints in the map. We find that the minimum RMS distance between any two measured points in our fingerprint map is 1.96 µT. In order for a measured location to still be resolved to the correct fingerprint, we assume that the RMS error caused by an object or other disturbance must be less than 0.98 µT. We consider this to be the error tolerance.
In most cases, the presence or absence of objects introduced an RMS error of less than 1 µT when the objects were 12.5 cm distanced apart. The one exception was standing next to the elevator. As shown in the Figure 16, the overall error drops quickly with distance from the sensor. In the case of elevator, the RMS error drops below 1 µT when the sensor is about 1.3 meters away from the elevator whereas the work bench full of metal tools and electronic devices do not change the error very much. Similarly, errors measured in a room, with and without furniture, was also not significant (RMS error = 0.71 µT).
In the case of interference from carried objects such as a laptop, a cell-phone and a wrist watch, we note that the influence from these objects drops quickly as the distance increases to around 12 cm. Assuming the user is wearing the sensor as a badge-like device on his chest, any objects in their hands or in a backpack would be a sufficient distance away and thus have negligible effect.
a
c d
Figure 15. The picture shows the test settings for measuring magnetic field changes due to a work bench, a watch, electronic devices, and furniture. The dashed white circle indicates the location of a magnetic sensor.
b
151
Figure 16. The graphs describe errors in our system caused by nearby metal objects. The y-axis represents the RMS error and the x-axis represents the distance between the object and the sensor.
5. DISCUSSION AND CONCLUSION
Besides the empirical results shown in this paper, we observed successful tracking positions in different environments. One interesting observation from an experiment conducted in elevators collecting magnetic field fingerprints inside the car at every floor and tracking the location as the car moves up and down shows 100% accurate prediction at each floor. The experiments were conducted in two different elevators in two different buildings (one in a four story building, and another in a six story building).
This system was designed to work in a large building, but small scale positioning is also possible. Our informal result shows that within a 2x2x2 m3 cubic area with 20 different locations in the fingerprint map, our system was able to
differentiate locations separated by as little as 1.6cm. This example shows the potential to not only locate people in a building at the meter scale, but also at the centimeter scale, such as for tracking objects on a desktop. In future work we will investigate the technology’s usage for object tracking and tangible interfaces.
This system is in an early design stage, and the purpose of our study is to show the system’s most basic performance before applying more advanced probabilistic and statistical models. We provide an insight of how this system will work to support pedestrians with no constraints on moving and speed.
System Wireless
Technology Positioning Algorithm
Accur-acy
Precision Cost
Our system
Magnetic Fingerprints
Nearest Neighbor-hood with least RMS
4.7 m 90% within 1.64 m
50 % within 0.71 m
Med-ium
RADAR WLAN RSS fingerprints
kNN, Viterbi-like algorithm
3-5 m 90% within 5.9 m
50% within 2.5 m
Low
Horus WLAN RSS fingerprints
Probabilistic method
2 m 90% within 2.1 m
Low
Where Net
UHF TDOA Least Square/RWGH
2-3 m 50% within 3m
Low
Ubisense Uni-directional UWB TDOA + AOA
Least Square 15 cm 99% within 0.3m
High
GSM finger-printing
GSM cellular network (RSS)
Weighted kNN
5m 80% within 10m
Med-ium
Table 3. Wireless-based indoor positioning system [6] by Liu et al. in the article of “Survey of Wireless Indoor Positioning Techniques and Systems.”
Compared to other positioning technologies listed in Table 3, our system performs reasonably well (precision of 90% within 1.64 meter accuracy) in positioning. Other systems have infrastructure overheads such as WLAN APs and beacons for broadcasting signals inside buildings which contribute additional costs. However, these systems have the advantage of fixed local references provided by the WLAN APs or beacons. When the device detects signals from a particular beacon, it must be within the broadcast radius of that beacon, which puts an upper bound on the distance error. Our system does not use fixed local
152
references and hence an outlier could be placed at any location in the fingerprint map.
These outliers can be reduced by incorporating a more advanced prediction algorithm, such as a particle filter, which uses a movement model to reject unlikely positions. We also believe that by combining magnetic fingerprints with a WLAN RSS method (which can provide localization to within 10 meters, according to Table 3), we can effectively eliminate outliers and achieve 0.45m accuracy.
For hardware design choices, we wanted to make a device that was roughly the size of a cell phone. We found that a 5cm distance between sensors provided enough variability in magnetic field while still fitting our form factor requirement.
The limitation of the system is that the chance of error increases with the size of the fingerprint map, and the cost of mapping every space in a building may require significant effort and time using the presented method. In future work, we will investigate faster and more accurate methods of mapping a building.
6. ACKNOWLEDGMENT
We would like to thank Kuang Xu, Nanwei Gong, Eddie Xue, and Juan Heurtas for the help in the research. We would also like to thanks our reviewers for their constructive feedback and especially Roy Want for helping us improve the paper.
7. REFERENCES
[1] Nack, Frank, "Add to the Real [Media Beat]," Multimedia, IEEE , vol.17, no.1, pp.4-7, Jan.-March 2010
[2] E. D. Kaplan, editor. 1996, Understanding GPS: Principles and Applications. Artech House, 1996.
[3] LaMarca, A. et al., 2005, "Place Lab: Device Positioning Using Radio Beacons in the Wild". To appear, Pervasive 2005, Munich Germany.
[4] Hui Liu, Darabi, H., Banerjee, P., Jing Liu, "Survey of Wireless Indoor Positioning Techniques and Systems," Systems, Man, and Cybernetics, Part C: Applications and Reviews, IEEE Transactions on , vol.37, no.6, pp.1067-1080, Nov. 2007
[5] Kaemarungsi, K.; Krishnamurthy, P.; , "Modeling of indoor positioning systems based on location fingerprinting," INFOCOM 2004. Twenty-third AnnualJoint Conference of the IEEE Computer and Communications Societies , vol.2, no., pp. 1012- 1022 vol.2, 7-11 March 2004
[6] YanyingGu; Lo, A.; Niemegeers, I.; , "A survey of indoor positioning systems for wireless personal networks," Communications Surveys & Tutorials, IEEE , vol.11, no.1, pp.13-32, First Quarter 2009
[7] Karlsson, N.; di Bernardo, E.; Ostrowski, J.; Goncalves, L.; Pirjanian, P.; Munich, M.E.; , "The vSLAM Algorithm for Robust Localization and Mapping," Robotics and Automation, 2005. ICRA 2005. Proceedings of the 2005 IEEE International Conference on , vol., no., pp. 24- 29, 18-22 April 2005
[8] Suksakulchai, S.; Thongchai, S.; Wilkes, D.M.; Kawamura, K.; , "Mobile robot localization using an electronic compass for corridor environment," Systems, Man, and Cybernetics, 2000 IEEE International Conference on , vol.5, no., pp.3354-3359 vol.5, 2000
[9] Haverinen, J.; Kemppainen, A.; , "A global self-localization technique utilizing local anomalies of the ambient magnetic field," Robotics and Automation, 2009. ICRA '09. IEEE International Conference on , vol., no., pp.3142-3147, 12-17 May 2009
[10] Navarro, D.; Benet, G.; , "Magnetic map building for mobile robot localization purpose," Emerging Technologies & Factory Automation, 2009. ETFA 2009. IEEE Conference on , vol., no., pp.1-4, 22-25 Sept. 2009
[11] Georgiou, E.; Jian Dai; , "Self-localization of an autonomous maneuverable nonholonomic mobile robot using a hybrid double-compass configuration," Mechatronics and its Applications (ISMA), 2010 7th International Symposium on , vol., no., pp.1-8, 20-22 April 2010
[12] Bruno, R., Delmastro, F.: Design and analysis of a Bluetooth-based indoor localization system. Personal Wireless Communications, 711–725 (2003)
[13] J. Krumm and E. Horvitz. Locadio: Inferring motion and location from wi-fi signal strengths. In Proceedings of International Conference on Mobile and Ubiquitous Systems: Networking and Services (MobiQuitous'04), 2004
[14] Gebre-Egziabher, D.; Hayward, R.C.; Powell, J.D.; , "A low-cost GPS/inertial attitude heading reference system (AHRS) for general aviation applications," Position Location and Navigation Symposium, IEEE 1998 , vol., no., pp.518-525, 20
[15] F. Gustafsson, F. Gunnarsson, N. Bergman, U. Forssell, J. Jansson, R. Karlsson, and P.-J. Nordlund, "Particle filters for positioning, navigation and tracking", IEEE Trans. Signal Processing, vol. 50, pp.425 -437 2002
[16] M. Gori and A. Tesi, "On the problem of local minima in backpropagation ", IEEE Trans. Pattern Anal. Mach. Intell., vol. 14, no. 1, pp. 76 - 86, 1992.
153
[17] R. Want, A Hopper, V. Falcao, J. Gibbsons., “The Active Badge Location System,” ACM Trans. Information Systems, Jan. 1992, pp. 91-102.
[18] Ward, Jones, and A. Hopper, “A New Location Technique for the Active Office,” IEEE Personal Communications, vol. 4, no. 5, Oct. 1997, pp. 42–4
[19] Chung, J., Kim, I., Schmandt, C., (2011) Guiding Light: Navigation Assistance System Using Projection Based Augmented Reality, In Procedding of 2011 IEEE International Conference on Consumer Electronics