2014 International Conference on Indoor Positioning and Indoor Navigation, 27th–30th October 2014
Indoor Positioning Using Multi-Frequency RSSwith Foot-Mounted INS
Martin Nilsson∗, Jouni Rantakokko∗†, Martin A. Skoglund‡, and Gustaf Hendeby‡§∗ Dept. of Robust Telecommunications, Swedish Defence Research Agency (FOI), Linkoping, Sweden
† Dept. of Signal Processing, KTH Royal Institute of Technology, Stockholm, Sweden‡ Dept. of Electrical Engineering, Linkoping University, Linkoping, Sweden
§ Dept. of Sensor & EW Systems, Swedish Defence Research Agency (FOI), Linkoping, Sweden
Abstract—This paper presents a system which combines azero-velocity-update-(ZUPT-)aided inertial navigation system (INS),using a foot-mounted inertial measurement unit (IMU), withopportunistic use of multi-frequency received signal strength(RSS) measurements. The system does not rely on maps orpre-collected data from surveys of the radio-frequency (RF)environment. Instead it builds its own database of collectedRSS measurements during the course of the operation. NewRSS measurements are continuously compared with the storedvalues in the database, and when the user returns to a previouslyvisited area this can thus be detected. This enables loop-closuresto be detected online and used for error drift correction. Thesystem utilises a distributed particle simultaneous localization andmapping (DP-SLAM) algorithm which provides a flexible 2Dnavigation platform that can be extended with more sensors. Theexperimental results presented in this paper indicates that thedeveloped RSS SLAM algorithm can, in many cases, significantlyimprove the positioning performance of a foot-mounted INS.
I. INTRODUCTION
A reliable and accurate positioning system is expectedsignificantly improve the safety for first responders and toenhance their operational efficiency. To achieve this, a firstresponder positioning system must be able to provide at leastroom level accuracy during extended indoor operations, andin other global navigation satellite system (GNSS)-challengedenvironments. There are also other important requirementsbesides raw performance, such as weight and cost, to con-sider when designing a personal positioning system intendedfor safety-of-life applications. The system should be able tooperate in unknown environments without relying on any pre-installed infrastructure [1]. An overview of the challengesassociated with reliable indoor positioning for first responderapplications, as well as sensor types that could be consideredwhen implementing such systems, is given in [1].
Wearable mobile indoor positioning systems, intended forfirst responders and other pedestrian applications (such aslocation-based services, pervasive gaming, and navigation sup-port), have received increased attention the last decade or so.A first approach to the problem is to use inertial sensors. With
This work was funded by the Swedish Armed Forces through the Commandand Control R&D program, reference AF.9220209. The work has also beensupported by the project Cooperative Localization (CoopLoc) funded bySwedish Foundation for Strategic Research (SSF), the Swedish strategicresearch center Security Link and the Vinnova Industry Excellence CenterLINK-SIC
the rapid progress of sensor miniaturization (micro electromechanical systems, MEMS) technology, inertial measurementunits (IMUs) have become both small and affordable enoughto be used in pedestrian and professional applications. Exam-ples of operational systems employ pedestrian dead-reckoning(PDR) type of algorithms are [2, 3]. In these the data fromaccelerometers, gyroscopes, magnetometers are used to detectwhen the person takes a step and to determine the orientationof the IMU. Motion classification and models can then beapplied to decide upon the direction of the step.
Lately, many research groups have turned their focus to-wards foot-mounted IMUs, which has the potential to provideimproved accuracy and robustness [1]. An early example usingshoe-mounted inertial and magnetic sensors was presentedin [4], and since then several similar systems have beendeveloped [2, 5–8]. The key idea is to detect and utilize thestand-still phase of the foot during each gait cycle in a zero-velocity-update (ZUPT). This limits the drift caused by doubleintegrating imperfect measurements, but cannot completelyalleviate the effect which results in a degrade in the positionestimate over time and/or travelled distance [8]. To obtain longtime stable estimates, additional sensor information must beused.
One approach to improve the long term stability is toincorporate information about beforehand measured receivedsignal strength (RSS) maps or floor plans to support thepositioning. In [9] a method for acquiring RSS measurementsto create a map is described and it is represented usingGaussian processes (GP). An early example of utilizing suchmap information is the RADAR system [11]. These methodshave gained attention as they are suitable for implementationon smartphones, which have the required sensors. Relyingon pre-collected map information works well where this ispossible [12], e.g., in shopping malls or office buildings [13].However, first responder applications are more demanding asRSS maps cannot be obtained beforehand and, if they exist, areprone to change. In these situations simultaneous localizationand mapping (SLAM) approaches can be employed instead.
There are several SLAM systems relying on RSS mea-surements, e.g., WiFi GraphSLAM [14], an application ofGraphSLAM [15] to use RSS measurements from WiFi; theGP based SLAM solution in [16]; and in [17] information fromboth previously known and unknown WiFi access points are
2014 International Conference on Indoor Positioning and Indoor Navigation, 27th–30th October 2014
used for positioning. RSS measurements have also been used inconjunction with foot-mounted INS systems, in the WiSLAMmethod [18].
WiFi RSS measurements may fail in many first responderscenarios for several reasons, the electricity in the buildingmay be lost or WiFi may not be installed at all. A less exploredalternative is to employ multi-frequency RSS measurementsof other opportunistic radio sources, e.g., FM radio and TVstations. These are more or less available everywhere. Thestudy presented in [19] indicates that a combination of FMand WiFi RSS measurements can be used to distinguishbetween different rooms with a high level of accuracy. Thisis collaborated by [20], which, however, also concludes thatthe RSS may vary significantly over time. A SLAM systemutilizing opportunistic radio signals to navigate a small robotis described in [21], where the RSS map is modeled as apiece-wise linear function. A SLAM system, based on IMU,magnetometer, and FM RSS measurements and using a PDR, isdescribed and evaluated in [22]. The system developed in thispaper uses a similar approach, however, it integrates the multi-frequency RSS measurements with a foot-mounted INS whichhas the potential to provide higher accuracy and robustnessin first responder applications. Furthermore, the presented RSSSLAM method differs from [22] as it incorporates a GP directlyin the SLAM map to model the RSS field variation [23].
The system presented here adopts the occupancy grid baseddistributed particle SLAM (DP-SLAM) [24]. The occupancygrid allows for limiting the memory requirements of thealgorithm, and the grid size provides a suitable positioningresolution. Using the occupancy grid also provides for anefficient way to determine if there are measurements availablein a certain region of space.
This paper is organized the following way. After thisintroduction, the theory needed to perform RSS SLAM basedon a ZUPT-aided foot mounted-system is provided in Sec. II,followed by a description of the experimental setup used tovalidate the approach in Sec. III. Results from the experimentsare presented in Sec. IV, concluding remarks and a discussionsof possible future work are provided in Sec. V.
II. THEORY
In this section the basic underlying concepts and theorywhich are used throughout the paper are presented.
A. SLAM
A general SLAM system can be described by the followingequations
xk+1 = f(xk, uk, vk), (1a)mk+1 = mk, (1b)
yk = h(xk,mk) + ek, (1c)
where xk is the state, mk the map, uk known or measuredinput, vk process noise, yk a measurement, and ek measure-ment noise, all at time k. The model is divided into the motionmodel (1a), the map dynamics (1b), and the measurementmodel (1c).
A more in-depth explanation of the ZUPT-aided INS typemotion model and the RSS measurement model is providedin this section. The map model follows the occupancy gridconcept described below, where it is also described how newobservations are added to the map at every iteration.
B. Map Representation
Distributed particle SLAM [24] is a particle filter basedSLAM method which uses an ancestry tree together with anoccupancy grid as map instead of landmarks. This way theancestry of each particle and all its modifications to the gridcan be tracked. When a particle is removed by resampling allits entries in the grid are also removed. When a particle isduplicated as a result of the resampling there is no need tocopy the entire map over to the new particle. Instead, a newbranch is created in the ancestry tree and the resampled particleand its siblings share all entries made by their ancestors in theoccupancy grid made up to that point.
As the user moves in the environment and collects RSSmeasurements these are stored in an occupancy grid. Sincethe grid is combined with a particle filter this means thatat every iteration the particle cloud is spread out across anumber of cells. When a measurement update occurs, an RSSfingerprint from the user’s true location will be recorded. Everyparticle will then enter the recorded fingerprint along with theiridentity, the current time and location into the grid cell whichthey currently occupy.
C. Motion Model
The pedestrian motion model is based on a ZUPT-aidedINS [1] using a foot-mounted IMU. The state vector is givenby xk = (px, py, β, β)T and comprises: 2D position (px, py),a heading bias β, and a heading bias rate β. The motion modeltakes the input uk, which is calculated using the current andthe previous position estimates from the foot-mounted INS(using only position updates during consecutive zero-velocityinstances). The input consist of the travelled distance and theheading angle
uk =
( ∣∣pINSk+1 − pINSk
∣∣∠(pINSk+1 , p
INSk
)) =
(rkφk
), (2)
where ∠(·, ·) is the quadrant compensated arctangent function.The complete motion model is given by
xk+1 = xk +
rk cos(φk − β)rk sin(φk − β)
T β0
+
00T 2
2T
vk, (3)
where vk ∼ N (0, Q) and T is the time difference betweenupdates. The process noise compensates for errors in the INSestimate, its covariance, Q, should reflect typical INS errorbehavior and can as such be considered a tuning parameter.
The task of the particle filter is to constrain long term errordrift, and it is necessary to include the position in the statevector since it is required for the grid mapping. The erroraccumulation model is based on the model for foot-mounted
2014 International Conference on Indoor Positioning and Indoor Navigation, 27th–30th October 2014
IMUs suggested in [25]. Similar error accumulation behaviorhas been observed by others, see e.g., [26]. The model usedhere is based on the following assumptions:• All position errors are due to heading drift.• The heading error can be modeled with constant growth
rate.• The heading error is a function of time, not distance.1
D. Input From ZUPT-aided Foot-mounted INSWhen walking or running the human foot is stationary for
a short time when it is in contact with the ground. The ideabehind zero-velocity updates is to detect this moment whenthe velocity of the foot is approximately zero and use thisinformation to update the states in whatever positioning filter isbeing used. The moment the user’s foot comes to rest (duringthe stance phase) and zero-velocity is detected, the 3D velocityvector, as well as the pitch and roll angles, becomes observablewhich can then be used to constrain the position error in thesystem. For a foot-mounted INS to work well there are somegeneral guidelines:• the foot should be on the ground often (stand still phase);• a robust zero-velocity detection algorithm is needed; and• performance depends on the user’s movements, but to a
lesser degree than for PDR-type systems.In this work a foot-mounted IMU with three-axis accelerom-
eters and gyroscopes is utilized. An extended Kalman fil-ter (EKF) is used to estimate the user’s position. A zero-velocity detection algorithm is then introduced which takesthe gyroscope and accelerometer signals as inputs. There areseveral way of constructing zero-velocity detection algorithmsbut one which relies on both gyroscope and accelerometerdata usually performs better than those relying on just one ofthese sensors [8]. Whenever zero-velocity is detected this isintroduced as a pseudomeasurement in the EKF.
E. RSS FingerprintsThe RSS of electromagnetic signals in indoor environments
are subject to rapid spatial variations due to multipath-inducedfading. These spatial variations are caused by the electro-magnetic signals interacting with the environment, which canbe described in terms of well-known phenomena such asreflection, scattering, and diffraction [27]. This can howeverbe exploited in positioning algorithms by using a techniquecalled fingerprinting. An RSS fingerprint is a set of mean signalstrength values collected at different frequencies. Generally anumber of samples are recorded at each frequency and themean values of the recorded sequences are stored in a vector.In short, if the mean RSS value at a specific frequency is Λi
then the entire fingerprint vector is
Λ =(Λ1 Λ2 . . . Λn
)T, (4)
1The error characteristics depends on the implementation. For instance,some implementations of foot-mounted INS do not allow the error to growduring a ZUPT. This assumption might thus be ill suited for such imple-mentations, especially in scenarios where the user stands still for extendedperiods of time. A better model would then be to instead let the error growwith the travelled distance instead. Furthermore, the type of movement cansignificantly affect the error statistics.
where n is the total number of frequencies used in thefingerprint. A reason to use a set of n frequencies instead ofjust one is that RSS values from one frequency may be foundat other locations. If a larger set of frequencies is used, thenthe chance of finding a unique fingerprint is increased.
Adding more frequencies to the set can improve the unique-ness of the fingerprint. However, blindly adding more frequen-cies is not guaranteed to improve the fingerprint and some careshould be put into the selection process [20]. There are mainlytwo aspects to consider when choosing which frequenciesto include in a fingerprint. The first being the frequency(and wavelength) of the radio signal as it directly affectshow the signal interacts with objects in the environment. Itis therefore a good idea to include signals from differentfrequency bands in the signal, as they will interact differentlywith the environment. The second important aspect to considerare the locations of the transmitters. If possible, signals shouldbe included which are transmitted from different directions anddistances relative to the operating area.
F. Gaussian Process Measurement Model
Each frequency in the RSS fingerprint vector is assumedto be a function of its position in 2D space which can bemodelled with a GP. A GP is fully specified by its meanfunction M(x) and its covariance function K(x, x′). Theexpression
F ∼ GP(M,K), (5)
should then be interpreted as the function F is distributed as aGP with mean function M and covariance function K. Givena set of (possibly noisy) training samples from F and a priorin the form of a mean function and covariance function, GPscan be used to infer information about unobserved functionvalues. Let F be the known training samples and let F∗ bethe unobserved function values corresponding to the test inputsx∗. The joint distribution of F and F∗ is(
FF∗
)= N
((µµ∗
),
(Σ Σ∗
ΣT∗ Σ∗∗
)), (6)
where µi = M(xi), for i = 1, . . . , n, is the ith componentof µ and analogously for µ∗. The Σ matrices is shorthandnotation for the covariances between all combinations of testand training inputs. The predictive distribution of the unknownfunction values given the training samples becomes
F∗|F ∼ N(µ∗ + ΣT∗ Σ−1(F − µ),Σ∗∗ − ΣT∗ Σ−1Σ∗
). (7)
The corresponding posterior process given the training dataset D with both inputs and observed function values is
F|D ∼ GP(MD,KD), (8a)
MD(x) =M(x) +K(x, x′∗)TK(x, x′)−1(F − µ), (8b)
KD(x, x′) = K(x∗, x′∗)−K(x, x′∗)
TK(x, x′)−1K(x, x′∗),(8c)
where the functional dependence on x and x′ indicates thatthe posterior process can be computed for an arbitrary set oftest cases. These expressions can also be found in e.g., [10].
2014 International Conference on Indoor Positioning and Indoor Navigation, 27th–30th October 2014
1) Sparse Approximation Methods: A well-known problemwith Gaussian processes for on-line applications is the com-putational complexity. The main bottleneck is the inversionof the covariance matrix which has computational complexityO(n3), where n is the number of data points used to constructthe GP. One popular solution is to use a sparse approximationof the full GP and a number of available methods are comparedand analyzed in [28]. This paper picks up on the ideas used in[29] where an assumption is made about the structure of thekernel function instead of the conditional distribution or thelikelihood. Consider the radial basis kernel function (RBF)
K(x, x′) = σ2F exp
(− |x−x
′|22l2
). (9)
This kernel function has local support which means thatentries in the covariance matrix corresponding to measurementlocations which are far away from each other will be close tozero. What is meant by far away is determined by the lengthscale parameter l in (9), which determines how quickly thecorrelation between points drop off.
If the correlation would be exactly zero, and not just closeto zero after a certain distance, this would enable efficientimplementations of GPs since only measurements from posi-tions close to a predicted position would have to be includedwhen constructing the GP. This can be achieved by usingkernels with compact support. The RBF kernel in (9) can becompactified as
K(x, x′) = σ2F exp
(− |x−x
′|22l2
)max
(0,(1−
∣∣x−x′
d
∣∣)ν), (10)
where d defines the compact region over which the kernel hassupport and ν = 2bn2 c + 1 where n is the dimension of theinput to the GP. By compactifiying the RBF kernel in this wayit is guaranteed to remain positive definite [30]. By using (10)and only data which is inside the compact region the resultswill be almost as accurate as when also including data outsideof the compact region.
2) Hyper-parameter Selection: Given a set of measurementvalues y, their corresponding positions x and a kernel functionK(x, x′), it is possible to make inference about the kernel’shyper-parameters. The marginal log-likelihood of the measure-ment values given their positions and the hyper-parameters is
L = log p(y|x, θ) = − 12 log |Ky| − 1
2yTK−1y y − n
2 log(2π),(11)
where K−1y is the covariance matrix produced using the kerneland the n data points and the mean function is assumedzero, M(x) ≡ 0, for simplicity. It is worth to note that thisexpression balances model fit and complexity automatically.The first term is the complexity penalty term. The second termis the data-fit measure and it is the only term which dependson the measurement data y. The third term is a normalizationconstant which can be left out from the optimization as it doesnot depend on the data nor the hyper-parameters. It is nowpossible to find the hyper-parameter values that maximizes(11) using optimization routines.
3) Measurement Model: The measurement at time instantk is an RSS fingerprint vector, yk =
(y1k . . . ynk
)T. Each
component, yik = Λik + eik, contain an RSS value for afrequency as described in Sec. II-E and eik ∼ N (0, σ2
e) is themeasurement noise for component i. Using the current SLAMestimate, the predicted measurement is distributed accordingto
h(xk|k−1, mik|k−1) ∼ N (yik,Σk) (12)
which is given by GP(Mik,Kik), where xk|k−1 and mi
k|k−1are the predicted state and map for component i, respectively.
The compactified radial basis kernel function presented inSec. II-F1 with added measurement noise is used to constructthe GP covariance matrix
K(x, x′) = σ2F exp
(− |x−x
′|22l2
)·max
(0,(1−
∣∣x−x′
d
∣∣)ν)+ σ2eδxx′ , (13)
where δxx′ is the Dirac-delta function that is 1 if x = x′ andotherwise 0.
The GP is created from training data which here correspondsto previously recorded RSS values and their locations whichare stored in the map database. The number of recorded valuesgrows quickly during operation and it would be computa-tionally intractable to use all of them in the GP. Insteadthe approximation in Sec. II-F1 is used and only the RSSfingerprints which are close to the RSS prediction are collected.The parameter d corresponds to the size of the kernel’ssupport.
The mean function in the Gaussian process is chosen asthe mean value of RSS values recorded in a region around thepredicted location at each frequency. The hyper-parameters arepre-selected manually, to save computation time and to ensurefeasible values. Given the GP it is straightforward to computeyik and Σk using (8b) and (8c), respectively. The likelihoodof the recorded measurement yk given the predicted state andmap is
p(yk|xk|k−1, mk|k−1)
=exp(− 1
2 (yk − yk)(Σk +Rk)−1(yk − yk)T )
(2π)n/2√
det(Σk +Rk)(14)
where n is the number of RSS measurements used in thefingerprint, and Rk is the covariance of the measurement noise.
III. EXPERIMENTAL SETUP
In this section, implementation details of the proposed RSSSLAM prototype are discussed and the experiments used toevaluate it are described.
A. Implementation Details
The proposed RSS SLAM algorithm has been implementedand used together with the hardware shown in Fig. 1. In theprototype implementation the ZUPT-aided foot-mounted INSin [7] is used, together with the FUNCube Dongle Pro+ radio
2014 International Conference on Indoor Positioning and Indoor Navigation, 27th–30th October 2014
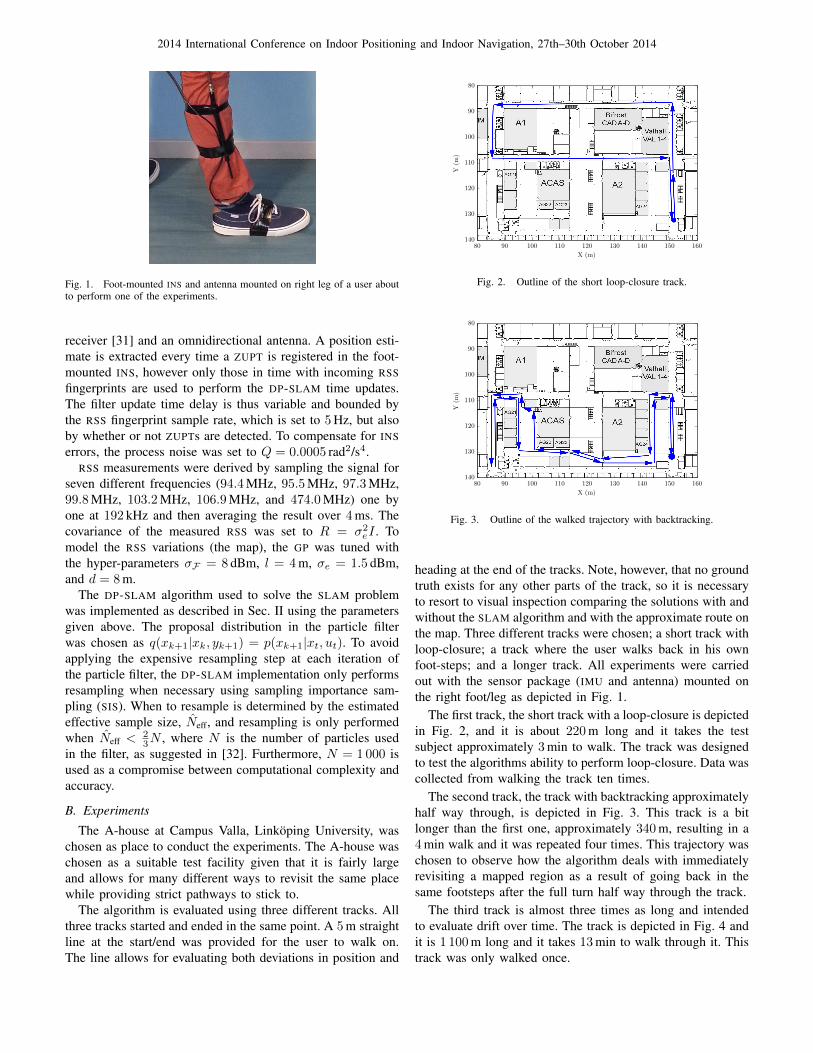
Fig. 1. Foot-mounted INS and antenna mounted on right leg of a user aboutto perform one of the experiments.
receiver [31] and an omnidirectional antenna. A position esti-mate is extracted every time a ZUPT is registered in the foot-mounted INS, however only those in time with incoming RSSfingerprints are used to perform the DP-SLAM time updates.The filter update time delay is thus variable and bounded bythe RSS fingerprint sample rate, which is set to 5 Hz, but alsoby whether or not ZUPTs are detected. To compensate for INSerrors, the process noise was set to Q = 0.0005 rad2/s4.
RSS measurements were derived by sampling the signal forseven different frequencies (94.4 MHz, 95.5 MHz, 97.3 MHz,99.8 MHz, 103.2 MHz, 106.9 MHz, and 474.0 MHz) one byone at 192 kHz and then averaging the result over 4 ms. Thecovariance of the measured RSS was set to R = σ2
eI . Tomodel the RSS variations (the map), the GP was tuned withthe hyper-parameters σF = 8 dBm, l = 4 m, σe = 1.5 dBm,and d = 8 m.
The DP-SLAM algorithm used to solve the SLAM problemwas implemented as described in Sec. II using the parametersgiven above. The proposal distribution in the particle filterwas chosen as q(xk+1|xk, yk+1) = p(xk+1|xt, ut). To avoidapplying the expensive resampling step at each iteration ofthe particle filter, the DP-SLAM implementation only performsresampling when necessary using sampling importance sam-pling (SIS). When to resample is determined by the estimatedeffective sample size, Neff, and resampling is only performedwhen Neff <
23N , where N is the number of particles used
in the filter, as suggested in [32]. Furthermore, N = 1 000 isused as a compromise between computational complexity andaccuracy.
B. Experiments
The A-house at Campus Valla, Linkoping University, waschosen as place to conduct the experiments. The A-house waschosen as a suitable test facility given that it is fairly largeand allows for many different ways to revisit the same placewhile providing strict pathways to stick to.
The algorithm is evaluated using three different tracks. Allthree tracks started and ended in the same point. A 5 m straightline at the start/end was provided for the user to walk on.The line allows for evaluating both deviations in position and
Y(m
)
X (m)
80 90 100 110 120 130 140 150 160
80
90
100
110
120
130
140
Fig. 2. Outline of the short loop-closure track.
Y(m
)
X (m)
80 90 100 110 120 130 140 150 160
80
90
100
110
120
130
140
Fig. 3. Outline of the walked trajectory with backtracking.
heading at the end of the tracks. Note, however, that no groundtruth exists for any other parts of the track, so it is necessaryto resort to visual inspection comparing the solutions with andwithout the SLAM algorithm and with the approximate route onthe map. Three different tracks were chosen; a short track withloop-closure; a track where the user walks back in his ownfoot-steps; and a longer track. All experiments were carriedout with the sensor package (IMU and antenna) mounted onthe right foot/leg as depicted in Fig. 1.
The first track, the short track with a loop-closure is depictedin Fig. 2, and it is about 220 m long and it takes the testsubject approximately 3 min to walk. The track was designedto test the algorithms ability to perform loop-closure. Data wascollected from walking the track ten times.
The second track, the track with backtracking approximatelyhalf way through, is depicted in Fig. 3. This track is a bitlonger than the first one, approximately 340 m, resulting in a4 min walk and it was repeated four times. This trajectory waschosen to observe how the algorithm deals with immediatelyrevisiting a mapped region as a result of going back in thesame footsteps after the full turn half way through the track.
The third track is almost three times as long and intendedto evaluate drift over time. The track is depicted in Fig. 4 andit is 1 100 m long and it takes 13 min to walk through it. Thistrack was only walked once.
2014 International Conference on Indoor Positioning and Indoor Navigation, 27th–30th October 2014
Y(m
)
X (m)
20 40 60 80 100 120 140 160 180 200 220
60
70
80
90
100
110
120
130
140
150
Fig. 4. Outline of the walk backtrack.
IV. RESULTS
In this section the results of the experiments described inSec. III-B are presented and evaluated. Furthermore, quantita-tive results are presented to illustrate the effect of changing theGP hyper-parameters, as well as what happens if the numberof particles are changed.
Overall, the behavior of the underlying foot-mounted INScan in these experiments be categorized as:• very slowly drifting, low position and heading errors at
the end of the track and a plausible trajectory throughoutthe experiments;
• slowly drifting, moderate position and heading errors atthe end of the track and a roughly correct trajectory; and
• heavily drifting, considerable position and heading errorsat the end of the track and an obviously skewed trajec-tory2.
A. Short track with loop-closure
The results from the first trajectory (a short track with loopclosure) are used to illustrate the different INS behaviors (seeFig. 5–6).
First consider the case when the foot-mounted INS systemperforms well, as illustrated in Fig. 5. In this case the RSSSLAM solution follows that of the foot-mounted INS closely,as expected, and only small adjustments are made to improvethe estimates on loop-closure.
The typical foot-mounted INS system behavior, a slow drift,is illustrated in Fig. 6. In this case the INS estimate and the RSSSLAM estimate slowly drift apart, and the particle cloud growswith time. Once loop-closure is detected, the SLAM estimateis rectified to reflect the fact that a position is revisited. At thesame time the particle cloud shrinks to reflect the fact that theposition is better known after loop-closure.
Finally, Fig. 7 illustrates the behavior of the system in thecase of heavy drift in the foot-mounted INS. The RSS SLAMestimate initially follows the INS estimate, and as it drifts off
2Analysis of the raw INS data from these cases indicate that the large errorsare due to the gyro bias drifting during the walk, which is in turn likely dueto warm-up effects in the IMU [23]. The INS implementation used here onlyestimates gyroscope bias at start-up.
Y(m
)
X (m)
80 90 100 110 120 130 140 150 160
80
90
100
110
120
130
140
Fig. 5. Estimated trajectories using only foot-mounted INS (green) and withRSS SLAM (blue). In this case the INS system is well behaved.
TABLE ISHORT LOOP-CLOSURE TRACK PERFORMANCE RESULTS AT THE END OF
THE TRAJECTORY. EACH ROW IS DERIVED FROM 10 EXPERIMENTS.
(a) Position errors given in meters.
RSS SLAM Mean Median Std. dev Max MinNo 8.9 7.3 6.4 22.1 1.9Yes 2.6 1.9 2.7 9.2 0.5
(b) Heading errors given in degrees.
RSS SLAM Mean Median Std. dev Max MinNo 14.2 9.4 9.9 31.9 4.8Yes 2.0 1.4 2.1 7.2 0.1
the RSS SLAM particle cloud struggles to support the trueposition. This is visible already in the top figure in Fig. 7.This indicates an underestimated process noise and the casein the illustration is an outlier in term of INS behavior. Thesituation grows worse as time progress; however, when theloop-closure occurs a few particles are available to support it.Consequently, the RSS SLAM trajectory is improved comparedto the foot-mounted INS estimate.
All the experiments performed with the short track withloop-closure are summarized in Table I. Both the median andmean errors indicate significant improvements when using DP-SLAM. The standard deviation and maximum of the errors arealso significantly lowered for both heading and final positionestimates, which indicate an increase in robustness.
B. Track with Back-Tracking
A typical result from the track with backtracking is pre-sented in Fig. 8. Initially the foot-mounted INS and theSLAM algorithm yield similar results, but as the user turnsand start to make his way back the SLAM algorithm startsto recognize the previously visited radio environment. Thisresults in loop-closure, which reduces the uncertainty (thespread of the particle cloud). The resulting SLAM estimateseems to converge to a trajectory estimate which visuallyseems accurate when compared to the trajectory outline inFig. 3.
2014 International Conference on Indoor Positioning and Indoor Navigation, 27th–30th October 2014
Y(m
)
X (m)
80 90 100 110 120 130 140 150 160
80
90
100
110
120
130
140
Y(m
)
X (m)
80 90 100 110 120 130 140 150 160
80
90
100
110
120
130
140
Y(m
)
X (m)
80 90 100 110 120 130 140 150 160
80
90
100
110
120
130
140
Y(m
)
X (m)
80 90 100 110 120 130 140 150 160
80
90
100
110
120
130
140
Fig. 6. Trajectories estimates using only foot-mounted INS (green) and withRSS SLAM (blue). Typical behavior, the INS drifts slowly.
Y(m
)
X (m)
80 90 100 110 120 130 140 150 160
80
90
100
110
120
130
140
Y(m
)
X (m)
80 90 100 110 120 130 140 150 160
80
90
100
110
120
130
140
Y(m
)
X (m)
80 90 100 110 120 130 140 150 160
80
90
100
110
120
130
140
Y(m
)
X (m)
80 90 100 110 120 130 140 150 160
80
90
100
110
120
130
140
Fig. 7. Trajectories estimates using only foot-mounted INS (green) and withRSS SLAM (blue), when the INS drifts heavily.
2014 International Conference on Indoor Positioning and Indoor Navigation, 27th–30th October 2014
Y(m
)
X (m)
80 90 100 110 120 130 140 150 160
80
90
100
110
120
130
140
Y(m
)
X (m)
80 90 100 110 120 130 140 150 160
80
90
100
110
120
130
140
Y(m
)
X (m)
80 90 100 110 120 130 140 150 160
80
90
100
110
120
130
140
Y(m
)
X (m)
80 90 100 110 120 130 140 150 160
80
90
100
110
120
130
140
Fig. 8. Representative estimated trajectories using only foot-mounted INS(green) and with RSS SLAM (blue) performing the track with backtracking.
Y(m
)
X (m)
80 90 100 110 120 130 140 150 160
80
90
100
110
120
130
140
Fig. 9. Estimated trajectories using only foot-mounted INS (green) and withRSS SLAM (blue) performing the track with backtracking, for a case withworse than typical performance.
TABLE IIWALK BACK TRACK PERFORMANCE RESULTS. EACH ROW BASED ON 4
EXPERIMENTS.
(a) Position errors given in meters.
RSS SLAM Mean Median Std. dev Max MinNo 32.2 32.8 10.4 43.5 19.8Yes 2.0 2.0 0.2 2.2 1.9
(b) Heading errors given in degrees.
RSS SLAM Mean Median Std. dev Max MinNo 54.7 53.5 19.0 76.5 35.4Yes 2.9 3.1 1.9 5.0 0.5
Fig. 9 represents a less successful experiment, but the finalDP-SLAM estimate is still a significant improvement comparedto the foot-mounted INS. In this case the INS result drifts a littlemore when compared to the case in Fig. 8, this minor increasein INS drift probably causes the slightly worse trajectoryestimate.
Overall, using the suggested SLAM significantly improvesthe trajectories obtained from the pure foot-mounted INS.However, it seams that this type of scenario is a more difficultchallenge than the short loop-closure scenario when it comesto estimating the entire trajectory correctly. The results fromthe experiments are summarized in Table II. The improvementin heading and position errors are excellent, which is expectedin this scenario since the person moves a long time inpreviously mapped areas.
C. Long Track
The trajectories estimated based on the long trajectory datais depicted in Fig. 10. The results are not as good as for thetwo shorter scenarios; however, the results are still promising.The foot-mounted INS drifts considerably over time, and theSLAM algorithm fails to completely compensate for this, butthe improvement is still significant for parts of the test.The trajectory obtained from the SLAM system can still beidentified as the true trajectory even if is not perfectly alignedwith the floor plan.
2014 International Conference on Indoor Positioning and Indoor Navigation, 27th–30th October 2014
Y(m
)
X (m)
20 40 60 80 100 120 140 160 180 200 220
60
70
80
90
100
110
120
130
140
150
Fig. 10. Estimated trajectories using only foot-mounted INS (green) and withRSS SLAM (blue) for the long track and l = 4.
Y(m
)
X (m)
20 40 60 80 100 120 140 160 180 200 220
60
70
80
90
100
110
120
130
140
150
Fig. 11. Estimated trajectories using only foot-mounted INS (green) and withRSS SLAM (blue) for the long track and l = 3.
D. Gaussian Process Hyper-Parameters
The GP hyper-parameters used when modelling the mapin the RSS SLAM algorithm is one source of uncertainty.Therefore, the experimental data has been evaluated usingdifferent parameter sets to quantify the difference. Tweakingthe hyper-parameters results in no significant difference inthe results obtained with the two shorter scenarios. For thelast, longer, scenario a slight performance improvement can beobserved by reducing the length-scale parameter from l = 4 mto l = 3 m. This improvement is illustrated in Fig. 11.
E. Number of Particles
The number of particles used in a particle filter is animportant factor for its performance. Therefore, two data setsfrom the short track with loop-closure (one with low INS driftand one with large drift), and one data set from the trackwith backtracking, were selected to evaluate the importanceof the number of particles used in the proposed RSS SLAMalgorithm. The algorithm was applied 100 times for eachnumber of particles to avoid random effects in the particlefilter. The result of the investigation is shown in Fig. 12.The results indicate that in all of the tested scenarios theparticle count could be lowered without taking a big toll onheading estimation performance. These results also indicate
AngleError
(degrees)
Particle count
0 100 200 300 400 500 600 700 800 900 10000
10
20
30
40
50
60
Fig. 12. Particle count effect on heading error estimation for typical short-loop closure scenario (blue), quickly diverging short-loop closure scenario(red) and walk-back scenario (green).
that performance in some scenarios are more sensitive to theparticle count. Judging from these results 200 particles seemsto be sufficient in favorable scenarios, while up to 600 particlesmay be required in other scenarios.
V. CONCLUSIONS AND FUTURE WORK
A new online capable algorithm for performing opportunis-tic radio received signal strength simultaneous localization andmapping (RSS SLAM) in indoor environments have been devel-oped. It incorporates Gaussian processes to iteratively modelthe surrounding radio environment as it is being explored. Thealgorithm has been evaluated together with a foot-mounted INSand the experimental results indicate that it can successfullyconstrain the error drift of such systems where the error usuallygrows with time, as long as previously visited environmentsare re-visited during the operation. The algorithm does notrely on any pre-installed infrastructure or survey data and theradio transmitter locations does not need to be known.
There are aspects that need to be investigated further such asthe GP hyper-parameter values. So far these have been selectedmanually, but ideally they should be learned during operation.A possible solution could be to, at regular intervals, pick themost likely particle and solve the optimisation problem withits corresponding data set and then apply the same hyper-parameters to all particles.
The results indicate that it is possible to reduces the headingerror from a foot-mounted INS by up to 80 %, and the finalposition error by up to 70 %, in simple scenarios using thisapproach. In favourable scenarios, with a lot of back-tracking,the heading and final position errors can be reduced by asmuch as 93 %–95 % when compared to those of a lone foot-mounted INS.
Another aspect that needs to be investigated further is theparticle count. The preliminary results indicate that the filtershould be able to perform reasonably well with a much smallerparticle count.
In addition, there are more areas which should be exploredbefore this algorithm can be a permanent part of a robust firstresponder indoor positioning system such as:
2014 International Conference on Indoor Positioning and Indoor Navigation, 27th–30th October 2014
• Add compatibility with other movement types than walk-ing, such as running and crawling, and investigate in whatways the error model needs to be changed [23].
• Enable 3D tracking. This would enable the filter to makecorrections in height and it might be a good idea to alsoadd pitch error as a state in the filter since the heightestimate from the foot-mounted INS drifts slowly.
• Implement with a dual foot-mounted INS. This couldrequire a new error model as the heading error mightno longer be as dominant as it is in the walking case.
• Add a magnetometer to the system. The magnetic fieldcould be included in the fingerprint vector similar to theway another radio frequency can be added.
ACKNOWLEDGMENT
The authors would like to thank Joakim Rydell, ErikaBilock and Patrik Eliardsson at the Swedish Defence ResearchAgency for fruitful discussions and input during the course ofthis work.
REFERENCES
[1] J. Rantakokko, J. Rydell, P. Stromback, P. Handel, J. Callmer, D. Torn-qvist, F. Gustafsson, M. Jobs, and M. Gruden, “Accurate and reliablesoldier and first responder indoor positioning: multisensor systems andcooperative localization,” IEEE Transactions on Wireless Communica-tions, vol. 18, no. 2, pp. 10–18, Apr. 2011.
[2] P. D. Groves, G. W. Pulford, C. A. Littlefield, D. L. J. Nash, andC. J. Mather, “Inertial navigation versus pedestrian dead reckoning:Optimizing the integration,” in 20th International Technical Meeting ofthe Satellite Division of The Institute of Navigation (ION GNSS), 2007,pp. 2034–2055.
[3] A. Jimenez, F. Seco, C. Prieto, and J. Guevara, “A comparison ofpedestrian dead-reckoning algorithms using a low-cost MEMS IMU,” inIEEE International Symposium on Intelligent Signal Processing (WISP),2009, pp. 37–42.
[4] E. Foxlin, “Pedestrian tracking with shoe-mounted inertial sensors,”IEEE Computer Graphics and Applications, vol. 25, no. 6, pp. 38–46,2005.
[5] J.-O. Nilsson, I. Skog, P. Handel, and K. V. S. Hari, “Foot-mounted INSfor everybody-an open-source embedded implementation,” in IEEE/IONPosition Location and Navigation Symposium (PLANS), 2012, pp. 140–145.
[6] S. Godha, G. Lachapelle, and M. E. Cannon, “Integrated GPS/INSsystem for pedestrian navigation in a signal degraded environment,” inProceedings of the 19th International Technical Meeting of the SatelliteDivision of The Institute of Navigation (ION GNSS), Sep. 2006, pp.2151–2164.
[7] J. Rantakokko, E. Emilsson, P. Stromback, and J. Rydell, “Scenario-based evaluations of high-accuracy personal positioning systems,” inIEEE/ION Position Location and Navigation Symposium (PLANS), 2012,pp. 106–112.
[8] I. Skog, P. Handel, J.-O. Nilsson, and J. Rantakokko, “Zero-velocitydetection—an algorithm evaluation,” IEEE Transactions on BiomedicalEngineering, vol. 57, no. 11, pp. 2657–2666, 2010.
[9] J. Fink and V. Kumar, “Online methods for radio signal mapping withmobile robots,” in 2011 IEEE International Conference on Robotics andAutomation (ICRA), Shanghai, May 2011.
[10] C. E. Rasmussen and C. K. I. Williams, Gaussian processes for MachineLearning. MIT Press, 2006.
[11] P. Bahl and V. N. Padmanabhan, “RADAR: An in-building RF-baseduser location and tracking system,” in Proceedings of 19th AnnualJoint Conference of the IEEE Computer and Communications Societies(INFOCOM), Tel Aviv, Israel, Mar. 2000.
[12] T.-N. Lin and P.-C. Lin, “Performance comparison of indoor positioningtechniques based on location fingerprinting in wireless networks,” inInternational Conference on Wireless Networks, Communications andMobile Computing, vol. 2, Jun. 2005, pp. 1569–1574 vol.2.
[14] J. Huang, D. Millman, M. Quigley, D. Stavens, S. Thrun, and A. Ag-grwal, “Effient, generalized indoor WiFi GraphSLAM,” in 2011 IEEEInternational Conference on Robotics and Automation (ICRA), Shang-hai, May 2011.
[15] S. Thrun, W. Burgaard, and D. Fox, Probabilistic Robotics (IntelligentRobotics and Autonomous Agents series). MIT Press, 2005.
[16] B. Ferris, D. Fox, and N. Lawrence, “WiFi-SLAM using Gaussianprocess latent variable models,” in Proceedings of the 20th InternationalJoint Conference on Artifical Intelligence (IJCAI), Hyderabad, India, Jan.2007.
[17] P. Addesso, L. Bruno, and R. Restaino, “Integrated rss from unknownaccess points in wlan positioning,” in 2011 7th International WirelessCommunications and Mobile Computing Conference (IWCMC), Istabul,Turkey, Jul. 2011, pp. 607–612.
[18] L. Bruno and P. Robertson, “WiSLAM: improving FootSLAM withWiFi,” in 2011 International Conference on Indoor Positioning andIndoor Navigation (IPIN), Guimaraes, Portuagal, 2011.
[19] Y. Chen, D. Lymberopoulos, J. Liu, and B. Priyantha, “FM-based indoorlocalization,” in Proceedings of the 10th international conference onMobile systems, applications, and services. ACM, 2012, pp. 169–182.
[20] P. Eliardsson, U. Uppman, and J. Rantakokko, “Received signal strengthmeasurements utilizing signals of opportunity — a feasibility studyon the use of RSS for loop-closure in multisensor indoor positioningsystems,” FOI, Tech. Rep. FOI-R–3841–SE, Feb. 2014.
[21] J.-S. Gutmann, E. Eade, P. Fong, and M. E. Munich, “Vector fieldSLAM—localization by learning the spatial variations of continuoussignals,” IEEE Transactions on Reliability, Jun. 2012.
[22] R. Faragher, C. Sarno, and M. Newman, “Opportunistic radio SLAMfor indoor navigation using smartphone sensors,” in 2012 IEEE/IONPosition Location and Navigation Symposium (PLANS), Apr. 2012, pp.120–128.
[23] M. Nilsson, “Indoor positioning using opportunistic multi-frequencyRSS with foot-mounted INS,” Master’s thesis, Linkoping University,2014.
[24] A. Eliazar and R. Parr, “DP-SLAM: Fast, robust simultaneous localiza-tion and mapping without predetermined landmarks,” in InternationalJoint Conference on Artificial Intelligence, vol. 3, 2003, pp. 1135–1142.
[25] S. Wan and E. Foxlin, “Improved pedestrian navigation based on drift-reduced MEMS IMU chip,” in Proceedings of the 2010 InternationalTechnical Meeting of The Institute of Navigation, 2001, pp. 220–229.
[26] J. Rantakokko, P. Stromback, E. Emilsson, and J. Rydell, “Soldier posi-tioning in GNSS-denied operations,” in Proc. of Sensors and ElectronicsTechnology Panel Symposium (SET-168) on Navigation Sensors andSystems in GNSS Denied Environments, 2012, pp. 1–12.
[27] L. Ahlin and J. Zander, Principles of Wireless Communications, 2nd ed.Studentlitteratur AB, 1998.
[28] J. Quinonero-Candela, C. E. Rasmussen, and C. K. Williams, “Approx-imation methods for Gaussian process regression,” Large-scale kernelmachines, pp. 203–223, 2007.
[29] A. Ranganathan, M.-H. Yang, and J. Ho, “Online sparse gaussianprocess regression and its applications,” IEEE Transactions on ImageProcessing, vol. 20, no. 2, pp. 391–404, 2011.
[30] B. Hamers, J. A. Suykens, and B. De Moor, “Compactly supported RBFkernels for sparsifying the gram matrix in LS-SVM regression models,”in Artificial Neural Networks—ICANN 2002. Springer, 2002, pp. 720–726.