264
Inductively coupled plasma mass spectrometry: a unique, ultrasensitive tool for exploring the pharmacology of metal-based anticancer agents
Inductively coupled plasma mass spectrometry:
a unique, ultrasensitive tool for exploring the
pharmacology of metal-based anticancer agents
ISBN/EAN: 978-90-393-4683-9
© 2007 Elke Brouwers, Amsterdam
Cover design: Beeldhouwer Jos Reniers, www.josreniers.nl
Printed by: Ponsen & Looijen BV, Wageningen, The Netherlands
Inductively coupled plasma mass spectrometry:
a unique, ultrasensitive tool for exploring the
pharmacology of metal-based anticancer agents
Inductief gekoppelde plasma-massa-spectrometrie:
een uniek, zeer gevoelig hulpmiddel voor het onderzoeken van de
farmacologie van metaal bevattende antikanker middelen
(met een samenvatting in het Nederlands)
PROEFSCHRIFT
ter verkrijging van de graad van doctor
aan de Universiteit Utrecht
op gezag van de rector magnificus, prof. dr J.C. Stoof,
ingevolge het besluit van het college voor promoties
in het openbaar te verdedigen
op vrijdag 16 november 2007 des middags te 12.45 uur
door
Elke Elvira Margaretha Brouwers
geboren op 8 november 1977 te Helmond

Promotoren:
Prof. Dr J.H. Beijnen
Prof. Dr J.H.M. Schellens
The research described in this thesis was performed at the Department of
Pharmacy & Pharmacology, Slotervaart Hospital/The Netherlands Cancer
Institute, Amsterdam, The Netherlands
This research was supported financially by The Netherlands Organisation for
Health Research and Development, ZonMw (OND1307436)
Publication of this thesis was financially supported by:
Varian, inc., Mulgrave, Victoria, Australia;
The Netherlands Laboratory for Anticancer Drug Formulation, Amsterdam, The
Netherlands.


Het mooiste van een droom,
is de mogelijkheid om hem te verwezenlijken
Voor Remco
Contents
Chapter 1 Introduction 1.1 Aim and outline 13 1.2 The application of inductively coupled plasma mass
spectrometry in clinical pharmacological oncology research 17
Chapter 2 Determination of platinum and ruthenium in biological fluids
2.1 Determination of oxaliplatin in human plasma and plasma
ultrafiltrate by graphite-furnace atomic-absorption- spectrometry 73
2.2 Sensitive inductively coupled plasma mass spectrometry
assay for the determination of platinum originating from cisplatin, carboplatin, and oxaliplatin in human plasma ultrafiltrate 89
2.3 Determination of ruthenium originating from the
investigational anti-cancer drug NAMI-A in human plasma ultrafiltrate, plasma, and urine by inductively coupled plasma mass spectrometry 109
Chapter 3 Determination of platinum-DNA adducts 3.1 Inductively coupled plasma mass spectrometric analysis of
the total amount of Pt-DNA adducts in peripheral blood mononuclear cells and tissue from patients treated with
cisplatin 133
3.2 The effects of sulfur-containing compounds and gemcitabine on the binding of cisplatin to plasma proteins and DNA determined by ICP-MS and HPLC-ICP-MS 151
Chapter 4 Persistent effects of platinum agents 4.1 Long-term platinum retention after treatment
with cisplatin and oxaliplatin 175
4.2 Persistent neuropathy after treatment with cisplatin and oxaliplatin 193
Chapter 5 Environmental monitoring of platinum agents 5.1 Monitoring of platinum surface contamination in seven
Dutch hospital pharmacies using inductively coupled plasma mass spectrometry 215
Conclusions and perspectives 238 Summary 244 Samenvatting 248 Dankwoord 254 Curriculum Vitae 259 List of Publications 260

Chapter 1
Introduction

Chapter 1.1
Aim and outline
Chapter 1.1
14
Aim
Research to unravel the pharmacokinetics of metal-based anticancer agents is required
to understand the clinical behaviour of the drugs and to further optimise treatment
regimens. Accurate and sensitive methods for the quantitative determination of metal-
based anticancer agents are indispensable to investigate these aspects. Until recently,
many studies relied on atomic absorption spectrometry (AAS) for the analysis of
platinum (Pt) and ruthenium (Ru). The sensitivity of this technique, however, only allows
the investigation of pharmacokinetics during or shortly after therapy. The sensitivity is
insufficient to answer research questions, which are of current interest. Inductively
coupled plasma mass spectrometry (ICP-MS) does provide this high sensitivity.
For this thesis project, the major aim was to develop and validate analytical ICP-MS
methods for the analysis of metal-based anticancer agents. These methods were applied
to answer research questions concerning long-term pharmacokinetics, Pt-induced side
effects, the effects of antidotes on Pt-induced side effects, and environmental
monitoring.
Outline
Chapter 1.2 provides background information on the mechanism of metal-based
anticancer agents. Furthermore, it provides an extensive overview of publications
describing the analysis of Pt and Ru using ICP-MS in the field of oncology. The focus is on
the determination of the total metal concentration and on the speciation of Pt and Ru
compounds in human biological fluids, DNA- and protein-adducts, and environmental
samples. Chapter 2 describes the development and validation of assays for the analysis
of Pt in plasma and plasma ultrafiltrate (pUF) using atomic absorption spectrometry
(Chapter 2.1), of Pt in pUF using ICP-MS (Chapter 2.2), and of Ru in plasma, pUF, and urine
using ICP-MS (Chapter 2.3). Chapter 3 describes the use of ICP-MS for the determination
of Pt adducts. In Chapter 3.1, the development, optimisation, and validation of an ICP-MS
method for the determination of Pt bound to DNA in peripheral blood mononuclear
cells (PBMCS) and tissue was described. The method was applied to study Pt-DNA
adduct levels in PBMCs and tissue from patients treated with cisplatin. In Chapter 3.2, the
effect of sulfur-containing compounds and gemcitabine on Pt-protein and Pt-DNA
adduct levels was quantified. Chapter 4 describes the long-term effects of cisplatin and
oxaliplatin treatment. Chapter 4.1 illustrates the long-term pharmacokinetics of Pt. Pt
levels in plasma of 45 patients treated with cisplatin or oxaliplatin were monitored 8-75
months after the end of their treatment. To evaluate whether the remaining Pt was still
reactive, the Pt-DNA and Pt-protein binding characteristics of the Pt from the patients’
samples were quantified. In addition, the relationships between several determinants
Aim and outline
15
and Pt levels were evaluated. The same group of patients as described in Chapter 4.1 was
used to evaluate persistent Pt induced neuropathy (Chapter 4.2). Again, relationships
between several determinants and neuropathy were investigated, among which were
the plasma Pt levels.
Chapter 5 describes the development of a method to monitor Pt surface contamination
within hospital pharmacies. The method was applied to assess surface contamination in
seven Dutch hospital pharmacies.
In Chapter 6, the presented results are evaluated and placed in a broader perspective
and future research is discussed.

Chapter 1.2
The application of inductively coupled plasma mass spectrometry in clinical
pharmacological oncology research
Elke E.M. Brouwers Matthijs M. Tibben
Hilde Rosing Jan H.M. Schellens
Jos H. Beijnen
Submitted for publication
Chapter 1.2
18
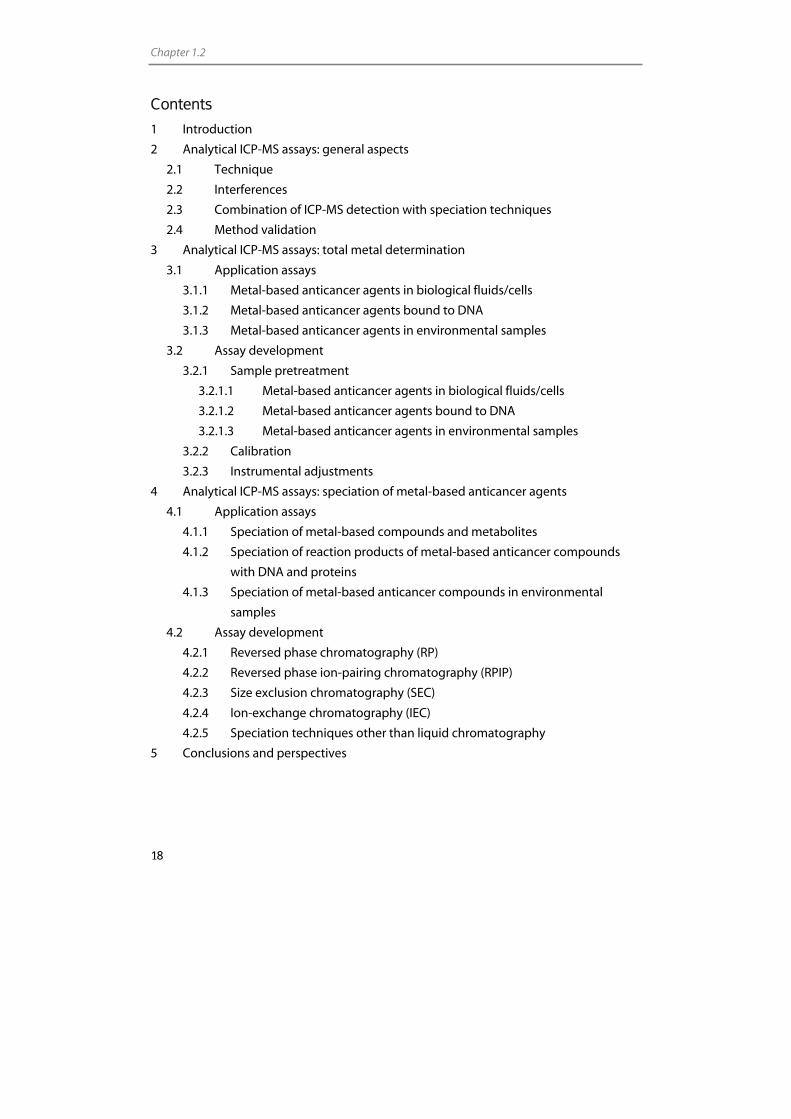
Contents
1 Introduction 2 Analytical ICP-MS assays: general aspects
2.1 Technique 2.2 Interferences 2.3 Combination of ICP-MS detection with speciation techniques 2.4 Method validation
3 Analytical ICP-MS assays: total metal determination 3.1 Application assays
3.1.1 Metal-based anticancer agents in biological fluids/cells 3.1.2 Metal-based anticancer agents bound to DNA 3.1.3 Metal-based anticancer agents in environmental samples
3.2 Assay development 3.2.1 Sample pretreatment
3.2.1.1 Metal-based anticancer agents in biological fluids/cells 3.2.1.2 Metal-based anticancer agents bound to DNA 3.2.1.3 Metal-based anticancer agents in environmental samples
3.2.2 Calibration 3.2.3 Instrumental adjustments
4 Analytical ICP-MS assays: speciation of metal-based anticancer agents 4.1 Application assays
4.1.1 Speciation of metal-based compounds and metabolites 4.1.2 Speciation of reaction products of metal-based anticancer compounds
with DNA and proteins 4.1.3 Speciation of metal-based anticancer compounds in environmental
samples 4.2 Assay development
4.2.1 Reversed phase chromatography (RP) 4.2.2 Reversed phase ion-pairing chromatography (RPIP) 4.2.3 Size exclusion chromatography (SEC) 4.2.4 Ion-exchange chromatography (IEC) 4.2.5 Speciation techniques other than liquid chromatography
5 Conclusions and perspectives
ICP-MS in oncology
19
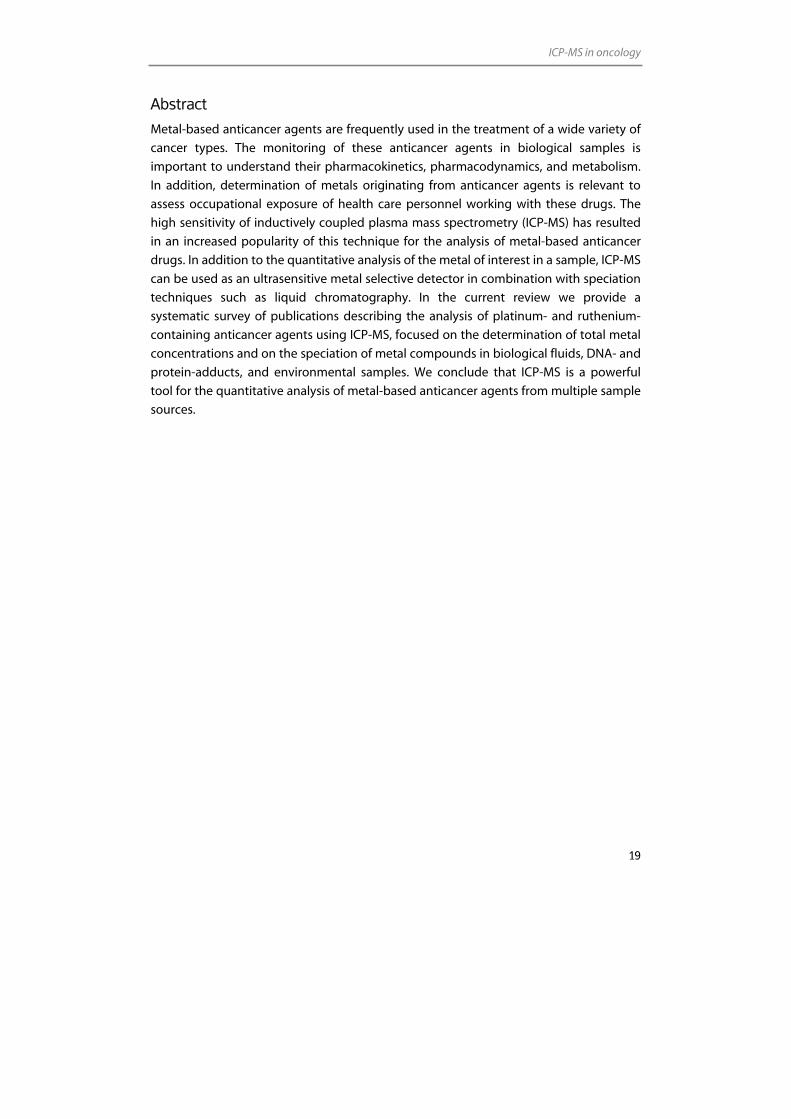
Abstract
Metal-based anticancer agents are frequently used in the treatment of a wide variety of
cancer types. The monitoring of these anticancer agents in biological samples is
important to understand their pharmacokinetics, pharmacodynamics, and metabolism.
In addition, determination of metals originating from anticancer agents is relevant to
assess occupational exposure of health care personnel working with these drugs. The
high sensitivity of inductively coupled plasma mass spectrometry (ICP-MS) has resulted
in an increased popularity of this technique for the analysis of metal-based anticancer
drugs. In addition to the quantitative analysis of the metal of interest in a sample, ICP-MS
can be used as an ultrasensitive metal selective detector in combination with speciation
techniques such as liquid chromatography. In the current review we provide a
systematic survey of publications describing the analysis of platinum- and ruthenium-
containing anticancer agents using ICP-MS, focused on the determination of total metal
concentrations and on the speciation of metal compounds in biological fluids, DNA- and
protein-adducts, and environmental samples. We conclude that ICP-MS is a powerful
tool for the quantitative analysis of metal-based anticancer agents from multiple sample
sources.
Chapter 1.2
20
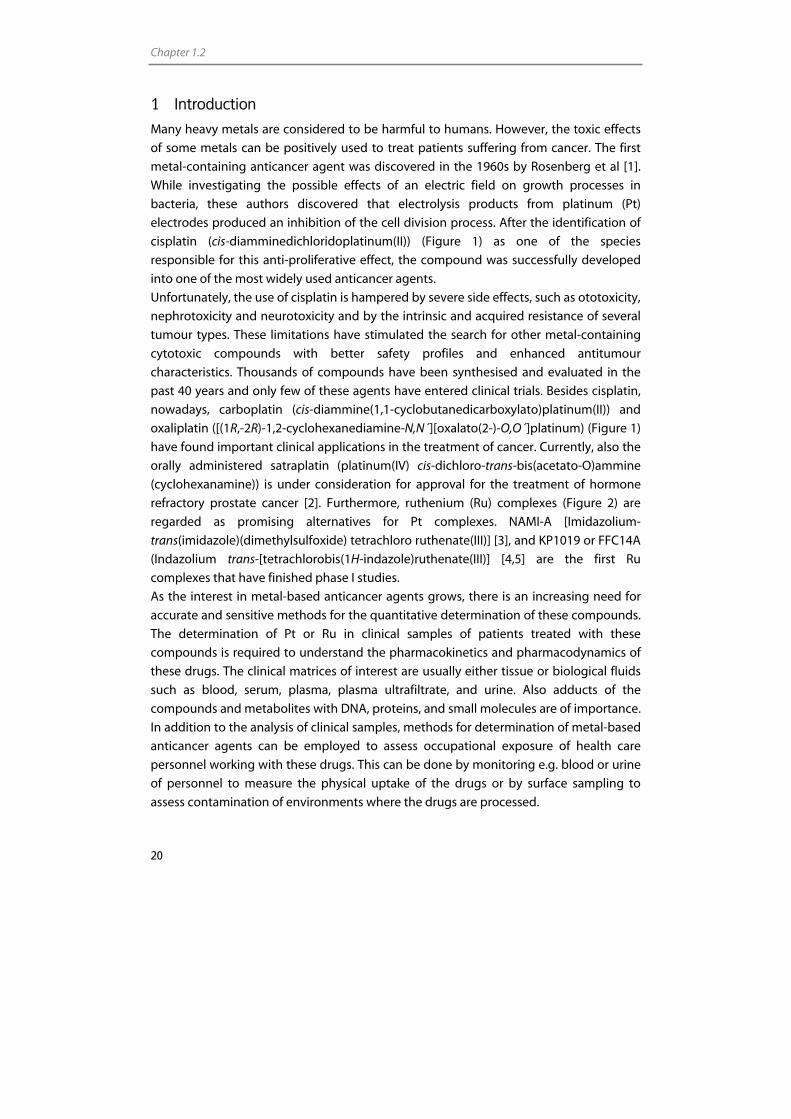
1 Introduction
Many heavy metals are considered to be harmful to humans. However, the toxic effects
of some metals can be positively used to treat patients suffering from cancer. The first
metal-containing anticancer agent was discovered in the 1960s by Rosenberg et al [1].
While investigating the possible effects of an electric field on growth processes in
bacteria, these authors discovered that electrolysis products from platinum (Pt)
electrodes produced an inhibition of the cell division process. After the identification of
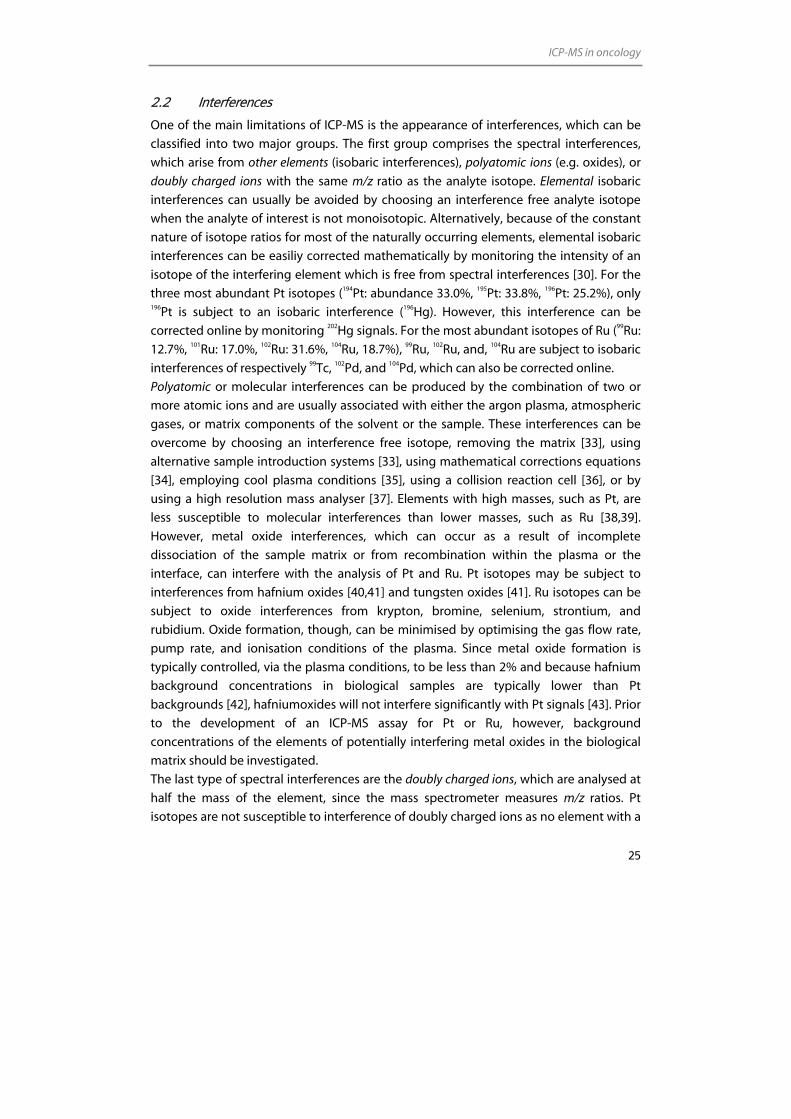
cisplatin (cis-diamminedichloridoplatinum(II)) (Figure 1) as one of the species
responsible for this anti-proliferative effect, the compound was successfully developed
into one of the most widely used anticancer agents.
Unfortunately, the use of cisplatin is hampered by severe side effects, such as ototoxicity,
nephrotoxicity and neurotoxicity and by the intrinsic and acquired resistance of several
tumour types. These limitations have stimulated the search for other metal-containing
cytotoxic compounds with better safety profiles and enhanced antitumour
characteristics. Thousands of compounds have been synthesised and evaluated in the
past 40 years and only few of these agents have entered clinical trials. Besides cisplatin,
nowadays, carboplatin (cis-diammine(1,1-cyclobutanedicarboxylato)platinum(II)) and
oxaliplatin ([(1R,-2R)-1,2-cyclohexanediamine-N,N´][oxalato(2-)-O,O´]platinum) (Figure 1)
have found important clinical applications in the treatment of cancer. Currently, also the
orally administered satraplatin (platinum(IV) cis-dichloro-trans-bis(acetato-O)ammine
(cyclohexanamine)) is under consideration for approval for the treatment of hormone
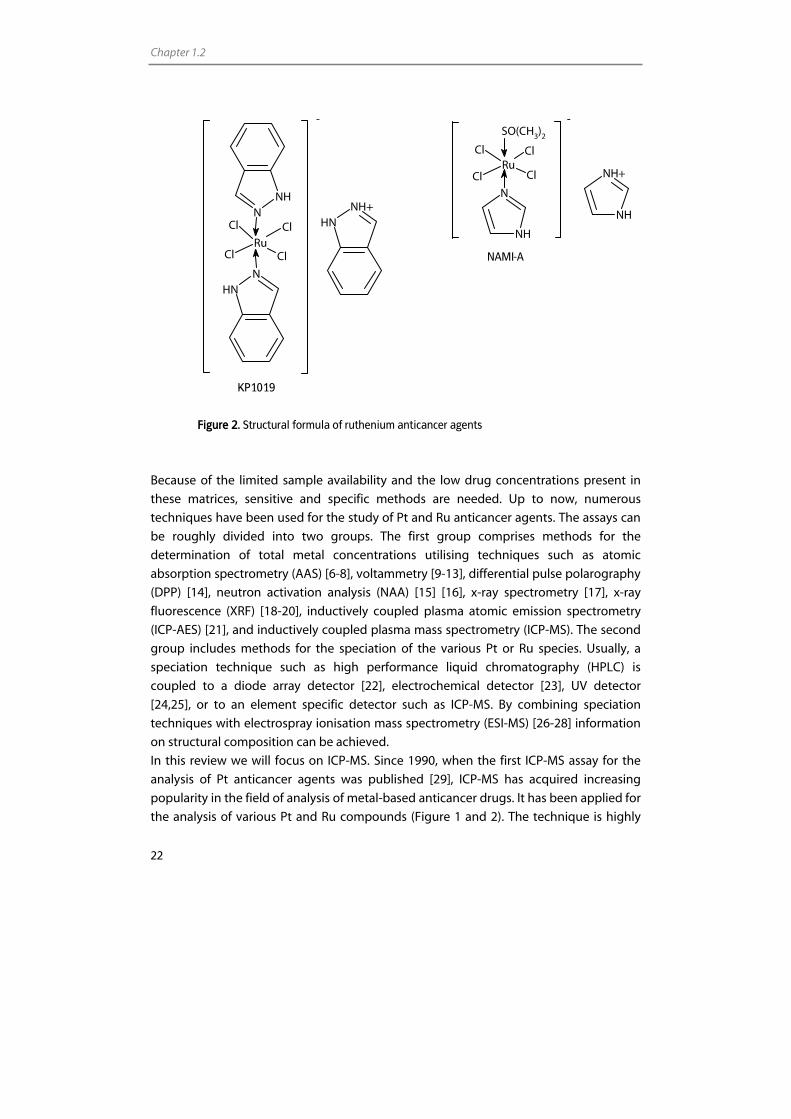
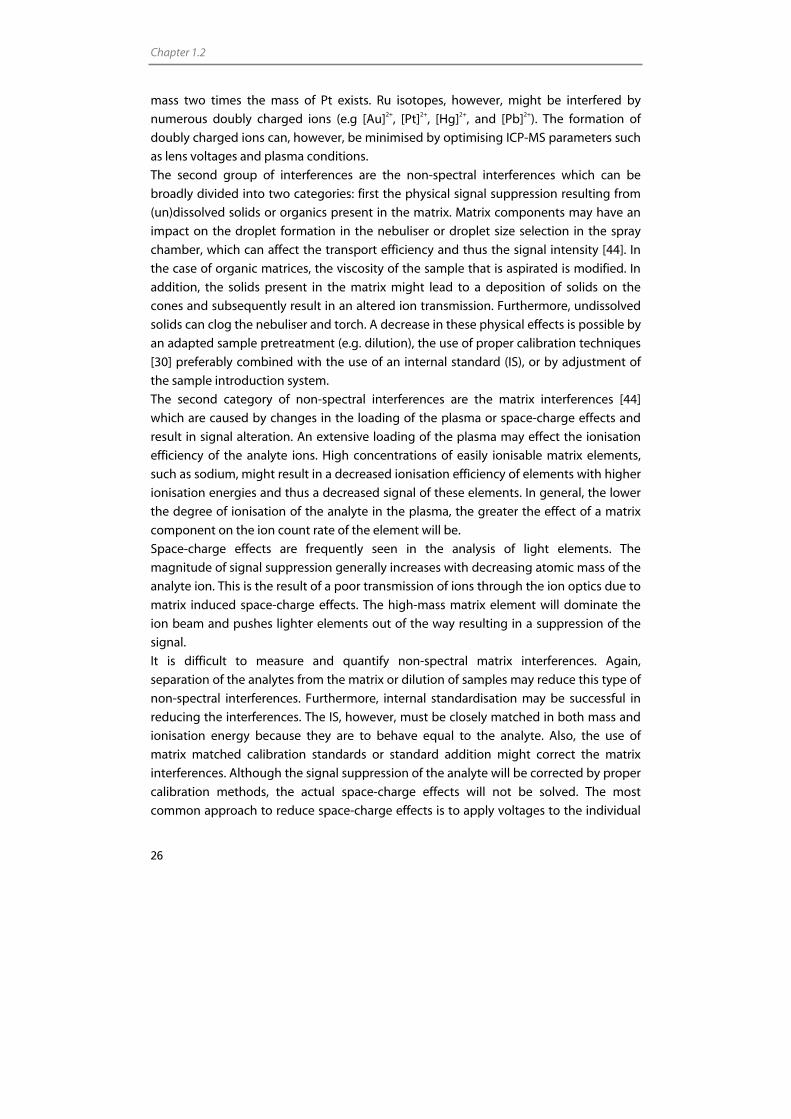
refractory prostate cancer [2]. Furthermore, ruthenium (Ru) complexes (Figure 2) are
regarded as promising alternatives for Pt complexes. NAMI-A [Imidazolium-
trans(imidazole)(dimethylsulfoxide) tetrachloro ruthenate(III)] [3], and KP1019 or FFC14A
(Indazolium trans-[tetrachlorobis(1H-indazole)ruthenate(III)] [4,5] are the first Ru
complexes that have finished phase I studies.
As the interest in metal-based anticancer agents grows, there is an increasing need for
accurate and sensitive methods for the quantitative determination of these compounds.
The determination of Pt or Ru in clinical samples of patients treated with these
compounds is required to understand the pharmacokinetics and pharmacodynamics of
these drugs. The clinical matrices of interest are usually either tissue or biological fluids
such as blood, serum, plasma, plasma ultrafiltrate, and urine. Also adducts of the
compounds and metabolites with DNA, proteins, and small molecules are of importance.
In addition to the analysis of clinical samples, methods for determination of metal-based
anticancer agents can be employed to assess occupational exposure of health care
personnel working with these drugs. This can be done by monitoring e.g. blood or urine
of personnel to measure the physical uptake of the drugs or by surface sampling to
assess contamination of environments where the drugs are processed.
ICP-MS in oncology
21
Pt
Cl
Cl
NH3
NH3
O
O
O
O
Pt
NH3
NH3
Cisplatin Carboplatin
Pt
Cl
ClNH3
N
CH3
Pt
O
O
O
O
NH
2
NH2
ZD0473 Oxaliplatin
PtCl
O
O
ClNH3
NH2
CCH3
O
CCH3
O
Pt
ClCl
ClCl
NH
2
NH2
Satraplatin Ormaplatin
NH3
Pt
Cl NH3
Pt
NH3 NH2(CH2)6H2N
NH3
Pt
Cl
NH3
NH3NH2(CH2)6H2N
BBR3464
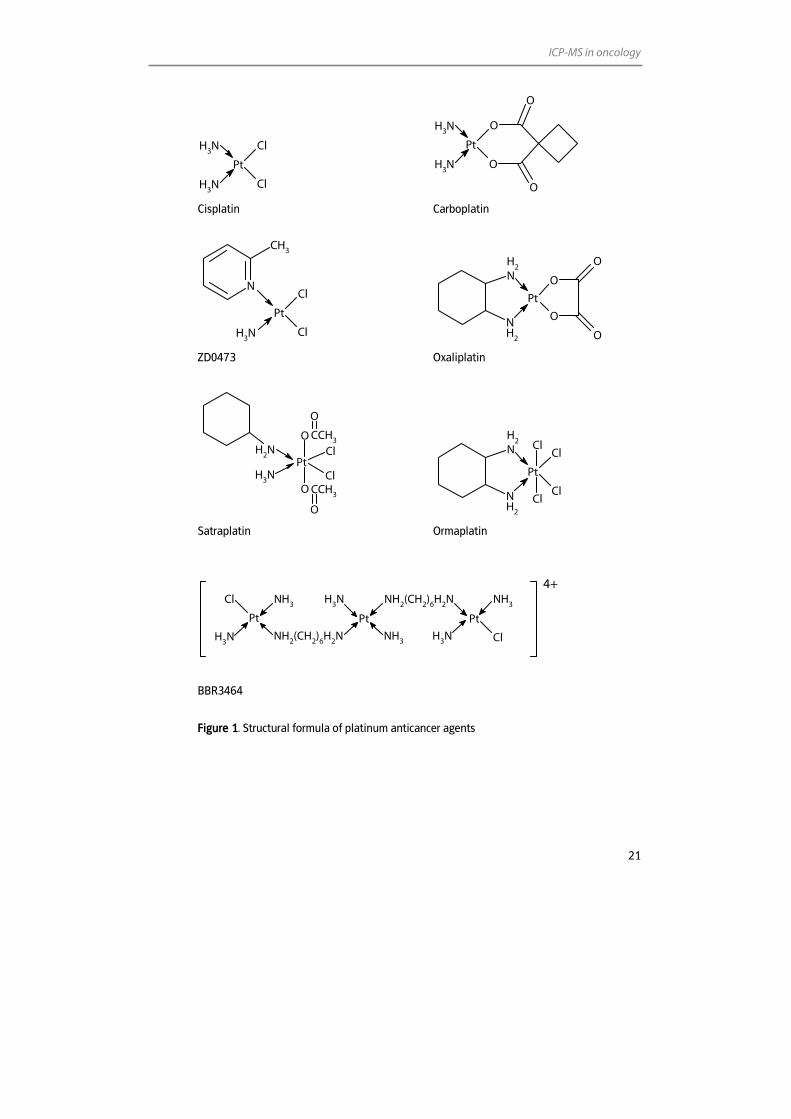
Figure 1. Structural formula of platinum anticancer agents
4+
Chapter 1.2
22
N
NH
-
NH+
NH
RuClCl
Cl Cl
SO(CH3)2
NAMI-A
KP1019
Figure 2. Structural formula of ruthenium anticancer agents
Because of the limited sample availability and the low drug concentrations present in
these matrices, sensitive and specific methods are needed. Up to now, numerous
techniques have been used for the study of Pt and Ru anticancer agents. The assays can
be roughly divided into two groups. The first group comprises methods for the
determination of total metal concentrations utilising techniques such as atomic
absorption spectrometry (AAS) [6-8], voltammetry [9-13], differential pulse polarography
(DPP) [14], neutron activation analysis (NAA) [15] [16], x-ray spectrometry [17], x-ray
fluorescence (XRF) [18-20], inductively coupled plasma atomic emission spectrometry
(ICP-AES) [21], and inductively coupled plasma mass spectrometry (ICP-MS). The second
group includes methods for the speciation of the various Pt or Ru species. Usually, a
speciation technique such as high performance liquid chromatography (HPLC) is
coupled to a diode array detector [22], electrochemical detector [23], UV detector
[24,25], or to an element specific detector such as ICP-MS. By combining speciation
techniques with electrospray ionisation mass spectrometry (ESI-MS) [26-28] information
on structural composition can be achieved.
In this review we will focus on ICP-MS. Since 1990, when the first ICP-MS assay for the
analysis of Pt anticancer agents was published [29], ICP-MS has acquired increasing
popularity in the field of analysis of metal-based anticancer drugs. It has been applied for
the analysis of various Pt and Ru compounds (Figure 1 and 2). The technique is highly
-
NH+NHCl
NNH
NNH
RuCl
Cl
Cl
ICP-MS in oncology
23
sensitive and is applicable to a wide range of sample matrices including those of
biological and environmental origin. As a result of the successful application of ICP-MS in
the field of oncology, the number of publications on the quantitative analysis of Pt and
Ru using ICP-MS and speciation techniques coupled to ICP-MS has increased
tremendously over the last twenty years. The papers have appeared in a large range of
scientific journals, covering the many disciplines this research comprises, e.g. medicine,
pharmacy, and chemistry.
The purpose of the current review is to provide a selected, systematic survey of
publications describing the analysis of Pt and Ru using ICP-MS in the field of oncology.
The focus is on the determination of the total metal concentration and on the speciation
of Pt and Ru compounds in human biological fluids, DNA- and protein-adducts, and
environmental samples. Problems encountered when developing an ICP-MS assay with
or without combination with a speciation technique are discussed.
2 Analytical ICP-MS assays: general aspects
2.1 Technique
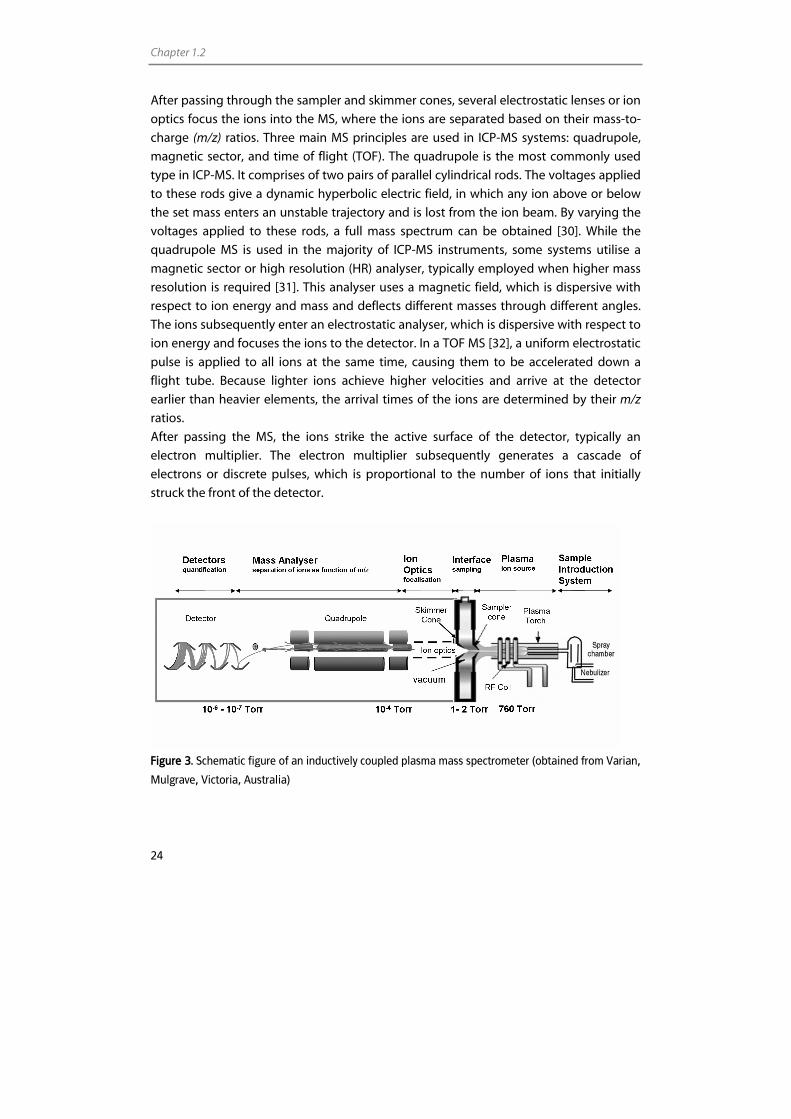
As the name implies, ICP-MS is a combination of an inductively coupled plasma (ICP)
with a mass spectrometer (MS) (Figure 3). Typically, the sample is introduced into the ICP
by a sample introduction system consisting of a peristaltic pump and a nebuliser, which
generates a fine aerosol in a spray chamber. The spray chamber separates the small
droplets from the large droplets. Large droplets fall out by gravity and exit through the
drain tube at the end of the spray chamber, while the small droplets pass between the
outer wall and the central tube and are eventually transported into the sample injector
of the plasma torch using a flow of argon gas. The aerosol is then transported to the ICP,
which is a plasma ion source. This plasma is formed by the application of a high voltage
spark to a tangential flow of argon gas, which causes electrons to be stripped from their
argon atoms. These electrons are caught up and accelerated into a magnetic field,
formed by a radio frequency (RF) energy which is applied on a RF coil surrounding the
plasma torch. This process causes a chain reaction of collision-induced ionisation leading
to an ICP discharge. The ICP reaches temperatures of 6,000-8,000°K. As the aerosol
transits the plasma, the droplets undergo numerous processes which include
desolvation, dissociation, atomisation, and ionisation [30]. Ions produced by the argon
ICP are principally atomic and singly charged, making it an ideal source for atomic MS.
Since the ICP works at atmospheric pressure and the MS requires a vacuum, an interface
typically consisting of a coaxial assembly of two cones (sampler and skimmer cone) and
a series of pressured differentials to allow efficient sampling of the atmospheric pressure
plasma gases while minimally perturbing the composition of the sample gases.
Chapter 1.2
24
After passing through the sampler and skimmer cones, several electrostatic lenses or ion
optics focus the ions into the MS, where the ions are separated based on their mass-to-
charge (m/z) ratios. Three main MS principles are used in ICP-MS systems: quadrupole,
magnetic sector, and time of flight (TOF). The quadrupole is the most commonly used
type in ICP-MS. It comprises of two pairs of parallel cylindrical rods. The voltages applied
to these rods give a dynamic hyperbolic electric field, in which any ion above or below
the set mass enters an unstable trajectory and is lost from the ion beam. By varying the
voltages applied to these rods, a full mass spectrum can be obtained [30]. While the
quadrupole MS is used in the majority of ICP-MS instruments, some systems utilise a
magnetic sector or high resolution (HR) analyser, typically employed when higher mass
resolution is required [31]. This analyser uses a magnetic field, which is dispersive with
respect to ion energy and mass and deflects different masses through different angles.
The ions subsequently enter an electrostatic analyser, which is dispersive with respect to
ion energy and focuses the ions to the detector. In a TOF MS [32], a uniform electrostatic
pulse is applied to all ions at the same time, causing them to be accelerated down a
flight tube. Because lighter ions achieve higher velocities and arrive at the detector
earlier than heavier elements, the arrival times of the ions are determined by their m/z
ratios.
After passing the MS, the ions strike the active surface of the detector, typically an
electron multiplier. The electron multiplier subsequently generates a cascade of
electrons or discrete pulses, which is proportional to the number of ions that initially
struck the front of the detector.
Figure 3. Schematic figure of an inductively coupled plasma mass spectrometer (obtained from Varian,
Mulgrave, Victoria, Australia)
ICP-MS in oncology
25
2.2 Interferences
One of the main limitations of ICP-MS is the appearance of interferences, which can be
classified into two major groups. The first group comprises the spectral interferences,
which arise from other elements (isobaric interferences), polyatomic ions (e.g. oxides), or
doubly charged ions with the same m/z ratio as the analyte isotope. Elemental isobaric
interferences can usually be avoided by choosing an interference free analyte isotope
when the analyte of interest is not monoisotopic. Alternatively, because of the constant
nature of isotope ratios for most of the naturally occurring elements, elemental isobaric
interferences can be easiliy corrected mathematically by monitoring the intensity of an
isotope of the interfering element which is free from spectral interferences [30]. For the
three most abundant Pt isotopes (194Pt: abundance 33.0%, 195Pt: 33.8%, 196Pt: 25.2%), only 196Pt is subject to an isobaric interference (196Hg). However, this interference can be
corrected online by monitoring 202Hg signals. For the most abundant isotopes of Ru (99Ru:
12.7%, 101Ru: 17.0%, 102Ru: 31.6%, 104Ru, 18.7%), 99Ru, 102Ru, and, 104Ru are subject to isobaric
interferences of respectively 99Tc, 102Pd, and 104Pd, which can also be corrected online.
Polyatomic or molecular interferences can be produced by the combination of two or
more atomic ions and are usually associated with either the argon plasma, atmospheric
gases, or matrix components of the solvent or the sample. These interferences can be
overcome by choosing an interference free isotope, removing the matrix [33], using
alternative sample introduction systems [33], using mathematical corrections equations
[34], employing cool plasma conditions [35], using a collision reaction cell [36], or by
using a high resolution mass analyser [37]. Elements with high masses, such as Pt, are
less susceptible to molecular interferences than lower masses, such as Ru [38,39].
However, metal oxide interferences, which can occur as a result of incomplete
dissociation of the sample matrix or from recombination within the plasma or the
interface, can interfere with the analysis of Pt and Ru. Pt isotopes may be subject to
interferences from hafnium oxides [40,41] and tungsten oxides [41]. Ru isotopes can be
subject to oxide interferences from krypton, bromine, selenium, strontium, and
rubidium. Oxide formation, though, can be minimised by optimising the gas flow rate,
pump rate, and ionisation conditions of the plasma. Since metal oxide formation is
typically controlled, via the plasma conditions, to be less than 2% and because hafnium
background concentrations in biological samples are typically lower than Pt
backgrounds [42], hafniumoxides will not interfere significantly with Pt signals [43]. Prior
to the development of an ICP-MS assay for Pt or Ru, however, background
concentrations of the elements of potentially interfering metal oxides in the biological
matrix should be investigated.
The last type of spectral interferences are the doubly charged ions, which are analysed at
half the mass of the element, since the mass spectrometer measures m/z ratios. Pt
isotopes are not susceptible to interference of doubly charged ions as no element with a
Chapter 1.2
26
mass two times the mass of Pt exists. Ru isotopes, however, might be interfered by
numerous doubly charged ions (e.g [Au]2+, [Pt]2+, [Hg]2+, and [Pb]2+). The formation of
doubly charged ions can, however, be minimised by optimising ICP-MS parameters such
as lens voltages and plasma conditions.
The second group of interferences are the non-spectral interferences which can be
broadly divided into two categories: first the physical signal suppression resulting from
(un)dissolved solids or organics present in the matrix. Matrix components may have an
impact on the droplet formation in the nebuliser or droplet size selection in the spray
chamber, which can affect the transport efficiency and thus the signal intensity [44]. In
the case of organic matrices, the viscosity of the sample that is aspirated is modified. In
addition, the solids present in the matrix might lead to a deposition of solids on the
cones and subsequently result in an altered ion transmission. Furthermore, undissolved
solids can clog the nebuliser and torch. A decrease in these physical effects is possible by
an adapted sample pretreatment (e.g. dilution), the use of proper calibration techniques
[30] preferably combined with the use of an internal standard (IS), or by adjustment of
the sample introduction system.
The second category of non-spectral interferences are the matrix interferences [44]
which are caused by changes in the loading of the plasma or space-charge effects and
result in signal alteration. An extensive loading of the plasma may effect the ionisation
efficiency of the analyte ions. High concentrations of easily ionisable matrix elements,
such as sodium, might result in a decreased ionisation efficiency of elements with higher
ionisation energies and thus a decreased signal of these elements. In general, the lower
the degree of ionisation of the analyte in the plasma, the greater the effect of a matrix
component on the ion count rate of the element will be.
Space-charge effects are frequently seen in the analysis of light elements. The
magnitude of signal suppression generally increases with decreasing atomic mass of the
analyte ion. This is the result of a poor transmission of ions through the ion optics due to
matrix induced space-charge effects. The high-mass matrix element will dominate the
ion beam and pushes lighter elements out of the way resulting in a suppression of the
signal.
It is difficult to measure and quantify non-spectral matrix interferences. Again,
separation of the analytes from the matrix or dilution of samples may reduce this type of
non-spectral interferences. Furthermore, internal standardisation may be successful in
reducing the interferences. The IS, however, must be closely matched in both mass and
ionisation energy because they are to behave equal to the analyte. Also, the use of
matrix matched calibration standards or standard addition might correct the matrix
interferences. Although the signal suppression of the analyte will be corrected by proper
calibration methods, the actual space-charge effects will not be solved. The most
common approach to reduce space-charge effects is to apply voltages to the individual
ICP-MS in oncology
27
ion lens components. This will steer the analyte ions through the mass analyser while
rejecting a maximum number of matrix ions [44].
2.3 Combination of ICP-MS detection with speciation techniques
ICP-MS can be used as a Pt or Ru specific detector for several speciation technologies.
ICP-MS has several advantages over other methods of detection including a wide linear
dynamic range, low detection limits, potential for isotope determinations, and multi-
element capability. Moreover, the signal intensities are independent of the chemical
structure of the analyte incorporating Pt or Ru and hence the method does not require
standards of each analyte/metabolite/adduct. ICP-MS can provide quantitative
information for structurally non-correlated metal compounds.
2.4 Method validation
Following development of an ICP-MS assay and before implementation into routine use,
the assay needs to be validated to demonstrate that it is suitable for its intended use.
Validation is required to ensure the performance of the method. As chromatography is
widely used in bioanalysis, validation guidelines have already been extensively
described for speciation methods [45]. In contrast, no such guidelines are available for
ICP-MS. This has led to some discrepancies concerning the definition of validation
parameters in literature describing ICP-MS based bioanalytical assays. No stringent
procedure is followed for the assessment of limit of detections (LODs), lower limit of
quantifications (LLOQs), precision, accuracy, and linearity in the field of ICP-MS. The LOD
and LLOQ for instance can be obtained by several approaches such as; signal-to-noise
ratios, the standard deviation of the noise, or the standard deviation of the noise and
slope of the calibration curve [46]. For reported ICP-MS assays it is not always defined
which approach has been used. Furthermore, the LOD, LLOQ, and calibration range are
reported either in the processed sample matrix (the final matrix entering the ICP-MS) or
in the unprocessed sample matrix. The difficulty is, that the matrix in question is not
always clearly defined. Another intricacy is that concentrations of compounds are
commonly reported in weight per volume (w/v) instead of molar concentrations
(moles/v). In case of an elemental detection technique like ICP-MS, it therefore is pivotal
to report whether the metal or the metal-containing compound is used for calculation of
the concentrations. Unfortunately, this is not always clear from the reported data.
Because of these issues it is difficult to compare assays based on their detection limits
and other validation parameters.
In our opinion, procedures followed in e.g. the FDA guidelines could, as far as applicable
for ICP-MS, serve as an example for the development of a guideline for the validation of
Chapter 1.2
28
ICP-MS assays in biological matrices [45]. Validation parameters could include
assessment of the LLOQ, carry-over, linearity, specificity, accuracy, precision,
crossanalyte/IS interference, and stability.
3 Analytical ICP-MS assays: total metal determination
3.1 Application assays
3.1.1 Metal-based anticancer agents in biological fluids/cells
After an intravenous infusion, metal-based anticancer compounds form a variety of
hydrolysed intermediates in the blood [47,48]. These reactive species become rapidly
partitioned into plasma protein-bound metal, free plasma metal, tissue metal, white
blood cell metal, and erythrocyte-sequestered metal. The free metal fraction is generally
considered as the pharmacologically active metal fraction [49,50]. Because of the rapid
biotransformation and reactivity of the biotransformation products, investigation of the
pharmacokinetics of the intact parent compounds or the metabolites is technically
difficult and not feasible in routine analysis. Consequently, the assessment of total Pt or
Ru, rather than the analysis of the parent compound (e.g. cisplatin) and its metabolites
(e.g. aquated cisplatin), is a generally accepted approach for the analysis of the
pharmacokinetics of metal-based anticancer agents [51,52] in different biological
matrices. The analysis of the total metal content by an elemental technique such as ICP-
MS gives insight into the distribution of the drug irrespective of the molecular
composition of the drug and its metabolites. Since the first application of ICP-MS for an
oncology research question in 1990 [29], ICP-MS has become an accepted and
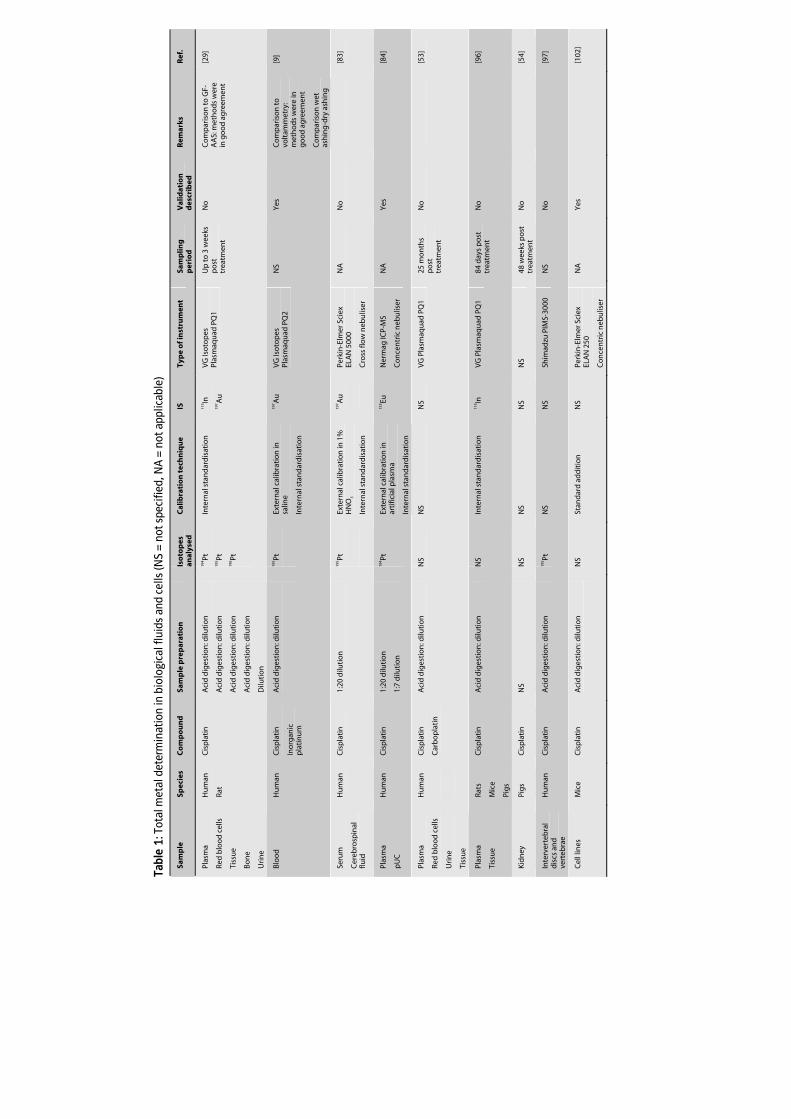
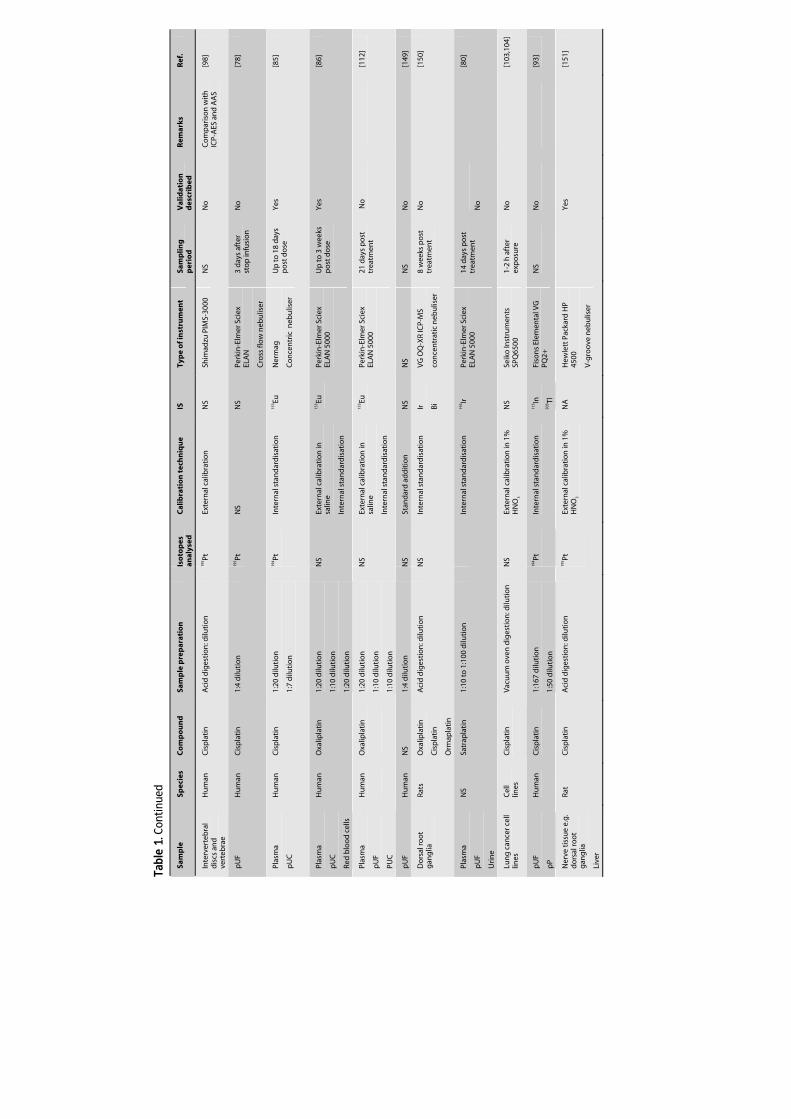
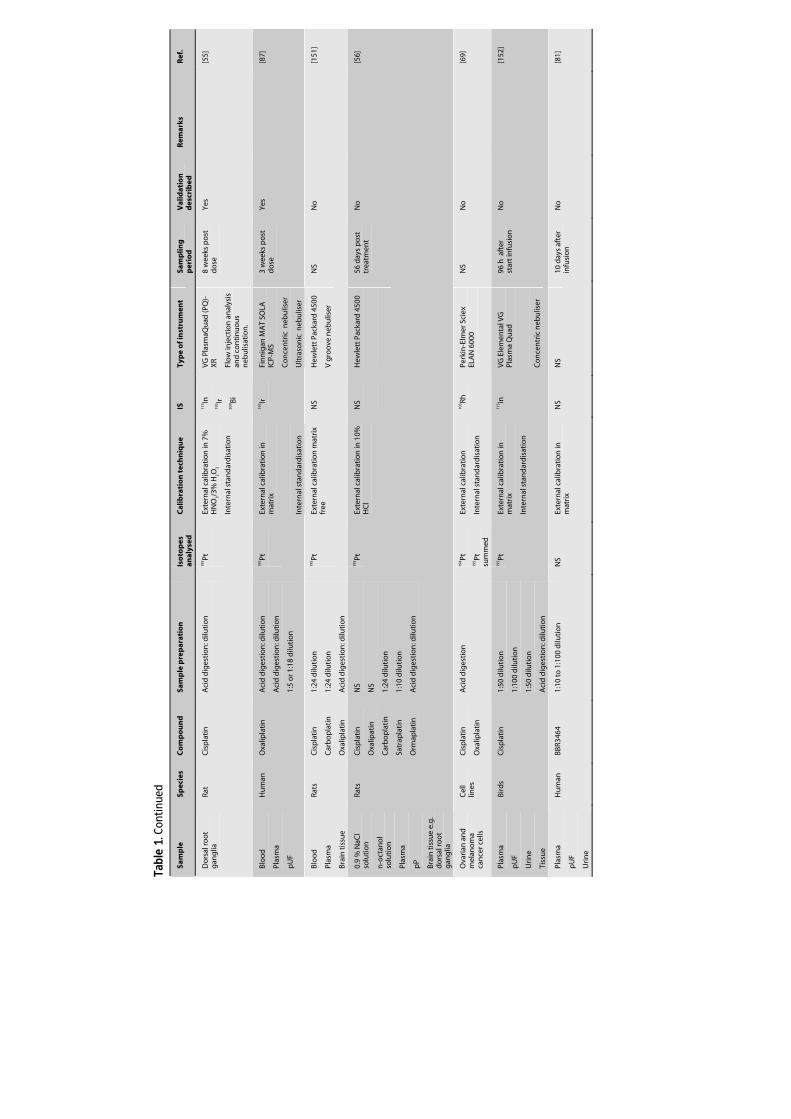
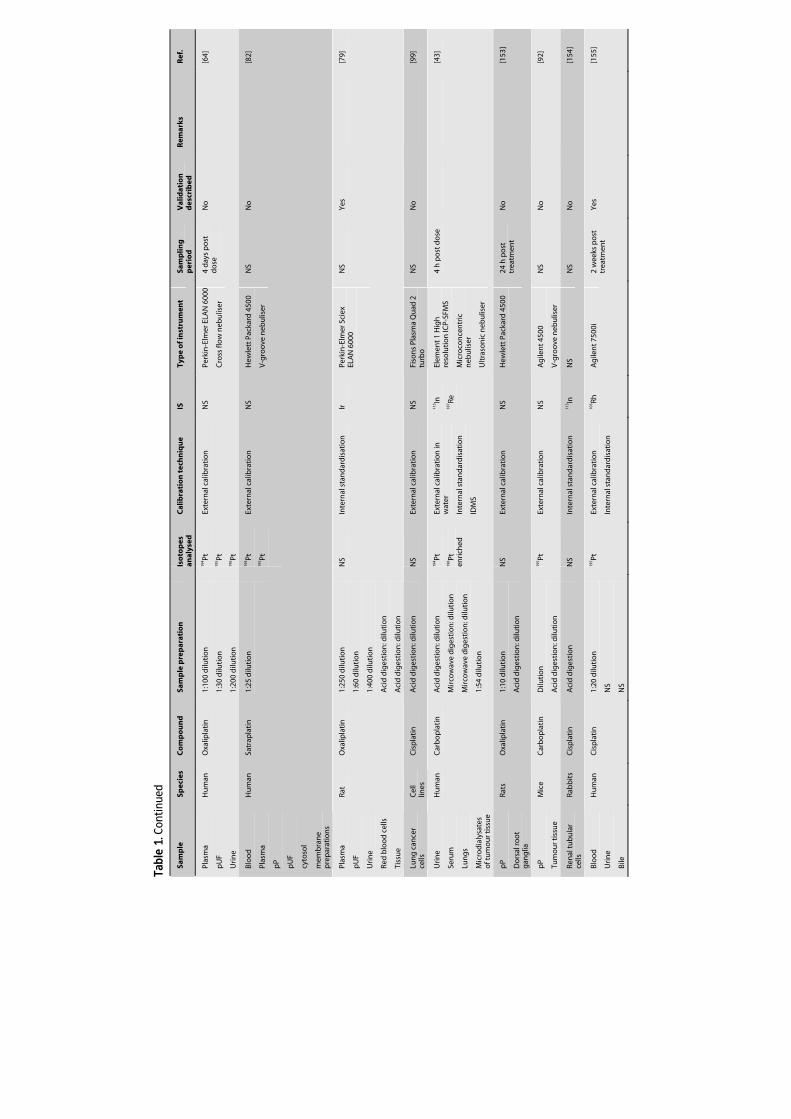
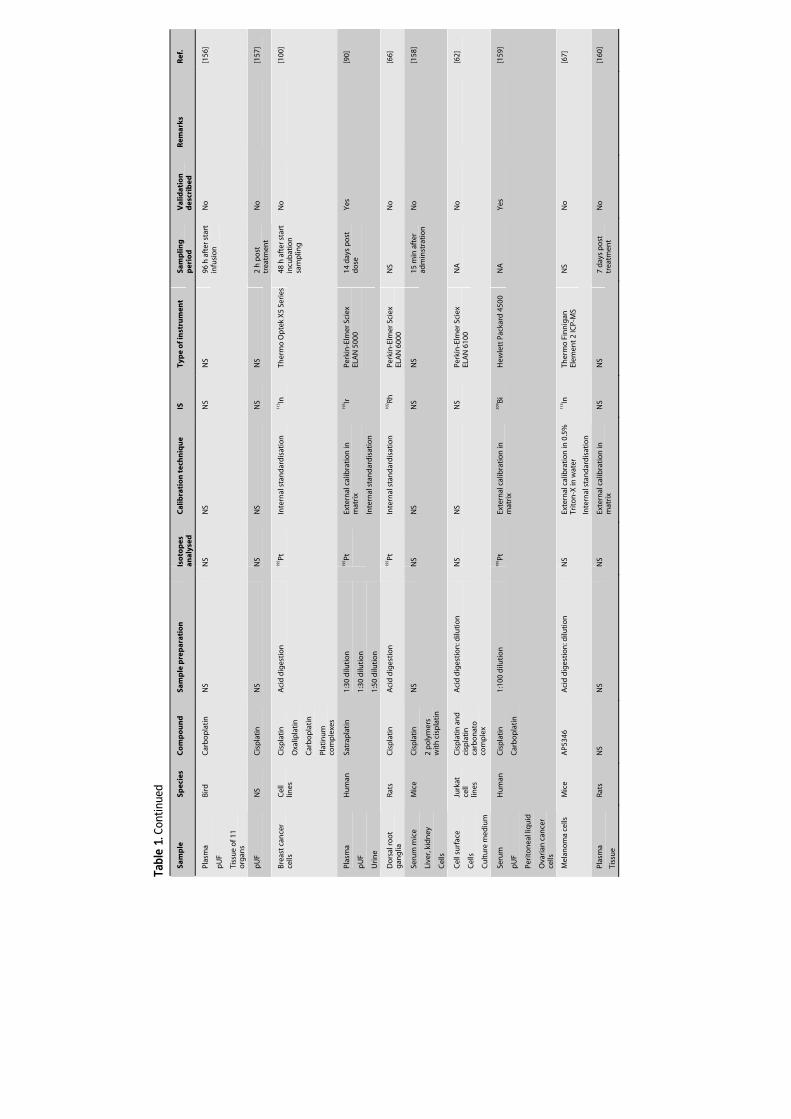
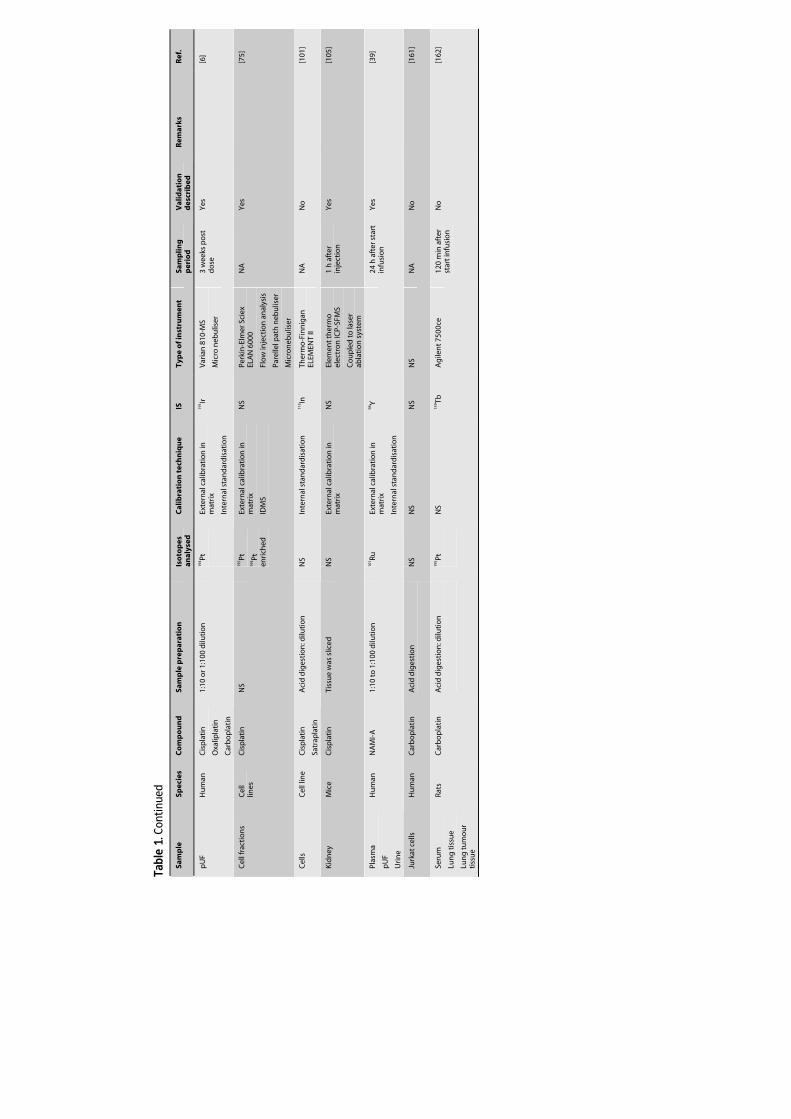
commonly used technique for the analysis of Pt anticancer agents. Table 1 summarises
the literature in which ICP-MS is used as the analytical technique to analyse total Pt and
Ru in biological fluids and tissue. Biological fluids predominantly studied are plasma or
serum, which contain the protein-bound and free metal fraction, ultrafiltered plasma
(pUF), ultracentrifuged plasma (pUC), or protein precipitated plasma (pP), which contain
the free metal fraction, and urine which contains metal eliminated by the kidney. The
tissues that are primarily studied in addition to tumour cells include renal and nerve
tissue, which are of interest due to the renal and neurotoxicity of Pt agents. The
capability of ICP-MS to measure ultra-trace Pt levels, allows the evaluation of long-term
Pt retention after treatment with Pt agents [53,53-56] as well as the determination of Pt
levels in small amounts of tissue samples.
Tabl
e 1:
Tot
al m
etal
det
erm
inat
ion
in b
iolo
gica
l flu
ids
and
cells
(NS
= no
t spe
cifie
d, N
A =
not
app
licab
le)
Sam
ple
Sp
ecie
s C
om
po
un
d
Sam
ple
pre
par
atio
n
Iso
top
es
anal
ysed
C
alib
rati
on
tec
hn
iqu
e IS
Ty
pe
of i
nst
rum
ent
Sam
plin
g
per
iod
V
alid
atio
n
des
crib
ed
Rem
arks
R
ef.
Plas
ma
Red
blo
od
cel
ls
Tiss
ue
Bo
ne
Uri
ne
Hu
man
Rat
Cis
pla
tin
A
cid
dig
esti
on
: dilu
tio
n
Aci
d d
iges
tio
n: d
iluti
on
Aci
d d
iges
tio
n: d
iluti
on
Aci
d d
iges
tio
n: d
iluti
on
Dilu
tio
n
194 Pt
19
5 Pt
196 Pt
Inte
rnal
sta
nd
ard
isat
ion
11
5 In
197 A
u
VG
Iso
top
es
Plas
maq
uad
PQ
1 U
p t
o 3
wee
ks
po
st
trea
tmen
t
No
C
om
par
iso
n to
GF-
AA
S: m
eth
od
s w
ere
in g
oo
d a
gre
emen
t
[29]
Blo
od
H
um
an
Cis
pla
tin
Ino
rgan
ic
pla
tin
um
Aci
d d
iges
tio
n: d
iluti
on
195 Pt
Exte
rnal
cal
ibra
tio
n in
sa
line
Inte
rnal
sta
nd
ard
isat
ion
197 A
u
VG
Iso
top
es
Plas
maq
uad
PQ
2
NS
Yes
C
om
par
iso
n to
vo
ltam
met
ry:
met
ho
ds
wer
e in
g
oo
d a
gre
emen
t
Co
mp
aris
on
wet
as
hin
g-d
ry a
shin
g
[9]
Seru
m
Cer
ebro
spin
al
fluid
Hu
man
C
isp
lati
n
1:20
dilu
tio
n
195 Pt
Exte
rnal
cal
ibra
tio
n in
1%
H
NO
3
Inte
rnal
sta
nd
ard
isat
ion
197 A
u
Perk
in-E
lmer
Sci
ex
ELA
N 5
000
Cro
ss fl
ow
neb
ulis
er
NA
N
o
[8
3]
Plas
ma
pU
C
Hu
man
C
isp
lati
n
1:20
dilu
tio
n
1:7
dilu
tio
n
194 Pt
Exte
rnal
cal
ibra
tio
n in
ar
tific
ial p
lasm
a
Inte
rnal
sta
nd
ard
isat
ion
153 Eu
Ner
mag
ICP-
MS
Co
nce
ntr
ic n
ebu
liser
NA
Y
es
[8
4]
Plas
ma
Red
blo
od
cel
ls
Uri
ne
Tiss
ue
Hu
man
Cis
pla
tin
Car
bo
pla
tin
Aci
d d
iges
tio
n: d
iluti
on
N
S N
S N
S V
G P
lasm
aqu
ad P
Q1
25 m
on
ths
po
st
trea
tmen
t
No
[53]
Plas
ma
Tiss
ue
Rats
Mic
e
Pig
s
Cis
pla
tin
A
cid
dig
esti
on
: dilu
tio
n
NS
Inte
rnal
sta
nd
ard
isat
ion
11
5 In
VG
Pla
smaq
uad
PQ
1 84
day
s p
ost
tr
eatm
ent
No
[96]
Kid
ney
Pi
gs
Cis
pla
tin
N
S N
S N
S N
S N
S 48
wee
ks p
ost
tr
eatm
ent
No
[54]
Inte
rver
teb
ral
dis
cs a
nd
ve
rteb
rae
Hu
man
C
isp
lati
n
Aci
d d
iges
tio
n: d
iluti
on
19
5 Pt
NS
NS
Shim
adzu
PIM
S-30
00
NS
No
[97]
Cel
l lin
es
Mic
e C
isp
lati
n
Aci
d d
iges
tio
n: d
iluti
on
NS
Stan
dar
d a
dd
itio
n
NS
Perk
in-E
lmer
Sci
ex
ELA
N 2
50
Co
nce
ntr
ic n
ebu
liser
NA
Y
es
[1
02]
Tabl
e 1.
Con
tinue
d
Sam
ple
Sp
ecie
s C
om
po
un
d
Sam
ple
pre
par
atio
n
Iso
top
es
anal
ysed
C
alib
rati
on
tec
hn
iqu
e IS
Ty
pe
of i
nst
rum
ent
Sam
plin
g
per
iod
V
alid
atio
n
des
crib
ed
Rem
arks
R
ef.
Inte
rver
teb
ral
dis
cs a
nd
ve
rteb
rae
Hu
man
C
isp
lati
n
Aci
d d
iges
tio
n: d
iluti
on
19
5 Pt
Exte
rnal
cal
ibra
tio
n
NS
Shim
adzu
PIM
S-30
00
NS
No
C
om
par
iso
n w
ith
IC
P-A
ES a
nd
AA
S [9
8]
pU
F
Hu
man
C
isp
lati
n
1:4
dilu
tio
n
195 Pt
N
S N
S Pe
rkin
-Elm
er S
ciex
EL
AN
Cro
ss fl
ow
neb
ulis
er
3 d
ays
afte
r st
op
infu
sio
n
No
[78]
Plas
ma
pU
C
Hu
man
C
isp
lati
n
1:20
dilu
tio
n
1:7
dilu
tio
n
194 Pt
Inte
rnal
sta
nd
ard
isat
ion
15
3 Eu
Ner
mag
Co
nce
ntr
ic n
ebu
liser
Up
to 1
8 d
ays
po
st d
ose
Y
es
[8
5]
Plas
ma
pU
C
Red
blo
od
cel
ls
Hu
man
O
xalip
lati
n
1:20
dilu
tio
n
1:10
dilu
tio
n
1:20
dilu
tio
n
NS
Exte
rnal
cal
ibra
tio
n in
sa
line
Inte
rnal
sta
nd
ard
isat
ion
153 Eu
Perk
in-E
lmer
Sci
ex
ELA
N 5
000
Up
to
3 w
eeks
p
ost
do
se
Yes
[86]
Plas
ma
pU
F
PUC
Hu
man
Oxa
lipla
tin
1:20
dilu
tio
n
1:10
dilu
tio
n
1:10
dilu
tio
n
NS
Exte
rnal
cal
ibra
tio
n in
sa
line
Inte
rnal
sta
nd
ard
isat
ion
153 Eu
Pe
rkin
-Elm
er S
ciex
EL
AN
500
0
21 d
ays
po
st
trea
tmen
t N
o
[1
12]
pU
F
Hu
man
N
S 1:
4 d
iluti
on
N
S St
and
ard
ad
dit
ion
N
S N
S N
S N
o
[1
49]
Do
rsal
roo
t g
ang
lia
Rats
O
xalip
lati
n
Cis
pla
tin
Orm
apla
tin
Aci
d d
iges
tio
n: d
iluti
on
N
S In
tern
al s
tan
dar
dis
atio
n
Ir
Bi
VG
OQ
-XR
ICP-
MS
con
cen
trat
ic n
ebu
liser
8 w
eeks
po
st
trea
tmen
t N
o
[1
50]
Plas
ma
pU
F
Uri
ne
NS
Satr
apla
tin
1:
10 to
1:1
00 d
iluti
on
Inte
rnal
sta
nd
ard
isat
ion
19
3 Ir
Perk
in-E
lmer
Sci
ex
ELA
N 5
000
14 d
ays
po
st
trea
tmen
t N
o
[8
0]
Lun
g c
ance
r cel
l lin
es
Cel
l lin
es
Cis
pla
tin
Vac
uu
m o
ven
dig
esti
on
: dilu
tio
n
NS
Exte
rnal
cal
ibra
tio
n in
1%
H
NO
3 N
S Se
iko
Inst
rum
ents
SP
Q65
00
1-2
h a
fter
ex
po
sure
N
o
[1
03,1
04]
pU
F
pP
Hu
man
C
isp
lati
n
1:16
7 d
iluti
on
1:50
dilu
tio
n
194 Pt
Inte
rnal
sta
nd
ard
isat
ion
11
5 In
203 Tl
Fiso
ns
Elem
enta
l VG
PQ
2+
NS
No
[93]
Ner
ve t
issu
e e.
g.
do
rsal
roo
t g
ang
lia
Live
r
Rat
Cis
pla
tin
A
cid
dig
esti
on
: dilu
tio
n
195 Pt
Exte
rnal
cal
ibra
tio
n in
1%
H
NO
3
NA
H
ewle
tt P
acka
rd H
P 45
00
V-g
roo
ve n
ebu
liser
Y
es
[1
51]
Tabl
e 1.
Con
tinue
d
Sam
ple
Sp
ecie
s C
om
po
un
d
Sam
ple
pre
par
atio
n
Iso
top
es
anal
ysed
C
alib
rati
on
tec
hn
iqu
e IS
Ty
pe
of i
nst
rum
ent
Sam
plin
g
per
iod
V
alid
atio
n
des
crib
ed
Rem
arks
R
ef.
Do
rsal
roo
t g
ang
lia
Rat
Cis
pla
tin
A
cid
dig
esti
on
: dilu
tio
n
195 Pt
Exte
rnal
cal
ibra
tio
n in
7%
H
NO
3/3%
H2O
2
Inte
rnal
sta
nd
ard
isat
ion
115 In
19
3 Ir
209 Bi
VG
Pla
smaQ
uad
(PQ
)-X
R
Flo
w in
ject
ion
an
alys
is
and
co
nti
nu
ou
s n
ebu
lisat
ion
.
8 w
eeks
po
st
do
se
Yes
[55]
Blo
od
Plas
ma
pU
F
Hu
man
O
xalip
lati
n
Aci
d d
iges
tio
n: d
iluti
on
Aci
d d
iges
tio
n: d
iluti
on
1:5
or 1
:18
dilu
tio
n
195 Pt
Exte
rnal
cal
ibra
tio
n in
m
atri
x
Inte
rnal
sta
nd
ard
isat
ion
193 Ir
Fin
nig
an M
AT
SOLA
IC
P-M
S
Co
nce
ntr
ic n
ebu
liser
Ult
raso
nic
neb
ulis
er
3 w
eeks
po
st
do
se
Yes
[87]
Blo
od
Plas
ma
Bra
in t
issu
e
Rats
C
isp
lati
n
Car
bo
pla
tin
Oxa
lipla
tin
1:24
dilu
tio
n
1:24
dilu
tio
n
Aci
d d
iges
tio
n: d
iluti
on
195 Pt
Exte
rnal
cal
ibra
tio
n m
atri
x fr
ee
NS
Hew
lett
Pac
kard
450
0
V g
roo
ve n
ebu
liser
NS
No
[151
]
0.9
% N
aCl
solu
tio
n
n-o
ctan
ol
solu
tio
n
Plas
ma
pP
Bra
in t
issu
e e.
g.
do
rsal
roo
t g
ang
lia
Rats
C
isp
lati
n
Oxa
lipat
in
Car
bo
pla
tin
Satr
apla
tin
Orm
apla
tin
NS
NS
1:24
dilu
tio
n
1:10
dilu
tio
n
Aci
d d
iges
tio
n: d
iluti
on
195 Pt
Ex
tern
al c
alib
rati
on
in 1
0%
HC
l N
S
Hew
lett
Pac
kard
450
0
56 d
ays
po
st
trea
tmen
t N
o
[5
6]
Ova
rian
an
d
mel
ano
ma
can
cer c
ells
Cel
l lin
es
Cis
pla
tin
Oxa
lipla
tin
Aci
d d
iges
tio
n
194 Pt
19
5 Pt
sum
med
Exte
rnal
cal
ibra
tio
n
Inte
rnal
sta
nd
ard
isat
ion
103 Rh
Perk
in-E
lmer
Sci
ex
ELA
N 6
000
NS
No
[69]
Plas
ma
pU
F
Uri
ne
Tiss
ue
Bird
s C
isp
lati
n
1:50
dilu
tio
n
1:10
0 d
iluti
on
1:50
dilu
tio
n
Aci
d d
iges
tio
n: d
iluti
on
195 Pt
Ex
tern
al c
alib
rati
on
in
mat
rix
Inte
rnal
sta
nd
ard
isat
ion
115 In
V
G E
lem
enta
l VG
Pl
asm
a Q
uad
Co
nce
ntr
ic n
ebu
liser
96 h
aft
er
star
t in
fusi
on
N
o
[1
52]
Plas
ma
pU
F
Uri
ne
Hu
man
BB
R346
4 1:
10 to
1:1
00 d
iluti
on
N
S Ex
tern
al c
alib
rati
on
in
mat
rix
N
S N
S 10
day
s af
ter
infu
sio
n
No
[81]
Tabl
e 1.
Con
tinue
d
Sam
ple
Sp
ecie
s C
om
po
un
d
Sam
ple
pre
par
atio
n
Iso
top
es
anal
ysed
C
alib
rati
on
tec
hn
iqu
e IS
Ty
pe
of i
nst
rum
ent
Sam
plin
g
per
iod
V
alid
atio
n
des
crib
ed
Rem
arks
R
ef.
Plas
ma
pU
F
Uri
ne
Hu
man
O
xalip
lati
n
1:10
0 d
iluti
on
1:30
dilu
tio
n
1:20
0 d
iluti
on
194 Pt
19
5 Pt
196 Pt
Exte
rnal
cal
ibra
tio
n
NS
Perk
in-E
lmer
ELA
N 6
000
Cro
ss fl
ow
neb
ulis
er
4 d
ays
po
st
do
se
No
[64]
Blo
od
Plas
ma
pP
pU
F
cyto
sol
mem
bra
ne
pre
par
atio
ns
Hu
man
Sa
trap
lati
n
1:25
dilu
tio
n
194 Pt
19
5 Pt
Exte
rnal
cal
ibra
tio
n
NS
Hew
lett
Pac
kard
450
0
V-g
roo
ve n
ebu
liser
NS
No
[82]
Plas
ma
pU
F
Uri
ne
Red
blo
od
cel
ls
Tiss
ue
Rat
Oxa
lipla
tin
1:
250
dilu
tio
n
1:60
dilu
tio
n
1:40
0 d
iluti
on
Aci
d d
iges
tio
n: d
iluti
on
Aci
d d
iges
tio
n: d
iluti
on
NS
Inte
rnal
sta
nd
ard
isat
ion
Ir
Pe
rkin
-Elm
er S
ciex
EL
AN
600
0
NS
Yes
[79]
Lun
g c
ance
r ce
lls
Cel
l lin
es
Cis
pla
tin
A
cid
dig
esti
on
: dilu
tio
n
NS
Exte
rnal
cal
ibra
tio
n
NS
Fiso
ns
Plas
ma
Qu
ad 2
tu
rbo
N
S N
o
[9
9]
Uri
ne
Seru
m
Lun
gs
Mic
rod
ialy
sate
s o
f tu
mo
ur t
issu
e
Hu
man
C
arb
op
lati
n
Aci
d d
iges
tio
n: d
iluti
on
Mir
cow
ave
dig
esti
on
: dilu
tio
n
Mir
cow
ave
dig
esti
on
: dilu
tio
n
1:54
dilu
tio
n
194 Pt
19
6 Pt
enri
ched
Exte
rnal
cal
ibra
tio
n in
w
ater
Inte
rnal
sta
nd
ard
isat
ion
IDM
S
115 In
18
7 Re
Elem
ent 1
Hig
h
reso
luti
on
ICP-
SFM
S
Mic
roco
nce
ntr
ic
neb
ulis
er
Ult
raso
nic
neb
ulis
er
4 h
po
st d
ose
[4
3]
pP
Do
rsal
roo
t g
ang
lia
Rats
O
xalip
lati
n
1:10
dilu
tio
n
Aci
d d
iges
tio
n: d
iluti
on
NS
Exte
rnal
cal
ibra
tio
n
NS
Hew
lett
Pac
kard
450
0
24 h
po
st
trea
tmen
t N
o
[1
53]
pP
Tum
ou
r tis
sue
Mic
e
Car
bo
pla
tin
D
iluti
on
Aci
d d
iges
tio
n: d
iluti
on
195 Pt
Ex
tern
al c
alib
rati
on
N
S A
gile
nt 4
500
V-g
roo
ve n
ebu
liser
NS
No
[92]
Ren
al tu
bu
lar
cells
Ra
bb
its
Cis
pla
tin
A
cid
dig
esti
on
N
S In
tern
al s
tan
dar
dis
atio
n
113 In
N
S N
S N
o
[1
54]
Blo
od
Uri
ne
Bile
Hu
man
C
isp
lati
n
1:20
dilu
tio
n
NS
NS
195 Pt
Ex
tern
al c
alib
rati
on
Inte
rnal
sta
nd
ard
isat
ion
103 Rh
A
gile
nt 7
500i
2
wee
ks p
ost
tr
eatm
ent
Yes
[155
]
Tabl
e 1.
Con
tinue
d
Sam
ple
Sp
ecie
s C
om
po
un
d
Sam
ple
pre
par
atio
n
Iso
top
es
anal
ysed
C
alib
rati
on
tec
hn
iqu
e IS
Ty
pe
of i
nst
rum
ent
Sam
plin
g
per
iod
V
alid
atio
n
des
crib
ed
Rem
arks
R
ef.
Plas
ma
pU
F
Tiss
ue
of 1
1 o
rgan
s
Bird
C
arb
op
lati
n
NS
NS
NS
NS
NS
96 h
aft
er s
tart
in
fusi
on
N
o
[1
56]
pU
F
NS
Cis
pla
tin
N
S N
S N
S N
S N
S 2
h p
ost
tr
eatm
ent
No
[157
]
Bre
ast
can
cer
cells
C
ell
lines
C
isp
lati
n
Oxa
lipla
tin
Car
bo
pla
tin
Plat
inu
m
com
ple
xes
Aci
d d
iges
tio
n
195 Pt
In
tern
al s
tan
dar
dis
atio
n
113 In
Th
erm
o O
pte
k X
5 Se
ries
48
h a
fter
sta
rt
incu
bat
ion
sa
mp
ling
No
[100
]
Plas
ma
pU
F
Uri
ne
Hu
man
Sa
trap
lati
n
1:30
dilu
tio
n
1:30
dilu
tio
n
1:50
dilu
tio
n
195 Pt
Exte
rnal
cal
ibra
tio
n in
m
atri
x
Inte
rnal
sta
nd
ard
isat
ion
193 Ir
Pe
rkin
-Elm
er S
ciex
EL
AN
500
0
14 d
ays
po
st
do
se
Yes
[90]
Do
rsal
roo
t g
ang
lia
Rats
C
isp
lati
n
Aci
d d
iges
tio
n
195 Pt
In
tern
al s
tan
dar
dis
atio
n
102 Rh
Pe
rkin
-Elm
er S
ciex
EL
AN
600
0 N
S N
o
[6
6]
Seru
m m
ice
Live
r, ki
dn
ey
Cel
ls
Mic
e C
isp
lati
n
2 p
oly
mer
s w
ith
cis
pla
tin
NS
NS
NS
NS
NS
15 m
in a
fter
ad
min
stra
tio
n
No
[158
]
Cel
l su
rfac
e
Cel
ls
Cu
ltu
re m
ediu
m
Jurk
at
cell
lines
Cis
pla
tin
an
d
cisp
lati
n
carb
on
ato
co
mp
lex
Aci
d d
iges
tio
n: d
iluti
on
NS
NS
NS
Perk
in-E
lmer
Sci
ex
ELA
N61
00
NA
N
o
[6
2]
Seru
m
pU
F
Peri
ton
eal l
iqu
id
Ova
rian
can
cer
cells
Hu
man
C
isp
lati
n
Car
bo
pla
tin
1:10
0 d
iluti
on
19
5 Pt
Exte
rnal
cal
ibra
tio
n in
m
atri
x
209 Bi
H
ewle
tt P
acka
rd 4
500
NA
Y
es
[1
59]
Mel
ano
ma
cells
M
ice
AP5
346
Aci
d d
iges
tio
n: d
iluti
on
N
S Ex
tern
al c
alib
rati
on
in 0
.5%
Tr
ito
n-X
in w
ater
Inte
rnal
sta
nd
ard
isat
ion
115 In
Th
erm
o F
inn
igan
El
emen
t 2 IC
P-M
S N
S N
o
[6
7]
Plas
ma
Tiss
ue
Rats
N
S N
S N
S Ex
tern
al c
alib
rati
on
in
mat
rix
NS
NS
7 d
ays
po
st
trea
tmen
t N
o
[1
60]
Tabl
e 1.
Con
tinue
d
Sam
ple
Sp
ecie
s C
om
po
un
d
Sam
ple
pre
par
atio
n
Iso
top
es
anal
ysed
C
alib
rati
on
tec
hn
iqu
e IS
Ty
pe
of i
nst
rum
ent
Sam
plin
g
per
iod
V
alid
atio
n
des
crib
ed
Rem
arks
R
ef.
pU
F
Hu
man
C
isp
lati
n
Oxa
lipla
tin
Car
bo
pla
tin
1:10
or 1
:100
dilu
tio
n
194 Pt
Exte
rnal
cal
ibra
tio
n in
m
atri
x
Inte
rnal
sta
nd
ard
isat
ion
191 Ir
V
aria
n 8
10-M
S
Mic
ro n
ebu
liser
3 w
eeks
po
st
do
se
Yes
[6]
Cel
l fra
ctio
ns
Cel
l lin
es
Cis
pla
tin
N
S 19
5 Pt
194 Pt
en
rich
ed
Exte
rnal
cal
ibra
tio
n in
m
atri
x
IDM
S
NS
Perk
in-E
lmer
Sci
ex
ELA
N 6
000
Flo
w in
ject
ion
an
alys
is
Pare
llel p
ath
neb
ulis
er
Mic
ron
ebu
liser
NA
Y
es
[7
5]
Cel
ls
Cel
l lin
e C
isp
lati
n
Satr
apla
tin
Aci
d d
iges
tio
n: d
iluti
on
NS
Inte
rnal
sta
nd
ard
isat
ion
11
3 In
Ther
mo
-Fin
nig
an
ELEM
ENT
II N
A
No
[101
]
Kid
ney
M
ice
Cis
pla
tin
Ti
ssu
e w
as s
liced
N
S Ex
tern
al c
alib
rati
on
in
mat
rix
NS
Elem
ent t
her
mo
el
ectr
on
ICP-
SFM
S
Co
up
led
to la
ser
abla
tio
n s
yste
m
1 h
aft
er
inje
ctio
n
Yes
[105
]
Plas
ma
pU
F
Uri
ne
Hu
man
N
AM
I-A
1:
10 to
1:1
00 d
iluti
on
10
1 Ru
Exte
rnal
cal
ibra
tio
n in
m
atri
x
Inte
rnal
sta
nd
ard
isat
ion
98Y
24
h a
fter
sta
rt
infu
sio
n
Yes
[39]
Jurk
at c
ells
H
um
an
Car
bo
pla
tin
A
cid
dig
esti
on
NS
NS
NS
NS
NA
N
o
[1
61]
Seru
m
Lun
g ti
ssu
e
Lun
g tu
mo
ur
tiss
ue
Rats
C
arb
op
lati
n
Aci
d d
iges
tio
n: d
iluti
on
195 Pt
NS
159 Tb
A
gile
nt 7
500c
e 12
0 m
in a
fter
st
art i
nfu
sio
n
No
[162
]
ICP-MS in oncology
35
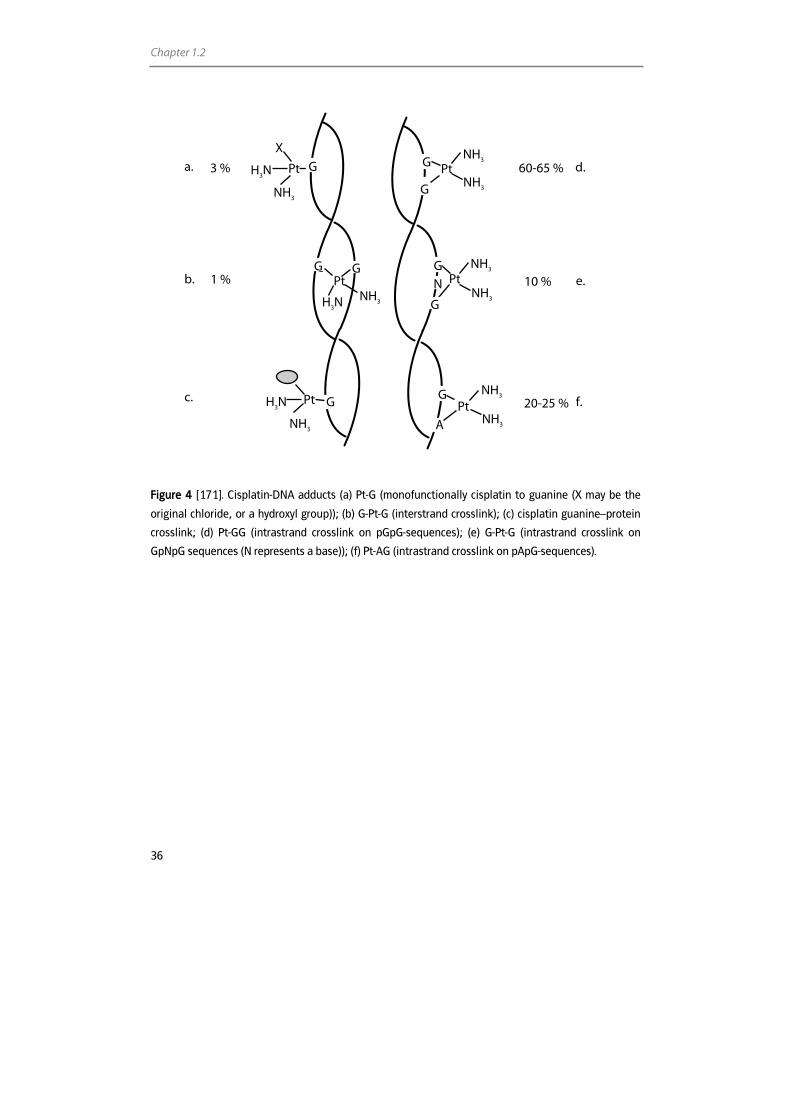
3.1.2 Metal-based anticancer agents bound to DNA
The mechanism of action of Pt compounds is still not completely understood. It is,
however, generally accepted that DNA platination is the ultimate event in the cytotoxic
activity of Pt anticancer agents. The hydrolysed products of the Pt compounds are
believed to primary attack the nucleophilic N7 positions from guanine (G) and adenine
(A) leading to the formation of monofunctional adducts and bifunctional intra- and
interstrand crosslinks [57,58] (Figure 4). The four major cisplatin-DNA adducts are: Pt-G
(monofunctionally bound cisplatin), Pt-GG (intrastrand crosslink on pGpG sequences),
Pt-AG (intrastrand crosslink on pApG sequences), and G-Pt-G (intrastrand crosslinks on
pG(pN)pG and interstrand crosslinks) [59,60]. Pt-GG and Pt-AG represent respectively 60-
65% and 20-25% of the total amount of adducts formed. platinum-DNA (Pt-DNA)
adducts affect the DNA replication and transcription and, thereby, inhibit tumour
growth. As a consequence, in addition to the analysis of Pt in biological fluids and cells,
the quantification of Pt-DNA adducts is of major interest. For cisplatin, only 1% of the Pt
molecules that enter the cells actually bind to nuclear DNA [61,62]. This issue illustrates
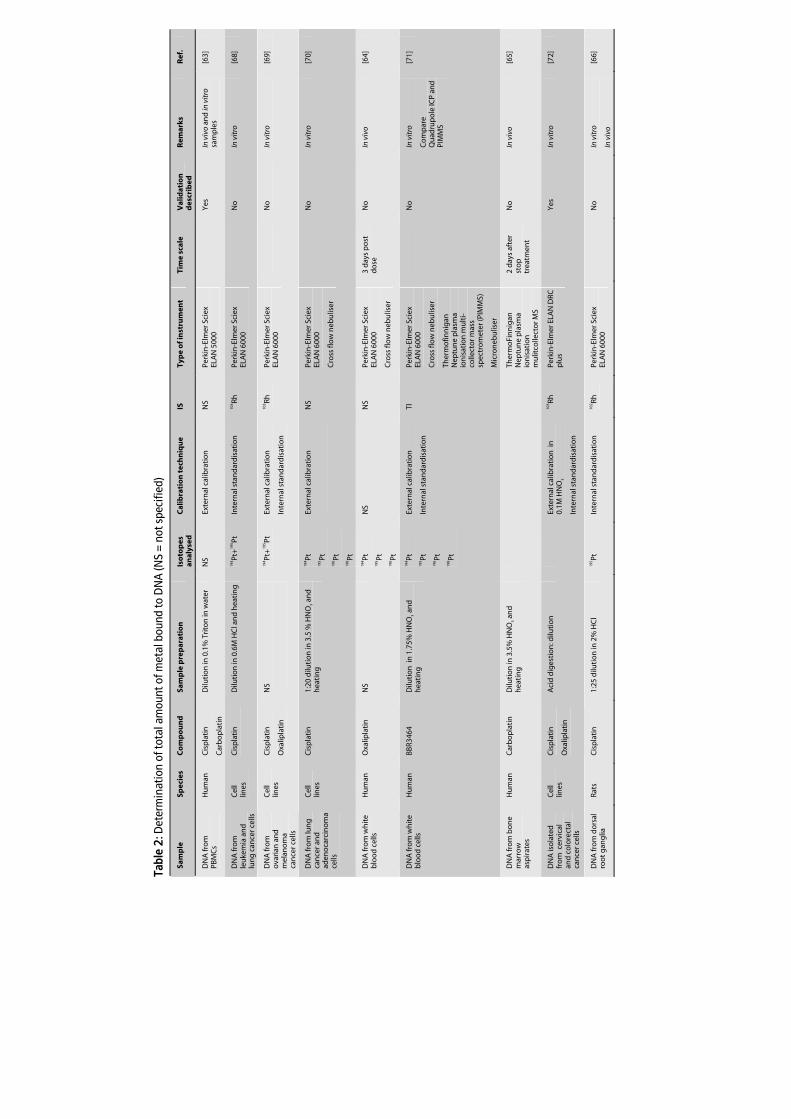
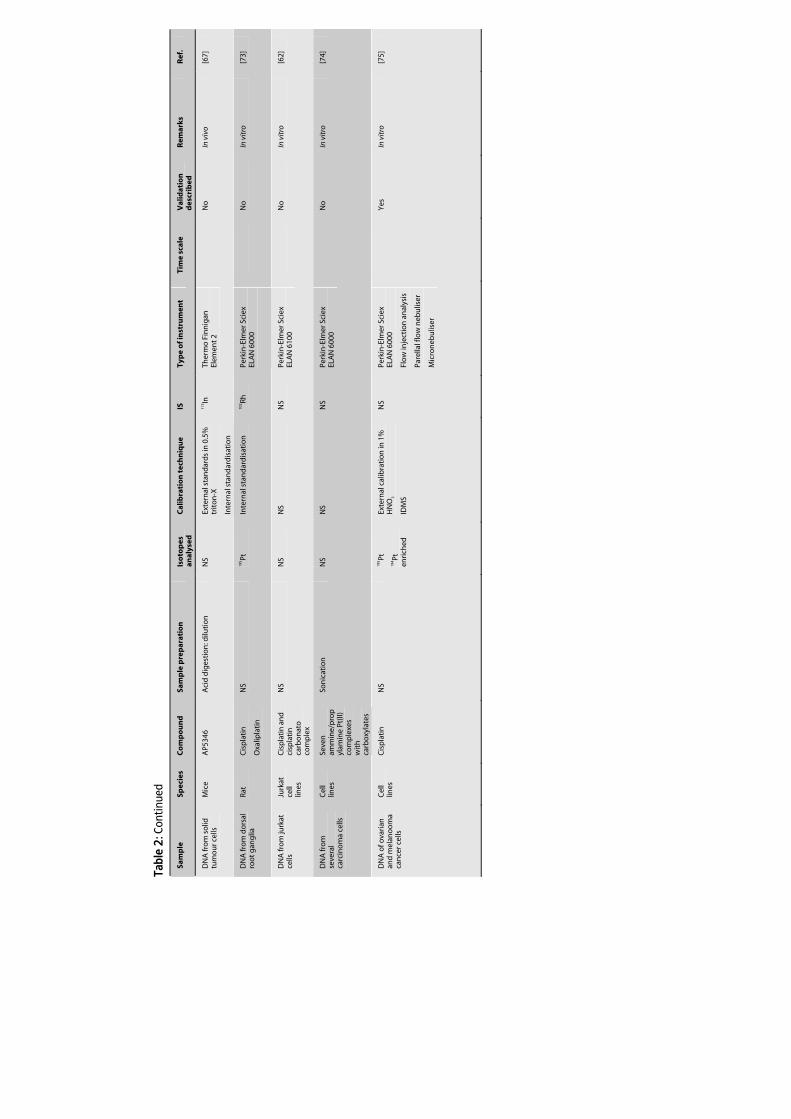
the need for sensitive techniques to quantify the level of Pt bound to DNA. The high
sensitivity of ICP-MS allows the determination of Pt-DNA adducts in a small number of
cells. Table 2 summarises literature in which ICP-MS was used for quantification of the
total amount of Pt-DNA adducts in peripheral blood mononuclear cells (PBMCs) or
tissues from patients [63-65] or rodents [66,67] after treatment with Pt agents. This Table
also summarises the quantification of Pt-DNA adducts in various cell types [62,66,68-75]
after in vitro incubation with Pt.
3.1.3 Metal-based anticancer agents in environmental samples
Another application of ICP-MS for the analysis of total Pt is the monitoring of personnel
working with Pt anticancer drugs and the monitoring of the contamination of
environments where these drugs are prepared and administered. Because Pt agents play
a major role in the treatment of cancer, large amounts of these agents are processed,
e.g. in hospital pharmacies. Considering the numerous publications regarding the
monitoring of the potential exposure of personnel, apparently, the potential health risks
for persons manipulating cytotoxic drugs are a concern. Another source of
contamination of the environment, which might effect the health of individuals is the
release of metal-based anticancer agents by hospitals into waste water. Considerable
portions of Pt drugs are eliminated via the patients urine [76] into the waste water. The
low concentrations present in biological samples from personnel and in environmental
samples such as surface wipes, air filters, and waste water, make ICP-MS to a commonly
used method for the quantification of Pt in these samples. Table 3 summarises the
literature published in this field.
Chapter 1.2
36
Figure 4 [171]. Cisplatin-DNA adducts (a) Pt-G (monofunctionally cisplatin to guanine (X may be the
original chloride, or a hydroxyl group)); (b) G-Pt-G (interstrand crosslink); (c) cisplatin guanine–protein
crosslink; (d) Pt-GG (intrastrand crosslink on pGpG-sequences); (e) G-Pt-G (intrastrand crosslink on
GpNpG sequences (N represents a base)); (f) Pt-AG (intrastrand crosslink on pApG-sequences).
60-65 %
1 % 10 %
3 %
20-25 %
Pt H3N
NH3
NH3
NH3
NH3
PtG
H3N
G
NH3
X
PtNH3
G
G
PtNH3 G
N
Pt
NH3
H3N G PtNH3 A
G
G
G
G
a.
b.
c.
d.
e.
f.
Tabl
e 2:
Det
erm
inat
ion
of to
tal a
mou
nt o
f met
al b
ound
to D
NA
(NS
= no
t spe
cifie
d)
Sam
ple
Sp
ecie
s C
om
po
un
d
Sam
ple
pre
par
atio
n
Iso
top
es
anal
ysed
C
alib
rati
on
tec
hn
iqu
e IS
Ty
pe
of i
nst
rum
ent
Tim
e sc
ale
Val
idat
ion
d
escr
ibed
R
emar
ks
Ref
.
DN
A fr
om
PB
MC
s H
um
an
Cis
pla
tin
Car
bo
pla
tin
Dilu
tio
n in
0.1
% T
rito
n in
wat
er
NS
Exte
rnal
cal
ibra
tio
n
NS
Perk
in-E
lmer
Sci
ex
ELA
N 5
000
Y
es
In v
ivo
and
in v
itro
sa
mp
les
[6
3]
DN
A fr
om
le
uke
mia
an
d
lun
g c
ance
r cel
ls
Cel
l lin
es
Cis
pla
tin
Dilu
tio
n in
0.6
M H
Cl a
nd
hea
tin
g
194 Pt
+19
5 Pt
Inte
rnal
sta
nd
ard
isat
ion
10
3 Rh
Perk
in-E
lmer
Sci
ex
ELA
N 6
000
N
o
In v
itro
[6
8]
DN
A fr
om
o
vari
an a
nd
m
elan
om
a ca
nce
r cel
ls
Cel
l lin
es
Cis
pla
tin
Oxa
lipla
tin
NS
194 Pt
+19
5 Pt
Exte
rnal
cal
ibra
tio
n
Inte
rnal
sta
nd
ard
isat
ion
103 Rh
Pe
rkin
-Elm
er S
ciex
EL
AN
600
0
No
In
vit
ro
[69]
DN
A fr
om
lun
g
can
cer a
nd
ad
eno
carc
ino
ma
cells
Cel
l lin
es
Cis
pla
tin
1:
20 d
iluti
on
in 3
.5 %
HN
O3 a
nd
h
eati
ng
194 Pt
19
5 Pt
196 Pt
19
8 Pt
Exte
rnal
cal
ibra
tio
n
NS
Perk
in-E
lmer
Sci
ex
ELA
N 6
000
Cro
ss fl
ow
neb
ulis
er
N
o
In v
itro
[7
0]
DN
A fr
om
wh
ite
blo
od
cel
ls
Hu
man
O
xalip
lati
n
NS
194 Pt
19
5 Pt
196 Pt
NS
NS
Perk
in-E
lmer
Sci
ex
ELA
N 6
000
Cro
ss fl
ow
neb
ulis
er
3 d
ays
po
st
do
se
No
In
viv
o [6
4]
DN
A fr
om
wh
ite
blo
od
cel
ls
Hu
man
BB
R346
4 D
iluti
on
in
1.7
5% H
NO
3 an
d
hea
tin
g
194 Pt
19
5 Pt
196 Pt
19
8 Pt
Exte
rnal
cal
ibra
tio
n
Inte
rnal
sta
nd
ard
isat
ion
Tl
Perk
in-E
lmer
Sci
ex
ELA
N 6
000
Cro
ss fl
ow
neb
ulis
er
Ther
mo
finn
igan
N
eptu
ne
pla
sma
ion
isat
ion
mu
lti-
colle
cto
r mas
s sp
ectr
om
eter
(PIM
MS)
Mic
ron
ebu
liser
No
In
vit
ro
Co
mp
are
Qu
adru
po
le IC
P an
d
PIM
MS
[71]
DN
A fr
om
bo
ne
mar
row
as
pir
ates
Hu
man
C
arb
op
lati
n
Dilu
tio
n in
3.5
% H
NO
3 an
d
hea
tin
g
Th
erm
oFi
nn
igan
N
eptu
ne
pla
sma
ion
isat
ion
m
ulit
colle
cto
r MS
2 d
ays
afte
r st
op
tr
eatm
ent
No
In
viv
o [6
5]
DN
A is
ola
ted
fr
om
cer
vica
l an
d c
olo
rect
al
can
cer c
ells
Cel
l lin
es
Cis
pla
tin
Oxa
lipla
tin
Aci
d d
iges
tio
n: d
iluti
on
Exte
rnal
cal
ibra
tio
n i
n
0.1M
HN
O3
Inte
rnal
sta
nd
ard
isat
ion
103 Rh
Pe
rkin
-Elm
er E
LAN
DRC
p
lus
Y
es
In v
itro
[7
2]
DN
A fr
om
do
rsal
ro
ot
gan
glia
Ra
ts
Cis
pla
tin
1:
25 d
iluti
on
in 2
% H
Cl
195 Pt
In
tern
al s
tan
dar
dis
atio
n
102 Rh
Perk
in-E
lmer
Sci
ex
ELA
N 6
000
N
o
In v
itro
In v
ivo
[66]
Tabl
e 2:
Con
tinue
d
Sam
ple
Sp
ecie
s C
om
po
un
d
Sam
ple
pre
par
atio
n
Iso
top
es
anal
ysed
C
alib
rati
on
tec
hn
iqu
e IS
Ty
pe
of i
nst
rum
ent
Tim
e sc
ale
Val
idat
ion
d
escr
ibed
R
emar
ks
Ref
.
DN
A fr
om
so
lid
tum
ou
r cel
ls
Mic
e A
P534
6 A
cid
dig
esti
on
: dilu
tio
n
NS
Exte
rnal
sta
nd
ard
s in
0.5
%
trit
on
-X
Inte
rnal
sta
nd
ard
isat
ion
115 In
Th
erm
o F
inn
igan
El
emen
t 2
N
o
In v
ivo
[67]
DN
A fr
om
do
rsal
ro
ot
gan
glia
Ra
t C
isp
lati
n
Oxa
lipla
tin
NS
195 Pt
In
tern
al s
tan
dar
dis
atio
n
102 Rh
Pe
rkin
-Elm
er S
ciex
EL
AN
600
0
N
o
In v
itro
[7
3]
DN
A fr
om
jurk
at
cells
Ju
rkat
ce
ll lin
es
Cis
pla
tin
an
d
cisp
lati
n
carb
on
ato
co
mp
lex
NS
NS
NS
N
S Pe
rkin
-Elm
er S
ciex
EL
AN
6100
No
In
vit
ro
[62]
DN
A fr
om
se
vera
l ca
rcin
om
a ce
lls
Cel
l lin
es
Seve
n
amm
ine/
pro
pyl
amin
e Pt
(II)
com
ple
xes
wit
h
carb
oxy
late
s
Son
icat
ion
N
S N
S N
S Pe
rkin
-Elm
er S
ciex
EL
AN
600
0
No
In
vit
ro
[74]
DN
A o
f ova
rian
an
d m
elan
oo
ma
can
cer c
ells
Cel
l lin
es
Cis
pla
tin
N
S 19
5 Pt
194 Pt
en
rich
ed
Exte
rnal
cal
ibra
tio
n in
1%
H
NO
3
IDM
S
NS
Perk
in-E
lmer
Sci
ex
ELA
N 6
000
Flo
w in
ject
ion
an
alys
is
Pare
llal f
low
neb
ulis
er
Mic
ron
ebu
liser
Y
es
In v
itro
[7
5]
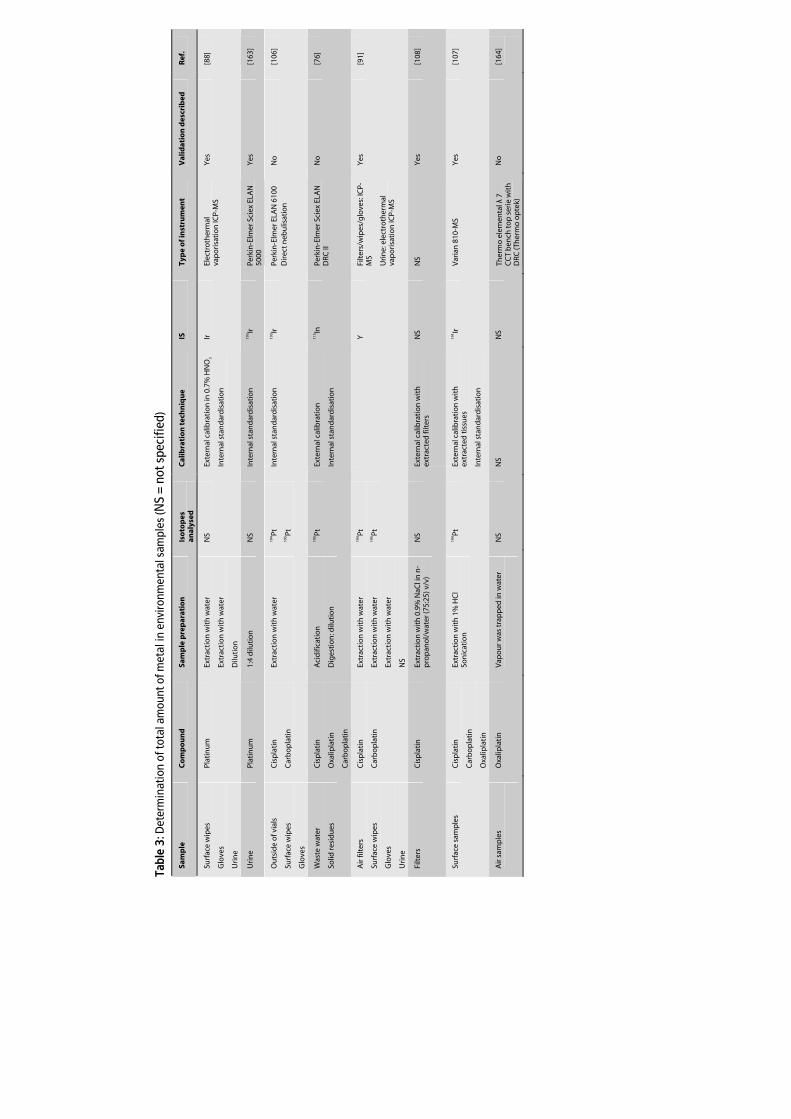
Tabl
e 3:
Det
erm
inat
ion
of to
tal a
mou
nt o
f met
al in
env
ironm
enta
l sam
ples
(NS
= no
t spe
cifie
d)
Sam
ple
C
om
po
un
d
Sam
ple
pre
par
atio
n
Iso
top
es
anal
ysed
C
alib
rati
on
tec
hn
iqu
e IS
Ty
pe
of i
nst
rum
ent
Val
idat
ion
des
crib
ed
Ref
.
Surf
ace
wip
es
Glo
ves
Uri
ne
Plat
inu
m
Extr
acti
on
wit
h w
ater
Extr
acti
on
wit
h w
ater
Dilu
tio
n
NS
Exte
rnal
cal
ibra
tio
n in
0.7
% H
NO
3
Inte
rnal
sta
nd
ard
isat
ion
Ir
Elec
tro
ther
mal
va
po
risa
tio
n IC
P-M
S Y
es
[88]
Uri
ne
Plat
inu
m
1:4
dilu
tio
n
NS
Inte
rnal
sta
nd
ard
isat
ion
19
3 Ir
Perk
in-E
lmer
Sci
ex E
LAN
50
00
Yes
[1
63]
Ou
tsid
e o
f via
ls
Surf
ace
wip
es
Glo
ves
Cis
pla
tin
Car
bo
pla
tin
Extr
acti
on
wit
h w
ater
194 Pt
19
5 Pt
Inte
rnal
sta
nd
ard
isat
ion
19
3 Ir
Perk
in-E
lmer
ELA
N 6
100
Dir
ect n
ebu
lisat
ion
No
[1
06]
Was
te w
ater
Solid
resi
du
es
Cis
pla
tin
Oxa
lipla
tin
Car
bo
pla
tin
Aci
difi
cati
on
Dig
esti
on
: dilu
tio
n
195 Pt
Ex
tern
al c
alib
rati
on
Inte
rnal
sta
nd
ard
isat
ion
115 In
Pe
rkin
-Elm
er S
ciex
ELA
N
DRC
II
No
[7
6]
Air
filt
ers
Surf
ace
wip
es
Glo
ves
Uri
ne
Cis
pla
tin
Car
bo
pla
tin
Extr
acti
on
wit
h w
ater
Extr
acti
on
wit
h w
ater
Extr
acti
on
wit
h w
ater
NS
194 Pt
19
5 Pt
Y
Filt
ers/
wip
es/g
love
s: IC
P-M
S
Uri
ne:
ele
ctro
ther
mal
va
po
risa
tio
n IC
P-M
S
Yes
[9
1]
Filt
ers
Cis
pla
tin
Ex
trac
tio
n w
ith
0.9
% N
aCl i
n n
-p
rop
ano
l/w
ater
(75:
25) v
/v)
NS
Exte
rnal
cal
ibra
tio
n w
ith
ex
trac
ted
filt
ers
NS
NS
Yes
[1
08]
Surf
ace
sam
ple
s C
isp
lati
n
Car
bo
pla
tin
Oxa
lipla
tin
Extr
acti
on
wit
h 1
% H
Cl
Son
icat
ion
194 Pt
Ex
tern
al c
alib
rati
on
wit
h
extr
acte
d t
issu
es
Inte
rnal
sta
nd
ard
isat
ion
191 Ir
V
aria
n 8
10-M
S Y
es
[107
]
Air
sam
ple
s
Oxa
lipla
tin
V
apo
ur w
as t
rap
ped
in w
ater
NS
NS
NS
Ther
mo
ele
men
tal λ
7
CC
T b
ench
to
p s
erie
wit
h
DRC
(Th
erm
o o
pte
k)
No
[1
64]
Chapter 1.2
40
3.2 Assay development
For ICP-MS analysis, biological samples cannot be analysed directly, but require a
pretreatment to reduce the matrix effects of endogenous compounds, such as cell
constituents, proteins, salts, and lipids. The development of ICP-MS methods for metals
in biological matrices is generally focused on the selection of an appropriate sample
pretreatment and the selection of calibration procedures to avoid and compensate matrix
effects. Additionally, instrumental modifications can be used to further optimise the
assay. For the analysis of low concentrations of metal it is important to consider that,
whatever sample pretreatment procedure is used, special care has to be taken to avoid
contamination of samples. A careful selection of pretreatment devices and reagents
should be performed. Glassware should be avoided as it may contain considerable
amounts of Pt. Moreover, sample pretreatment needs to be performed in a dedicated
area to prevent environmental Pt or Ru originating from e.g. pollution by car exhaust
catalysts [77], from interfering with the analysis.
3.2.1 Sample pretreatment
3.2.1.1 Metal-based anticancer agents in biological fluids/cells
As was mentioned before, the direct determination of metals in biological matrices is
problematic. High protein contents can easily block the nebuliser and torch and deposit
on the cones and thereby affect the performance of the method. The most commonly
used pretreatment method for liquid biological samples is dilution. This method is
employed in order to lower the concentration of dissolved solids. For the analysis of Pt
and Ru in liquid biological samples, dilution with water [64,78-82], diluted HCl [29],
diluted HNO3 [6,39,83-92], and reagents such as a mixture of edta diammonium salt and
Triton X-100 in water [39,56,93] have been frequently used to reduce the solid content
below the for ICP-MS required 0.2% (g/v) [94]. Dilution factors are a compromise
between a minimum sample dilution to assure low quantification limits and a maximum
reduction of total dissolved solid content. A simple dilution, however, could be
problematic in samples with high protein contents such as whole blood, plasma, or
serum because the acids present in most ICP-MS diluents might precipitate proteins
which may clog up the nebuliser. Another possibility to reduce the matrix effects is by
protein precipitation. Using this method, however, protein-bound elements such as Pt,
will not be analysed which can be an undesired effect.
Although various studies used dilution as sample pretreatment procedure for protein
containing fluids without reporting precipitation problems, Tothill et al. showed that
addition of a small amount of acid to plasma which was diluted with water resulted in
protein precipitation [29]. Hence, instead of dilution, several applications based their
ICP-MS in oncology
41
pretreatment on acid digestion where after, prior to analysis, samples were diluted with
a proper diluent. In bioanalysis of metal-based anticancer drugs, there are several
methods commonly used for digestion. In general, the sample is heated with several
combinations of concentrated acids. Tothill et al. digested plasma by using 70% HNO3
(v/v) and heated the mixture at 100 °C until dryness [29]. Another study used a similar
procedure for the digestion of whole blood and plasma [87]. Nygren et al digested
samples by dry ashing and wet ashing [9]. For the first procedure, a combination of
concentrated HNO3 and HCl (aqua regia), and temperatures up to 800 °C were used to
obtain a dried and ashed sample. For wet ashing, the samples were heated with
concentrated acids (HNO3/HClO4) resulting in a solution of ashed sample and acid. The
methods were in agreement, indicating that no sample was lost due to volatility after
dry ashing. An open vessel wet ashing procedure (HNO3/H2O2/HCl) was used in another
study to digest urine [43]. HCl was used to provide chloro-complexes of Pt and thereby
reduce the memory effects in the sample introduction system that were observed when
diluting in 1% HNO3 (v/v). A more aggressive microwave digestion procedure was used
for serum using concentrated HNO3 in combination with elevated pressure and
temperature levels [95]. The authors used digestion with subsequent dilution instead of
a simple dilution because the total dilution factor was reduced by using the first method.
The pretreatment of tissue samples always includes digestion followed by dilution. The
digestion procedure can be performed in several ways, varying from heating at high
temperatures in concentrated HNO3 [29,53,56,62,66,67,92,96-101] to more complex
procedures such as digestion with concentrated HNO3 and 30% H2O2 [55,69] at elevated
temperatures or microwave digestion with HNO3, H2O2, and HCl [43]. Perry et al.
compared the digestion of cells with sodium hydroxide with the sonication of cells
followed by digestion with concentrated HNO3 [102]. Digestion with sodium hydroxide,
however, was not adequate because it resulted in significant signal suppression. The
addition of 0.9% (g/v) sodium chloride to the cell lines, with subsequent incubation of
the suspension in a vacuum oven at 120 °C also appeared to be an appropriate digestion
technique for cells [103,104], indicating that the addition of acid is not a requisite. The
matrix effect of the high level of dissolved sodium chloride was reduced by dilution with
water. An alternative for digestion of solid biological samples is the use of laser ablation
ICP-MS (LA-ICP-MS), which can directly analyse solid samples, requiring no further
sample pretreatment. Kidney sections from mice were analysed for Pt distribution using
this technique [105]. The advantage of this technique is that information can be
obtained on the distribution of metal among the tissue. The use of this technique,
however, requires the availability of an advanced laser ablation system, which is not
present in most clinical laboratories.
Chapter 1.2
42
3.2.1.2 Metal-based anticancer agents bound to DNA
The analysis of Pt in DNA samples is preceded by the isolation of DNA from PBMCs or
tissue samples. For this purpose, commercially DNA kits are available. However, instead
of using commercially available DNA kits, a standard isolation procedure can also be
used. In general, cells are washed with phosphate buffered saline, suspended in a buffer
containing Tris-HCl, NaCl, and edta disodium salt, and lysed with sodium dodecylsulfate
and protease. After removing the proteins, the DNA is ethanol or isopropanol
precipitated, where after it is dissolved in a water containing diluent. Subsequently, in
some applications, samples were diluted with triton in water [63] or with a HCl solution
[66] and analysed directly. Others diluted samples in a HCl [68] or HNO3 [65,70,71]
solution and heated it prior to analysis. A more extensive wet digestion procedure with
concentrated HNO3 and overnight heating was performed by Rice et al. [67]. Yamada et
al. digested DNA with concentrated HNO3 and 30% H2O2 [72]. Zhang et al. have described
an assay for which the DNA was sonicated prior to analysis [74]. To decide which
technique is suitable, experiments which assess the matrix effect and recovery of the
metals from the resulting solution should be performed. The lack of certified reference
compounds makes a proper validation difficult. Even though, Yamada et al.
demonstrated that matrix effects of various amounts of DNA did not effect Pt
quantification. None of the other studies described validation procedures.
3.2.1.3 Metal-based anticancer agents in environmental samples
Processing of environmental samples such as surface wipes is focused on the ability to
remove all the Pt present on the surface and on the efficiency to extract all the Pt from
the swab. In most assays, swabs were wetted with a diluent such as 30 mM NaOH
[88,91,106] or water [106,107] which was then used to wipe the surface. Subsequently, Pt
was extracted from the swab with water [88,91,106] or diluted HCl [107] under,
respectively, constant mixing or sonication. Extraction efficiencies of Pt from the swabs
were assessed in all studies and were higher than 87%. Only one study reported the
actual Pt recovery from the spiked surface, which exceeded 50% for all Pt compounds
tested [107]. The extraction of Pt from gloves was done using water [88,91,106], leading
to Pt recoveries of 67%. Air filters, which were used in a demistifier [108] and in a clean
room [91], were extracted with respectively 0.9% NaCl in a n-propanol water mixture
(75:25 v/v) and water.
ICP-MS in oncology
43
3.2.2 Calibration
In addition to an adequate pretreatment procedure, the calibration method should be
optimised during the development of a reliable ICP-MS assay. In general, calibration
procedures are focused on the compensation of matrix effects. As mentioned before, a
frequently applied method to circumvent matrix interference problems is internal
standardisation. An IS can be used to normalise the analyte signal and thereby correct
for matrix effects and instrumental signal drifts. It was shown that to correct
appropriately for non-spectral matrix effects, the mass number and ionisation potential
of the IS should be close to that of the analyte [35,109,110]. For the analysis of Pt,
internal standardisation is the most commonly used method to overcome matrix
interferences. Several IS are described for Pt in literature. In order of decreasing
popularity the following IS are used: iridium (191Ir or 193Ir, IP1; 9.1), indium (113In or 115In, IP1;
5.8), europium (153Eu, IP1; 5.7), bismuth (203Bi, IP1; 7.3), gold (197Au, IP1; 9.2), thallium (203Tl,
IP1; 6.1), rhodium (103Rh, IP1; 7.5), and rhenium (187Re, IP1; 7.9). Considering the mass and
first ionisation potential of Pt (195Pt, IP1; 9.0), iridium and gold seem to be the most
adequate ISs. Gold, however, tends to suffer from severe memory effects [83].
Furthermore, Tothill et al. encountered differences in chemistry between gold and Pt
[29]. These issues point out that gold is a less suitable IS than iridium. Even though the
resemblance between Pt and the IS is mentioned all over in literature, the frequent use
of indium suggests that stable results are achieved using this IS and that a deviating
mass and ionisation potential is not always critical. Ding et al. compared several ISs for
the quantification of Pt in cells [55]. They, however, concluded that indium did not
properly correct for matrix effects leading to a Pt recovery of 87-92% in the reliable
quantification range. Iridium and bismuth, in contrast, did show acceptable results (101-
108%). Hann et al. showed that rhenium and indium did not correct for matrix
suppression of Pt in digested urine [43]. The inconsistent results point out that, when
developing a new assay, it is advisable to test several ISs for each matrix. For the analysis
of Ru (IP: 7.4), yttrium (98Y, IP; 6.4) and germanium (72Ge, IP; 7.9) have been used as IS
[39,111]. They both corrected well for matrix effects.
Internal standardisation is often used in combination with external calibration,
preferably with matrix matched calibration standards. In addition to spiking the analyte
in the biological matrix [6,39,87,90,105] some authors use alternative matrices
containing the major components of the biological matrix, such as saline solutions
[9,86,112] and artificial plasma [84]. Others use calibrants in water [43] or in diluted acid
[55,56,72,83,103,104]. When significant matrix effects are observed in the samples, it is,
however, advisable to use matrix matched standards instead of solely water or diluted
acid. An alternative method for external standardisation is standard addition, whereby
the standard is added to the sample at multiple levels. The advantage is that the spiked
sample undergoes the same matrix effect as the analyte present in the unknown sample.
Chapter 1.2
44
The disadvantage is that a large amount of sample is needed and that the method is
time consuming. Perry et al. used this method for the determination of Pt in cell lines
[102]. Unfortunately, no validation results were shown. Yamada et al. obtained
equivalent results for external standardisation in diluted acid and standard addition for
the determination of DNA-bound Pt [72]. A last solution to overcome the matrix effects
is the isotope dilution mass spectrometry (IDMS) technique. With this technique, the
sample is spiked with an enriched isotope of the element of interest. The analysis of
isotope ratios in the unspiked and spiked sample, as well as in the spike itself, lead to the
quantification of the analyte. Hann et al. compared IDMS with enriched 196Pt to external
quantification with aqueous standards and standard addition for the analysis of three Pt
levels in urine [43]. Quantification with external calibrants revealed incorrect results for
all spiked levels, regardless whether internal standardisation with rhenium or indium
was used or not. This could be due to the aqueous matrix used for calibration that might
have resulted in different matrix effects of calibrants and samples. Standard addition was
only found to be suitable for samples spiked at higher levels, whereas IDMS resulted in a
correct quantification of all levels.
3.2.3 Instrumental adjustments
The majority of instruments used in the determination of the total amount of metals
originating from anticancer agents in biological matrices are quadrupole based
instruments. Few applications used double focussing ICP-MS for Pt analysis
[43,65,71,105]. Hann et al. examined that for digested serum and microdialysates, the
low and high resolution mode resulted in similar concentrations [43]. This indicates that
in these two matrices, no spectral interferes were present and that the use of the high
resolution mode in routine analysis was not required. John et al. compared a double
focussing ICP-MS with a quadrupole ICP-MS for the determination of Pt bound to DNA
[71]. The problem of oxide interference was minor for the quadrupole ICP-MS because
oxide formation was low. For the double focussing ICP-MS, however, oxide formation
was higher (>5%) leading to a higher contribution of hafnium interferences to the Pt
signal. The double focussing ICP-MS was more sensitive than the quadrupole
instrument. Analysis times for the first instrument, on the other hand, were significantly
longer.
In addition to the mass spectrometer, the type of sample introduction system can also
greatly affect the sensitivity of the instrument. Furthermore, it can determine the
amount of sample needed. Conventional pneumatic nebulisers (concentric or cross
flow), which are often used for Pt or Ru analysis [9,64,70,71,78,84,85,102] operate at a
flow rate of 0.5-1 ml/min [113]. The high flow rate in combination with the time required
to carry out a complete signal reading (1-5 min), requires a high sample volume (>1 mL).
ICP-MS in oncology
45
Obviously, this volume is much larger than the available sample volume in many clinical
applications. Therefore, undigested samples need to be diluted with a large volume of
diluent, which reduced the detection limit of the method. In addition to this limitation,
the transport efficiency of common sample introduction systems is low. With common
pneumatic nebulisers, only about 1% of the total sample volume is actually transported
into the plasma [30]. To surmount these issues, specially designed systems (micro
nebulisers) have been developed [75], which operate at low sample uptake rates (0.1-0.2
ml/min) and thereby only use a limited sample volume. In addition, ultrasonic nebulisers
have been developed, which have a high efficiency, independent of the gas flow. Thus
more analyte can be transported to the ICP resulting in lower detection limits. A 25-fold
improve of the detection limit for ultrasonic nebulisation (USN) compared to standard
concentric nebulisation was observed by Morrison et al for the determination of Pt in
pUF. USN was also used by Turci et al. [89]. Hann et al. tested two introduction systems,
USN and micro concentric nebulisation (MCN), for the determination of Pt in urine [43].
USN and MCN revealed signal intensities in the same range, probably because of
reduced nebulisation efficiency of the USN due to matrix effects of the digested urine
sample. LODs for USN were slightly better than for MCN. MCN based nebulisers were
also applied by Brouwers et al. and John et al. [6,39,71]. An alternative method for
continuous sample introduction is flow injection analysis (FIA) [55], in which a discrete
sample volume is injected into a continuously flowing carrier stream. A tenfold
improvement of the detection limit was observed compared to continuous nebulisation
because no sample dilution was needed using FIA. Another method to decrease the
required sample volume and increase the transport efficiency is electrothermal
vaporisation (ETV) [88,91]. The sample is deposited into an electrically conductive
vaporisation cell where the sample is dried and vaporised. An argon gas flow
subsequently carries the sample vapour to the plasma.
4 Analytical ICP-MS assays: speciation of metal-based anticancer
agents
4.1 Application assays
Because of the complex nature of Pt and Ru solution chemistry and the lack of suitable
certified reference materials to identify the species, often, no priority was given to the
speciation of the compounds in clinical samples. However, in addition to the
determination of total metal concentrations, the determination of the parent metal
compounds and their metabolites is valuable. Besides, the speciation of metal
compounds can be applied to investigate the metabolism of the compounds in the
Chapter 1.2
46
body and to characterise adducts of the metals with endogenous species, such as
proteins and DNA, to improve knowledge on the mechanism of action of metal-based
anticancer agents. Furthermore, it may be used to study the stability of metal-based
anticancer agents. In environmental samples, speciation can be practical to study the
composition of the molecules in e.g. surface samples and waste water. While most of the
work has involved the speciation of cisplatin and cisplatin-adducts, oxaliplatin,
carboplatin, satraplatin, ormaplatin, ZD0473, BBR3464, and the Ru compounds NAMI-A
and KP1019 have received attention too.
4.1.1 Speciation of metal-based compounds and metabolites
After administration of Pt drugs, Pt compounds rapidly form a variety of reactive
intermediates in the blood stream, including hydrolysed products. Speciation analysis of
these intermediates is gaining interest. Methods applying ICP-MS have been developed
for the speciation and quantification of the parent drugs and metabolites of cisplatin
[114,115], BBR3463 [116], satraplatin [82,117-119], oxaliplatin [120], and ZD0473 [26] in
matrices such as whole blood, red blood cells, plasma, pUF, pP, and urine. A summary of
the assays is presented in Table 4. In addition to the investigation and quantification of
the individual Pt agents and their metabolites, speciation analysis with ICP-MS detection
has been used to assess the hydrofobicity of several Pt compounds [56].
4.1.2 Speciation of reaction products of metal-based anticancer compounds with
DNA and proteins
As mentioned before, it is generally accepted that DNA platination is the ultimate event
in the cytotoxic mechanism of action of Pt anticancer agents. Speciation of the various
Pt-DNA adducts formed can be used to gain more insight into the exact cytotoxic
mechanism of Pt compounds. Pt-DNA adducts, however, are not the only reaction
products of Pt compounds that are interesting to study. Before Pt compounds can bind
to DNA, they must pass from the blood through the cytosol of the cell. Reactive Pt
complexes can bind to various constituents in the blood or in cells. Among the potential
Pt-binding sites are proteins and other compounds containing thiol donor ligands such
as cysteine, glutathione, and methionine [61,121]. The exact role that Pt binding to
proteins such as albumin and transferrin plays in the mechanism of drug action, remains
unclear. Interactions with proteins, however, might play an important role in drug
efficacy and side effects [122]. Methionine is important because of its large
concentrations and reactivity. There is evidence that the nephrotoxicity of cisplatin is
increased in the presence of its reaction products with methionine [123]. Glutathione is
believed to be involved in the cellular detoxification of Pt compounds. There is an
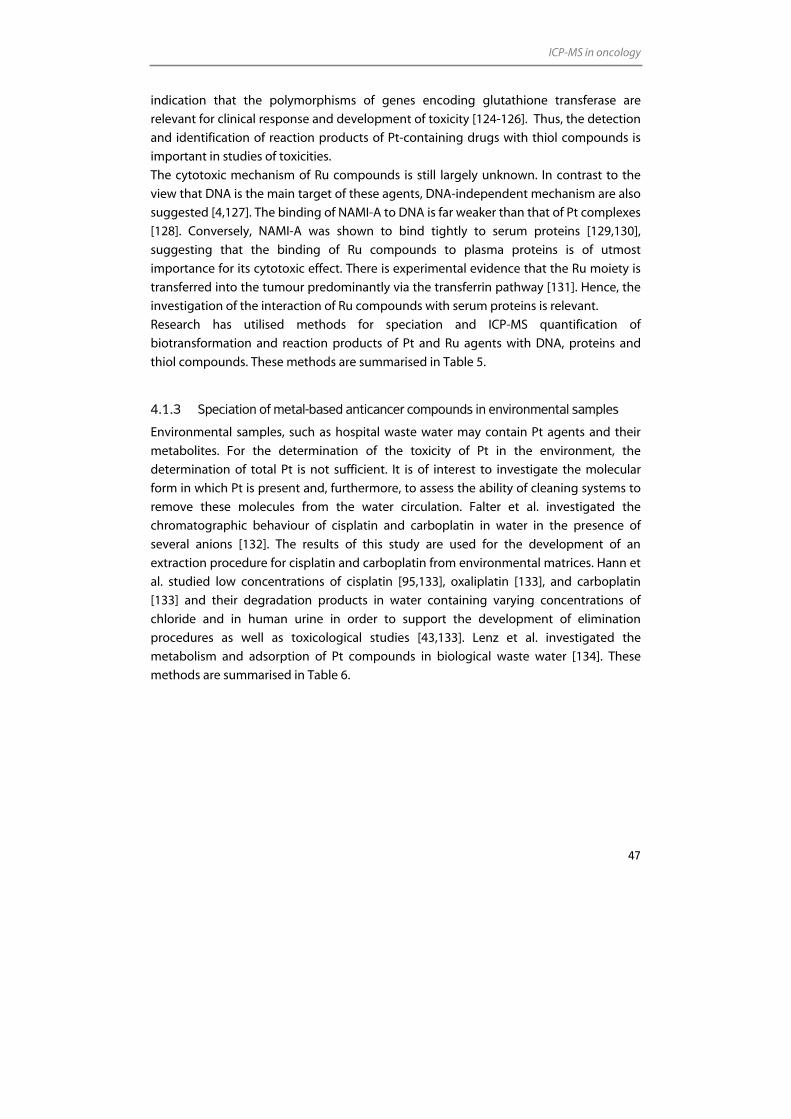
ICP-MS in oncology
47
indication that the polymorphisms of genes encoding glutathione transferase are
relevant for clinical response and development of toxicity [124-126]. Thus, the detection
and identification of reaction products of Pt-containing drugs with thiol compounds is
important in studies of toxicities.
The cytotoxic mechanism of Ru compounds is still largely unknown. In contrast to the
view that DNA is the main target of these agents, DNA-independent mechanism are also
suggested [4,127]. The binding of NAMI-A to DNA is far weaker than that of Pt complexes
[128]. Conversely, NAMI-A was shown to bind tightly to serum proteins [129,130],
suggesting that the binding of Ru compounds to plasma proteins is of utmost
importance for its cytotoxic effect. There is experimental evidence that the Ru moiety is
transferred into the tumour predominantly via the transferrin pathway [131]. Hence, the
investigation of the interaction of Ru compounds with serum proteins is relevant.
Research has utilised methods for speciation and ICP-MS quantification of
biotransformation and reaction products of Pt and Ru agents with DNA, proteins and
thiol compounds. These methods are summarised in Table 5.
4.1.3 Speciation of metal-based anticancer compounds in environmental samples
Environmental samples, such as hospital waste water may contain Pt agents and their
metabolites. For the determination of the toxicity of Pt in the environment, the
determination of total Pt is not sufficient. It is of interest to investigate the molecular
form in which Pt is present and, furthermore, to assess the ability of cleaning systems to
remove these molecules from the water circulation. Falter et al. investigated the
chromatographic behaviour of cisplatin and carboplatin in water in the presence of
several anions [132]. The results of this study are used for the development of an
extraction procedure for cisplatin and carboplatin from environmental matrices. Hann et
al. studied low concentrations of cisplatin [95,133], oxaliplatin [133], and carboplatin
[133] and their degradation products in water containing varying concentrations of
chloride and in human urine in order to support the development of elimination
procedures as well as toxicological studies [43,133]. Lenz et al. investigated the
metabolism and adsorption of Pt compounds in biological waste water [134]. These
methods are summarised in Table 6.
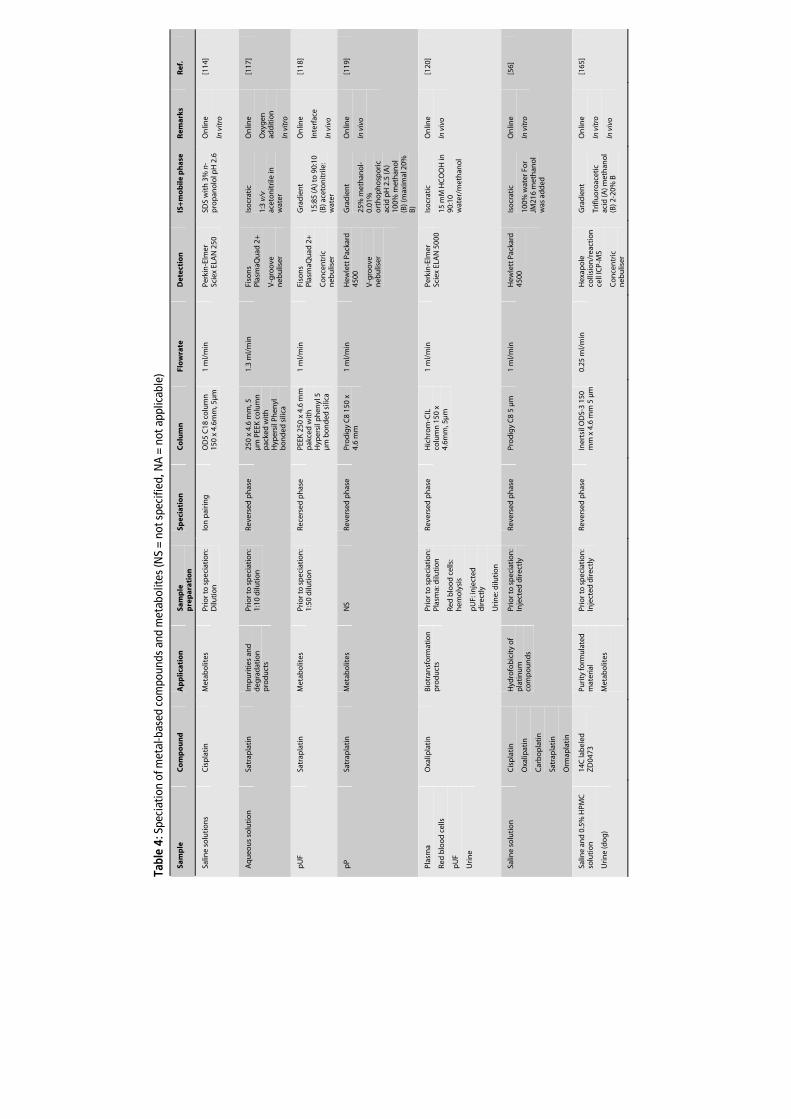
Tabl
e 4:
Spe
ciat
ion
of m
etal
-bas
ed c
ompo
unds
and
met
abol
ites
(NS
= no
t spe
cifie
d, N
A =
not
app
licab
le)
Sam
ple
C
om
po
un
d
Ap
plic
atio
n
Sam
ple
p
rep
arat
ion
Sp
ecia
tio
n
Co
lum
n
Flo
wra
te
Det
ecti
on
IS
+m
ob
ile p
has
e R
emar
ks
Ref
.
Salin
e so
luti
on
s C
isp
lati
n
Met
abo
lites
Pr
ior t
o s
pec
iati
on
: D
iluti
on
Io
n p
airi
ng
O
D5
C18
co
lum
n
150
x 4.
6mm
, 5µ
m
1 m
l/m
in
Perk
in-E
lmer
Sc
iex
ELA
N 2
50
SDS
wit
h 3
% n
-p
rop
ano
lol p
H 2
.6
On
line
In v
itro
[114
]
Aq
ueo
us
solu
tio
n
Satr
apla
tin
Im
pu
riti
es a
nd
d
egra
dat
ion
p
rod
uct
s
Prio
r to
sp
ecia
tio
n:
1:10
dilu
tio
n
Reve
rsed
ph
ase
250
x 4.
6 m
m, 5
µ
m P
EEK
co
lum
n
pac
ked
wit
h
Hyp
ersi
l Ph
enyl
b
on
ded
sili
ca
1.3
ml/
min
Fi
son
s Pl
asm
aQu
ad 2
+
V-g
roo
ve
neb
ulis
er
Iso
crat
ic
1:3
v/v
acet
on
itri
le in
w
ater
On
line
Oxy
gen
ad
dit
ion
In v
itro
[117
]
pU
F
Satr
apla
tin
M
etab
olit
es
Prio
r to
sp
ecia
tio
n:
1:50
dilu
tio
n
Rece
rsed
ph
ase
PEEK
250
x 4
.6 m
m
pak
ced
wit
h
Hyp
ersi
l ph
enyl
5
µm
bo
nd
ed s
ilica
1 m
l/m
in
Fiso
ns
Plas
maQ
uad
2+
Co
nce
ntr
ic
neb
ulis
er
Gra
die
nt
15:8
5 (A
) to
90:
10
(B) a
ceto
nit
rile
: w
ater
On
line
Inte
rfac
e
In v
ivo
[118
]
pP
Sa
trap
lati
n
Met
abo
lites
N
S Re
vers
ed p
has
e Pr
od
igy
C8
150
x 4.
6 m
m
1 m
l/m
in
Hew
lett
Pac
kard
45
00
V-g
roo
ve
neb
ulis
er
Gra
die
nt
25%
met
han
ol-
0.01
%
ort
ho
ph
osp
oric
ac
id p
H 2
.5 (A
) 10
0% m
eth
ano
l (B
) (m
axim
al 2
0%
B)
On
line
In v
ivo
[119
]
Plas
ma
Red
blo
od
cel
ls
pU
F
Uri
ne
Oxa
lipla
tin
B
iotr
ansf
orm
atio
n
pro
du
cts
Pr
ior t
o s
pec
iati
on
: Pl
asm
a: d
iluti
on
Red
blo
od
cel
ls:
hem
oly
sis
pU
F: in
ject
ed
dir
ectl
y
Uri
ne:
dilu
tio
n
Reve
rsed
ph
ase
Hic
hro
m-C
IL
colu
mn
150
x
4.6m
m, 5
µm
1 m
l/m
in
Perk
in-E
lmer
Sc
iex
ELA
N 5
000
Iso
crat
ic
15 m
M H
CO
OH
in
90:1
0 w
ater
/met
han
ol
On
line
In v
ivo
[120
]
Salin
e so
luti
on
C
isp
lati
n
Oxa
lipat
in
Car
bo
pla
tin
Satr
apla
tin
Orm
apla
tin
Hyd
rofo
bic
ity
of
pla
tin
um
co
mp
ou
nd
s
Prio
r to
sp
ecia
tio
n:
Inje
cted
dir
ectl
y Re
vers
ed p
has
e Pr
od
igy
C8
5 µ
m
1 m
l/m
in
Hew
lett
Pac
kard
45
00
Iso
crat
ic
100%
wat
er F
or
JM21
6 m
eth
ano
l w
as a
dd
ed
On
line
In v
itro
[56]
Salin
e an
d 0
.5%
HPM
C
solu
tio
n
Uri
ne
(do
g)
14C
lab
eled
Z
D04
73
Puri
ty fo
rmu
late
d
mat
eria
l
Met
abo
lites
Prio
r to
sp
ecia
tio
n:
Inje
cted
dir
ectl
y Re
vers
ed p
has
e In
erts
il O
DS-
3 15
0 m
m x
4.6
mm
5 µ
m
0.25
ml/
min
H
exap
ole
co
llisi
on
/rea
ctio
n
cell
ICP-
MS
Co
nce
ntr
ic
neb
ulis
er
Gra
die
nt
Trifl
uo
roac
etic
ac
id (A
) met
han
ol
(B) 2
-20%
B
On
line
In v
itro
In v
ivo
[165
]
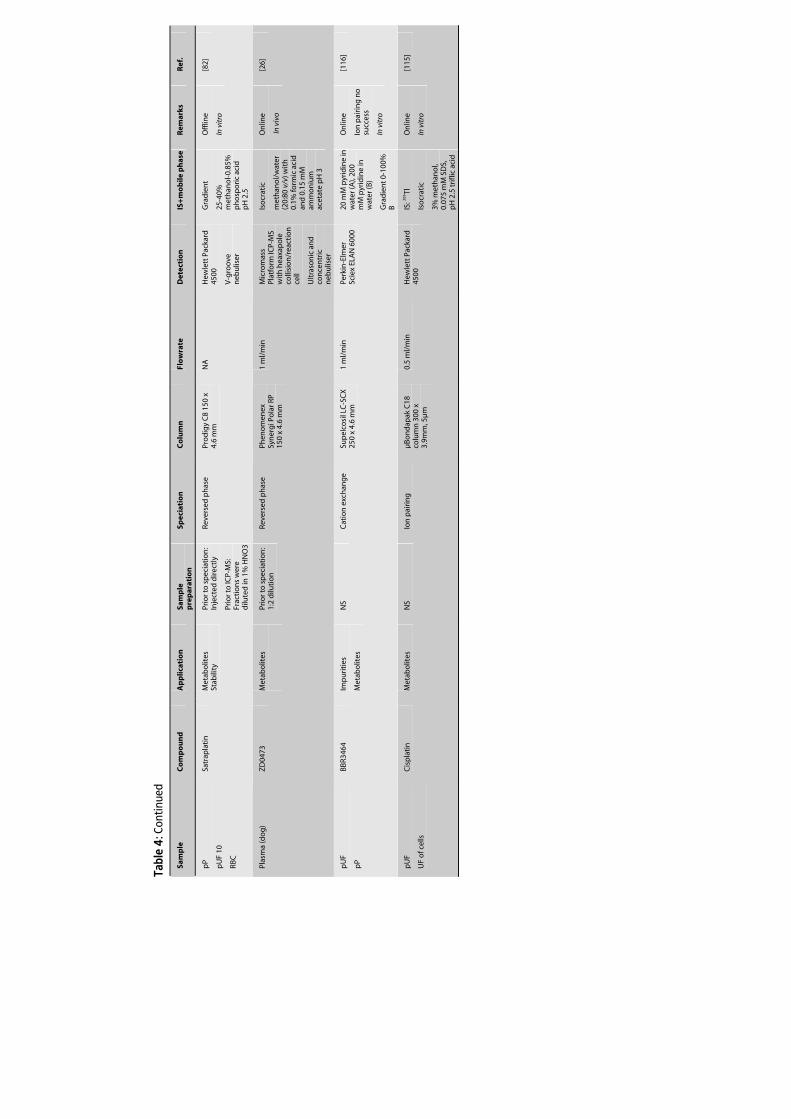
Tabl
e 4:
Con
tinue
d
Sam
ple
C
om
po
un
d
Ap
plic
atio
n
Sam
ple
p
rep
arat
ion
Sp
ecia
tio
n
Co
lum
n
Flo
wra
te
Det
ecti
on
IS
+m
ob
ile p
has
e R
emar
ks
Ref
.
pP
pU
F 10
RBC
Satr
apla
tin
M
etab
olit
es
Stab
ility
Pr
ior t
o s
pec
iati
on
: In
ject
ed d
irec
tly
Prio
r to
ICP-
MS:
Fr
acti
on
s w
ere
dilu
ted
in 1
% H
NO
3
Reve
rsed
ph
ase
Pro
dig
y C
8 15
0 x
4.6
mm
N
A
Hew
lett
Pac
kard
45
00
V-g
roo
ve
neb
ulis
er
Gra
die
nt
25-4
0%
met
han
ol-0
.85%
p
ho
spor
ic a
cid
p
H 2
.5
Off
line
In v
itro
[82]
Plas
ma
(do
g)
ZD
0473
M
etab
olit
es
Prio
r to
sp
ecia
tio
n:
1:2
dilu
tio
n
Reve
rsed
ph
ase
Phen
om
enex
Sy
ner
gi P
ola
r RP
150
x 4.
6 m
m
1 m
l/m
in
Mic
rom
ass
Plat
form
ICP-
MS
wit
h h
eaxa
po
le
colli
sio
n/r
eact
ion
ce
ll
Ult
raso
nic
an
d
con
cen
tric
n
ebu
liser
Iso
crat
ic
met
han
ol/
wat
er
(20:
80 v
/v) w
ith
0.
1% fo
rmic
aci
d
and
0.1
5 m
M
amm
on
ium
ac
etat
e p
H 3
On
line
In v
ivo
[26]
pU
F
pP
BBR3
464
Imp
uri
ties
Met
abo
lites
NS
Cat
ion
exc
han
ge
Sup
elco
sil L
C-S
CX
25
0 x
4.6
mm
1
ml/
min
Pe
rkin
-Elm
er
Scie
x EL
AN
600
0 20
mM
pyr
idin
e in
w
ater
(A),
200
mM
pyr
idin
e in
w
ater
(B)
Gra
die
nt 0
-100
%
B
On
line
Ion
pai
rin
g n
o
succ
ess
In v
itro
[116
]
pU
F
UF
of c
ells
Cis
pla
tin
M
etab
olit
es
NS
Ion
pai
rin
g
µB
on
dap
ak C
18
colu
mn
300
x
3.9m
m, 5
µm
0.5
ml/
min
H
ewle
tt P
acka
rd
4500
IS
: 205 Tl
Iso
crat
ic
3% m
eth
ano
l, 0.
075
mM
SD
S,
pH
2.5
trifl
ic a
cid
On
line
In v
itro
[115
]
Tabl
e 5:
Spe
ciat
ion
of re
actio
n pr
oduc
ts o
f met
al-b
ased
ant
ican
cer c
ompo
unds
with
DN
A a
nd p
rote
ins
(NS
= no
t spe
cifie
d, N
A =
not
app
licab
le
Sam
ple
C
om
po
un
d
Ap
plic
atio
n
Sam
ple
p
rep
arat
ion
Sp
ecia
tio
n
Co
lum
n
Flo
wra
te
Det
ecti
on
IS
+m
ob
ile p
has
e R
emar
ks
Ref
.
Salin
e so
luti
on
C
isp
lati
n
Met
hio
nin
e,
glu
tath
ion
e,
cyst
ein
e b
ind
ing
Prio
r to
sp
ecia
tio
n:
Dilu
tio
n
Ion
pai
rin
g
OD
5 C
18 c
olu
mn
15
0 x
4.6m
m, 5
µm
1 m
l/m
in
Perk
in-E
lmer
Sc
iex
ELA
N 2
50
10 m
M 1
-h
epta
nes
ulfo
nat
e 10
% m
eth
ano
l, 0.
1% fo
rmic
aci
d
(pH
2.6
)
On
line
In v
itro
[114
]
Cal
f th
ymu
s D
NA
C
isp
lati
n
Plat
inu
m b
ou
nd
to
AG
, GG
, an
d G
Prio
r to
sp
ecia
tio
n:
DN
A d
iges
tio
n w
ith
D
NA
se I
and
N
ucl
ease
P1
pro
tein
ase
K
Prio
r to
ICP-
MS:
Fr
acti
on
s d
ilute
d
An
ion
exc
han
ge
Mo
no
-Q a
nio
n
exch
ang
e 1
ml/
min
V
G P
lasm
aqu
ad
PQ1
IS:11
5 In
Gra
die
nt
12.5
mM
Tri
s (p
H
8.8)
(A),
12.5
mM
Tr
is, 1
M N
aCl (
pH
8.
8). (
5-25
%
bu
ffer
B)
Off
line
In v
itro
[146
]
Aq
ueo
us
solu
tio
n
Cis
pla
tin
M
eth
ion
ine
bin
din
g
NS
Reve
rsed
ph
ase
Sph
eris
orb
OD
S co
lum
n 1
5 cm
x
4.6
mm
, 5µ
m
1 m
l/m
in
Perk
in-E
lmer
Sc
iex
ELA
N 5
000
Iso
crat
ic
15 m
M fo
rmic
ac
id in
wat
er
On
line
In v
itro
[123
]
Seru
m
Salin
e so
luti
on
Cis
pla
tin
Imid
azo
lium
tra
ns-
tetr
ach
loro
bis
(im
idaz
ole
) ru
then
ate
(III)
Sod
ium
tr
anst
etra
chlo
ro-b
is
(ind
azo
le)
ruth
enat
e (II
I)
Pro
tein
bin
din
g
Prio
r to
sp
ecia
tio
n:
1:10
0 d
iluti
on
Size
exc
lusi
on
Su
pel
co P
rog
el T
SK
4 cm
x 4
mm
, 6 µ
m
Sup
erd
ex75
-75
HR
10/3
0 SE
C 3
00 x
10
mm
,13
µm
Pro
gel
TSK
G30
00
PWX
L 30
cm x
7.8
m
m, 1
0 µ
m
0.9
ml/
min
Pe
rkin
-Elm
er
Scie
x EL
AN
600
0 30
mM
Tri
s-H
Cl
(pH
7 .2
) Iso
crat
ic
On
line
In v
itro
[142
]
Seru
m (r
abb
it)
pU
F
Pt(II
)Cl2-
4 Pr
ote
in b
ind
ing
Pr
ior t
o s
pec
iati
on
: D
irec
tly
inje
cted
Prio
r to
ICP-
MS:
Ex
trac
tio
n g
el w
ith
aq
ua
reg
ia
2-D
gel
el
ectr
op
ho
resi
s N
A
NA
El
emen
t HR-
ICP-
MS
Co
nce
ntr
ic
neb
ulis
er
IS:19
3 Ir
Off
lin
e
In v
itro
[148
]
Plas
ma
Red
blo
od
cel
ls
pU
F 30
kD
a
Uri
ne
Oxa
lipla
tin
Pr
ote
in b
ind
ing
N
S Si
ze e
xclu
sio
n
Sup
erd
ex 2
00 H
R 10
/30
0.4
ml/
min
Pe
rkin
-Elm
er
Scie
x EL
AN
500
0 50
mM
NaH
2PO
4 an
d 1
50 m
M N
aCl
On
line
In v
ivo
[120
]
Aq
ueo
us
solu
tio
n
Cis
pla
tin
G
luta
thio
ne,
cy
stei
ne
bin
din
g
NS
Reve
rsed
ph
ase
Hic
hro
m re
vers
ed
ph
ase
150
x 4.
6 m
m
1.0
ml/
min
Pe
rkin
-Elm
er
Scie
x EL
AN
500
0
15 m
M H
CO
OH
in
90/1
0 w
ater
/met
han
ol
On
line
In v
itro
[166
]
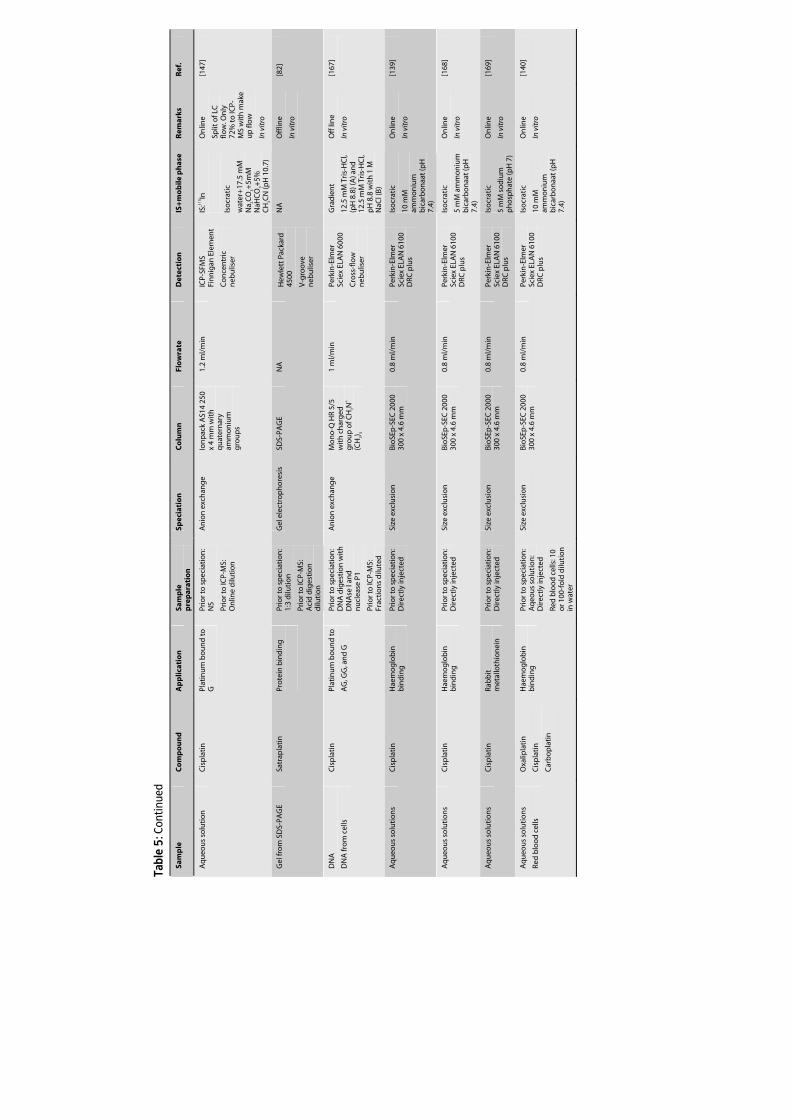
Tabl
e 5:
Con
tinue
d
Sam
ple
C
om
po
un
d
Ap
plic
atio
n
Sam
ple
p
rep
arat
ion
Sp
ecia
tio
n
Co
lum
n
Flo
wra
te
Det
ecti
on
IS
+m
ob
ile p
has
e R
emar
ks
Ref
.
Aq
ueo
us
solu
tio
n
Cis
pla
tin
Pl
atin
um
bo
un
d t
o
G
Prio
r to
sp
ecia
tio
n:
NS
Prio
r to
ICP-
MS:
O
nlin
e d
iluti
on
An
ion
exc
han
ge
Ion
pac
k A
S14
250
x 4
mm
wit
h
qu
ater
nar
y am
mo
niu
m
gro
up
s
1.2
ml/
min
IC
P-SF
MS
Fin
nig
an E
lem
ent
Co
nce
ntr
ic
neb
ulis
er
IS:11
5 In
Iso
crat
ic
wat
er+
17.5
mM
N
a 2CO
3+5m
M
NaH
CO
3+5%
C
H3C
N (p
H 1
0.7)
On
line
Split
of L
C
flow
. On
ly
72%
to IC
P-M
S w
ith
mak
e u
p fl
ow
In v
itro
[147
]
Gel
fro
m S
DS-
PAG
E Sa
trap
lati
n
Pro
tein
bin
din
g
Prio
r to
sp
ecia
tio
n:
1:3
dilu
tio
n
Prio
r to
ICP-
MS:
A
cid
dig
esti
on
d
iluti
on
Gel
ele
ctro
ph
ore
sis
SDS-
PAG
E N
A
Hew
lett
Pac
kard
45
00
V-g
roo
ve
neb
ulis
er
NA
O
fflin
e
In v
itro
[82]
DN
A
DN
A fr
om
cel
ls
Cis
pla
tin
Pl
atin
um
bo
un
d t
o
AG
, GG
, an
d G
Prio
r to
sp
ecia
tio
n:
DN
A d
iges
tio
n w
ith
D
NA
se I
and
n
ucl
ease
P1
Prio
r to
ICP-
MS:
Fr
acti
on
s d
ilute
d
An
ion
exc
han
ge
Mo
no
-Q H
R 5/
5 w
ith
ch
arg
ed
gro
up
of C
H2N
+
(CH
3) 3
1 m
l/m
in
Perk
in-E
lmer
Sc
iex
ELA
N 6
000
Cro
ss-f
low
n
ebu
liser
Gra
die
nt
12.5
mM
Tri
s-H
Cl,
(pH
8.8
) (A
) an
d
12.5
mM
Tri
s-H
Cl,
pH
8.8
wit
h 1
M
NaC
l (B
)
Off
lin
e
In v
itro
[167
]
Aq
ueo
us
solu
tio
ns
Cis
pla
tin
H
aem
og
lob
in
bin
din
g
Prio
r to
sp
ecia
tio
n:
Dir
ectl
y in
ject
ed
Size
exc
lusi
on
Bi
oSE
p-S
EC 2
000
300
x 4.
6 m
m
0.8
ml/
min
Pe
rkin
-Elm
er
Scie
x EL
AN
610
0 D
RC p
lus
Iso
crat
ic
10 m
M
amm
on
ium
b
icar
bo
naa
t (p
H
7.4)
On
line
In v
itro
[139
]
Aq
ueo
us
solu
tio
ns
Cis
pla
tin
H
aem
og
lob
in
bin
din
g
Prio
r to
sp
ecia
tio
n:
Dir
ectl
y in
ject
ed
Size
exc
lusi
on
Bi
oSE
p-S
EC 2
000
300
x 4.
6 m
m
0.8
ml/
min
Pe
rkin
-Elm
er
Scie
x EL
AN
610
0 D
RC p
lus
Iso
crat
ic
5 m
M a
mm
on
ium
b
icar
bo
naa
t (p
H
7.4)
On
line
In v
itro
[168
]
Aq
ueo
us
solu
tio
ns
Cis
pla
tin
Ra
bb
it
met
allo
thio
nei
n
Prio
r to
sp
ecia
tio
n:
Dir
ectl
y in
ject
ed
Size
exc
lusi
on
Bi
oSE
p-S
EC 2
000
300
x 4.
6 m
m
0.8
ml/
min
Pe
rkin
-Elm
er
Scie
x EL
AN
610
0 D
RC p
lus
Iso
crat
ic
5 m
M s
od
ium
p
ho
sph
ate
(pH
7)
On
line
In v
itro
[169
]
Aq
ueo
us
solu
tio
ns
Red
blo
od
cel
ls
Oxa
lipla
tin
Cis
pla
tin
Car
bo
pla
tin
Hae
mo
glo
bin
b
ind
ing
Pr
ior t
o s
pec
iati
on
: A
qeo
us
solu
tio
n:
Dir
ectl
y in
ject
ed
Red
blo
od
cel
ls: 1
0 o
r 100
-fo
ld d
iluti
on
in
wat
er
Size
exc
lusi
on
Bi
oSE
p-S
EC 2
000
300
x 4.
6 m
m
0.8
ml/
min
Pe
rkin
-Elm
er
Scie
x EL
AN
610
0 D
RC p
lus
Iso
crat
ic
10 m
M
amm
on
ium
b
icar
bo
naa
t (p
H
7.4)
On
line
In v
itro
[140
]
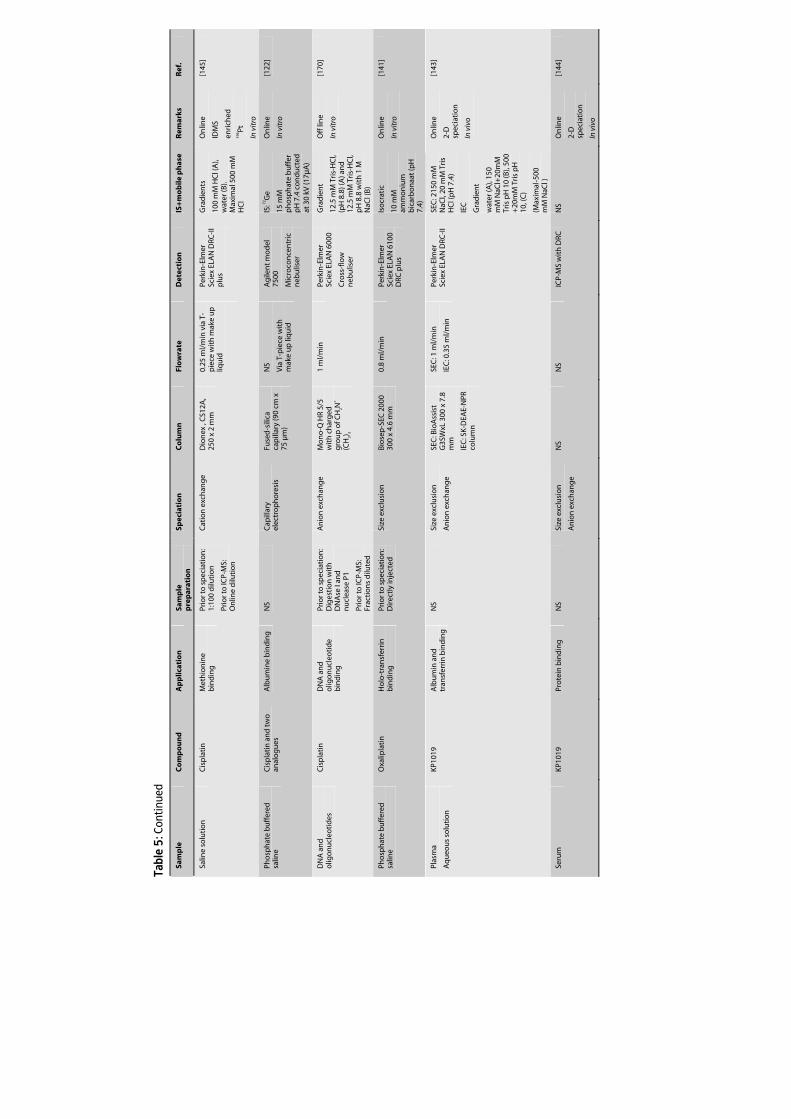
Tabl
e 5:
Con
tinue
d
Sam
ple
C
om
po
un
d
Ap
plic
atio
n
Sam
ple
p
rep
arat
ion
Sp
ecia
tio
n
Co
lum
n
Flo
wra
te
Det
ecti
on
IS
+m
ob
ile p
has
e R
emar
ks
Ref
.
Salin
e so
luti
on
C
isp
lati
n
Met
hio
nin
e b
ind
ing
Pr
ior t
o s
pec
iati
on
: 1:
100
dilu
tio
n
Prio
r to
ICP-
MS:
O
nlin
e d
iluti
on
Cat
ion
exc
han
ge
Dio
nex
, C
S12A
, 25
0 x
2 m
m
0.25
ml/
min
via
T-
pie
ce w
ith
mak
e u
p
liqu
id
Perk
in-E
lmer
Sc
iex
ELA
N D
RC-I
I p
lus
Gra
die
nts
100
mM
HC
l (A
), w
ater
(B).
Max
imal
500
mM
H
Cl
On
line
IDM
S
enri
ched
19
6 Pt
In v
itro
[145
]
Pho
sph
ate
bu
ffer
ed
salin
e C
isp
lati
n a
nd
two
an
alo
gu
es
Alb
um
ine
bin
din
g
NS
Cap
illar
y el
ectr
op
ho
resi
s Fu
sed
-sili
ca
cap
illar
y (9
0 cm
x
75 µ
m)
NS
Via
T-p
iece
wit
h
mak
e u
p li
qu
id
Ag
ilen
t mo
del
75
00
Mic
roco
nce
ntr
ic
neb
ulis
er
IS: 7
2 Ge
15 m
M
ph
osp
hat
e b
uff
er
pH
7.4
co
nd
uct
ed
at 3
0 kV
(17µ
A)
On
line
In v
itro
[122
]
DN
A a
nd
o
ligo
nu
cleo
tid
es
Cis
pla
tin
D
NA
an
d
olig
on
ucl
eoti
de
bin
din
g
Prio
r to
sp
ecia
tio
n:
Dig
esti
on
wit
h
DN
Ase
I an
d
nu
clea
se P
1
Prio
r to
ICP-
MS:
Fr
acti
on
s d
ilute
d
An
ion
exc
han
ge
Mo
no
-Q H
R 5/
5 w
ith
ch
arg
ed
gro
up
of C
H2N
+
(CH
3) 3
1 m
l/m
in
Perk
in-E
lmer
Sc
iex
ELA
N 6
000
Cro
ss-f
low
n
ebu
liser
Gra
die
nt
12.5
mM
Tri
s-H
Cl,
(pH
8.8
) (A
) an
d
12.5
mM
Tri
s-H
Cl,
pH
8.8
wit
h 1
M
NaC
l (B
)
Off
lin
e
In v
itro
[170
]
Pho
sph
ate
bu
ffer
ed
salin
e O
xalip
lati
n
Ho
lo-t
ran
sfer
rin
b
ind
ing
Pr
ior t
o s
pec
iati
on
: D
irec
tly
inje
cted
Si
ze e
xclu
sio
n
Bio
sep
-SEC
200
0 30
0 x
4.6
mm
0.
8 m
l/m
in
Perk
in-E
lmer
Sc
iex
ELA
N 6
100
DRC
plu
s
Iso
crat
ic
10 m
M
amm
on
ium
b
icar
bo
naa
t (p
H
7.4)
On
line
In v
itro
[141
]
Plas
ma
Aq
ueo
us
solu
tio
n
KP10
19
Alb
um
in a
nd
tr
ansf
erri
n b
ind
ing
N
S Si
ze e
xclu
sio
n
An
ion
exc
han
ge
SEC
: Bio
Ass
ist
G3S
WxL
300
x 7
.8
mm
IEC
: SK
-DEA
E-N
PR
colu
mn
SEC
: 1 m
l/m
in
IEC
: 0.3
5 m
l/m
in
Perk
in-E
lmer
Sc
iex
ELA
N D
RC-I
I SE
C: 2
150
mM
N
aCl,
20 m
M T
ris
HC
l (p
H 7
.4)
IEC
Gra
die
nt
wat
er (A
), 15
0 m
M N
aCl+
20m
M
Tris
pH
10
(B),
500
+20
mM
Tri
s p
H
10, (
C)
(Max
imal
-500
m
M N
aCl )
On
line
2-D
sp
ecia
tio
n
In v
ivo
[143
]
Seru
m
KP10
19
Pro
tein
bin
din
g
NS
Size
exc
lusi
on
An
ion
exc
han
ge
NS
NS
ICP-
MS
wit
h D
RC
NS
On
line
2-D
sp
ecia
tio
n
In v
ivo
[144
]
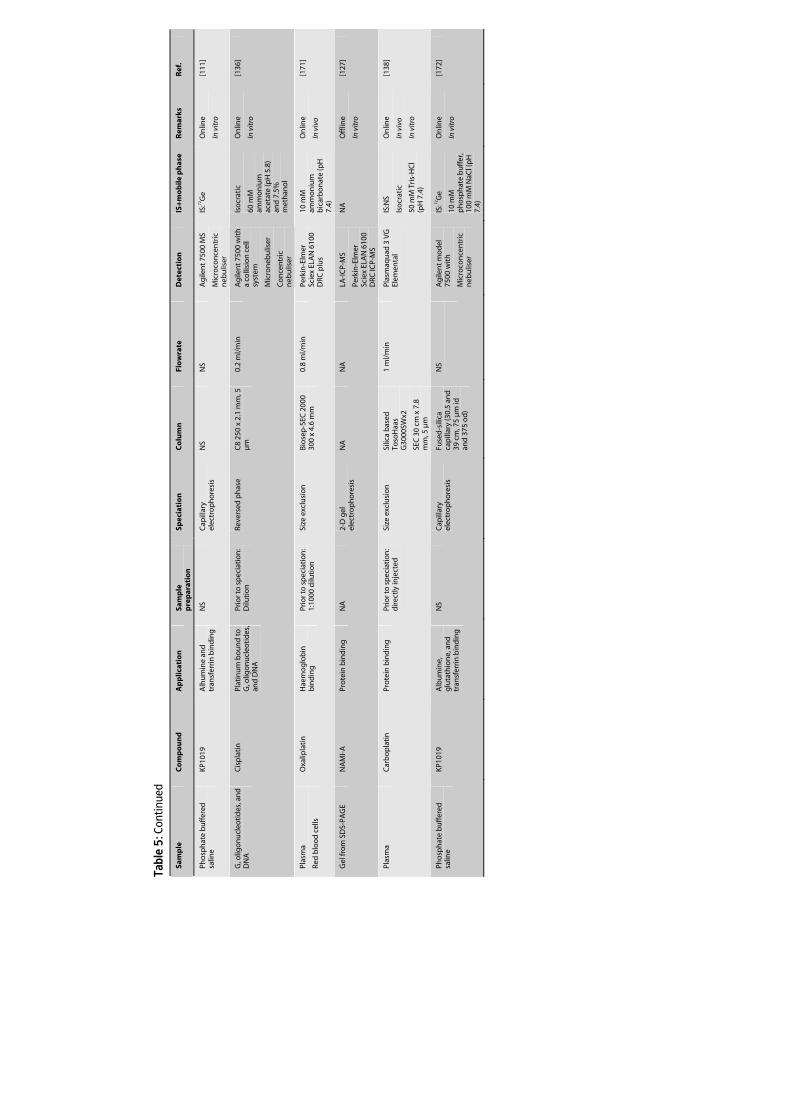
Tabl
e 5:
Con
tinue
d
Sam
ple
C
om
po
un
d
Ap
plic
atio
n
Sam
ple
p
rep
arat
ion
Sp
ecia
tio
n
Co
lum
n
Flo
wra
te
Det
ecti
on
IS
+m
ob
ile p
has
e R
emar
ks
Ref
.
Pho
sph
ate
bu
ffer
ed
salin
e KP
1019
A
lhu
min
e an
d
tran
sfer
rin
bin
din
g
NS
Cap
illar
y el
ectr
op
ho
resi
s N
S N
S A
gile
nt 7
500
MS
Mic
roco
nce
ntr
ic
neb
ulis
er
IS:72
Ge
On
line
In v
itro
[111
]
G, o
ligo
nu
cleo
tid
es, a
nd
D
NA
C
isp
lati
n
Plat
inu
m b
ou
nd
to
G
, olig
on
ucl
eoti
des
, an
d D
NA
Prio
r to
sp
ecia
tio
n:
Dilu
tio
n
Reve
rsed
ph
ase
C8
250
x 2.
1 m
m, 5
µ
m
0.2
ml/
min
A
gile
nt 7
500
wit
h
a co
llisi
on
cel
l sy
stem
Mic
ron
ebu
liser
Co
nce
ntr
ic
neb
ulis
er
Iso
crat
ic
60 m
M
amm
on
ium
ac
etat
e (p
H 5
.8)
and
7.5
%
met
han
ol
On
line
In v
itro
[136
]
Plas
ma
Red
blo
od
cel
ls
Oxa
lipla
tin
H
aem
og
lob
in
bin
din
g
Prio
r to
sp
ecia
tio
n:
1:10
00 d
iluti
on
Si
ze e
xclu
sio
n
Bio
sep
-SEC
200
0 30
0 x
4.6
mm
0.
8 m
l/m
in
Perk
in-E
lmer
Sc
iex
ELA
N 6
100
DRC
plu
s
10 m
M
amm
on
ium
b
icar
bo
nat
e (p
H
7.4)
On
line
In v
ivo
[171
]
Gel
fro
m S
DS-
PAG
E N
AM
I-A
Pr
ote
in b
ind
ing
N
A
2-D
gel
el
ectr
op
ho
resi
s N
A
NA
LA
-IC
P-M
S
Perk
in-E
lmer
Sc
iex
ELA
N 6
100
DRC
ICP-
MS
NA
O
fflin
e
In v
itro
[127
]
Plas
ma
Car
bo
pla
tin
Pr
ote
in b
ind
ing
Pr
ior t
o s
pec
iati
on
: d
irec
tly
inje
cted
Si
ze e
xclu
sio
n
Silic
a b
ased
To
soH
aas
G30
00SW
x2
SEC
30
cm x
7.8
m
m, 5
µm
1 m
l/m
in
Plas
maq
uad
3 V
G
Elem
enta
l
IS:N
S
Iso
crat
ic
50 m
M T
ris-
HC
l (p
H 7
.4)
On
line
In v
ivo
In v
itro
[138
]
Pho
sph
ate
bu
ffer
ed
salin
e KP
1019
A
lbu
min
e,
glu
tath
ion
e, a
nd
tr
ansf
erri
n b
ind
ing
NS
Cap
illar
y el
ectr
op
ho
resi
s Fu
sed
-sili
ca
cap
illar
y (3
0.5
and
39
cm
, 75
µm
id
and
375
od
)
NS
Ag
ilen
t mo
del
75
00 w
ith
Mic
roco
nce
ntr
ic
neb
ulis
er
IS: 7
2 Ge
10 m
M
ph
osp
hat
e b
uff
er,
100
mM
NaC
l (p
H
7.4)
On
line
In v
itro
[172
]
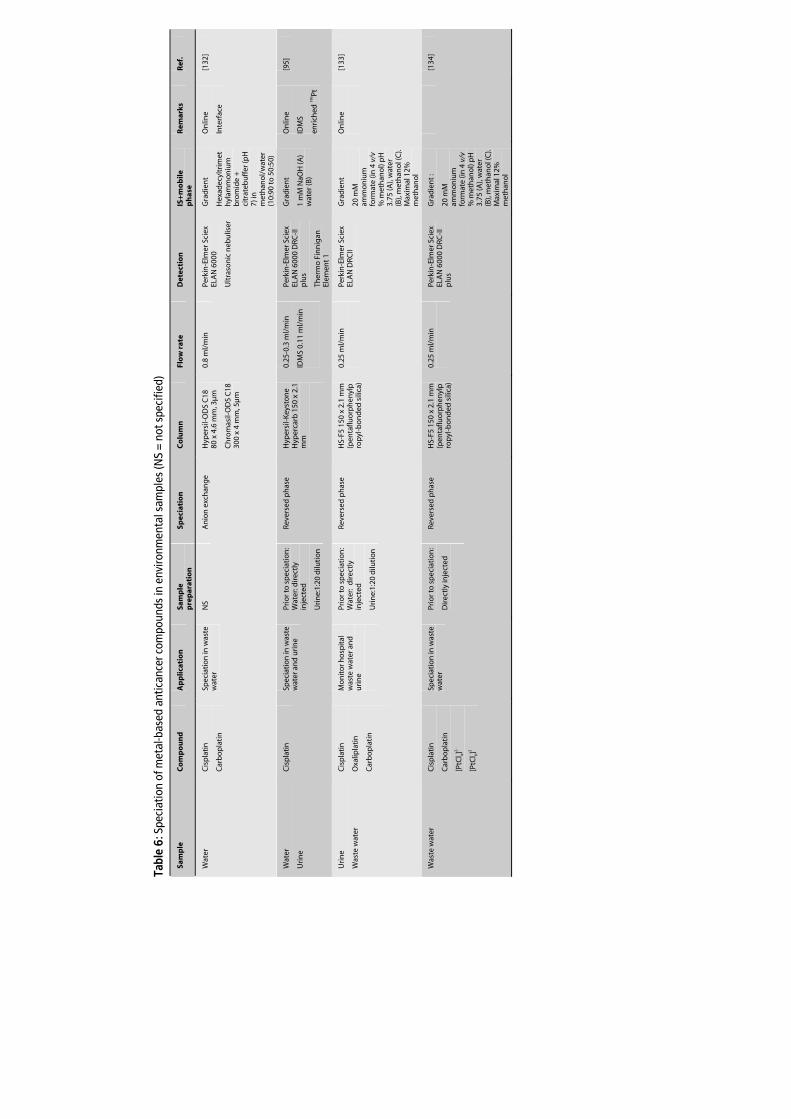
Tabl
e 6:
Spe
ciat
ion
of m
etal
-bas
ed a
ntic
ance
r com
poun
ds in
env
ironm
enta
l sam
ples
(NS
= no
t spe
cifie
d)
Sam
ple
C
om
po
un
d
Ap
plic
atio
n
Sam
ple
p
rep
arat
ion
Sp
ecia
tio
n
Co
lum
n
Flo
w r
ate
Det
ecti
on
IS
+m
ob
ile
ph
ase
Rem
arks
R
ef.
Wat
er
Cis
pla
tin
Car
bo
pla
tin
Spec
iati
on
in w
aste
w
ater
N
S A
nio
n e
xch
ang
e H
yper
sil-
OD
S C
18
80 x
4.6
mm
, 3µ
m
Ch
rom
asil-
OD
S C
18
300
x 4
mm
, 5µ
m
0.8
ml/
min
Pe
rkin
-Elm
er S
ciex
EL
AN
600
0
Ult
raso
nic
neb
ulis
er
Gra
die
nt
Hex
adec
yltr
imet
hyl
amm
on
ium
b
rom
ide
+
citr
ateb
uff
er (p
H
7) in
m
eth
ano
l/w
ater
(1
0:90
to
50:
50)
On
line
Inte
rfac
e
[132
]
Wat
er
Uri
ne
Cis
pla
tin
Sp
ecia
tio
n in
was
te
wat
er a
nd
uri
ne
Prio
r to
sp
ecia
tio
n:
Wat
er: d
irec
tly
inje
cted
Uri
ne:
1:20
dilu
tio
n
Reve
rsed
ph
ase
Hyp
ersi
l-K
eyst
on
e H
yper
carb
150
x 2
.1
mm
0.25
-0.3
ml/
min
IDM
S 0.
11 m
l/m
in
Perk
in-E
lmer
Sci
ex
ELA
N 6
000
DRC
-II
plu
s
Ther
mo
Fin
nig
an
Elem
ent 1
Gra
die
nt
1 m
M N
aOH
(A)
wat
er (B
)
On
line
IDM
S
enri
ched
196 Pt
[95]
Uri
ne
Was
te w
ater
Cis
pla
tin
Oxa
lipla
tin
Car
bo
pla
tin
Mo
nit
or h
osp
ital
w
aste
wat
er a
nd
u
rin
e
Prio
r to
sp
ecia
tio
n:
Wat
er:
dir
ectl
y in
ject
ed
Uri
ne:
1:20
dilu
tio
n
Reve
rsed
ph
ase
HS-
F5 1
50 x
2.1
mm
(p
enta
fluo
rph
enyl
pro
pyl
-bo
nd
ed s
ilica
)
0.25
ml/
min
Perk
in-E
lmer
Sci
ex
ELA
N D
RCII
Gra
die
nt
20 m
M
amm
on
ium
fo
rmat
e (in
4 v
/v
% m
eth
ano
l) p
H
3.75
(A),
wat
er
(B),
met
han
ol (
C).
Max
imal
12%
m
eth
ano
l
On
line
[133
]
Was
te w
ater
C
isp
lati
n
Car
bo
pla
tin
[PtC
l 4]2-
[PtC
l 6]2
Spec
iati
on
in w
aste
w
ater
Pr
ior t
o s
pec
iati
on
:
Dir
ectl
y in
ject
ed
Reve
rsed
ph
ase
HS-
F5 1
50 x
2.1
mm
(p
enta
fluo
rph
enyl
pro
pyl
-bo
nd
ed s
ilica
)
0.25
ml/
min
Perk
in-E
lmer
Sci
ex
ELA
N 6
000
DRC
-II
plu
s
Gra
die
nt :
20 m
M
amm
on
ium
fo
rmat
e (in
4 v
/v
% m
eth
ano
l) p
H
3.75
(A),
wat
er
(B),
met
han
ol (
C).
Max
imal
12%
m
eth
ano
l
[1
34]
ICP-MS in oncology
55
4.2 Assay development
The development of speciation methods using ICP-MS for Pt or Ru detection is generally
focused on the selection of a speciation system that is capable of separating the
compounds of interest and that is compatible with ICP-MS. This compatibility can be
improved by instrumental modifications. In addition, it is relevant that the mobile phase
is not reactive with the Pt compounds and their metabolites.
High performance liquid chromatography (HPLC) combined with ICP-MS detection is a
versatile speciation technique. The chromatographic columns used in the investigations
published in literature on the speciation of metal-based compounds in combination
with ICP-MS included reversed phase, size exclusion, ion-exchange, and ion-pair
chromatography (Table 5). The ion-pairing reagents were anionic and cationic
surfactants.
ICP-MS can be used as an off-line or on-line detector. When online detection is used, the
coupling of the chromatographic method to the ICP-MS is achieved by connecting the
outlet of the column to the liquid sample inlet of the nebuliser. The feasibility of
coupling HPLC-ICP-MS is mainly affected by the composition and flow rate of the mobile
phases used to perform chromatographic separation. The high amounts of organic
solvents frequently used in reversed or normal phase HPLC results in physical changes of
the plasma. This might cause plasma instability or even extinguishing of the plasma
[135]. Further problems are encountered with organic solvents when performing
gradient elution. As the eluent composition changes, the nature of the plasma changes,
which could lead to a variable sensitivity during the gradient elution and thus calibration
problems [118]. Furthermore, the presence of high levels of organic solvent or dissolved
solids (e.g. salts) can result in constriction of the cone orifices owing to build-up of solids.
High solid contents can also lead to clogging of the nebuliser. These issues affect the
robustness, sensitivity, and precision of the technique. Therefore, the organic solvent
load and salt content of the mobile phase should be kept to a minimum.
4.2.1 Reversed phase chromatography (RP)
RP is the most commonly used speciation mechanism in liquid chromatography and
consists of a hydrophobic stationary phase bonded to a solid support. The mobile
phases are less hydrophobic, usually water containing different amounts of organic
modifiers such as methanol or acetonitril. The sample compounds are partitioned
between the mobile phase and stationary phase. Analyte retention is determined by the
affinity for each of the two phases and can be altered by changes in e.g pH. The main
limitation of RP-HPLC-ICP-MS is that most organic modifiers are not ICP-MS compatible.
Despite this limitation, however, RP is the most frequently used technique in the
speciation of metabolites of metal-based anticancer agents. Several approaches have
Chapter 1.2
56
been used to surmount the compatibility problems. Screnci et al. avoided the use of
large amounts of organic solvent and used a mobile phase consisting of 100% water to
assess differences in hydrophobicity of several Pt compounds in order to evaluate
relationships between hydrophobicity, Pt accumulation in dorsal root ganglia, and
neurotoxicity [56]. For satraplatin, however, methanol was added. Allain et al. also used
isocratic elution with a mobile phase containing a large percentage of water (90%) for
the speciation of oxaliplatin biotransformation products [120]. Hann et al. hyphenated
RP-HPLC to ICP-MS for the analysis of cisplatin metabolites in waste water [95]. They
used gradient elution from 1mM sodium hydroxide to water, entering the ICP-MS
through a Tee. The other entrance of the Tee was used to introduce the enriched 196Pt
isotope for online IDMS. Because of low salt concentrations and the absence of organic
solvent, no compatibility issues were met. A gradient elution with up to 12% methanol,
used for the speciation of several Pt anticancer agents in hospital waste water, was
described by the same authors [133]. Smith et al. reported the speciation and
quantification of metabolites of ZD0473 using isocratic elution with a mobile phase
containing 20% of methanol [26]. The deposition of carbon on the cones was prevented
by the addition of oxygen to the nebuliser gas. Cairns et al. used an eluent containing
water and acetonitrile for the speciation of metabolites of satraplatin [117,118]. To allow
a gradient elution with acetonitrile concentrations up to 95%, an interface was
developed to desolvate the HPLC eluent prior to introduction to the plasma [118]. The
interface consisted of a common concentric nebuliser, a heated spray chamber, a
membrane desolvator, and a condenser. Galettis et al. also developed a method for the
quantification of satraplatin metabolites [119]. They, however, managed to develop and
validate a method with gradient elution using methanol concentrations from 25 to 45%,
without the necessity to desolvate the mobile phase. Methanol was chosen because of
its lower vapour pressure and carbon loading compared to acetonitrile. The gradient
from 25 to 45% of methanol suppressed Pt signals by 70%. Because not all metabolites
showed a similar signal suppression, to achieve reliable results, this approach does
require the availability of reference compounds of all the metabolites tested.
Metabolites should be quantified using calibration curves for each separate metabolite.
Another application using similar chromatographic conditions was described with
offline ICP-MS detection [82].
In addition to the speciation of metabolites of metal-based anticancer agents, RP proved
to be suitable for studying the reaction products of cisplatin with methionine [123],
using an isocratic elution with an aqueous mobile phase. The interaction of cisplatin
with DNA nucleotides was also studied [136] using isocratic elution with low amounts of
methanol. The investigators tested two columns with different characteristics and
optimal flow rates. The eluent from the C8 column (0.2 ml/min) was introduced into the
ICP-MS via a micronebuliser to facilitate the introduction of low flow rates, whereas for
ICP-MS in oncology
57
the C16 column (1 ml/min) a common concentric nebuliser was used. Both methods
were compatible with ICP-MS because low amounts of methanol and isocratic elution
were used. With the C8 column, however, a better speciation of nucleobases was
achieved.
4.2.2 Reversed phase ion-pairing chromatography (RPIP)
RPIP is used for the speciation of ionic or ionisable compounds for which an ion-pair (IP)
is formed between the solute ion and an appropriate counter ion. The resulting IP is
partitioned between the mobile and stationary phase. The mobile and stationary phases
used in RPIP are similar to those employed in RP-HPLC, although an IP reagent is added
to the mobile phase. The IP reagent contains a polar and non-polar moiety.
Because of their positive charges, Pt metabolites can be successfully separated using
RPIP. Zhao et al. applied RPIP to retain ionic and neutral cisplatin derivatives [114].
Hydrolysis products of cisplatin were separated using sodium dodecylsulfate (SDS) or
heptanosulfonate as IP reagent. It was shown that SDS had low activity with cisplatin
and its metabolites [137]. Heptanosulfonate, which resulted in a better speciation,
however, did shift the equilibrium of hydrolysis when the analytes were diluted in the
mobile phase. Because the shift was slow, this effect could be avoided by diluting the
sample immediately before injection. Heptanosulfonate was also used for the speciation
of the reaction products of cisplatin with thiol compounds. The organic content of the
mobile phases was purposely kept low (3% n-propanol for the hydrolysis products and
10% methanol for the thiol compounds) to ensure the stability of the plasma. SDS in a
3% methanol containing mobile phase was also used in another application for the
speciation of cisplatin and monohydrated cisplatin [115]. Although the mobile phase
changed the overall appearance of the argon plasma, the Pt counts were only slightly
suppressed and thus adequate results were achieved.
Although the effect of the applied IP reagents on cisplatin metabolism in the previous
publications seemed to be insignificant, the possible effect of IP reagents should be
taken into account when developing RPIP methods for the speciation of Pt compounds.
4.2.3 Size exclusion chromatography (SEC)
SEC is used to separate molecules according to their effective size in solution using a
stationary phase gel with pores of a particular dimension. Molecules that are too large to
enter pores elute first, while small molecules interact with the stationary phase and elute
depended on their size. This technique is useful for the speciation of proteins. The
mobile phases used for SEC are usually buffered solutions such as Tris-HCl or phosphate
buffers [138]. Some applications, however, use high saline solutions as a mobile phase,
which limits the hyphenation of SEC to ICP-MS. Several methods for the speciation and
Chapter 1.2
58
quantification of Pt bound to proteins have been reported. Allain et al. demonstrated
the binding of oxaliplatin to γ-globulins, albumin, and haemoglobin using an aqueous
mobile phase with 150 mM sodium hydroxide [120]. No compatibility problems were
described. The interaction of cisplatin with haemoglobin was also extensively studied
with SEC using a mobile phase of 10 mM ammonium bicarbonate [139,140]. A similar
procedure was utilised to separate oxaliplatin and oxaliplatin bound to holo-transferrin
[141]. The interaction of carboplatin with plasma proteins analysed by SEC was also
reported [138]. For this application a mobile phase of 50 mM Tris-HCl was used, because
a mobile phase containing phosphate buffer resulted in an unstable plasma. Szpunar et
al. investigated various SEC systems for the speciation of the protein-bound and
unbound fractions of Pt and Ru drugs prior to online ICP-MS detection [142]. The mobile
phase used (30 mM Tris-HCl buffer) was well tolerated by the ICP-MS. The speciation of
Pt and Ru compounds using SEC was complicated because parent compounds and
metabolites were partly retained on the stationary phase. Furthermore, the authors
demonstrated that using SEC it was not possible to separate albumin- and transferring-
bound drug because of a proximity in molar masses. Another speciation mechanism
such as anion-exchange could solve this limitation. Other authors also mentioned that
SEC alone could not adequately distinguish between metallo-proteins that show only
small differences in amino acid sequence. They, therefore, combined SEC with anion-
exchange chromatography coupled to ICP-MS to separate and quantify Ru-albumine
and Ru-transferrin adducts [143,144].
4.2.4 Ion-exchange chromatography (IEC)
IEC is based on the interactions of charged functional groups of the stationary phase
with charged analytes. Two types of IEC exist; cation-exchange, where positively charged
analytes react with anionic sites on the column and anion-exchange, where cationic sites
on the column are used to react with negatively charged analytes. Mobile phases
generally consist of an aqueous salt buffer, which might cause difficulties when
hyphenating IEC to ICP-MS. Additionally, an organic modifier is often added to the
mobile phase. The pH of the mobile phase is of great interest because it affects the
dissociation of the compounds analysed.
A cation-exchange method with ICP-MS detection was reported for the speciation of
BBR3464 and drug related products [116]. Because of the strong cationic character of the
compounds, RP-HPLC appeared to be unsuitable. Speciation of the compounds could be
achieved by the addition of an IP reagent and 35% acetonitrile to the mobile phase. This,
however, resulted in a progressive loss of sensitivity. The use of cation-exchange
chromatography, with a gradient from 20 to 200 mM pyridine, resulted in a proper
separation. Another cation-exchange method was applied to separate cisplatin, its
ICP-MS in oncology
59
metabolites, methionine, and their adducts [145]. The method employed gradient
elution fom 0.01 to 0.05 mM HCl and the mobile phase did not affect cisplatin kinetics.
No problems for the hyphenation of cation-exchange chromatography to ICP-MS for any
of the described applications were reported.
Falter et al. applied a solvent-generated anion exchanger for the separation of cisplatin
and carboplatin [132]. The column was pre-treated with hexadecyltrimethylammonium
bromide (HTAB) and speciation was carried out by the use of a gradient containing 10 to
50% methanol in water. The high amounts of organic solvent could be used because of
the application of an ultrasonic nebuliser followed by desolvation, minimising the
solvent load entering the ICP. Anion-exchange was also applied to separate the cisplatin
reaction products with DNA after enzymatic digestion. The negatively charged
nucleotides could be separated using a stationary phase with quaternary ammonium
groups [70,146]. The platinated DNA was digested and eluted off the column by a linear
salt gradient of NaCl. Fractions were collected and, after dilution, analysed using ICP-MS.
The interaction of cisplatin with guanosine monophosphate has been investigated by
Hann et al. using anion-exchange chromatography coupled to sector field ICP-MS [147].
The column was also functionalised with quaternary ammonium groups. The mobile
phase consisted of a carbonate buffer system with 5% acetonitril to reduce retention
times. To avoid matrix interferences, only 22% of the mobile phase was directed to the
ICP-MS. Before entering the introduction system the mobile phase was diluted by a
make-up flow containing 1% HNO3 and IS.
4.2.5 Speciation techniques other than liquid chromatography
In addition to methods using liquid chromatography, few other speciation methods
hyphenated to ICP-MS detection for the analysis of metal-based anticancer drugs have
been described. Gel electrophoresis (SDS-PAGE) was used for the speciation of serum
proteins after reaction with Pt [82,148]. The bands from the gel were cut out and
dissolved in 70% HNO3 and then heated at 90 °C before being diluted with water [82] or
they were extracted with aqua regia [148]. The Pt content of the bands was measured by
ICP-MS. Timeraev et al. coupled capillary electrophoresis to ICP-MS using an interface
consisting of a microconcentric nebuliser to study the interaction of cisplatin with
albumine [122]. A similar method was applied to study the interaction of KP1019 with
albumine and transferrin [111].
Chapter 1.2
60
5 Conclusions and perspectives
The successful application of ICP-MS in oncology has had an enormous impact on the
field of quantitative analysis of metal-based anticancer agents from biological and
environmental samples. ICP-MS provides enormous sensitivity, which makes the
technique applicable to study metal pharmacokinetics, metal accumulation in cells, and
DNA- and protein-binding. Furthermore, environmental monitoring to assess the
exposure of hospital personnel to metal-based anticancer agents can be studied using
this technique. Pretreatment of the samples depends on the composition of the sample
and on the available instrument and is generally focused on the reduction of matrix
effects. In the absence of a suitable matrix removal pretreatment procedure, matrix
effects can be circumvented by using appropriate calibration methods.
In addition to the analysis of total metal content of samples, the hyphenation of
speciation techniques to ICP-MS has extended the application of ICP-MS to the analysis
of parent compounds, metabolites, and adducts of metal-based anticancer agents. The
development of speciation methods using ICP-MS is commonly focused on the selection
of a speciation system that is capable of separating the compounds of interest and that
is compatible with ICP-MS.
Publications discussed in this paper appeared in the last 17 years. During this period, the
application of ICP-MS to study metal-based anticancer agents increased rapidly.
Currently available ICP-MS instruments are capable of quantifying picograms of metallic
elements, and thus can detect ambient Pt or Ru reliably in humans. With this capability,
current ICP-MS technologies offer great potential for continued investigations of metal-
based oncology treatments and the elucidation of their anticancer mechanisms.
ICP-MS in oncology
61
References 1. Rosenberg B, Vancamp L, Krigas T. Inhibition of cell division in escherichia coli by electrolysis products
from a platinum electrode. Nature 1965; 205: 698-9.
2. Kelland L. The resurgence of platinum-based cancer chemotherapy. Nat Rev Cancer 2007; ..
3. Rademaker-Lakhai JM, van den BD, Pluim D, Beijnen JH, Schellens JH. A Phase I and pharmacological study with imidazolium-trans-DMSO-imidazole-tetrachlororuthenate, a novel ruthenium anticancer agent. Clin Cancer Res 2004; 10: 3717-27.
4. Hartinger CG, Zorbas-Seifried S, Jakupec MA, Kynast B, Zorbas H, Keppler BK. From bench to bedside--preclinical and early clinical development of the anticancer agent indazolium trans-[tetrachlorobis(1H-indazole)ruthenate(III)] (KP1019 or FFC14A). J Inorg Biochem 2006; 100: 891-904.
5. Scheulen ME, Kynast B, Jaehde U, Hilger RA, Scheuch E, Arion V, Kupsch P, Henke MM, Dittrich C, Keppler BK. A phase I dose-escalation trial with the new redox activated compound sodium trans-[tetrachlorobis(1H-indazole)ruthenate(III)]/indazolhydrochloride (1:1.1) (FFC14A) in patients with solid tumors - a CESAR study. J Clin Oncol , 2004 ASCO Annual Meeting Proceedings 2004; 22: 2101.
6. Brouwers EEM, Tibben MM, Rosing H, Hillebrand MJX, Joerger M, Schellens JHM, Beijnen JH. Sensitive inductively coupled plasma mass spectrometry assay for the determination of platinum originating from cisplatin, carboplatin, and oxaliplatin in human plasma ultrafiltrate. J Mass Spectrom 2006; 41: 1186-94.
7. Crul M, van den Bongard HJ, Tibben MM, van Tellingen O, Sava G, Schellens JH, Beijnen JH. Validated method for the determination of the novel organo-ruthenium anticancer drug NAMI-A in human biological fluids by Zeeman atomic absorption spectrometry. Fresenius J Anal Chem 2001; 369: 442-5.
8. Vermorken JB, van der Vijgh WJ, Pinedo HM. Pharmacokinetic evidence for an enterohepatic circulation in a patient treated with cis-dichlorodiammineplatinum (II). Res Commun Chem Pathol Pharmacol 1980; 28: 319-28.
9. Nygren O, Vaughan GT, Florence TM, Morrison GM, Warner IM, Dale LS. Determination of platinum in blood by adsorptive voltammetry. Anal Chem 1990; 62: 1637-40.
10. Gelevert T, Messerschmidt J, Meinardi MT, Alt F, Gietema JA, Franke JP, Sleijfer DT, Uges DR. Adsorptive voltametry to determine platinum levels in plasma from testicular cancer patients treated with cisplatin. Ther Drug Monit 2001; 23: 169-73.
11. Gerl A, Schierl R. Urinary excretion of platinum in chemotherapy-treated long-term survivors of testicular cancer. Acta Oncol 2000; 39: 519-22.
12. Gietema JA, Meinardi MT, Messerschmidt J, Gelevert T, Alt F, Uges DR, Sleijfer DT. Circulating plasma platinum more than 10 years after cisplatin treatment for testicular cancer. Lancet 2000; 355: 1075-6.
13. Shearan P, Smyth MR. Comparison of voltammetric and graphite furnace atomic absorption spectrometric methods for the direct determination of inorganic platinum in urine. Analyst 1988; 113: 609-12.
14. Vrana O, Brabec V, Kleinwachter V. Polarographic studies on the conformation of some platinum complexes: relations to anti-tumour activity. Anticancer Drug Des 1986; 1: 95-109.
15. Xilei L, Heydorn K, Rietz B. Limit of detection for the determination of Pt in biological material by RNAA using electrolytic separation of gold. Journal of Radioanalytical and Nuclear Chemistry 1992; 160: 85-99.
16. Rietz B, Heydorn K, Krarup-Hansen A. Determination of platinum by neutron activation analysis in nerve tissue from rats treated with cisplatin. Biol Trace Elem Res 1994; 43-45:343-50.: 343-50.
17. Gorodetsky R, Mou X, Vexler A, Kaufman B, Catane R, Loewenthal E. Noninvasive follow-up of platinum pharmacokinetics in the skin of patients on cisplatin chemotherapy. Cancer 1993; 72: 446-54.
18. Seifert WE, Jr., Stewart DJ, Benjamin RS, Caprioli RM. Energy-dispersive X-ray fluorescence determination of platinum in plasma, urine, and cerebrospinal fluid of patients administered cis-dichlorodiammineplatinum(II). Cancer Chemother Pharmacol 1983; 11: 120-3.
19. Jonson R, Mattsson S, Unsgaard B. A method for in vivo analysis of platinum after chemotherapy with cisplatin. Phys Med Biol 1988; 33: 847-57.
20. Stewart DJ, Benjamin RS, Luna M, Feun L, Caprioli R, Seifert W, Loo TL. Human tissue distribution of platinum after cis-diamminedichloroplatinum. Cancer Chemother Pharmacol 1982; 10: 51-4.
21. Dominici C, Alimonti A, Caroli S, Petrucci F, Castello MA. Chemotherapeutic agent cisplatin monitoring in biological fluids by means of inductively-coupled plasma emission spectrometry (ICP-AES). Clin Chim Acta 1986; 158: 207-15.
Chapter 1.2
62
22. Brandsteterova E, Kiss F, Chovancova V, Reichelova V. HPLC analysis of platinum cytostatics. Neoplasma 1991; 38: 415-24.
23. Krull IS, Ding XD, Braverman S, Selavka C, Hochberg F, Sternson LA. Trace analysis for cis-platinum anti-cancer drugs via LCEC. J Chromatogr Sci 1983; 21: 166-73.
24. Bouma M, Nuijen B, Jansen MT, Sava G, Picotti F, Flaibani A, Bult A, Beijnen JH. Development of a LC method for pharmaceutical quality control of the antimetastatic ruthenium complex NAMI-A. J Pharm Biomed Anal 2003; 31: 215-28.
25. Ehrsson H, Wallin I. Liquid chromatographic determination of oxaliplatin in blood using post-column derivatization in a microwave field followed by photometric detection. J Chromatogr B Analyt Technol Biomed Life Sci 2003; 795: 291-4.
26. Smith CJ, wilson ID, Abou-Shakra F, Payne R, Parry TC, Sinclair P, Roberts DW. A comparison of the quantitative methods for the analysis of the platinum-containing anticancer drug [cis-[amminedichloro(2-methylpyridine)]platinum(II)] (ZD0473) by HPLC coupled to either a triple quadrupole mass spectrometer or an inductively coupled plasma mass spectrometer. Anal Chem 2003; 75: 1463-9.
27. Oe T, Tian Y, O'Dwyer PJ, Roberts DW, Malone MD, Bailey CJ, Blair IA. A validated liquid chromatography/tandem mass spectrometry assay for cis-amminedichloro(2-methylpyridine) platinum(II) in human plasma ultrafiltrate. Anal Chem 2002; 74: 591-9.
28. Minakata K, Nozawa H, Okamoto N, Suzuki O. Determination of platinum derived from cisplatin in human tissues using electrospray ionisation mass spectrometry. J Chromatogr B Analyt Technol Biomed Life Sci 2006; 832: 286-91.
29. Tothill P, Matheson LM, Smyth JF. Inductively coupled plasma mass spectrometry for the determination of platinum in animal tissue and a comparison with atomic absorption spectrometry. J Anal Atom Spectrom 1990; 5: 619-22.
30. Jarvis KE, Gray AL, Houk RS. Handbook of inductively coupled plasma mass spectrometry. Chapman & Hall. London: Blackie Academic & Professional, 1992
31. Giessmann U, Greb U. High resolution ICP-MS - A new concept for elemental mass spectrometry. Fresenius J Anal Chem 1994; 350: 186-93.
32. Bings NH. Plasma time-of-flight mass spectrometry as a detector for short transient signals in elemental analysis. Anal Bioanal Chem 2005; 382: 887-90.
33. Evans HE, Giglio JJ. Interferences in inductively coupled plasma mass spectrometry-A review. J Anal Atom Spectrom 1993; 8: 18.
34. Dams RFJ, Goossens J, Moens L. Spectral and non-spectral interferences in inductively coupled plasma mass-spectrometry. Mikrochim Acta 1995; 119: 286.
35. Vanhaecke F, Saverwyns S, de Wannemacker G, Moens L, Dams R. Comparison of the applicaiton of higher mass resolution and cool plasma conditions to avoid spectral interferences in Cr(III)/Cr(VI) speciation by means of high-performance liquid chromatography-inductively coupled plasma mass spectrometry. Anal Chim Acta 2000; 419: 55-64.
36. Feldmann I, Jakubowski N, Thomas C, Struewer D. Application of a hexapole collision and reaction cell in ICP-MS. Part II: Analytical figures of merit and first applications. Fresenius J Anal Chem 1999; 365: 422-8.
37. Nonose N, Kubota M. Non-spectral and spectral interferences in inductively coupled plasma high-resolution mass spectrometry. Part I. Optical characteristics of micro-plasmas observed just behind the sampler and the skimmer in inductively coupled plasma high resolution mass spectrometry. J Anal Atom Spectrom 2001; 16: 551-9.
38. Hsiung CS, Andrade JD, Costa R, Ash KO. Minimizing interferences in the quantitative multielement analysis of trace elements in biological fluids by inductively coupled plasma mass spectrometry. Clin Chem 1997; 43: 2303-11.
39. Brouwers EEM, Tibben MM, Rosing H, Schellens JHM, Beijnen JH. Determination of ruthenium originating from the investigational anti-cancer drug NAMI-A in human plasma ultrafiltrate, plasma, and urine by inductively coupled plasma mass spectrometry. Rapid Commun Mass Spectrom 2007; 21: 1521-30.
40. Lustig L, Zang S, Michalke B, Schramel P, Beck W. Platinum determination in nutrient plants by inductively coupled plasma mass spectrometry with special respect to the hafnium oxide interference. Fresenius J Anal Chem 1997; 357: 1157-63.
41. Rudolph E, Hann S, Stingeder G, Reiter C. Ultra-trace analysis of platinum in human tissue samples. Anal Bioanal Chem 2005; 382: 1500-6.
ICP-MS in oncology
63
42. Rodushkin I, Engstrom E, Stenberg A, Baxter DC. Determination of low-abundance elements at ultra-trace levels in urine and serum by inductively coupled plasma-sector field mass spectrometry. Anal Bioanal Chem 2004; 380: 247-57.
43. Hann S, Koellensperger G, Kanitsar K, Stingeder G, Brunner M, Erovic B, Muller M, Reiter C. Platinum determination by inductively coupled plasma-sector field mass spectrometry (ICP-SFMS) in different matrices relevant to human biomonitoring. Anal Bioanal Chem 2003; 376: 198-204.
44. Thomas R. A beginner's guide to ICP-MS: Part XII - A review of interferences. Spectroscopy 2002; 17: 24-31.
45. U.S.Food and Drug Administration, Center for Drug Evaluation and Research, Guidance for Industry, Bioanalytical Method Validation. FDA. U.S. Food and Drug Administration: Center for Drug Evaluation and Research: Guidance for Industry: Bioanalytical Method Validation. http://www fda gov/cder/ guidance/4252fnl pdf 2001.
46. Rosing H, Man WY, Doyle E, Bult A, Beijnen JH. Bioanalytical liquid chromatography method validation: a review of current practices and procedures. J Liq Chrom & Rel Technol 2000; 23: 329-54.
47. Desoize B, Madoulet C. Particular aspects of platinum compounds used at present in cancer treatment. Crit Rev Oncol Hematol 2002; 42: 317-25.
48. Alessio E, Mestroni G, Bergamo A, Sava G. Ruthenium antimetastatic agents. Curr Top Med Chem 2004; 4: 1525-35.
49. Calvert H, Judson I, van der Vijgh WJ. Platinum complexes in cancer medicine: pharmacokinetics and pharmacodynamics in relation to toxicity and therapeutic activity. Cancer Surv 1993; 17: 189-217.
50. Graham MA, Lockwood GF, Greenslade D, Brienza S, Bayssas M, Gamelin E. Clinical pharmacokinetics of oxaliplatin: a critical review. Clin Cancer Res 2000; 6: 1205-18.
51. Yang Z, Hou X, Jones BT. Determination of platinum in clinical samples. Applied Spectroscopy Reviews 2002; 37: 57-88.
52. De Waal WA, Maessen FJ, Kraak JC. Analytical methodologies for the quantitation of platinum anti-cancer drugs and related compounds in biological media. J Pharm Biomed Anal 1990; 8: 1-30.
53. Tothill P, Klys HS, Matheson LM, McKay K, Smyth JF. The long-term retention of platinum in human tissues following the administration of cisplatin or carboplatin for cancer therapy. Eur J Cancer 1992; 28: 1358-61.
54. Robbins ME, Bywaters TB, Jaenke RS, Hopewell JW, Matheson LM, Tothill P, Whitehouse E. Long-term studies of cisplatin-induced reductions in porcine renal functional reserve. Cancer Chemother Pharmacol 1992; 29: 309-15.
55. Ding H, Goldberg MM, Raymer JH, Holmes J, Stanko J, Chaney SG. Determination of platinum in rat dorsal root ganglion using ICP-MS. Biol Trace Elem Res 1999; 67: 1-11.
56. Screnci D, McKeage MJ, Galettis P, Hambley TW, Palmer BD, Baguley BC. Relationships between hydrophobicity, reactivity, accumulation and peripheral nerve toxicity of a series of platinum drugs. Br J Cancer 2000; 82: 966-72.
57. Boulikas T, Vougiouka M. Cisplatin and platinum drugs at the molecular level. (Review). Oncol Rep 2003; 10: 1663-82.
58. Bose RN. Biomolecular targets for platinum antitumor drugs. Mini Rev Med Chem 2002; 2: 103-11.
59. Eastman A. The formation, isolation and characterization of DNA adducts produced by anticancer platinum complexes. Pharmacol Ther 1987; 34: 155-66.
60. Fichtinger-Schepman AM, van der Veer JL, den Hartog JH, Lohman PH, Reedijk J. Adducts of the antitumor drug cis-diamminedichloroplatinum(II) with DNA: formation, identification, and quantitation. Biochemistry 1985; 24: 707-13.
61. Reedijk J. Why does Cisplatin reach Guanine-N7 with competing S-donor ligands available in the cell? Chem Rev 1999; 99: 2499-510.
62. Centerwall CR, Tacka KA, Kerwood DJ, Goodisman J, Toms BB, Dubowy RL, Dabrowiak JC. Modification and uptake of a cisplatin carbonato complex by Jurkat cells. Mol Pharmacol 2006; 70: 348-55.
63. Bonetti A, Apostoli P, Zaninelli M, Pavanel F, Colombatti M, Cetto GL, Franceschi T, Sperotto L, Leone R. Inductively coupled plasma mass spectroscopy quantitation of platinum-DNA adducts in peripheral blood leukocytes of patients receiving cisplatin- or carboplatin-based chemotherapy. Clin Cancer Res 1996; 2: 1829-35.
64. Liu J, Kraut E, Bender J, Brooks R, Balcerzak S, Grever M, Stanley H, D'Ambrosio S, Gibson-D'Ambrosio R, Chan KK. Pharmacokinetics of oxaliplatin (NSC 266046) alone and in combination with paclitaxel in cancer patients. Cancer Chemother Pharmacol 2002; 49: 367-74.
Chapter 1.2
64
65. Cooper BW, Veal GJ, Radivoyevitch T, Tilby MJ, Meyerson HJ, Lazarus HM, Koc ON, Creger RJ, Pearson G, Nowell GM, Gosky D, Ingalls ST, Hoppel CL, Gerson SL. A phase I and pharmacodynamic study of fludarabine, carboplatin, and topotecan in patients with relapsed, refractory, or high-risk acute leukemia. Clin Cancer Res 2004; 10: 6830-9.
66. McDonald ES, Randon KR, Knight A, Windebank AJ. Cisplatin preferentially binds to DNA in dorsal root ganglion neurons in vitro and in vivo: a potential mechanism for neurotoxicity. Neurobiol Dis 2005; 18: 305-13.
67. Rice JR, Gerberich JL, Nowotnik DP, Howell SB. Preclinical efficacy and pharmacokinetics of AP5346, a novel diaminocyclohexane-platinum tumor-targeting drug delivery system. Clin Cancer Res 2006; 12: 2248-54.
68. Walker DL, Reid JM, Svingen PA, Rios R, Covey JM, Alley MC, Hollingshead MG, Budihardjo II, Eckdahl S, Boerner SA, Kaufmann SH, Ames MM. Murine pharmacokinetics of 6-aminonicotinamide (NSC 21206), a novel biochemical modulating agent. Biochem Pharmacol 1999; 58: 1057-66.
69. Bible KC, Boerner SA, Kirkland K, Anderl KL, Bartelt D, Jr., Svingen PA, Kottke TJ, Lee YK, Eckdahl S, Stalboerger PG, Jenkins RB, Kaufmann SH. Characterization of an ovarian carcinoma cell line resistant to cisplatin and flavopiridol. Clin Cancer Res 2000; 6: 661-70.
70. Azim-Araghi A, Ottley CJ, Pearson DG, Tilby MJ. Sensitive detection of platinum-bound DNA using ICP-MS and comparison to graphite furnace atomic absorption spectroscopy (GFAAS). In: Plasma Source Mass Spectrometry. Holland JG, Tanner SD, eds. Holland JG, Tanner SD, eds.: Royal Society of Chemistry, 2001: 412-8
71. John T et al. Determination, by ICP-MS, of background and BBR 3464 induced levels of platinum bound to DNA isolated from blood cells: a comparison of the sensitivity of the perkin elmer sciex elan 6000 and the thermofinnigan neptune instruments. In: Plasma Source Spectrometry. Holland JG, Tanner SD, eds. Holland JG, Tanner SD, eds.: Royal Society of Chemistry, 2003: 82-90
72. Yamada K, Kato N, Takagi A, Koi M, Hemmi H. One-milliliter wet-digestion for inductively coupled plasma mass spectrometry (ICP-MS): determination of platinum-DNA adducts in cells treated with platinum(II) complexes. Anal Bioanal Chem 2005; 382: 1702-7.
73. Ta LE, Espeset L, Podratz J, Windebank AJ. Neurotoxicity of oxaliplatin and cisplatin for dorsal root ganglion neurons correlates with platinum-DNA binding. Neurotoxicology 2006; 27: 992-1002.
74. Zhang J, Zhao X. Synthesis, cytotoxicity and DNA-binding levels of ammine/propylamine platinum(II) complexes with carboxylates. Eur J Med Chem 2007; 42: 286-91.
75. Bjorn E, Nygren Y, Nguyen TT, Ericson C, Nojd M, Naredi P. Determination of platinum in human subcellular microsamples by inductively coupled plasma mass spectrometry. Anal Biochem 2007; 363: 135-42.
76. Lenz K, Hann S, Koellensperger G, Stefanka Z, Stingeder G, Weissenbacher N, Mahnik SN, Fuerhacker M. Presence of cancerostatic platinum compounds in hospital wastewater and possible elimination by adsorption to activated sludge. Sci Total Environ 2005; 345: 141-52.
77. Barefoot RR. Determination of platinum at trace levels in environmental and biological samples. Environmental Science & Technology 1997; 31: 309-14.
78. Morazzoni F, Canevali C, Moschetti I, Todeschini R, Caroli S, Alimonti A, Petrucci F, Ravasi G, Bedini AV, Milani F, . Determination of platinum in plasma of patients affected by inoperable lung carcinoma treated with radiotherapy and concurrent low-dose continuous infusion of cis-dichlorodiammine platinum(II). Cancer Chemother Pharmacol 1995; 35: 529-32.
79. Liu J, Kraut EH, Balcerzak S, Grever M, D'Ambrosio S, Chan KK. Dosing sequence-dependent pharmacokinetic interaction of oxaliplatin with paclitaxel in the rat. Cancer Chemother Pharmacol 2002; 50: 445-53.
80. Sessa C, Minoia C, Ronchi A, Zucchetti M, Bauer J, Borner M, de Jong J, Pagani O, Renard J, Weil C, D'Incalci M. Phase I clinical and pharmacokinetic study of the oral platinum analogue JM216 given daily for 14 days. Ann Oncol 1998; 9: 1315-22.
81. Sessa C, Capri G, Gianni L, Peccatori F, Grasselli G, Bauer J, Zucchetti M, Vigano L, Gatti A, Minoia C, Liati P, Van den BS, Bernareggi A, Camboni G, Marsoni S. Clinical and pharmacological phase I study with accelerated titration design of a daily times five schedule of BBR3464, a novel cationic triplatinum complex. Ann Oncol 2000; 11: 977-83.
82. Carr JL, Tingle MD, McKeage MJ. Rapid biotransformation of satraplatin by human red blood cells in vitro. Cancer Chemother Pharmacol 2002; 50: 9-15.
83. Casetta B, Roncadin M, Montanari G, Fulanut M. Determination of platinum in biological fluids by ICP-mass spectrometry. Atomic Spectroscopy 1991; 12: 81-6.
ICP-MS in oncology
65
84. Allain P, Berre S, Mauras Y, Le Bouil A. Evaluation of inductively coupled mass spectrometry for the determination of platinum in plasma. Biol Mass Spectrom 1992; 21: 141-3.
85. Gamelin E, Allain P, Maillart P, Turcant A, Delva R, Lortholary A, Larra F. Long-term pharmacokinetic behavior of platinum after cisplatin administration. Cancer Chemother Pharmacol 1995; 37: 97-102.
86. Gamelin E, Bouil AL, Boisdron-Celle M, Turcant A, Delva R, Cailleux A, Krikorian A, Brienza S, Cvitkovic E, Robert J, Larra F, Allain P. Cumulative pharmacokinetic study of oxaliplatin, administered every three weeks, combined with 5-fluorouracil in colorectal cancer patients. Clin Cancer Res 1997; 3: 891-9.
87. Morrison JG, White P, McDougall S, Firth JW, Woolfrey SG, Graham MA, Greenslade D. Validation of a highly sensitive ICP-MS method for the determination of platinum in biofluids: application to clinical pharmacokinetic studies with oxaliplatin. J Pharm Biomed Anal 2000; 24: 1-10.
88. Ziegler E, Mason HJ, Baxter PJ. Occupational exposure to cytotoxic drugs in two UK oncology wards. Occup Environ Med 2002; 59: 608-12.
89. Turci R, Sottani C, Spagnoli G, Minoia C. Biological and environmental monitoring of hospital personnel exposed to antineoplastic agents: a review of analytical methods. J Chromatogr B Analyt Technol Biomed Life Sci 2003; 789: 169-209.
90. Bettinelli M, Spezia S, Ronchi A, Minoia C. Determination of Pt in biological fluids with ICP-MS: Evaluation of analytical uncertainty. Atom Spectrosc 2004; 25: 103-11.
91. Mason HJ, Blair S, Sams C, Jones K, Garfitt SJ, Cuschieri MJ, Baxter PJ. Exposure to antineoplastic drugs in two UK hospital pharmacy units. Ann Occup Hyg 2005; 49: 603-10.
92. Siim BG, Lee AE, Shalal-Zwain S, Pruijn FB, McKeage MJ, Wilson WR. Marked potentiation of the antitumour activity of chemotherapeutic drugs by the antivascular agent 5,6-dimethylxanthenone-4-acetic acid (DMXAA). Cancer Chemother Pharmacol 2003; 51: 43-52.
93. Johnsson A, Bjork H, Schutz A, Skarby T. Sample handling for determination of free platinum in blood after cisplatin exposure. Cancer Chemother Pharmacol 1998; 41: 248-51.
94. McCurdy E, Potter D. Optimising ICP-MS for the determination of trace metals in high matrix samples. Spectroscopy Europe 2001; 13: 10-3.
95. Hann S, Koellensperger G, Stefanka Z, Stingeder G, Furhacker M, Buchberger W, Mader RM. Application of HPLC-ICP-MS to speciation of cisplatin and its degradation products in water containing different chloride concentrations and in human urine. J Anal Atom Spectrom 2003; 18: 1391-5.
96. Tothill P, Matheson LM, Robbins ME, Hopewell JW, McKay K, Smyth JF. Long-term retention and distribution of platinum in animals after cisplatin administration. Cancer Therapy and Control 1992; 2: 275-87.
97. Minami T, Hashii K, Tateyama I, Kadota E, Tohno Y, Tohno S, Utsumi M, Yamada MO, Ichii M, Namikawa K, . Accumulation of platinum in the intervertebral discs and vertebrae of ovarian tumor-bearing patients treated with cisplatin. Biol Trace Elem Res 1994; 42: 253-7.
98. Minami T, Ichii M, Okazaki Y. Comparison of three different methods for measurement of tissue platinum level. Biol Trace Elem Res 1995; 48: 37-44.
99. Liang X, Huang Y. Physical state changes of membrane lipids in human lung adenocarcinoma A(549) cells and their resistance to cisplatin. Int J Biochem Cell Biol 2002; 34: 1248-55.
100. Ghezzi A, Aceto M, Cassino C, Gabano E, Osella D. Uptake of antitumor platinum(II)-complexes by cancer cells, assayed by inductively coupled plasma mass spectrometry (ICP-MS). J Inorg Biochem 2004; 98: 73-8.
101. Samimi G, Kishimoto S, Manorek G, Breaux JK, Howell SB. Novel mechanisms of platinum drug resistance identified in cells selected for resistance to JM118 the active metabolite of satraplatin. Cancer Chemother Pharmacol 2007; 59: 301-12.
102. Perry BJ, Balazs RE. ICP-MS method for the determination of platinum in suspensions of cells exposed to cisplatin. Analytical Proceedings including Analytical Communications 1994; 31: 269-71.
103. Hanada T, Isobe H, Saito T, Ogura S, Takekawa H, Yamazaki K, Tokuchi Y, Kawakami Y. Intracellular accumulation of thallium as a marker of cisplatin cytotoxicity in nonsmall cell lung carcinoma: an application of inductively coupled plasma mass spectrometry. Cancer 1998; 83: 930-5.
104. Hanada T, Isobe H, Saitoh T, Ogura S, Saito K, Kawakami Y. Inductively coupled plasma mass spectrometry for the determination of platinum accumulation in human non-small cell lung cancer cell lines. Int J Clin Oncol 1998; 3: 98-101.
105. Zoriy M, Matusch A, Spruss T, Becker S. Laser ablation inductively coupled plasma mass spectrometry for imaging of copper, zinc, and platinum in this sections of a kidney from a mouse treated with cisplatin. International Journal of Mass Spectrometry 2007; 260: 102-6.
Chapter 1.2
66
106. Mason HJ, Morton J, Garfitt SJ, Iqbal S, Jones K. Cytotoxic drug contamination on the outside of vials delivered to a hospital pharmacy. Ann Occup Hyg 2003; 47: 681-5.
107. Brouwers EEM, Huitema ADR, Bakker EN, Douma JW, Schimmel KJ, van Weringh G, de Wolf PJ, Schellens JHM, Beijnen JH. Monitoring of platinum surface contamination in seven Dutch hospital pharmacies using inductively coupled plasma mass spectrometry. Int Arch Occup Environ Health 2007; 80:689-99.
108. Wittgen BP, Kunst PW, Perkins WR, Lee JK, Postmus PE. Assessing a system to capture stray aerosol during inhalation of nebulized liposomal cisplatin. J Aerosol Med 2006; 19: 385-91.
109. De Boer JL, Ritsema R, Piso S, Van Staden H, Van Den BW. Practical and quality-control aspects of multi-element analysis with quadrupole ICP-MS with special attention to urine and whole blood. Anal Bioanal Chem 2004; 379: 872-80.
110. Thompson JJ, Houk RS. A study of internal standardisation in inductively coupled plasma-mass spectrometry. Applied Spectroscopy 1987; 41: 801806.
111. Polec-Pawlak K, Abramski JK, Semenova O, Hartinger CG, Timerbaev AR, Keppler BK, Jarosz M. Platinum group metallodrug-protein binding studies by capillary electrophoresis - inductively coupled plasma-mass spectrometry: a further insight into the reactivity of a novel antitumor ruthenium(III) complex toward human serum proteins. Electrophoresis 2006; 27: 1128-35.
112. Gamelin E, Boisdron-Celle M, Lebouil A, Turcant A, Cailleux A, Krikorian A, Brienza S, Cvitkovic E, Larra F, Robert J, Allain P. Determination of unbound platinum after oxaliplatin administration: comparison of currently available methods and influence of various parameters. Anticancer Drugs 1998; 9: 223-8.
113. Todoli JL, Mermet JM. Sample introduction systems for the analysis of liquid microsamples by ICP-AES and ICP-MS. Spectrochimica Acta Part B 2006; 61: 239-83.
114. Zhao Z, Tepperman K, Dorsey JG, Elder RC. Determination of cisplatin and some possible metabolites by ion-pairing chromatography with inductively coupled plasma mass spectrometric detection. J Chromatogr 1993; 615: 83-9.
115. Bell DN, Liu JJ, Tingle MD, McKeage MJ. Specific determination of intact cisplatin and monohydrated cisplatin in human plasma and culture medium ultrafiltrates using HPLC on-line with inductively coupled plasma mass spectrometry. J Chromatogr B Analyt Technol Biomed Life Sci 2006; 837: 29-34.
116. Vacchina V, Torti L, Allievi C, Lobinski R. Sensitive species-specific monitoring of a new triplatinum anti-cancer drug and its potential related compounds in spiked human plasma by cation-exchange HPLC-ICP-MS. J Anal Atom Spectrom 2003; 18: 884-90.
117. Cairns WRL, Ebdon L, Hill SJ. Development of an HPLC-ICP-MS method for the determination of platinum species from new anti-tumour drugs. Analytical Proceedings including Analytical Communications 1994; 31: 295-7.
118. Cairns WR, Ebdon L, Hill SJ. A high performance liquid chromatography - inductively coupled plasma-mass spectrometry interface employing desolvation for speciation studies of platinum in chemotherapy drugs. Anal Bioanal Chem 1996; 355: 202-8.
119. Galettis P, Carr L, Paxton JW, McKeage MJ. Quantitative determination of platinum complexes in human plasma generated from the oral antitumour drug JM216 using directly coupled high-performance liquid chromatography-inductively coupled plasma mass spectrometry without desolvation. J Anal Atom Spectrom 1999; 14: 953-6.
120. Allain P, Heudi O, Cailleux A, Le Bouil A, Larra F, Boisdron-Celle M, Gamelin E. Early biotransformations of oxaliplatin after its intravenous administration to cancer patients. Drug Metab Dispos 2000; 28: 1379-84.
121. Wang K, Lu J, Li R. The events that occur when cisplatin encounters cells. Coordination Chemistry Reviews 1996; 151: 53-88.
122. Timerbaev AR, Aleksenko SS, Polec-Pawlak K, Ruzik R, Semenova O, Hartinger CG, Oszwaldowski S, Galanski M, Jarosz M, Keppler BK. Platinum metallodrug-protein binding studies by capillary electrophoresis-inductively coupled plasma-mass spectrometry: characterization of interactions between Pt(II) complexes and human serum albumin. Electrophoresis 2004; 25: 1988-95.
123. Heudi O, Cailleux A, Allain P. Kinetic studies of the reactivity between cisplatin and its monoaquo species with L-methionine. J Inorg Biochem 1998; 71: 61-9.
124. Lecomte T, Landi B, Beaune P, Laurent-Puig P, Loriot MA. Glutathione S-transferase P1 polymorphism (Ile105Val) predicts cumulative neuropathy in patients receiving oxaliplatin-based chemotherapy. Clin Cancer Res 2006; 12: 3050-6.
ICP-MS in oncology
67
125. Stoehlmacher J, Park DJ, Zhang W, Groshen S, Tsao-Wei DD, Yu MC, Lenz HJ. Association between glutathione S-transferase P1, T1, and M1 genetic polymorphism and survival of patients with metastatic colorectal cancer. J Natl Cancer Inst 2002; 19;94: 936-42.
126. Oldenburg J, Kraggerud SM, Cvancarova M, Lothe RA, Fossa SD. Cisplatin-induced long-term hearing impairment is associated with specific glutathione s-transferase genotypes in testicular cancer survivors. J Clin Oncol 2007; 25: 708-14.
127. Khalaila I, Bergamo A, Bussy F, Sava G, Dyson PJ. The role of cisplatin and NAMI-A plasma-protein interactions in relation to combination therapy. Int J Oncol 2006; 29: 261-8.
128. Pluim D, van Waardenburg RC, Beijnen JH, Schellens JH. Cytotoxicity of the organic ruthenium anticancer drug Nami-A is correlated with DNA binding in four different human tumor cell lines. Cancer Chemother Pharmacol 2004; 54: 71-8.
129. Kratz F, Hartmann M, Keppler B, Messori L. The binding properties of two antitumor ruthenium(III) complexes to apotransferrin. J Biol Chem 1994; 269: 2581-8.
130. Messori L, Orioli P, Vullo D, Alessio E, Iengo E. A spectroscopic study of the reaction of NAMI, a novel ruthenium(III)anti-neoplastic complex, with bovine serum albumin. Eur J Biochem 2000; 267: 1206-13.
131. Pongratz M, Schluga P, Jakupec MA, Arion VB, Hartinger CG, Allmaier G, Keppler BK. Transferrin binding and transferrin-mediated cellular uptake of the ruthenium coordination compound KP1019, studied by means of AAS, ESI-MS and CD spectroscopy. J Anal Atom Spectrom 2004; 19: 46-51.
132. Falter R, Wilken RD. Determination of carboplatinum and cisplatinum by interfacing HPLC with ICP-MS using ultrasonic nebulisation. Sci Total Environ 1999; 225: 167-76.
133. Hann S, Stefanka Z, Lenz K, Stingeder G. Novel separation method for highly sensitive speciation of cancerostatic platinum compounds by HPLC-ICP-MS. Anal Bioanal Chem 2005; 381: 405-12.
134. Lenz K, Koellensperger G, Hann S, Weissenbacher N, Mahnik SN, Fuerhacker M. Fate of cancerostatic platinum compounds in biological wastewater treatment of hospital effluents. Chemosphere 2007; epub ahead of print.
135. Zoorob GK, McKiernan JW, Caruso JA. ICP-MS for elemental speciation studies. Mikrochim Acta 1998; 128: 145-68.
136. Garcia Sar D, Montes-Bayon M, Blanco Gonzalez E, Sanz-Medel A. Speciation studies of cisplatin adducts with DNA nucleotides via elemental specific detection (P and Pt) using liquid chromatography-inductively coupled plasma-mass spectrometry and structural characterization by electrospray mass spectrometry. J Anal Atom Spectrom 2006; 21: 861-8.
137. El Khateeb M, Appleton TG, Charles BG, Gahan LR. Development of HPLC conditions for valid determination of hydrolysis products of cisplatin. J Pharm Sci 1999; 88: 319-26.
138. Xie R, Johnson W, Rodriguez L, Gounder M, Hall GS, Buckley B. A study of the interactions between carboplatin and blood plasma proteins using size exclusion chromatography coupled to inductively coupled plasma mass spectrometry. Anal Bioanal Chem 2007; 387: 2815-22.
139. Mandal R, Teixeira C, Li XF. Studies of cisplatin and hemoglobin interactions using nanospray mass spectrometry and liquid chromatography with inductively-coupled plasma mass spectrometry. Analyst 2003; 128: 629-34.
140. Mandal R, Kalke R, Li XF. Interaction of oxaliplatin, cisplatin, and carboplatin with hemoglobin and the resulting release of a heme group. Chem Res Toxicol 2004; 17: 1391-7.
141. Zhao YY, Mandal R, Li XF. Intact human holo-transferrin interaction with oxaliplatin. Rapid Commun Mass Spectrom 2005; 19: 1956-62.
142. Szpunar J, Makarov A, Pieper T, Keppler BK, Lobinski R. Investigation of metallodrug-protein interactions by size-exclusion chromatography coupled with inductively coupled plasma mass spectrometry (ICP-MS). Anal Chim Acta 1999; 387: 135-44.
143. Sulyok M, Hann S, Hartinger CG, Keppler BK, Stingeder G, Koellensperger G. Two dimensional separation schemes for investigation of the interaction of an anticancer ruthenium(III) compound with plasma proteins. J Anal Atom Spectrom 2005; 20: 856-63.
144. Hartinger CG, Hann S, Koellensperger G, Sulyok M, Groessl M, Timerbaev AR, Rudnev AV, Stingeder G, Keppler BK. Interactions of a novel ruthenium-based anticancer drug (KP1019 or FFC14a) with serum proteins--significance for the patient. Int J Clin Pharmacol Ther 2005; 43: 583-5.
145. Stefanka Z, Hann S, Koellensperger G, Stingeder G. Investigation of the reaction of cisplatin with methionine in aqueous media using HPLC-ICP-DRCMS. J Anal Atom Spectrom 2004; 19: 894-8.
146. Morrison JG, Bissett D, Stephens IFD, McKay K, Brown R, Graham MA, Fichtinger-Schepman AM, Kerr DJ. The isolation and identification of cis-diamminedichloroplatinum(II)-DNA adducts by anion exchange HPLC and inductively coupled plasma mass spectrometry. Int J Oncol 1993; 2: 33-7.
Chapter 1.2
68
147. Hann S, Zenker A, Galanski M, Bereuter TL, Stingeder G, Keppler BK. HPIC-UV-ICP-SFMS study of the interaction of cisplatin with guanosine monophosphate. Fresenius J Anal Chem 2001; 370: 581-6.
148. Lustig S, de Kimpe J, Cornelis R, Schramel P. Development of native two-dimensional electrophoresis methods for the separation and detection of platinum carrying serum proteins: initial steps. Fresenius J Anal Chem 1999; 363: 484-7.
149. Morazzoni F, Canevali C, Zucchetti M, Caroli S, Alimonti A, Petrucci F, Giudice G, Masoni E, Bedini AV. cis-Diamminedichloroplatinum(II) given in low-dose continuous infusion with concurrent radiotherapy to patients affected by inoperable lung carcinoma: a pharmacokinetic approach. J Cancer Res Clin Oncol 1998; 124: 37-43.
150. Holmes J, Stanko J, Varchenko M, Ding H, Madden VJ, Bagnell CR, Wyrick SD, Chaney SG. Comparative neurotoxicity of oxaliplatin, cisplatin, and ormaplatin in a Wistar rat model. Toxicol Sci 1998; 46: 342-51.
151. Screnci D, Galettis P, Baguley BC, McKeage MJ. Optimization of an ICP-MS assay for the detection of trace levels of platinum in peripheral nerves. Atom Spectrosc 1998; 19: 172-5.
152. Filippich LJ, Bucher AM, Charles BG. Platinum pharmacokinetics in sulphur-crested cockatoos (Cacatua galerita) following single-dose cisplatin infusion. Aust Vet J 2000; 78: 406-11.
153. Jamieson SM, Liu J, Hsu T, Baguley BC, McKeage MJ. Paclitaxel induces nucleolar enlargement in dorsal root ganglion neurons in vivo reducing oxaliplatin toxicity. Br J Cancer 2003; 88: 1942-7.
154. Kolb RJ, Ghazi AM, Barfuss DW. Inhibition of basolateral transport and cellular accumulation of cDDP and N-acetyl- L-cysteine-cDDP by TEA and PAH in the renal proximal tubule. Cancer Chemother Pharmacol 2003; 51: 132-8.
155. Charlier C, Kintz P, Dubois N, Plomteux G. Fatal overdosage with cisplatin. J Anal Toxicol 2004; 28: 138-40.
156. Filippich LJ, Charles BG, Sutton RH, Bucher AM. Carboplatin pharmacokinetics following a single-dose infusion in sulphur-crested cockatoos (Cacatua galerita). Aust Vet J 2004; 82: 366-9.
157. Ekborn A, Hansson J, Ehrsson H, Eksborg S, Wallin I, Wagenius G, Laurell G. High-dose Cisplatin with amifostine: ototoxicity and pharmacokinetics. Laryngoscope 2004; 114: 1660-7.
158. Smit T, Snyman JR, Neuse EW, Bohm L, van Rensburg CE. Evaluation of cisplatin and a novel platinum polymer conjugate for drug toxicity and drug distribution in mice. Anticancer Drugs 2005; 16: 501-6.
159. Royer B, Guardiola E, Polycarpe E, Hoizey G, Delroeux D, Combe M, Chaigneau L, Samain E, Chauffert B, Heyd B, Kantelip JP, Pivot X. Serum and intraperitoneal pharmacokinetics of cisplatin within intraoperative intraperitoneal chemotherapy: influence of protein binding. Anticancer Drugs 2005; 16: 1009-16.
160. Lardinois D, Jung FJ, Opitz I, Rentsch K, Latkoczy C, Vuong V, Varga Z, Rousson V, Gunther D, Bodis S, Stahel R, Weder W. Intrapleural topical application of cisplatin with the surgical carrier Vivostat increases the local drug concentration in an immune-competent rat model with malignant pleuromesothelioma. J Thorac Cardiovasc Surg 2006; 131: 697-703.
161. Pasqua AJ, Goodisman J, Kerwood DJ, Toms BB, Dubowy RL, Dabrowiak JC. Role of carbonate in the cytotoxicity of Carboplatin. Chem Res Toxicol 2007; 20: 896-904.
162. Pohlen U, Rieger H, Meyer BT, Loddenkemper C, Buhr HJ, Heitland P, Koester HD, Schneider P. Chemoembolization of lung metastases--pharmacokinetic behaviour of carboplatin in a rat model. Anticancer Res 2007; 27: 809-15.
163. Turci R, Sottani C, Ronchi A, Minoia C. Biological monitoring of hospital personnel occupationally exposed to antineoplastic agents. Toxicol Lett 2002; 134: 57-64.
164. Guerbet M, Goulle JP, Lubrano J. Evaluation of the risk of contamination of surgical personnel by vaporisation of oxaliplatin during the intraoperative hyperthermic intraperitoneal chemotherapy (HIPEC). Eur J Surg Oncol 2007; 33:623-6.
165. Smith CJ, wilson ID, Abou-Shakra F, Payne R, Grisedale H, Long A, Roberts D, Malone M. Analysis of a [14C]-labelled platinum anticancer compound in dosing formulations and urine using a combination of HPLC-ICPMS and flow scintillation counting. Chromatographia 2002; 55: S-151-S-155.
166. Heudi O, Brisset H, Cailleux A, Allain P. Chemical instability and methods for measurement of cisplatin adducts formed by interactions with cysteine and glutathione. Int J Clin Pharmacol Ther 2001; 39: 344-9.
167. Azim-Araghi A, Ottley CJ, Pearson DG, Tilby MJ. Combination of ICP-MS and ion exchange chromatography permits analyses of specific cisplatin DNA modifications formed in cancer cells. In: Plasma Source Mass Spectrometry. Holland JG, Tanner SD, eds. Holland JG, Tanner SD, eds.: Royal Society of Chemistry, 2003: 66-73
ICP-MS in oncology
69
168. Mandal R, Kalke R, Li XF. Mass spectrometric studies of cisplatin-induced changes of hemoglobin. Rapid Commun Mass Spectrom 2003; 17: 2748-54.
169. Mandal R, Jiang G, Li XF. Direct evidence for co-binding of cisplatin and cadmium to a native zinc- and cadmium-containing metallothionein. Appl Organometal Chem 2003; 17: 675-81.
170. Meczes EL, Azim-Araghi A, Ottley CJ, Pearson DG, Tilby MJ. Specific adducts recognised by a monoclonal antibody against cisplatin-modified DNA. Biochem Pharmacol 2005; 70: 1717-25.
171. Mandal R, Sawyer MB, Li XF. Mass spectrometry study of hemoglobin-oxaliplatin complexes in colorectal cancer patients and potential association with chemotherapeutic responses. Rapid Commun Mass Spectrom 2006; 20: 2533-8.
172. Timerbaev AR, Foteeva LS, Rudnev AV, Abramski JK, Polec-Pawlak K, Hartinger CG, Jarosz M, Keppler BK. Probing the stability of serum protein-ruthenium(III) drug adducts in the presence of extracellular reductants using CE. Electrophoresis 2007; 28: 2235-40.
173. Crul M, van Waardenburg RC, Beijnen JH, Schellens JH. DNA-based drug interactions of cisplatin. Cancer Treat Rev 2002; 28: 291-303.

Chapter 2
Determination of platinum and ruthenium in biological fluids

Chapter 2.1
Determination of oxaliplatin in human plasma and plasma ultrafiltrate by
graphite-furnace atomic-absorption-spectrometry
Elke E.M. Brouwers Matthijs M. Tibben
Markus Joerger Olaf van Tellingen
Hilde Rosing Jan H.M. Schellens
Jos H. Beijnen
Analytical and Bioanalytical Chemistry 2005; 382; 1484-1490
Chapter 1.2
74
Abstract
A method for the sensitive determination of the anticancer agent oxaliplatin in human
plasma and human plasma ultrafiltrate is presented. The method is based on the
quantification of platinum (Pt) by graphite-furnace atomic-absorption-spectrometry,
with Zeeman correction and an atomisation temperature of 2700 °C. Sample
pretreatment involves dilution of the samples with a solution containing 0.15 M NaCl
and 0.20 M HCl in water. Validation was performed in accordance with the most recent
FDA guidelines for bioanalytical method validation. All results were within requirements.
The validated ranges of quantification were 19.5-1.95x10⁴ µg/L Pt for human plasma
ultrafiltrate and 97.5-1.95x10⁴ µg/L Pt for plasma. The assay is now successfully used to
support pharmacokinetic studies in cancer patients treated with oxaliplatin.
Determination of platinum by GF-AAS
75
Introduction
Effective platinum (Pt) anticancer agents, for example cisplatin, were discovered in the
1960s [1]. Clinical use of cisplatin is, however, often accompanied by severe side effects,
such as nephrotoxicity and neurotoxicity, and some cancers have intrinsic resistance to
cisplatin or develop resistance during cisplatin treatment [2]. The search for Pt
anticancer agents with less severe side effects and increased efficacy has led to the
development of several Pt-based compounds, including oxaliplatin [(1R,-2R)-1,2-
cyclohexanediamine-N,N´] [oxalato (2-)-O,O´]platinum; Figure 1), which differs from
cisplatin by the presence of a diaminocyclohexane (DACH) ligand and an oxalato group
in its chemical structure. The drug was first introduced into clinical trials in 1986 [3] and
has preclinical and clinical activity against a wide variety of tumour types, including
colorectal cancer [4-6].
Figure 1. Chemical structure of oxaliplatin
Currently, oxaliplatin (Eloxatin®) is part of the standard first-line treatment in patients
with colorectal cancer. Quantitative determination of the drug in clinical samples is a
prerequisite in determining the pharmacokinetics of this Pt-based agent. Atomic
absorption spectrometry (AAS) is one of the most widely used spectrometric techniques
for specific determination of elements, including Pt, in biological materials. Graphite-
furnace atomic-absorption-spectrometry (GF-AAS), has good sensitivity and needs a
sample volume of only 20 µL. GF-AAS methods have been developed and validated for
the determination of Pt in biological fluids for patients receiving carboplatin [7,8],
cisplatin [9], cisplatin in a liposomal source, SPI-77 [10], polymer bound Pt AP5280 [11]
and the orally available Pt derivative, JM216 [12]. Although oxaliplatin has been used
since 1986 and has previously been analysed by use of GF-AAS [13-16], to the best of our
knowledge no GF-AAS method validation has been described for this drug. In this and
previous GF-AAS method development we observed that the ligands around the Pt
atom can affect quantification of the Pt compound using atomic absorption
spectrometry. Hence, a GF-AAS method should be validated for each Pt compound
individually, including oxaliplatin.
For analysis of Pt in biological matrices it is necessary to discriminate between bound
and free Pt in blood. Similar to other Pt compounds, oxaliplatin rapidly becomes
partitioned into protein-bound plasma Pt, tissue Pt, erythrocyte-sequestered Pt, and free
plasma Pt [17,18]. The free, ultrafilterable Pt is the active compound, whereas Pt bound
Pt
O
O
O
O
NH
2
NH2
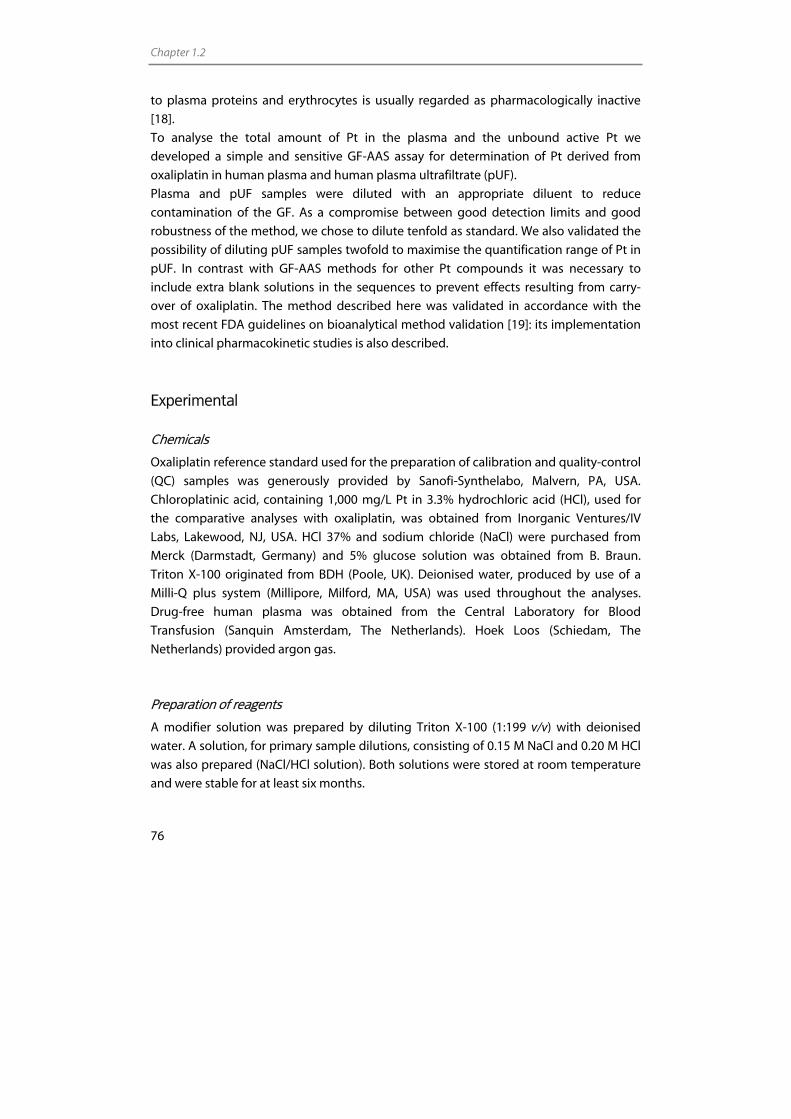
Chapter 1.2
76
to plasma proteins and erythrocytes is usually regarded as pharmacologically inactive
[18].
To analyse the total amount of Pt in the plasma and the unbound active Pt we
developed a simple and sensitive GF-AAS assay for determination of Pt derived from
oxaliplatin in human plasma and human plasma ultrafiltrate (pUF).
Plasma and pUF samples were diluted with an appropriate diluent to reduce
contamination of the GF. As a compromise between good detection limits and good
robustness of the method, we chose to dilute tenfold as standard. We also validated the
possibility of diluting pUF samples twofold to maximise the quantification range of Pt in
pUF. In contrast with GF-AAS methods for other Pt compounds it was necessary to
include extra blank solutions in the sequences to prevent effects resulting from carry-
over of oxaliplatin. The method described here was validated in accordance with the
most recent FDA guidelines on bioanalytical method validation [19]: its implementation
into clinical pharmacokinetic studies is also described.
Experimental
Chemicals
Oxaliplatin reference standard used for the preparation of calibration and quality-control
(QC) samples was generously provided by Sanofi-Synthelabo, Malvern, PA, USA.
Chloroplatinic acid, containing 1,000 mg/L Pt in 3.3% hydrochloric acid (HCl), used for
the comparative analyses with oxaliplatin, was obtained from Inorganic Ventures/IV
Labs, Lakewood, NJ, USA. HCl 37% and sodium chloride (NaCl) were purchased from
Merck (Darmstadt, Germany) and 5% glucose solution was obtained from B. Braun.
Triton X-100 originated from BDH (Poole, UK). Deionised water, produced by use of a
Milli-Q plus system (Millipore, Milford, MA, USA) was used throughout the analyses.
Drug-free human plasma was obtained from the Central Laboratory for Blood
Transfusion (Sanquin Amsterdam, The Netherlands). Hoek Loos (Schiedam, The
Netherlands) provided argon gas.
Preparation of reagents
A modifier solution was prepared by diluting Triton X-100 (1:199 v/v) with deionised
water. A solution, for primary sample dilutions, consisting of 0.15 M NaCl and 0.20 M HCl
was also prepared (NaCl/HCl solution). Both solutions were stored at room temperature
and were stable for at least six months.
Determination of platinum by GF-AAS
77
Preparation of stock solutions, calibration standards, and quality control samples
Two stock solutions of 390 mg/L Pt (corresponding to 795 mg/L oxaliplatin) were
prepared by independent weighing in 5% glucose solution. One solution was further
diluted to a concentration of 19.9 mg/L and served as a working solution for the
calibration standards. The other solution was further diluted to a concentration of 117
mg/L to obtain a working solution for the QC samples. Working solutions were stored at
2-8 °C.
The 19.9 mg/L working solution was further diluted with 1:9 (v/v) Pt-free plasma or pUF
and NaCl/HCl solution to obtain calibration standards at seven concentrations ranging
from 9.75-390 µg/L Pt, corresponding to 97.5-3,90x10³ µg/L Pt in the undiluted matrix.
From the calibration standards, the 390 µg/L standard was divided into 1,200 µL
portions and the remaining standards into 200 µL portions. The standards were stored at
–20 °C. The 117 mg/L working solution was used to spike Pt-free plasma and pUF to
obtain QC samples at four concentrations (97.5, 293, 975, and 3,51x10³ µg/L Pt). Two
additional levels were also prepared. The first, used for pUF, was prepared to validate the
ability to quantify samples below the lower limit of quantitation (<LLOQ; 19.5 µg/L in
pUF). The second, used for pUF and plasma, was prepared to validate the ability to
quantify samples originally exceeding the upper limit of quantification (>ULOQ; 1.95x10⁴
µg/L). Samples (120 µL) of the QC samples were stored at –20 °C.
Before analysis, calibration standards and QC samples were thawed and processed at
room temperature. Calibration standards were analysed without further dilution. QC
samples were diluted with NaCl/HCl solution (19.5 µg/L; twofold diluted, 97.5-3.51x10³
µg/L; tenfold diluted, 1.95x10⁴ µg/L; tenfold diluted with NaCl/HCl solution and then
diluted twentyfold with pUF:NaCl/HCl solution or plasma:NaCl/HCl solution (1:9 v/v)).
Sample processing
Whole blood samples were collected in 10 mL heparin-containing tubes. Plasma was
obtained by centrifuging the whole blood samples for 5 min (1,000 g, 4 °C). PUF was
obtained by centrifuging the plasma through an ultrafiltrate filter (Centriplus YM-30
Millipore, Catnr. 4422) for 15 min (1,000 g, 20 °C). Preparation of pUF from plasma was
performed immediately after blood collection, to prevent any decrease of free Pt levels
as a result of progressive ex vivo binding of Pt to plasma proteins and erythrocytes. All
samples were stored at –20 °C until analysis. Before analysis, pUF and plasma samples
were thawed and vortex mixed and subsequently diluted tenfold with NaCl/HCl
solution. When the Pt concentration in a pUF sample was known or expected to be
below the LLOQ (97.5 µg/L), however, the sample was diluted two-fold with NaCl/HCl
solution. When the Pt concentration in a pUF or plasma sample was above the ULOQ,
Chapter 1.2
78
successive dilution with pUF:NaCl/HCl solution or plasma:NaCl/HCl solution (1:9) was
performed. After dilution of the samples, aliquots of at least 120 µL of diluted samples
were placed into the autosampler vials.
Instrumentation
A Thermo Electron Solaar MQZ graphite-furnace spectrophotometer with Zeeman
correction (Thermo Electron, Cambridge, England) equipped with a FS95 sample
dispenser (Thermo Electron) and a graphite tube atomiser (Thermo Electron) were used.
Small adjustments to the autosampler were made for sampling from vials sealed with
Parafilm (American National Can, Greenwich, CT, USA) to prevent evaporation of the
solutions upon standing in the autosampler tray. The standard Teflon sampler tip was
replaced by a sharp stainless steel needle (25 gauge), capable of penetrating the sealed
vials.
The Pt hollow-cathode lamp was operated with a current of 12 mA with a
monochromator slit width of 0.2 nm. Absorbances were measured at a wavelength of
265.9 nm. Wall atomisation was used. The temperature program of the instrument
(Table 1) comprised a drying stage (steps 1 and 4), an ashing stage (5 and 6), an
atomisation stage (7), and a stage of burning-clean with cooling (8 and 9). Cooling of the
graphite tube atomiser was performed using a M33 recirculation cooling device (Thermo
Neslab, Portsmouth, NH, USA). During the atomisation stage absorbance was monitored
using Zeeman correction. The inert carrier gas argon was used to purge the graphite
tube at a flow rate of 0.3 L/min. The gas flow was turned off during the atomisation
stage.
A total of 30 µL of fluid was introduced into the graphite tube. First, 5 µL modifier
solution (0.5% (v/v) Triton X-100 in water) was pre-injected to reduce the surface tension
of the sample, followed by 20 µL of sample and 5 µL of diluent. Each sample was
analysed in duplicate and the absorbance readings were averaged. The total
measurement time for one duplicate sample was 11 min. After every ten samples the
blank and highest calibration standard were re-assayed to re-calculate the slope of the
calibration plot. This was done to correct for the decrease in atomisation efficiency of the
graphite furnace during an analytical run. This correction was only allowed when the
response decreased less than 10% compared to the previous measurement of this
standard. Otherwise, the graphite tube was regarded as defective and was replaced by a
new one. The pyrolytically-coated partitioned graphite tubes (Extended life cuvettes,
Thermo Electron) were routinely replaced after 750 firings.
Data were acquired using the Spectrometer Software version 1.21 (SOLAAR House,
Cambridge, UK) and processed (integrated) using SOLAAR Data Station version 9.12
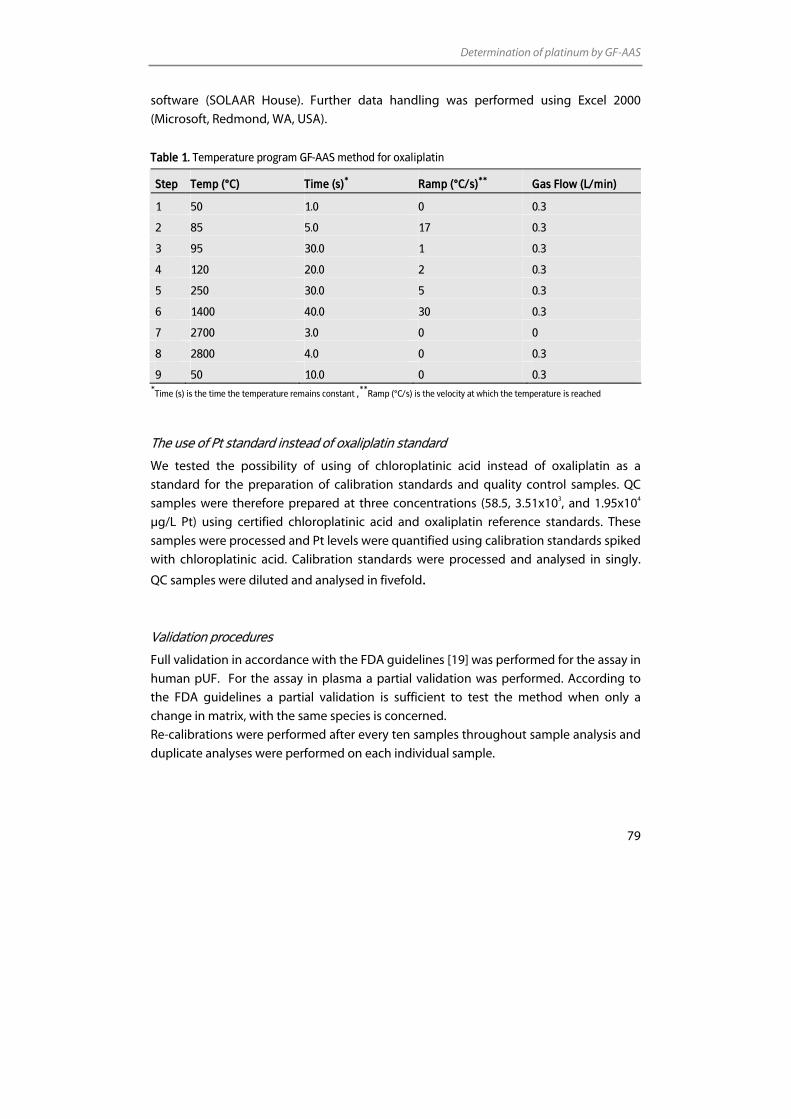
Determination of platinum by GF-AAS
79
software (SOLAAR House). Further data handling was performed using Excel 2000
(Microsoft, Redmond, WA, USA).
Table 1. Temperature program GF-AAS method for oxaliplatin
Step Temp (°C) Time (s)* Ramp (°C/s)** Gas Flow (L/min)
1 50 1.0 0 0.3
2 85 5.0 17 0.3
3 95 30.0 1 0.3
4 120 20.0 2 0.3
5 250 30.0 5 0.3
6 1400 40.0 30 0.3
7 2700 3.0 0 0
8 2800 4.0 0 0.3
9 50 10.0 0 0.3 *
Time (s) is the time the temperature remains constant ,**
Ramp (°C/s) is the velocity at which the temperature is reached
The use of Pt standard instead of oxaliplatin standard
We tested the possibility of using of chloroplatinic acid instead of oxaliplatin as a
standard for the preparation of calibration standards and quality control samples. QC
samples were therefore prepared at three concentrations (58.5, 3.51x10³, and 1.95x10⁴
µg/L Pt) using certified chloroplatinic acid and oxaliplatin reference standards. These
samples were processed and Pt levels were quantified using calibration standards spiked
with chloroplatinic acid. Calibration standards were processed and analysed in singly.
QC samples were diluted and analysed in fivefold.
Validation procedures
Full validation in accordance with the FDA guidelines [19] was performed for the assay in
human pUF. For the assay in plasma a partial validation was performed. According to
the FDA guidelines a partial validation is sufficient to test the method when only a
change in matrix, with the same species is concerned.
Re-calibrations were performed after every ten samples throughout sample analysis and
duplicate analyses were performed on each individual sample.
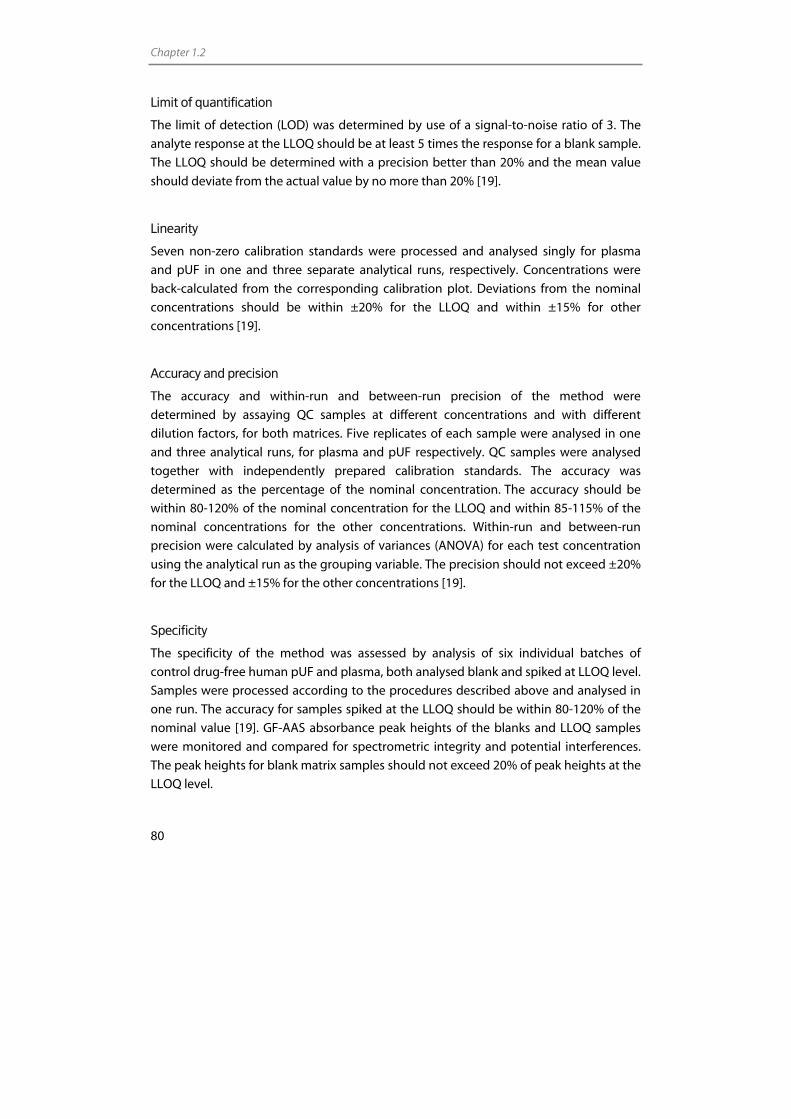
Chapter 1.2
80
Limit of quantification
The limit of detection (LOD) was determined by use of a signal-to-noise ratio of 3. The
analyte response at the LLOQ should be at least 5 times the response for a blank sample.
The LLOQ should be determined with a precision better than 20% and the mean value
should deviate from the actual value by no more than 20% [19].
Linearity
Seven non-zero calibration standards were processed and analysed singly for plasma
and pUF in one and three separate analytical runs, respectively. Concentrations were
back-calculated from the corresponding calibration plot. Deviations from the nominal
concentrations should be within ±20% for the LLOQ and within ±15% for other
concentrations [19].
Accuracy and precision
The accuracy and within-run and between-run precision of the method were
determined by assaying QC samples at different concentrations and with different
dilution factors, for both matrices. Five replicates of each sample were analysed in one
and three analytical runs, for plasma and pUF respectively. QC samples were analysed
together with independently prepared calibration standards. The accuracy was
determined as the percentage of the nominal concentration. The accuracy should be
within 80-120% of the nominal concentration for the LLOQ and within 85-115% of the
nominal concentrations for the other concentrations. Within-run and between-run
precision were calculated by analysis of variances (ANOVA) for each test concentration
using the analytical run as the grouping variable. The precision should not exceed ±20%
for the LLOQ and ±15% for the other concentrations [19].
Specificity
The specificity of the method was assessed by analysis of six individual batches of
control drug-free human pUF and plasma, both analysed blank and spiked at LLOQ level.
Samples were processed according to the procedures described above and analysed in
one run. The accuracy for samples spiked at the LLOQ should be within 80-120% of the
nominal value [19]. GF-AAS absorbance peak heights of the blanks and LLOQ samples
were monitored and compared for spectrometric integrity and potential interferences.
The peak heights for blank matrix samples should not exceed 20% of peak heights at the
LLOQ level.
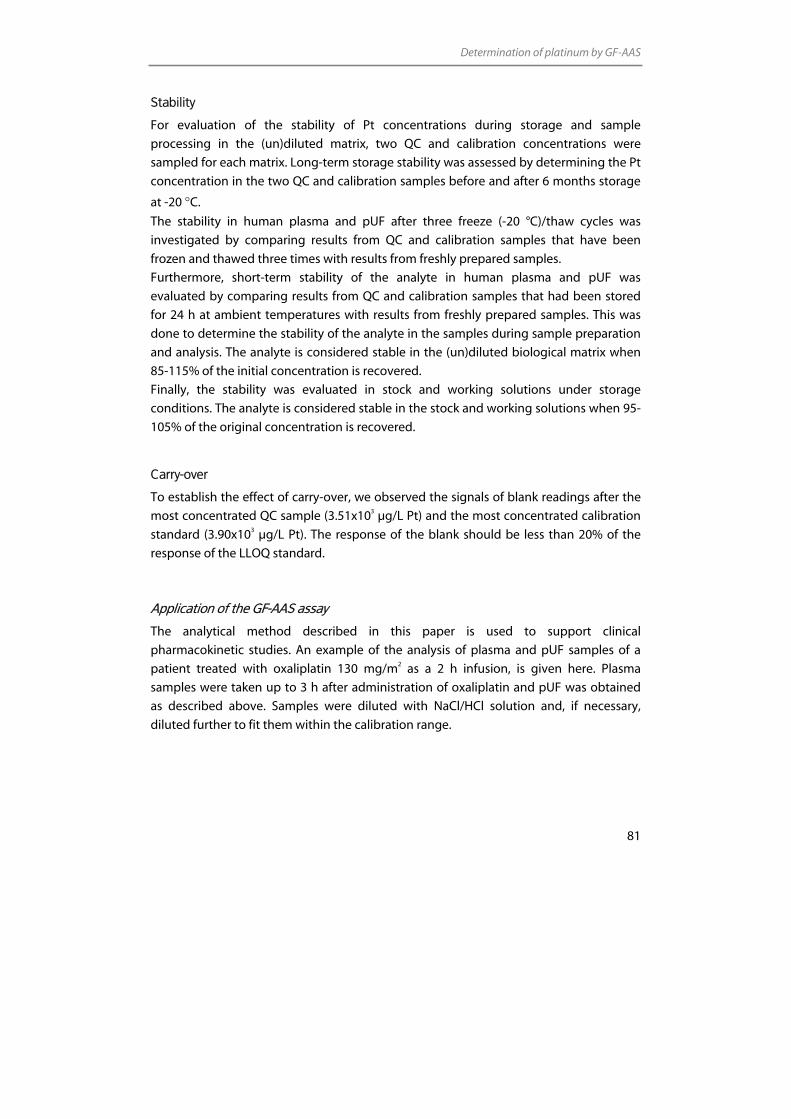
Determination of platinum by GF-AAS
81
Stability
For evaluation of the stability of Pt concentrations during storage and sample
processing in the (un)diluted matrix, two QC and calibration concentrations were
sampled for each matrix. Long-term storage stability was assessed by determining the Pt
concentration in the two QC and calibration samples before and after 6 months storage
at -20 °C.
The stability in human plasma and pUF after three freeze (-20 °C)/thaw cycles was
investigated by comparing results from QC and calibration samples that have been
frozen and thawed three times with results from freshly prepared samples.
Furthermore, short-term stability of the analyte in human plasma and pUF was
evaluated by comparing results from QC and calibration samples that had been stored
for 24 h at ambient temperatures with results from freshly prepared samples. This was
done to determine the stability of the analyte in the samples during sample preparation
and analysis. The analyte is considered stable in the (un)diluted biological matrix when
85-115% of the initial concentration is recovered.
Finally, the stability was evaluated in stock and working solutions under storage
conditions. The analyte is considered stable in the stock and working solutions when 95-
105% of the original concentration is recovered.
Carry-over
To establish the effect of carry-over, we observed the signals of blank readings after the
most concentrated QC sample (3.51x10³ µg/L Pt) and the most concentrated calibration
standard (3.90x10³ µg/L Pt). The response of the blank should be less than 20% of the
response of the LLOQ standard.
Application of the GF-AAS assay
The analytical method described in this paper is used to support clinical
pharmacokinetic studies. An example of the analysis of plasma and pUF samples of a
patient treated with oxaliplatin 130 mg/m2 as a 2 h infusion, is given here. Plasma
samples were taken up to 3 h after administration of oxaliplatin and pUF was obtained
as described above. Samples were diluted with NaCl/HCl solution and, if necessary,
diluted further to fit them within the calibration range.
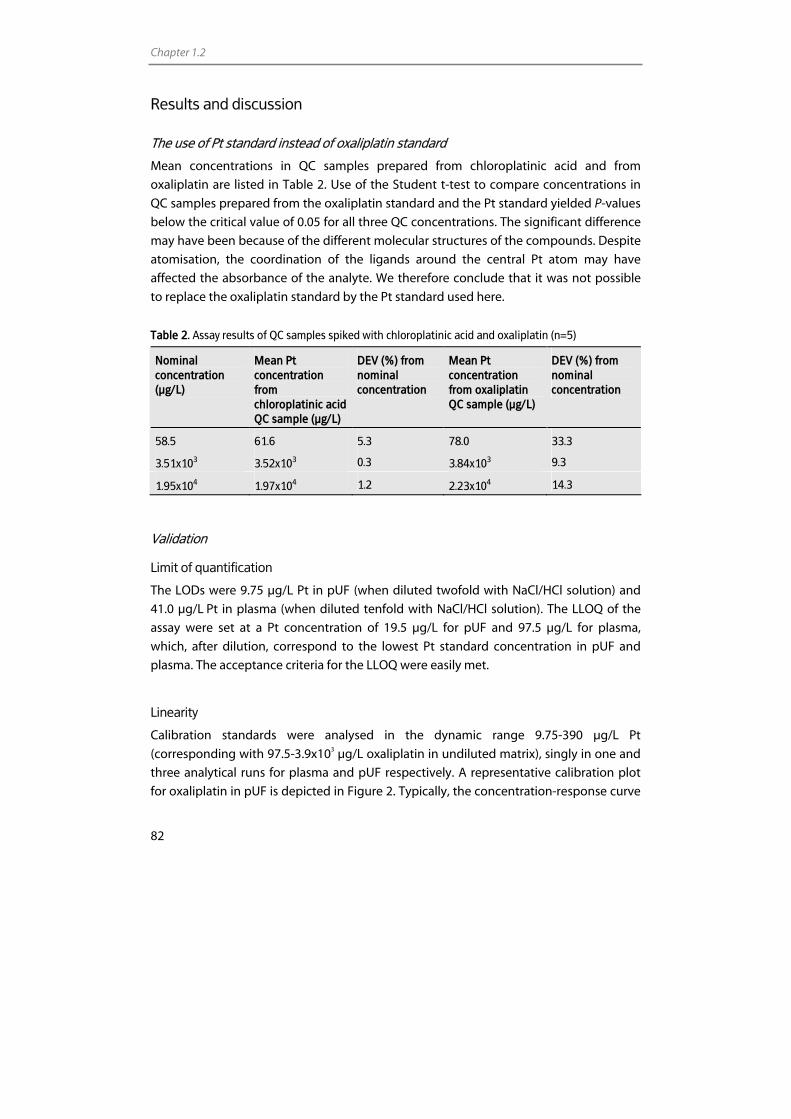
Chapter 1.2
82
Results and discussion
The use of Pt standard instead of oxaliplatin standard
Mean concentrations in QC samples prepared from chloroplatinic acid and from
oxaliplatin are listed in Table 2. Use of the Student t-test to compare concentrations in
QC samples prepared from the oxaliplatin standard and the Pt standard yielded P-values
below the critical value of 0.05 for all three QC concentrations. The significant difference
may have been because of the different molecular structures of the compounds. Despite
atomisation, the coordination of the ligands around the central Pt atom may have
affected the absorbance of the analyte. We therefore conclude that it was not possible
to replace the oxaliplatin standard by the Pt standard used here.
Table 2. Assay results of QC samples spiked with chloroplatinic acid and oxaliplatin (n=5)
Nominal concentration (µg/L)
Mean Pt concentration from chloroplatinic acid QC sample (µg/L)
DEV (%) from nominal concentration
Mean Pt concentration from oxaliplatin QC sample (µg/L)
DEV (%) from nominal concentration
58.5 61.6 5.3 78.0 33.3
3.51x10³ 3.52x10³ 0.3 3.84x10³ 9.3
1.95x10⁴ 1.97x10⁴ 1.2 2.23x10⁴ 14.3
Validation
Limit of quantification
The LODs were 9.75 µg/L Pt in pUF (when diluted twofold with NaCl/HCl solution) and
41.0 µg/L Pt in plasma (when diluted tenfold with NaCl/HCl solution). The LLOQ of the
assay were set at a Pt concentration of 19.5 µg/L for pUF and 97.5 µg/L for plasma,
which, after dilution, correspond to the lowest Pt standard concentration in pUF and
plasma. The acceptance criteria for the LLOQ were easily met.
Linearity
Calibration standards were analysed in the dynamic range 9.75-390 µg/L Pt
(corresponding with 97.5-3.9x10³ µg/L oxaliplatin in undiluted matrix), singly in one and
three analytical runs for plasma and pUF respectively. A representative calibration plot
for oxaliplatin in pUF is depicted in Figure 2. Typically, the concentration-response curve
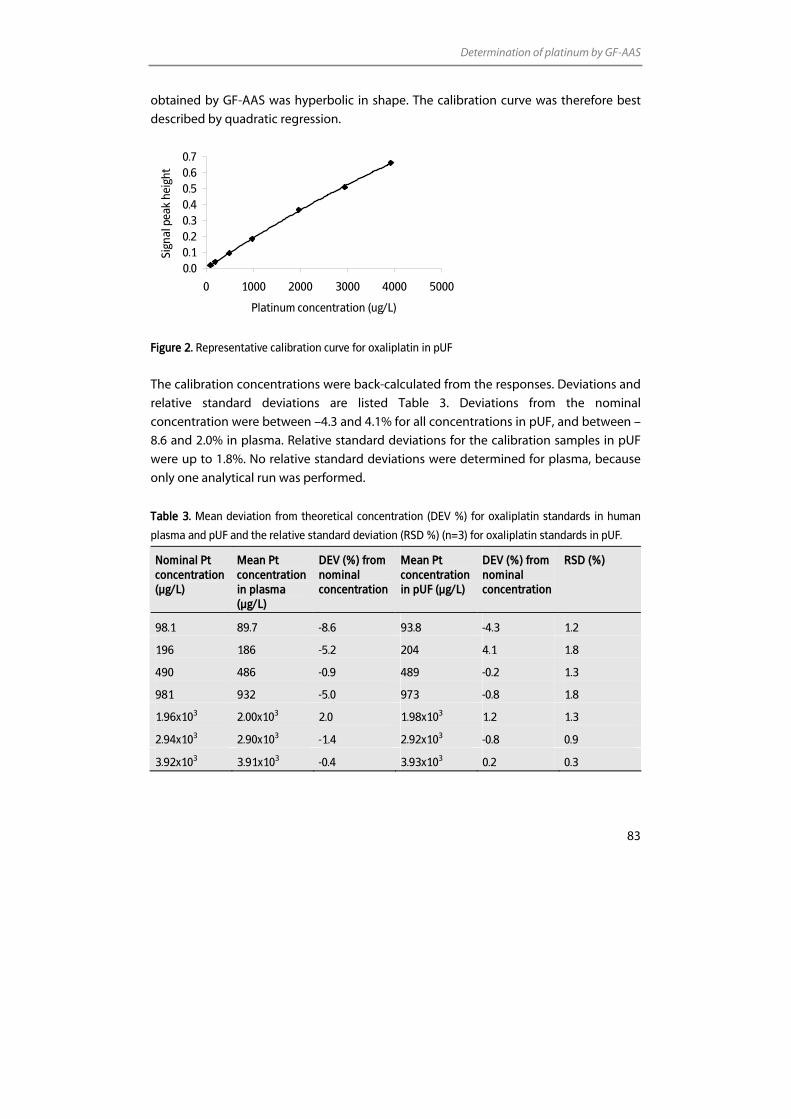
Determination of platinum by GF-AAS
83
obtained by GF-AAS was hyperbolic in shape. The calibration curve was therefore best
described by quadratic regression.
0.00.10.20.30.40.50.60.7
0 1000 2000 3000 4000 5000
Platinum concentration (ug/L)
Sign
al p
eak
heig
ht
Figure 2. Representative calibration curve for oxaliplatin in pUF
The calibration concentrations were back-calculated from the responses. Deviations and
relative standard deviations are listed Table 3. Deviations from the nominal
concentration were between –4.3 and 4.1% for all concentrations in pUF, and between –
8.6 and 2.0% in plasma. Relative standard deviations for the calibration samples in pUF
were up to 1.8%. No relative standard deviations were determined for plasma, because
only one analytical run was performed.
Table 3. Mean deviation from theoretical concentration (DEV %) for oxaliplatin standards in human
plasma and pUF and the relative standard deviation (RSD %) (n=3) for oxaliplatin standards in pUF.
Nominal Pt concentration (µg/L)
Mean Pt concentration in plasma (µg/L)
DEV (%) from nominal concentration
Mean Pt concentration in pUF (µg/L)
DEV (%) from nominal concentration
RSD (%)
98.1 89.7 -8.6 93.8 -4.3 1.2
196 186 -5.2 204 4.1 1.8
490 486 -0.9 489 -0.2 1.3
981 932 -5.0 973 -0.8 1.8
1.96x10³ 2.00x10³ 2.0 1.98x10³ 1.2 1.3
2.94x10³ 2.90x10³ -1.4 2.92x10³ -0.8 0.9
3.92x10³ 3.91x10³ -0.4 3.93x10³ 0.2 0.3

Chapter 1.2
84
Accuracy and precision
Within-run and between-run precision data are summarised in Table 4. For plasma, only
within-run precision data were determined, because partial validation was performed.
Accuracy was within 85.2 and 105.8% and within 93.0 and 111.0%, for pUF and plasma
respectively. This showed that for all QC concentration levels, data were within generally
accepted criteria for bioanalytical method validation [19] and that the different dilution
of the QC samples did not affect the performance of the method.
Table 4. Within-run and between-run precision data in human plasma and pUF
Initial concentration (µg/L)
Final concentration (µg/L)
Matrix dilution
Within-run precision plasma
Within-run precision pUF
Between-run precision pUF
19.5 9.75 1:2 * 3.9 7.7
97.5 9.75 1:10 1.1 6.4 10.1
293 29.3 1:10 0.4 1.5 1.6
975 97.5 1:10 4.9 1.1 1.1
3.51x10³ 351 1:10 4.0 1.3 **
1.95x10⁴ 97.5 1:200 4.3 5.5 **
*0.099 was not used as a QC sample in plasma validation
**no statistically significant variation was observed as a result of performing the assay in different runs
Specificity
Analysis of blank samples from six individual batches of pUF and plasma did not show
interferences from endogenous material at the absorbance wavelength of Pt with peaks
>20% of the LLOQ heights. Deviations from the nominal concentrations at the LLOQ
level were between –6.3 and 3.9% for pUF and between 2.8 and 19.8% for plasma.
Stability
When preparing the concentrated stock and working solutions it was important to avoid
chloride-containing diluents, because these can result in chemical modification into
chloride-containing transformation products [20-22] and the formation of a precipitate
[23]. We decided to use 5% glucose solution as the diluent for the concentrated solution,
which is also used as the oxaliplatin diluent in intravenous infusions. No precipitate was
formed in solutions in 5% glucose with Pt concentrations up to 390 mg/L. Pt levels in the
stock and working solutions in 5% glucose solution remained constant under storage
conditions for at least 6 months.
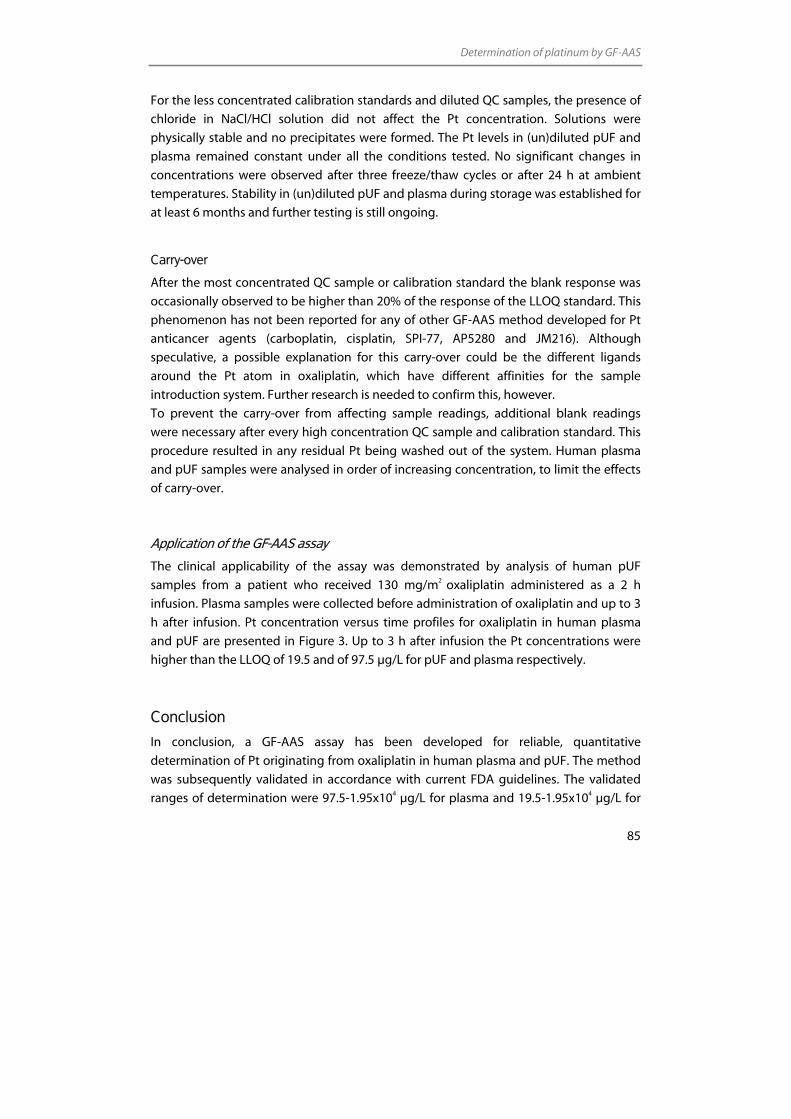
Determination of platinum by GF-AAS
85
For the less concentrated calibration standards and diluted QC samples, the presence of
chloride in NaCl/HCl solution did not affect the Pt concentration. Solutions were
physically stable and no precipitates were formed. The Pt levels in (un)diluted pUF and
plasma remained constant under all the conditions tested. No significant changes in
concentrations were observed after three freeze/thaw cycles or after 24 h at ambient
temperatures. Stability in (un)diluted pUF and plasma during storage was established for
at least 6 months and further testing is still ongoing.
Carry-over
After the most concentrated QC sample or calibration standard the blank response was
occasionally observed to be higher than 20% of the response of the LLOQ standard. This
phenomenon has not been reported for any of other GF-AAS method developed for Pt
anticancer agents (carboplatin, cisplatin, SPI-77, AP5280 and JM216). Although
speculative, a possible explanation for this carry-over could be the different ligands
around the Pt atom in oxaliplatin, which have different affinities for the sample
introduction system. Further research is needed to confirm this, however.
To prevent the carry-over from affecting sample readings, additional blank readings
were necessary after every high concentration QC sample and calibration standard. This
procedure resulted in any residual Pt being washed out of the system. Human plasma
and pUF samples were analysed in order of increasing concentration, to limit the effects
of carry-over.
Application of the GF-AAS assay
The clinical applicability of the assay was demonstrated by analysis of human pUF
samples from a patient who received 130 mg/m2 oxaliplatin administered as a 2 h
infusion. Plasma samples were collected before administration of oxaliplatin and up to 3
h after infusion. Pt concentration versus time profiles for oxaliplatin in human plasma
and pUF are presented in Figure 3. Up to 3 h after infusion the Pt concentrations were
higher than the LLOQ of 19.5 and of 97.5 µg/L for pUF and plasma respectively.
Conclusion
In conclusion, a GF-AAS assay has been developed for reliable, quantitative
determination of Pt originating from oxaliplatin in human plasma and pUF. The method
was subsequently validated in accordance with current FDA guidelines. The validated
ranges of determination were 97.5-1.95x10⁴ µg/L for plasma and 19.5-1.95x10⁴ µg/L for
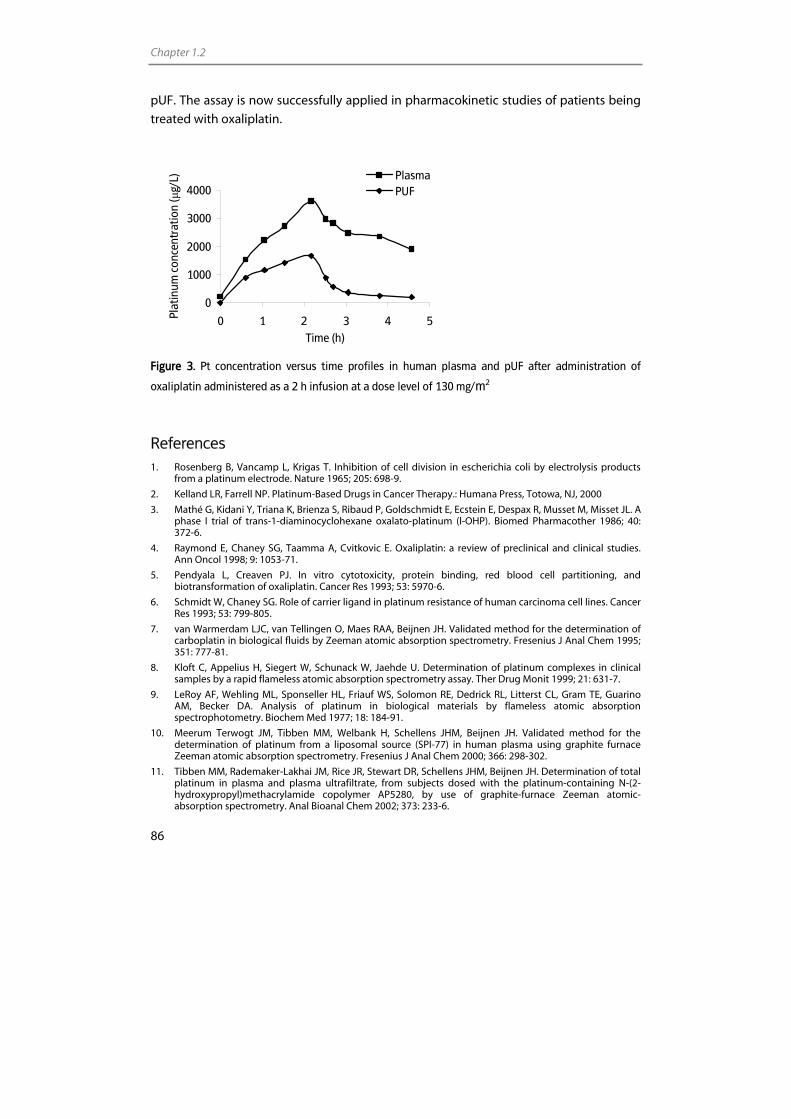
Chapter 1.2
86
pUF. The assay is now successfully applied in pharmacokinetic studies of patients being
treated with oxaliplatin.
0
1000
2000
3000
4000
0 1 2 3 4 5Time (h)
Plat
inum
con
cent
ratio
n (µ
g/L) Plasma
PUF
Figure 3. Pt concentration versus time profiles in human plasma and pUF after administration of
oxaliplatin administered as a 2 h infusion at a dose level of 130 mg/m2
References 1. Rosenberg B, Vancamp L, Krigas T. Inhibition of cell division in escherichia coli by electrolysis products
from a platinum electrode. Nature 1965; 205: 698-9.
2. Kelland LR, Farrell NP. Platinum-Based Drugs in Cancer Therapy.: Humana Press, Totowa, NJ, 2000
3. Mathé G, Kidani Y, Triana K, Brienza S, Ribaud P, Goldschmidt E, Ecstein E, Despax R, Musset M, Misset JL. A phase I trial of trans-1-diaminocyclohexane oxalato-platinum (l-OHP). Biomed Pharmacother 1986; 40: 372-6.
4. Raymond E, Chaney SG, Taamma A, Cvitkovic E. Oxaliplatin: a review of preclinical and clinical studies. Ann Oncol 1998; 9: 1053-71.
5. Pendyala L, Creaven PJ. In vitro cytotoxicity, protein binding, red blood cell partitioning, and biotransformation of oxaliplatin. Cancer Res 1993; 53: 5970-6.
6. Schmidt W, Chaney SG. Role of carrier ligand in platinum resistance of human carcinoma cell lines. Cancer Res 1993; 53: 799-805.
7. van Warmerdam LJC, van Tellingen O, Maes RAA, Beijnen JH. Validated method for the determination of carboplatin in biological fluids by Zeeman atomic absorption spectrometry. Fresenius J Anal Chem 1995; 351: 777-81.
8. Kloft C, Appelius H, Siegert W, Schunack W, Jaehde U. Determination of platinum complexes in clinical samples by a rapid flameless atomic absorption spectrometry assay. Ther Drug Monit 1999; 21: 631-7.
9. LeRoy AF, Wehling ML, Sponseller HL, Friauf WS, Solomon RE, Dedrick RL, Litterst CL, Gram TE, Guarino AM, Becker DA. Analysis of platinum in biological materials by flameless atomic absorption spectrophotometry. Biochem Med 1977; 18: 184-91.
10. Meerum Terwogt JM, Tibben MM, Welbank H, Schellens JHM, Beijnen JH. Validated method for the determination of platinum from a liposomal source (SPI-77) in human plasma using graphite furnace Zeeman atomic absorption spectrometry. Fresenius J Anal Chem 2000; 366: 298-302.
11. Tibben MM, Rademaker-Lakhai JM, Rice JR, Stewart DR, Schellens JHM, Beijnen JH. Determination of total platinum in plasma and plasma ultrafiltrate, from subjects dosed with the platinum-containing N-(2-hydroxypropyl)methacrylamide copolymer AP5280, by use of graphite-furnace Zeeman atomic-absorption spectrometry. Anal Bioanal Chem 2002; 373: 233-6.
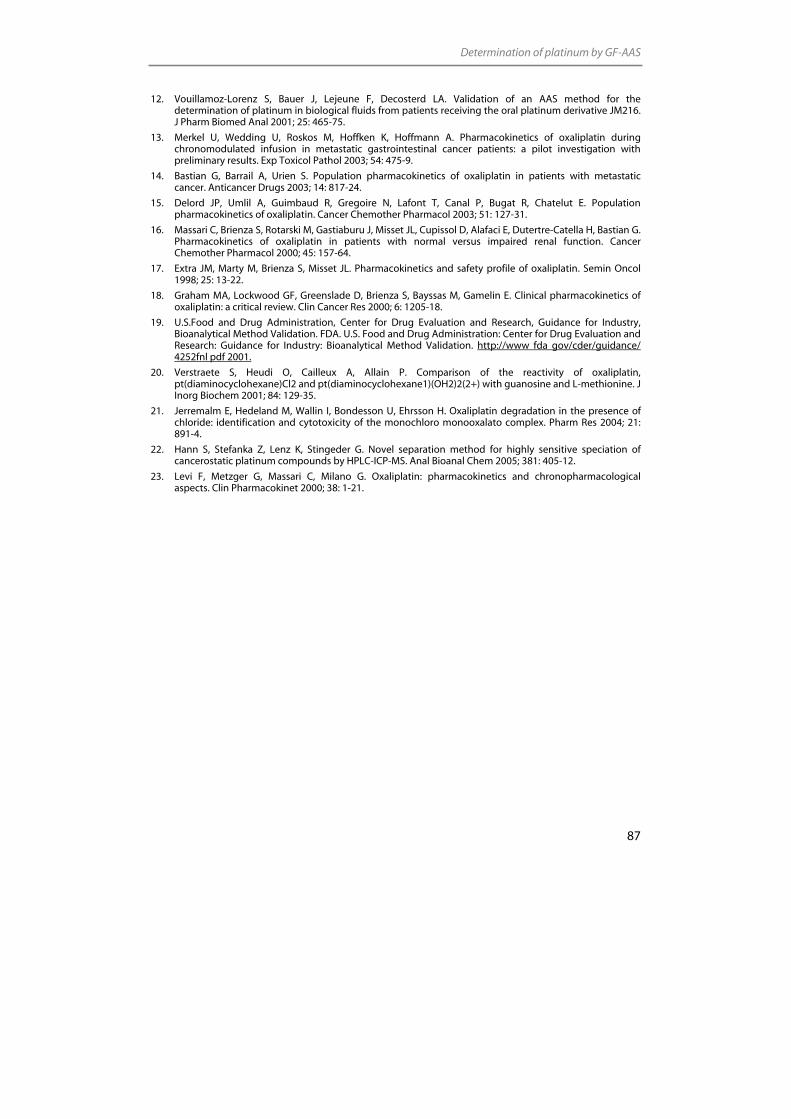
Determination of platinum by GF-AAS
87
12. Vouillamoz-Lorenz S, Bauer J, Lejeune F, Decosterd LA. Validation of an AAS method for the determination of platinum in biological fluids from patients receiving the oral platinum derivative JM216. J Pharm Biomed Anal 2001; 25: 465-75.
13. Merkel U, Wedding U, Roskos M, Hoffken K, Hoffmann A. Pharmacokinetics of oxaliplatin during chronomodulated infusion in metastatic gastrointestinal cancer patients: a pilot investigation with preliminary results. Exp Toxicol Pathol 2003; 54: 475-9.
14. Bastian G, Barrail A, Urien S. Population pharmacokinetics of oxaliplatin in patients with metastatic cancer. Anticancer Drugs 2003; 14: 817-24.
15. Delord JP, Umlil A, Guimbaud R, Gregoire N, Lafont T, Canal P, Bugat R, Chatelut E. Population pharmacokinetics of oxaliplatin. Cancer Chemother Pharmacol 2003; 51: 127-31.
16. Massari C, Brienza S, Rotarski M, Gastiaburu J, Misset JL, Cupissol D, Alafaci E, Dutertre-Catella H, Bastian G. Pharmacokinetics of oxaliplatin in patients with normal versus impaired renal function. Cancer Chemother Pharmacol 2000; 45: 157-64.
17. Extra JM, Marty M, Brienza S, Misset JL. Pharmacokinetics and safety profile of oxaliplatin. Semin Oncol 1998; 25: 13-22.
18. Graham MA, Lockwood GF, Greenslade D, Brienza S, Bayssas M, Gamelin E. Clinical pharmacokinetics of oxaliplatin: a critical review. Clin Cancer Res 2000; 6: 1205-18.
19. U.S.Food and Drug Administration, Center for Drug Evaluation and Research, Guidance for Industry, Bioanalytical Method Validation. FDA. U.S. Food and Drug Administration: Center for Drug Evaluation and Research: Guidance for Industry: Bioanalytical Method Validation. http://www fda gov/cder/guidance/ 4252fnl pdf 2001.
20. Verstraete S, Heudi O, Cailleux A, Allain P. Comparison of the reactivity of oxaliplatin, pt(diaminocyclohexane)Cl2 and pt(diaminocyclohexane1)(OH2)2(2+) with guanosine and L-methionine. J Inorg Biochem 2001; 84: 129-35.
21. Jerremalm E, Hedeland M, Wallin I, Bondesson U, Ehrsson H. Oxaliplatin degradation in the presence of chloride: identification and cytotoxicity of the monochloro monooxalato complex. Pharm Res 2004; 21: 891-4.
22. Hann S, Stefanka Z, Lenz K, Stingeder G. Novel separation method for highly sensitive speciation of cancerostatic platinum compounds by HPLC-ICP-MS. Anal Bioanal Chem 2005; 381: 405-12.
23. Levi F, Metzger G, Massari C, Milano G. Oxaliplatin: pharmacokinetics and chronopharmacological aspects. Clin Pharmacokinet 2000; 38: 1-21.

Chapter 2.2
Sensitive inductively coupled plasma mass spectrometry assay for the determination
of platinum originating from cisplatin, carboplatin, and oxaliplatin in human
plasma ultrafiltrate
Elke E.M. Brouwers Matthijs M. Tibben
Hilde Rosing Michel J.X. Hillebrand
Markus Joerger Jan H.M. Schellens
Jos H. Beijnen
Journal of Mass Spectrometry 2006; 41; 1186-1194
Chapter 2.2
90
Abstract
We present a highly sensitive, rapid method for the determination of platinum (Pt)
originating from the anticancer agents cisplatin, carboplatin, and oxaliplatin in human
plasma ultrafiltrate. The method is based on the quantification of Pt by inductively
coupled plasma mass spectrometry and allows quantification of 7.50 ng/L Pt in only 150
µL of matrix. Sample pretreatment involves dilution of samples with 1% HNO3. Validation
fulfilled the most recent FDA guidelines for bioanalytical method validation. Validated
ranges of quantification were 7.50 to 1.00x10⁵ ng/L in plasma ultrafiltrate for all three Pt
compounds. The assay is now successfully used to support pharmacokinetic studies in
cancer patients treated with cisplatin, carboplatin, or oxaliplatin.
Determination of platinum by ICP-MS
91
Introduction
Platinum (Pt) anticancer drugs are an important class of chemotherapeutics. The three Pt
compounds currently used on a large scale in the treatment of cancer patients are
cisplatin (cis-diaminedichloridoplatinum(II)), carboplatin (cis-diammine(1,1-cyclobutane
dicarboxylato)platinum(II)) and oxaliplatin ([(1R,-2R)-1,2-cyclohexanediamine-N,N´]
[oxalato(2-)-O,O´]platinum).
The ability to measure Pt exposure in biological matrices is a prerequisite in under-
standing the pharmacokinetics of Pt anticancer agents. Literature describing the early
pharmacokinetics, distribution, and elimination of Pt after treatment with a Pt anticancer
agent is extensive. However, much less has been reported on the long-term retention of
these drugs. This is because of the fact that many studies rely on atomic absorption
spectrometry (AAS) for the analysis of Pt, which is not sensitive enough for evaluating
long-term Pt retention. Because a drug like cisplatin has a high curative potential and its
long-term side effects could possibly be associated with prolonged retention of Pt in the
body [1-4], it is important to be able to describe these long-term pharmacokinetics.
Inductively coupled plasma mass spectrometry (ICP-MS) greatly increases the
pharmacokinetic timescale that can be studied owing to its extremely high sensitivity
and specificity. Since the development of the first ICP-MS in 1975 [5], considerable
changes have been made in the design and performance of the ICP-MS, and the
instrument has proven its applicability in the determination of Pt originating from
anticancer agents in biological fluids of patients treated with these drugs. Methods have
been described for the analysis of Pt in plasma [6-12], plasma ultrafiltrate (pUF) [7-12],
serum [13], blood [10,14], urine [6,9,11,12], and cerebrospinal fluid [13].
In order to assess the long-term exposure to ultrafilterable circulating Pt, we developed
a highly sensitive, rapid ICP-MS assay for the determination of Pt originating from
cisplatin, carboplatin, and oxaliplatin in pUF. PUF contains the pharmacologically active
Pt fraction, and is, therefore, essential in clinical pharmacologic studies with Pt anti-
tumour agents [15,16]. The origin of Pt in pUF, however remains to be further
investigated [8]. To the best of our knowledge, the method described here is one of the
most sensitive methods on the analysis of Pt in pUF using a conventional ICP-
quadrupole-MS [7-12].
For this method, pUF samples were diluted with an appropriate diluent to reduce matrix
effects and contamination of the sample introduction system. As a compromise
between a low detection limit of the method and minimal contamination of the sample
introduction system, we diluted the samples 100-fold. However, to maximise the limit of
quantification of the method, we also validated a tenfold dilution of pUF samples,
enabling the quantification of samples with Pt concentrations below the concentration
of the lower limit of quantification (LLOQ) after a 100-fold dilution. The relatively high
sample volume needed for a single ICP-MS measurement (1.5 mL) and the limited
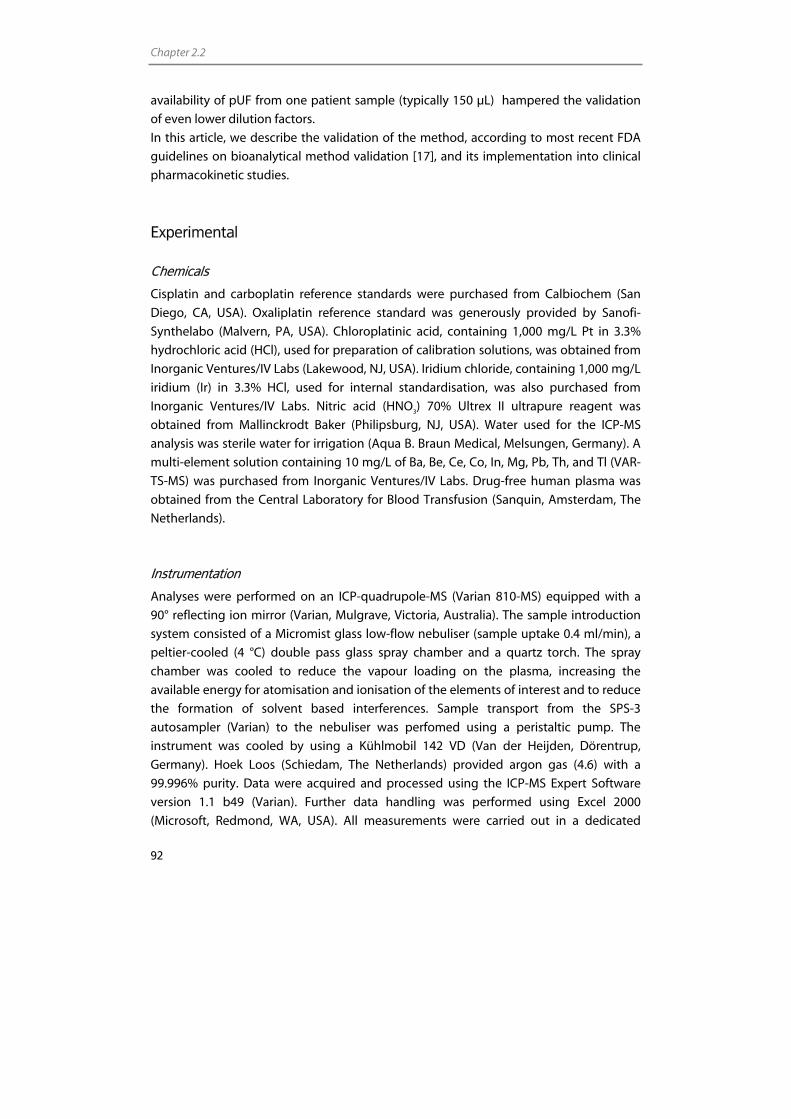
Chapter 2.2
92
availability of pUF from one patient sample (typically 150 µL) hampered the validation
of even lower dilution factors.
In this article, we describe the validation of the method, according to most recent FDA
guidelines on bioanalytical method validation [17], and its implementation into clinical
pharmacokinetic studies.
Experimental
Chemicals
Cisplatin and carboplatin reference standards were purchased from Calbiochem (San
Diego, CA, USA). Oxaliplatin reference standard was generously provided by Sanofi-
Synthelabo (Malvern, PA, USA). Chloroplatinic acid, containing 1,000 mg/L Pt in 3.3%
hydrochloric acid (HCl), used for preparation of calibration solutions, was obtained from
Inorganic Ventures/IV Labs (Lakewood, NJ, USA). Iridium chloride, containing 1,000 mg/L
iridium (Ir) in 3.3% HCl, used for internal standardisation, was also purchased from
Inorganic Ventures/IV Labs. Nitric acid (HNO3) 70% Ultrex II ultrapure reagent was
obtained from Mallinckrodt Baker (Philipsburg, NJ, USA). Water used for the ICP-MS
analysis was sterile water for irrigation (Aqua B. Braun Medical, Melsungen, Germany). A
multi-element solution containing 10 mg/L of Ba, Be, Ce, Co, In, Mg, Pb, Th, and Tl (VAR-
TS-MS) was purchased from Inorganic Ventures/IV Labs. Drug-free human plasma was
obtained from the Central Laboratory for Blood Transfusion (Sanquin, Amsterdam, The
Netherlands).
Instrumentation
Analyses were performed on an ICP-quadrupole-MS (Varian 810-MS) equipped with a
90° reflecting ion mirror (Varian, Mulgrave, Victoria, Australia). The sample introduction
system consisted of a Micromist glass low-flow nebuliser (sample uptake 0.4 ml/min), a
peltier-cooled (4 °C) double pass glass spray chamber and a quartz torch. The spray
chamber was cooled to reduce the vapour loading on the plasma, increasing the
available energy for atomisation and ionisation of the elements of interest and to reduce
the formation of solvent based interferences. Sample transport from the SPS-3
autosampler (Varian) to the nebuliser was perfomed using a peristaltic pump. The
instrument was cooled by using a Kühlmobil 142 VD (Van der Heijden, Dörentrup,
Germany). Hoek Loos (Schiedam, The Netherlands) provided argon gas (4.6) with a
99.996% purity. Data were acquired and processed using the ICP-MS Expert Software
version 1.1 b49 (Varian). Further data handling was performed using Excel 2000
(Microsoft, Redmond, WA, USA). All measurements were carried out in a dedicated
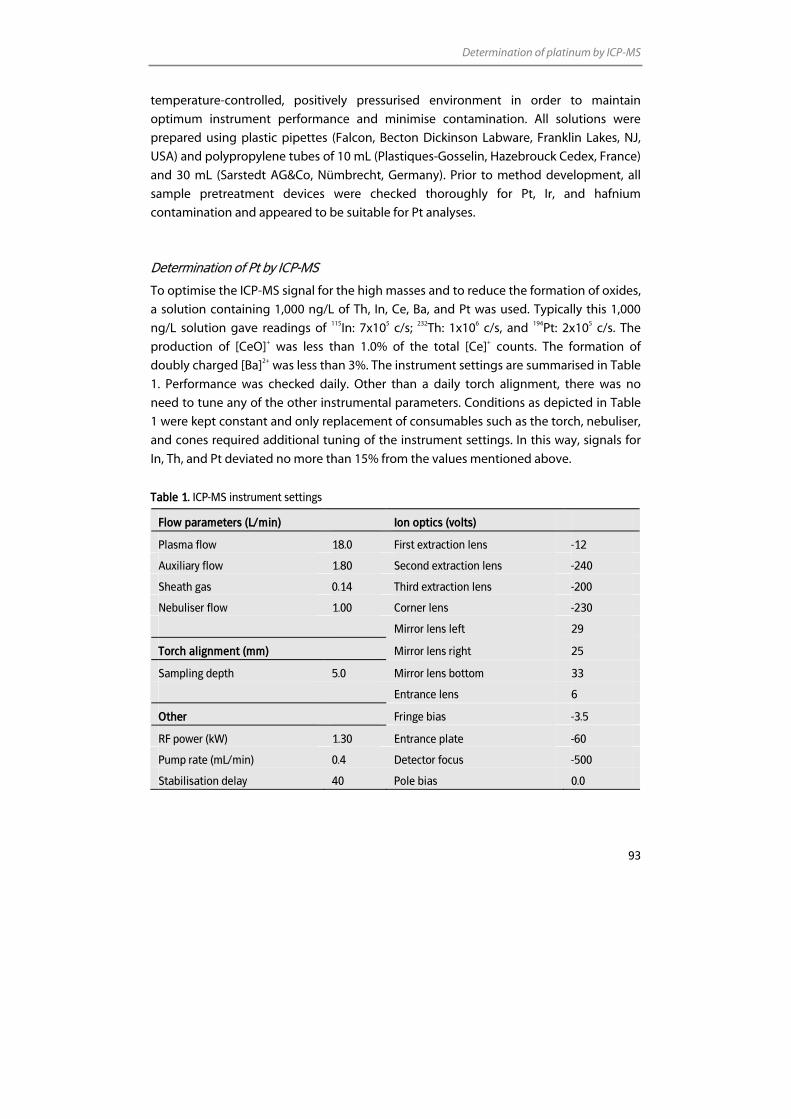
Determination of platinum by ICP-MS
93
temperature-controlled, positively pressurised environment in order to maintain
optimum instrument performance and minimise contamination. All solutions were
prepared using plastic pipettes (Falcon, Becton Dickinson Labware, Franklin Lakes, NJ,
USA) and polypropylene tubes of 10 mL (Plastiques-Gosselin, Hazebrouck Cedex, France)
and 30 mL (Sarstedt AG&Co, Nümbrecht, Germany). Prior to method development, all
sample pretreatment devices were checked thoroughly for Pt, Ir, and hafnium
contamination and appeared to be suitable for Pt analyses.
Determination of Pt by ICP-MS
To optimise the ICP-MS signal for the high masses and to reduce the formation of oxides,
a solution containing 1,000 ng/L of Th, In, Ce, Ba, and Pt was used. Typically this 1,000
ng/L solution gave readings of 115In: 7x10⁵ c/s; 232Th: 1x10⁶ c/s, and 194Pt: 2x10⁵ c/s. The
production of [CeO]+ was less than 1.0% of the total [Ce]+ counts. The formation of
doubly charged [Ba]2+ was less than 3%. The instrument settings are summarised in Table
1. Performance was checked daily. Other than a daily torch alignment, there was no
need to tune any of the other instrumental parameters. Conditions as depicted in Table
1 were kept constant and only replacement of consumables such as the torch, nebuliser,
and cones required additional tuning of the instrument settings. In this way, signals for
In, Th, and Pt deviated no more than 15% from the values mentioned above.
Table 1. ICP-MS instrument settings
Flow parameters (L/min) Ion optics (volts)
Plasma flow 18.0 First extraction lens -12
Auxiliary flow 1.80 Second extraction lens -240
Sheath gas 0.14 Third extraction lens -200
Nebuliser flow 1.00 Corner lens -230
Mirror lens left 29
Torch alignment (mm) Mirror lens right 25
Sampling depth 5.0 Mirror lens bottom 33
Entrance lens 6
Other Fringe bias -3.5
RF power (kW) 1.30 Entrance plate -60
Pump rate (mL/min) 0.4 Detector focus -500
Stabilisation delay 40 Pole bias 0.0
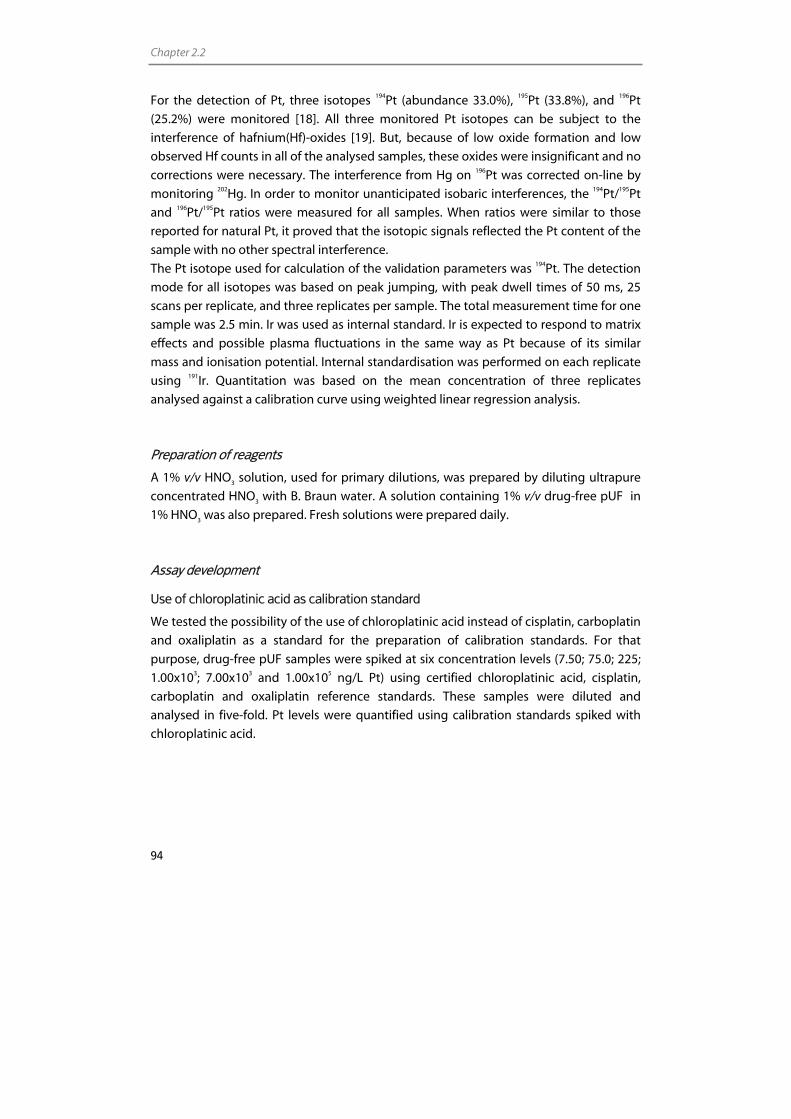
Chapter 2.2
94
For the detection of Pt, three isotopes 194Pt (abundance 33.0%), 195Pt (33.8%), and 196Pt
(25.2%) were monitored [18]. All three monitored Pt isotopes can be subject to the
interference of hafnium(Hf)-oxides [19]. But, because of low oxide formation and low
observed Hf counts in all of the analysed samples, these oxides were insignificant and no
corrections were necessary. The interference from Hg on 196Pt was corrected on-line by
monitoring 202Hg. In order to monitor unanticipated isobaric interferences, the 194Pt/195Pt
and 196Pt/195Pt ratios were measured for all samples. When ratios were similar to those
reported for natural Pt, it proved that the isotopic signals reflected the Pt content of the
sample with no other spectral interference.
The Pt isotope used for calculation of the validation parameters was 194Pt. The detection
mode for all isotopes was based on peak jumping, with peak dwell times of 50 ms, 25
scans per replicate, and three replicates per sample. The total measurement time for one
sample was 2.5 min. Ir was used as internal standard. Ir is expected to respond to matrix
effects and possible plasma fluctuations in the same way as Pt because of its similar
mass and ionisation potential. Internal standardisation was performed on each replicate
using 191Ir. Quantitation was based on the mean concentration of three replicates
analysed against a calibration curve using weighted linear regression analysis.
Preparation of reagents
A 1% v/v HNO3 solution, used for primary dilutions, was prepared by diluting ultrapure
concentrated HNO3 with B. Braun water. A solution containing 1% v/v drug-free pUF in
1% HNO3 was also prepared. Fresh solutions were prepared daily.
Assay development
Use of chloroplatinic acid as calibration standard
We tested the possibility of the use of chloroplatinic acid instead of cisplatin, carboplatin
and oxaliplatin as a standard for the preparation of calibration standards. For that
purpose, drug-free pUF samples were spiked at six concentration levels (7.50; 75.0; 225;
1.00x10³; 7.00x10³ and 1.00x10⁵ ng/L Pt) using certified chloroplatinic acid, cisplatin,
carboplatin and oxaliplatin reference standards. These samples were diluted and
analysed in five-fold. Pt levels were quantified using calibration standards spiked with
chloroplatinic acid.
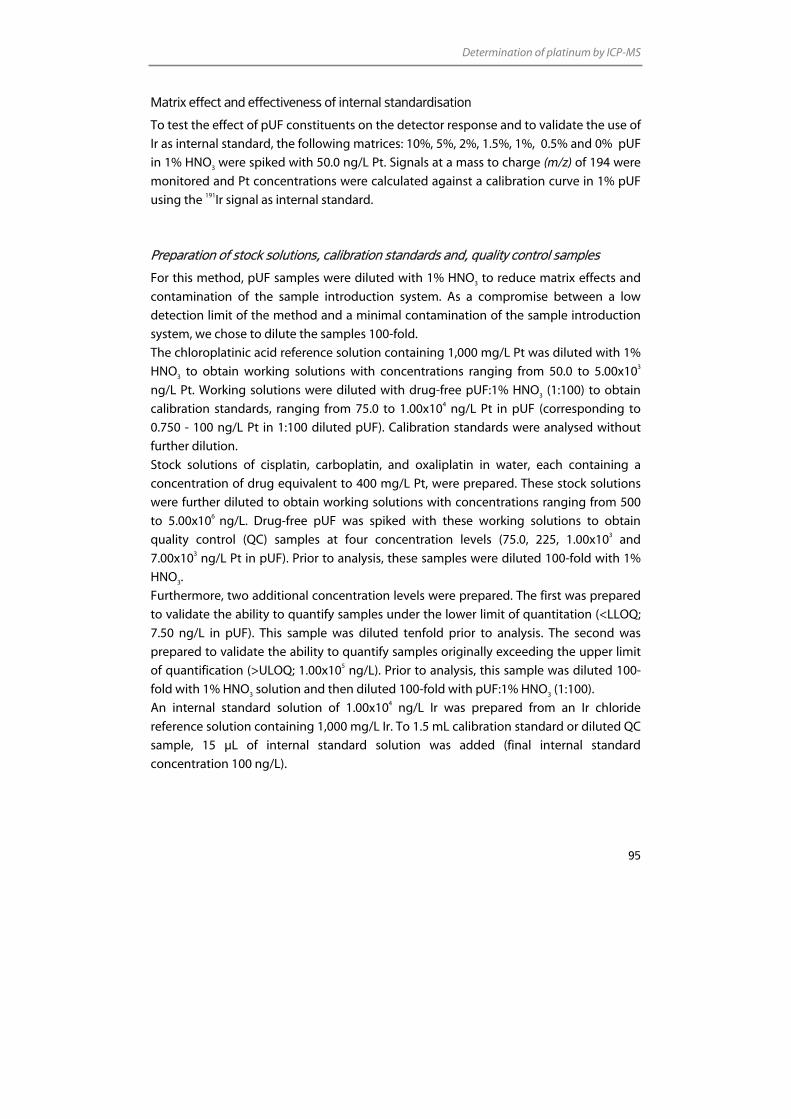
Determination of platinum by ICP-MS
95
Matrix effect and effectiveness of internal standardisation
To test the effect of pUF constituents on the detector response and to validate the use of
Ir as internal standard, the following matrices: 10%, 5%, 2%, 1.5%, 1%, 0.5% and 0% pUF
in 1% HNO3 were spiked with 50.0 ng/L Pt. Signals at a mass to charge (m/z) of 194 were
monitored and Pt concentrations were calculated against a calibration curve in 1% pUF
using the 191Ir signal as internal standard.
Preparation of stock solutions, calibration standards and, quality control samples
For this method, pUF samples were diluted with 1% HNO3 to reduce matrix effects and
contamination of the sample introduction system. As a compromise between a low
detection limit of the method and a minimal contamination of the sample introduction
system, we chose to dilute the samples 100-fold.
The chloroplatinic acid reference solution containing 1,000 mg/L Pt was diluted with 1%
HNO3 to obtain working solutions with concentrations ranging from 50.0 to 5.00x10³
ng/L Pt. Working solutions were diluted with drug-free pUF:1% HNO3 (1:100) to obtain
calibration standards, ranging from 75.0 to 1.00x10⁴ ng/L Pt in pUF (corresponding to
0.750 - 100 ng/L Pt in 1:100 diluted pUF). Calibration standards were analysed without
further dilution.
Stock solutions of cisplatin, carboplatin, and oxaliplatin in water, each containing a
concentration of drug equivalent to 400 mg/L Pt, were prepared. These stock solutions
were further diluted to obtain working solutions with concentrations ranging from 500
to 5.00x10⁶ ng/L. Drug-free pUF was spiked with these working solutions to obtain
quality control (QC) samples at four concentration levels (75.0, 225, 1.00x10³ and
7.00x10³ ng/L Pt in pUF). Prior to analysis, these samples were diluted 100-fold with 1%
HNO3.
Furthermore, two additional concentration levels were prepared. The first was prepared
to validate the ability to quantify samples under the lower limit of quantitation (<LLOQ;
7.50 ng/L in pUF). This sample was diluted tenfold prior to analysis. The second was
prepared to validate the ability to quantify samples originally exceeding the upper limit
of quantification (>ULOQ; 1.00x10⁵ ng/L). Prior to analysis, this sample was diluted 100-
fold with 1% HNO3 solution and then diluted 100-fold with pUF:1% HNO3 (1:100).
An internal standard solution of 1.00x10⁴ ng/L Ir was prepared from an Ir chloride
reference solution containing 1,000 mg/L Ir. To 1.5 mL calibration standard or diluted QC
sample, 15 µL of internal standard solution was added (final internal standard
concentration 100 ng/L).
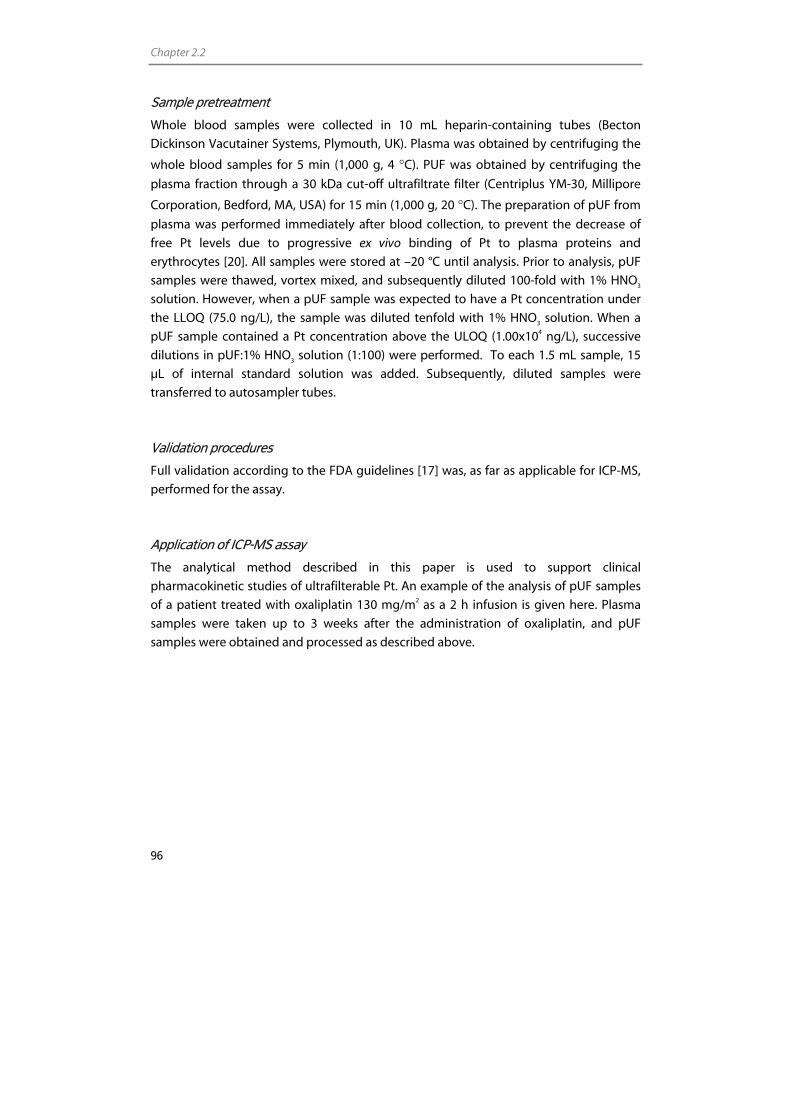
Chapter 2.2
96
Sample pretreatment
Whole blood samples were collected in 10 mL heparin-containing tubes (Becton
Dickinson Vacutainer Systems, Plymouth, UK). Plasma was obtained by centrifuging the
whole blood samples for 5 min (1,000 g, 4 °C). PUF was obtained by centrifuging the
plasma fraction through a 30 kDa cut-off ultrafiltrate filter (Centriplus YM-30, Millipore
Corporation, Bedford, MA, USA) for 15 min (1,000 g, 20 °C). The preparation of pUF from
plasma was performed immediately after blood collection, to prevent the decrease of
free Pt levels due to progressive ex vivo binding of Pt to plasma proteins and
erythrocytes [20]. All samples were stored at –20 °C until analysis. Prior to analysis, pUF
samples were thawed, vortex mixed, and subsequently diluted 100-fold with 1% HNO3
solution. However, when a pUF sample was expected to have a Pt concentration under
the LLOQ (75.0 ng/L), the sample was diluted tenfold with 1% HNO3 solution. When a
pUF sample contained a Pt concentration above the ULOQ (1.00x10⁴ ng/L), successive
dilutions in pUF:1% HNO3 solution (1:100) were performed. To each 1.5 mL sample, 15
µL of internal standard solution was added. Subsequently, diluted samples were
transferred to autosampler tubes.
Validation procedures
Full validation according to the FDA guidelines [17] was, as far as applicable for ICP-MS,
performed for the assay.
Application of ICP-MS assay
The analytical method described in this paper is used to support clinical
pharmacokinetic studies of ultrafilterable Pt. An example of the analysis of pUF samples
of a patient treated with oxaliplatin 130 mg/m2 as a 2 h infusion is given here. Plasma
samples were taken up to 3 weeks after the administration of oxaliplatin, and pUF
samples were obtained and processed as described above.
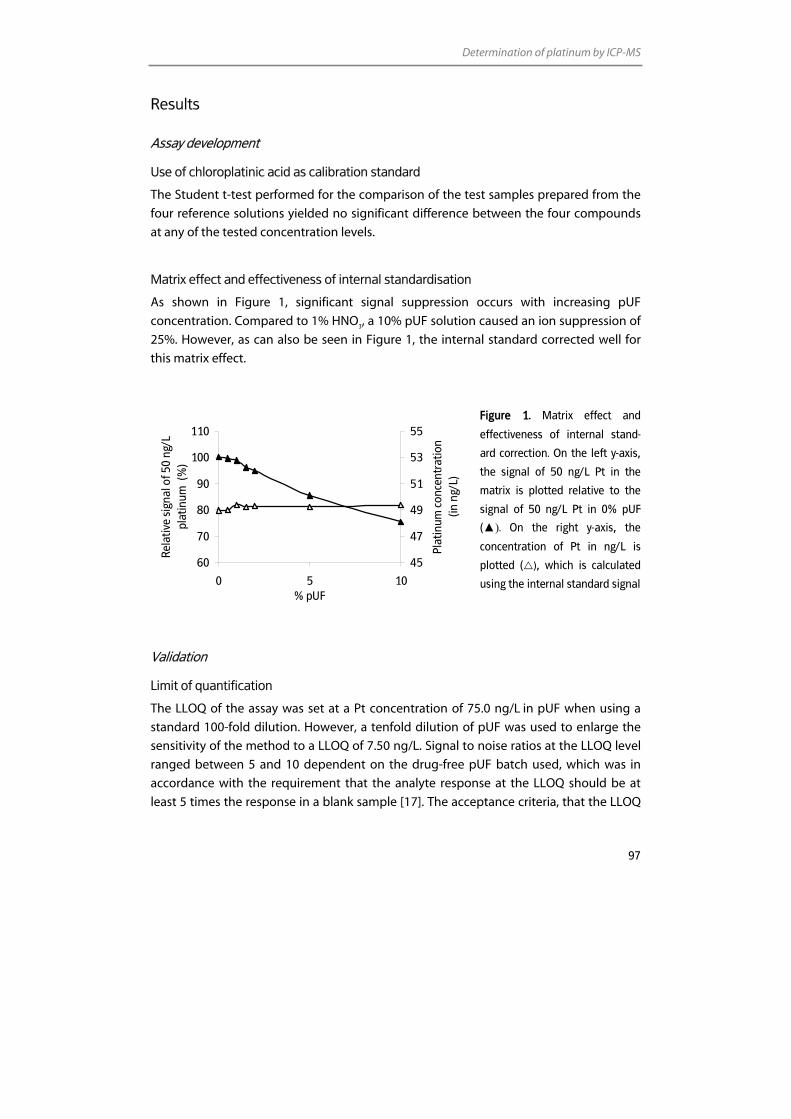
Determination of platinum by ICP-MS
97
Results
Assay development
Use of chloroplatinic acid as calibration standard
The Student t-test performed for the comparison of the test samples prepared from the
four reference solutions yielded no significant difference between the four compounds
at any of the tested concentration levels.
Matrix effect and effectiveness of internal standardisation
As shown in Figure 1, significant signal suppression occurs with increasing pUF
concentration. Compared to 1% HNO3, a 10% pUF solution caused an ion suppression of
25%. However, as can also be seen in Figure 1, the internal standard corrected well for
this matrix effect.
Figure 1. Matrix effect and
effectiveness of internal stand-
ard correction. On the left y-axis,
the signal of 50 ng/L Pt in the
matrix is plotted relative to the
signal of 50 ng/L Pt in 0% pUF
(▲). On the right y-axis, the
concentration of Pt in ng/L is
plotted ( ), which is calculated
using the internal standard signal
Validation
Limit of quantification
The LLOQ of the assay was set at a Pt concentration of 75.0 ng/L in pUF when using a
standard 100-fold dilution. However, a tenfold dilution of pUF was used to enlarge the
sensitivity of the method to a LLOQ of 7.50 ng/L. Signal to noise ratios at the LLOQ level
ranged between 5 and 10 dependent on the drug-free pUF batch used, which was in
accordance with the requirement that the analyte response at the LLOQ should be at
least 5 times the response in a blank sample [17]. The acceptance criteria, that the LLOQ
60
70
80
90
100
110
0 5 10% pUF
Rela
tive
sign
al o
f 50
ng/L
pl
atin
um (
%)
45
47
49
51
53
55Pl
atin
um c
once
ntra
tion
(in n
g/L)
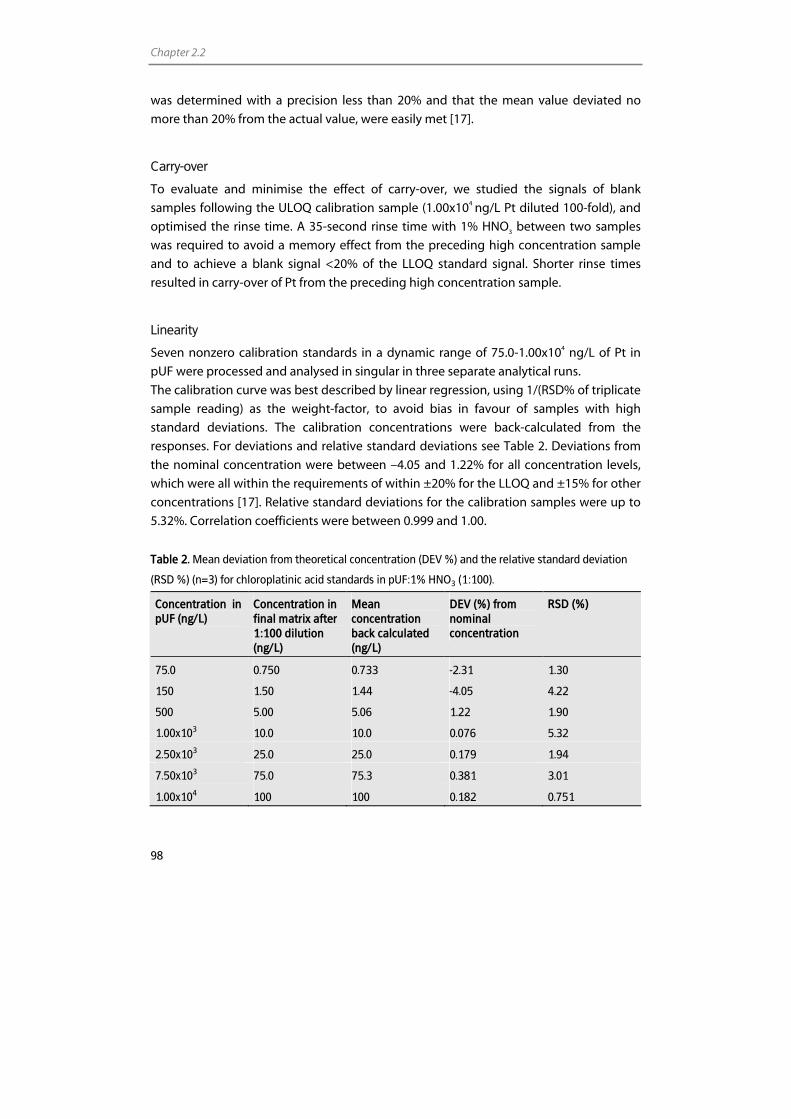
Chapter 2.2
98
was determined with a precision less than 20% and that the mean value deviated no
more than 20% from the actual value, were easily met [17].
Carry-over
To evaluate and minimise the effect of carry-over, we studied the signals of blank
samples following the ULOQ calibration sample (1.00x10⁴ ng/L Pt diluted 100-fold), and
optimised the rinse time. A 35-second rinse time with 1% HNO3 between two samples
was required to avoid a memory effect from the preceding high concentration sample
and to achieve a blank signal <20% of the LLOQ standard signal. Shorter rinse times
resulted in carry-over of Pt from the preceding high concentration sample.
Linearity
Seven nonzero calibration standards in a dynamic range of 75.0-1.00x10⁴ ng/L of Pt in
pUF were processed and analysed in singular in three separate analytical runs.
The calibration curve was best described by linear regression, using 1/(RSD% of triplicate
sample reading) as the weight-factor, to avoid bias in favour of samples with high
standard deviations. The calibration concentrations were back-calculated from the
responses. For deviations and relative standard deviations see Table 2. Deviations from
the nominal concentration were between –4.05 and 1.22% for all concentration levels,
which were all within the requirements of within ±20% for the LLOQ and ±15% for other
concentrations [17]. Relative standard deviations for the calibration samples were up to
5.32%. Correlation coefficients were between 0.999 and 1.00.
Table 2. Mean deviation from theoretical concentration (DEV %) and the relative standard deviation
(RSD %) (n=3) for chloroplatinic acid standards in pUF:1% HNO3 (1:100).
Concentration in pUF (ng/L)
Concentration in final matrix after 1:100 dilution (ng/L)
Mean concentration back calculated (ng/L)
DEV (%) from nominal concentration
RSD (%)
75.0 0.750 0.733 -2.31 1.30
150 1.50 1.44 -4.05 4.22
500 5.00 5.06 1.22 1.90
1.00x10³ 10.0 10.0 0.076 5.32
2.50x10³ 25.0 25.0 0.179 1.94
7.50x10³ 75.0 75.3 0.381 3.01
1.00x10⁴ 100 100 0.182 0.751
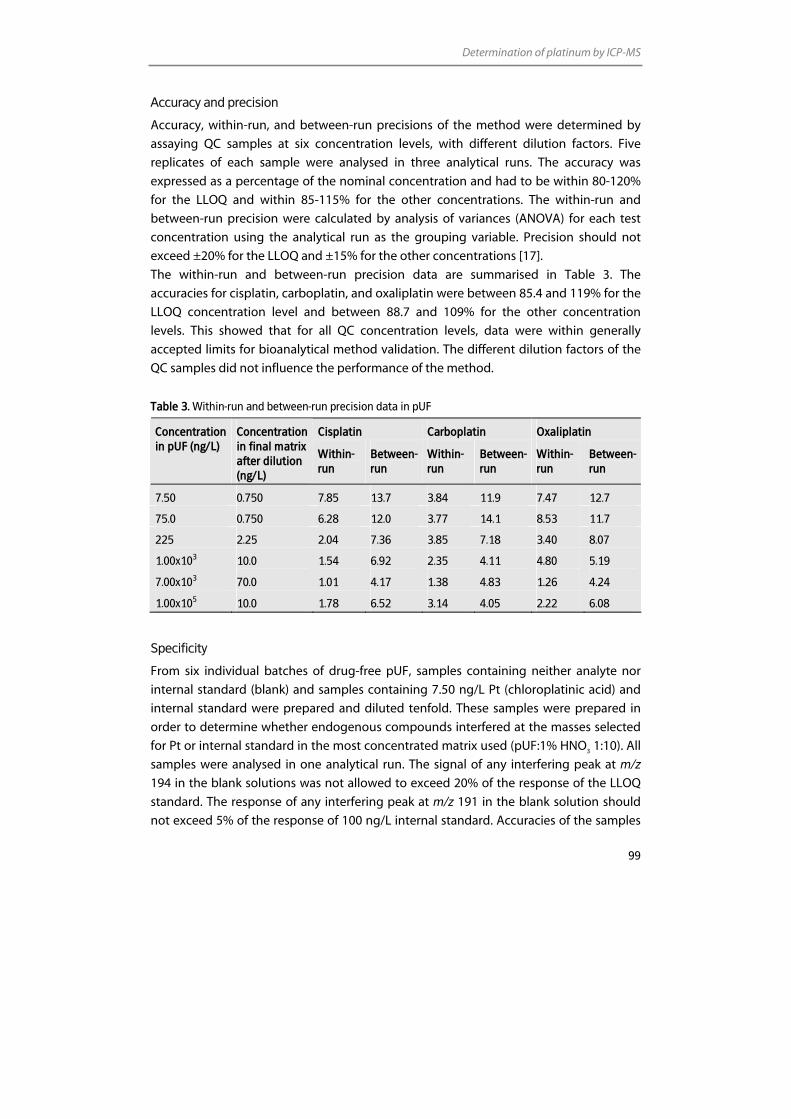
Determination of platinum by ICP-MS
99
Accuracy and precision
Accuracy, within-run, and between-run precisions of the method were determined by
assaying QC samples at six concentration levels, with different dilution factors. Five
replicates of each sample were analysed in three analytical runs. The accuracy was
expressed as a percentage of the nominal concentration and had to be within 80-120%
for the LLOQ and within 85-115% for the other concentrations. The within-run and
between-run precision were calculated by analysis of variances (ANOVA) for each test
concentration using the analytical run as the grouping variable. Precision should not
exceed ±20% for the LLOQ and ±15% for the other concentrations [17].
The within-run and between-run precision data are summarised in Table 3. The
accuracies for cisplatin, carboplatin, and oxaliplatin were between 85.4 and 119% for the
LLOQ concentration level and between 88.7 and 109% for the other concentration
levels. This showed that for all QC concentration levels, data were within generally
accepted limits for bioanalytical method validation. The different dilution factors of the
QC samples did not influence the performance of the method.
Table 3. Within-run and between-run precision data in pUF
Cisplatin Carboplatin Oxaliplatin Concentration in pUF (ng/L)
Concentration in final matrix after dilution (ng/L)
Within-run
Between-run
Within- run
Between-run
Within-run
Between-run
7.50 0.750 7.85 13.7 3.84 11.9 7.47 12.7
75.0 0.750 6.28 12.0 3.77 14.1 8.53 11.7
225 2.25 2.04 7.36 3.85 7.18 3.40 8.07
1.00x10³ 10.0 1.54 6.92 2.35 4.11 4.80 5.19
7.00x10³ 70.0 1.01 4.17 1.38 4.83 1.26 4.24
1.00x10⁵ 10.0 1.78 6.52 3.14 4.05 2.22 6.08
Specificity
From six individual batches of drug-free pUF, samples containing neither analyte nor
internal standard (blank) and samples containing 7.50 ng/L Pt (chloroplatinic acid) and
internal standard were prepared and diluted tenfold. These samples were prepared in
order to determine whether endogenous compounds interfered at the masses selected
for Pt or internal standard in the most concentrated matrix used (pUF:1% HNO3 1:10). All
samples were analysed in one analytical run. The signal of any interfering peak at m/z
194 in the blank solutions was not allowed to exceed 20% of the response of the LLOQ
standard. The response of any interfering peak at m/z 191 in the blank solution should
not exceed 5% of the response of 100 ng/L internal standard. Accuracies of the samples
Chapter 2.2
100
spiked with Pt at the LLOQ standard level had to be within 80-120% of the nominal value
[17].
Blank samples from six individual batches did not show interferences from endogenous
material at the m/z selected for Pt with a response >20% of the LLOQ standard signal.
The response of interfering peaks at m/z 191 did not exceed 5% of the response of 100
ng/L internal standard. Deviations from the nominal concentrations at the LLOQ level
were between –1.85 and 2.27%.
Internal standard interference test
Interference of the internal standard solution on the masses selected for Pt and
interference of Pt on the masses selected for the internal standard had to be assessed.
Drug-free pUF was spiked with Pt at ULOQ standard level and after a 100-fold dilution,
the Ir signal at m/z 191 was monitored. The response of the interfering peak at m/z 191
was less than the maximum allowed 5% of the response of 100 ng/L internal standard.
Drug-free pUF was diluted 1:100 and spiked with 100 ng/L Ir. The response of the
interfering peak at m/z 194 was less than the maximum allowed 20% of the response of
the LLOQ standard.
Stability
Stability was evaluated in Pt and Ir stock and working solutions under both processing
(24 h at ambient temperatures) and storage (2-8 °C) conditions. The analytes were
considered stable in the stock and working solutions when 95-105% of the original
concentration was recovered.
For evaluation of stability of Pt concentrations in pUF during storage and sample
processing, two QC solutions of each Pt agent (cisplatin, carboplatin, and oxaliplatin)
were sampled. Furthermore, two calibration samples in 1:100 diluted pUF containing
chloroplatinic acid were sampled to evaluate the stability of calibration standards.
Short-term stability of the analytes under processing conditions was evaluated by
comparing QC and calibration samples (stored for 24 h at ambient temperatures) with
freshly prepared samples. To determine the stability of diluted QC samples in the
autosampler, QC samples were analysed for one day and concentrations were compared
to concentrations measured at the start of the run.
Furthermore, the stability after three freeze-thaw cycles was investigated by comparing
QC and calibration samples that had been frozen (-20 °C) and thawed three times with
freshly prepared samples. Finally, long-term storage stability was assessed by
determining the Pt concentration in QC and calibration samples before and after three
months storage at -20 °C.
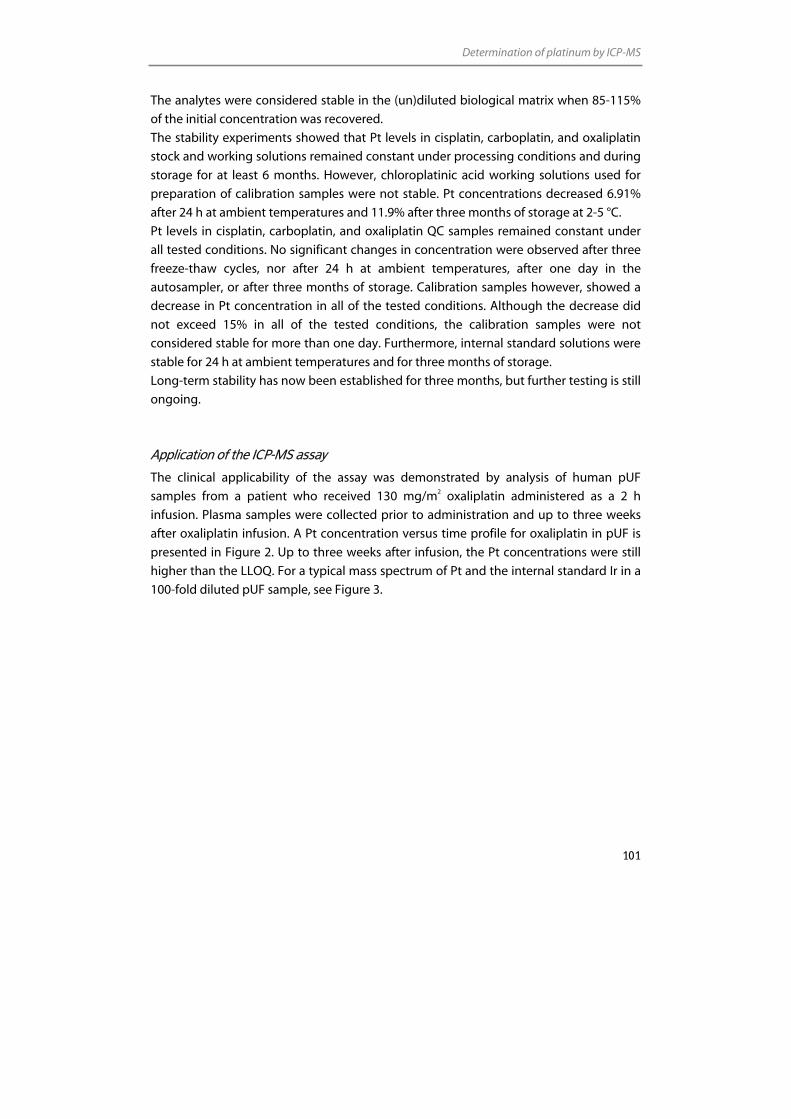
Determination of platinum by ICP-MS
101
The analytes were considered stable in the (un)diluted biological matrix when 85-115%
of the initial concentration was recovered.
The stability experiments showed that Pt levels in cisplatin, carboplatin, and oxaliplatin
stock and working solutions remained constant under processing conditions and during
storage for at least 6 months. However, chloroplatinic acid working solutions used for
preparation of calibration samples were not stable. Pt concentrations decreased 6.91%
after 24 h at ambient temperatures and 11.9% after three months of storage at 2-5 °C.
Pt levels in cisplatin, carboplatin, and oxaliplatin QC samples remained constant under
all tested conditions. No significant changes in concentration were observed after three
freeze-thaw cycles, nor after 24 h at ambient temperatures, after one day in the
autosampler, or after three months of storage. Calibration samples however, showed a
decrease in Pt concentration in all of the tested conditions. Although the decrease did
not exceed 15% in all of the tested conditions, the calibration samples were not
considered stable for more than one day. Furthermore, internal standard solutions were
stable for 24 h at ambient temperatures and for three months of storage.
Long-term stability has now been established for three months, but further testing is still
ongoing.
Application of the ICP-MS assay
The clinical applicability of the assay was demonstrated by analysis of human pUF
samples from a patient who received 130 mg/m2 oxaliplatin administered as a 2 h
infusion. Plasma samples were collected prior to administration and up to three weeks
after oxaliplatin infusion. A Pt concentration versus time profile for oxaliplatin in pUF is
presented in Figure 2. Up to three weeks after infusion, the Pt concentrations were still
higher than the LLOQ. For a typical mass spectrum of Pt and the internal standard Ir in a
100-fold diluted pUF sample, see Figure 3.
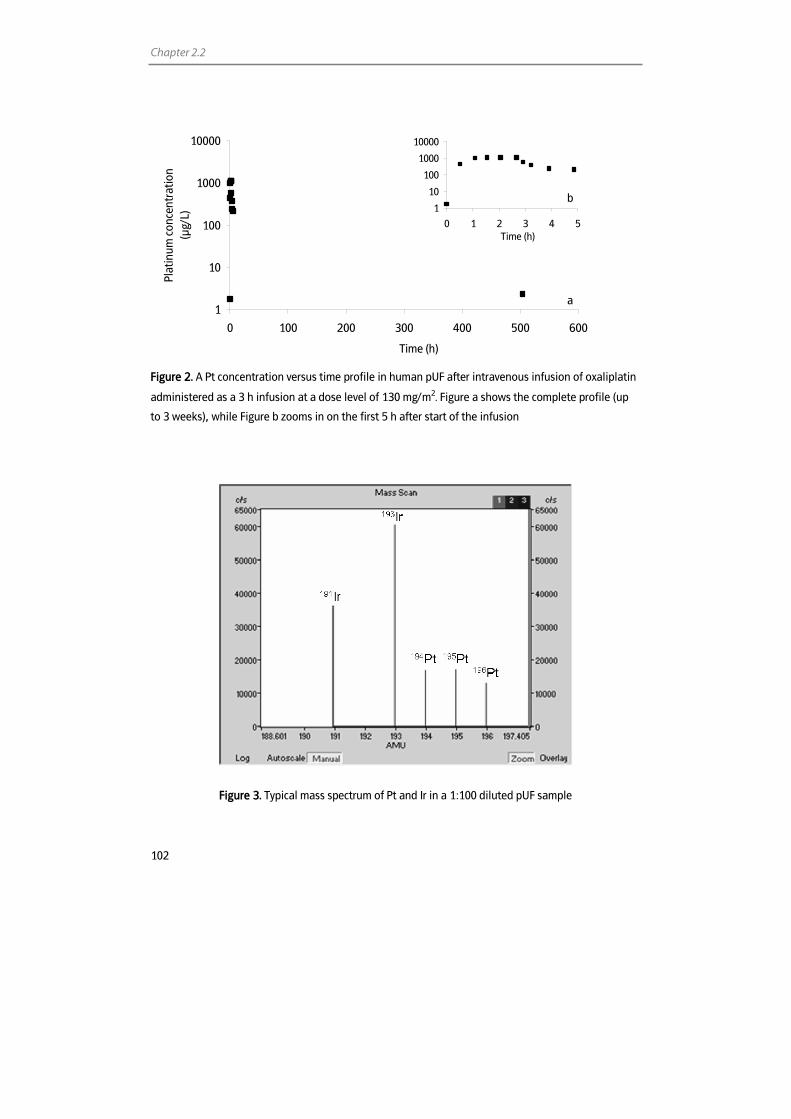
Chapter 2.2
102
1
10
100
1000
10000
0 100 200 300 400 500 600
Time (h)
Plat
inum
con
cent
ratio
n(µ
g/L)
Figure 2. A Pt concentration versus time profile in human pUF after intravenous infusion of oxaliplatin
administered as a 3 h infusion at a dose level of 130 mg/m2. Figure a shows the complete profile (up
to 3 weeks), while Figure b zooms in on the first 5 h after start of the infusion
Figure 3. Typical mass spectrum of Pt and Ir in a 1:100 diluted pUF sample
1
10
100
1000
10000
0 1 2 3 4 5Time (h)
a
b
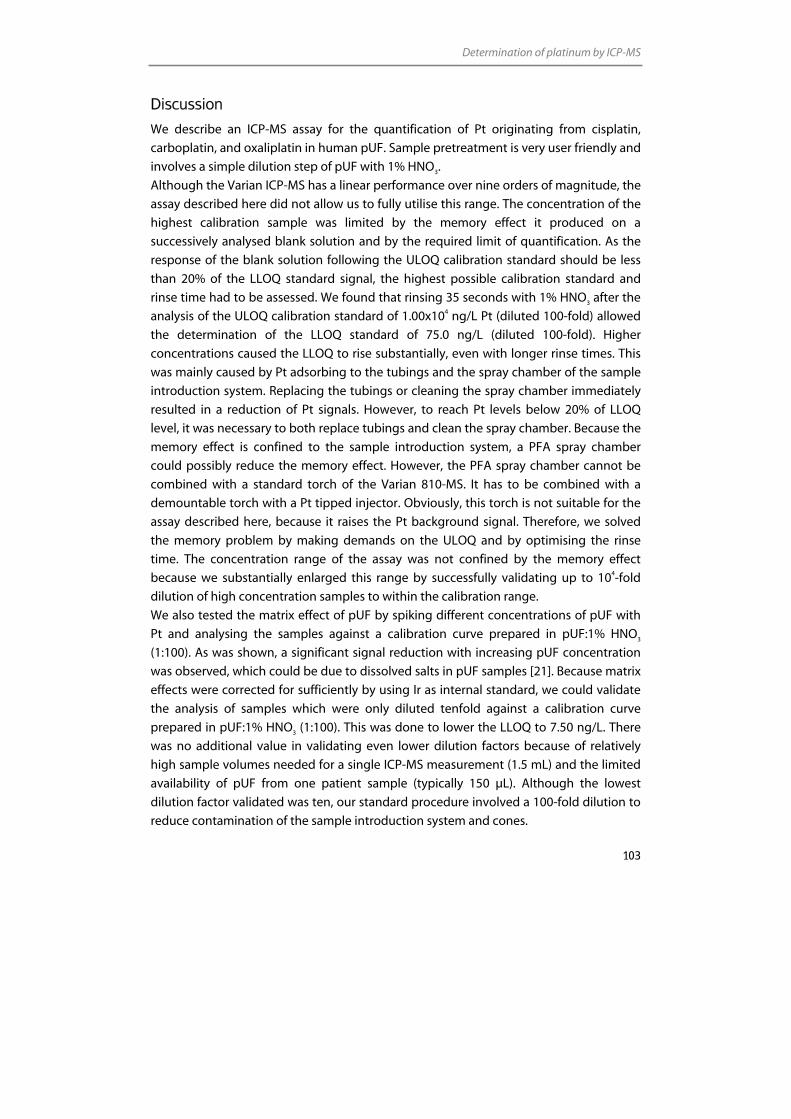
Determination of platinum by ICP-MS
103
Discussion
We describe an ICP-MS assay for the quantification of Pt originating from cisplatin,
carboplatin, and oxaliplatin in human pUF. Sample pretreatment is very user friendly and
involves a simple dilution step of pUF with 1% HNO3.
Although the Varian ICP-MS has a linear performance over nine orders of magnitude, the
assay described here did not allow us to fully utilise this range. The concentration of the
highest calibration sample was limited by the memory effect it produced on a
successively analysed blank solution and by the required limit of quantification. As the
response of the blank solution following the ULOQ calibration standard should be less
than 20% of the LLOQ standard signal, the highest possible calibration standard and
rinse time had to be assessed. We found that rinsing 35 seconds with 1% HNO3 after the
analysis of the ULOQ calibration standard of 1.00x10⁴ ng/L Pt (diluted 100-fold) allowed
the determination of the LLOQ standard of 75.0 ng/L (diluted 100-fold). Higher
concentrations caused the LLOQ to rise substantially, even with longer rinse times. This
was mainly caused by Pt adsorbing to the tubings and the spray chamber of the sample
introduction system. Replacing the tubings or cleaning the spray chamber immediately
resulted in a reduction of Pt signals. However, to reach Pt levels below 20% of LLOQ
level, it was necessary to both replace tubings and clean the spray chamber. Because the
memory effect is confined to the sample introduction system, a PFA spray chamber
could possibly reduce the memory effect. However, the PFA spray chamber cannot be
combined with a standard torch of the Varian 810-MS. It has to be combined with a
demountable torch with a Pt tipped injector. Obviously, this torch is not suitable for the
assay described here, because it raises the Pt background signal. Therefore, we solved
the memory problem by making demands on the ULOQ and by optimising the rinse
time. The concentration range of the assay was not confined by the memory effect
because we substantially enlarged this range by successfully validating up to 104-fold
dilution of high concentration samples to within the calibration range.
We also tested the matrix effect of pUF by spiking different concentrations of pUF with
Pt and analysing the samples against a calibration curve prepared in pUF:1% HNO3
(1:100). As was shown, a significant signal reduction with increasing pUF concentration
was observed, which could be due to dissolved salts in pUF samples [21]. Because matrix
effects were corrected for sufficiently by using Ir as internal standard, we could validate
the analysis of samples which were only diluted tenfold against a calibration curve
prepared in pUF:1% HNO3 (1:100). This was done to lower the LLOQ to 7.50 ng/L. There
was no additional value in validating even lower dilution factors because of relatively
high sample volumes needed for a single ICP-MS measurement (1.5 mL) and the limited
availability of pUF from one patient sample (typically 150 µL). Although the lowest
dilution factor validated was ten, our standard procedure involved a 100-fold dilution to
reduce contamination of the sample introduction system and cones.
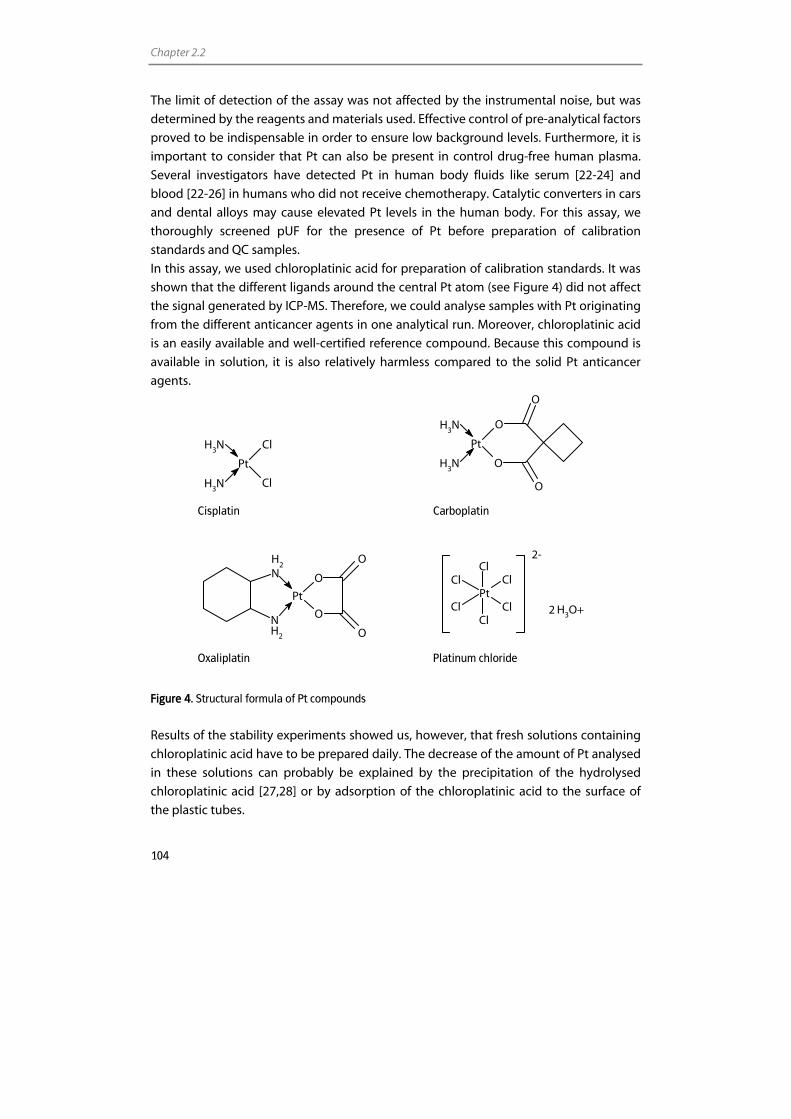
Chapter 2.2
104
The limit of detection of the assay was not affected by the instrumental noise, but was
determined by the reagents and materials used. Effective control of pre-analytical factors
proved to be indispensable in order to ensure low background levels. Furthermore, it is
important to consider that Pt can also be present in control drug-free human plasma.
Several investigators have detected Pt in human body fluids like serum [22-24] and
blood [22-26] in humans who did not receive chemotherapy. Catalytic converters in cars
and dental alloys may cause elevated Pt levels in the human body. For this assay, we
thoroughly screened pUF for the presence of Pt before preparation of calibration
standards and QC samples.
In this assay, we used chloroplatinic acid for preparation of calibration standards. It was
shown that the different ligands around the central Pt atom (see Figure 4) did not affect
the signal generated by ICP-MS. Therefore, we could analyse samples with Pt originating
from the different anticancer agents in one analytical run. Moreover, chloroplatinic acid
is an easily available and well-certified reference compound. Because this compound is
available in solution, it is also relatively harmless compared to the solid Pt anticancer
agents.
Pt
Cl
Cl
NH3
NH3
O
O
O
O
Pt
NH3
NH3
Cisplatin Carboplatin
Pt
O
O
O
O
NH
2
NH2
Pt
Cl
Cl
Cl
Cl
Cl
Cl
H3O+
2-
2
Oxaliplatin Platinum chloride
Figure 4. Structural formula of Pt compounds
Results of the stability experiments showed us, however, that fresh solutions containing
chloroplatinic acid have to be prepared daily. The decrease of the amount of Pt analysed
in these solutions can probably be explained by the precipitation of the hydrolysed
chloroplatinic acid [27,28] or by adsorption of the chloroplatinic acid to the surface of
the plastic tubes.
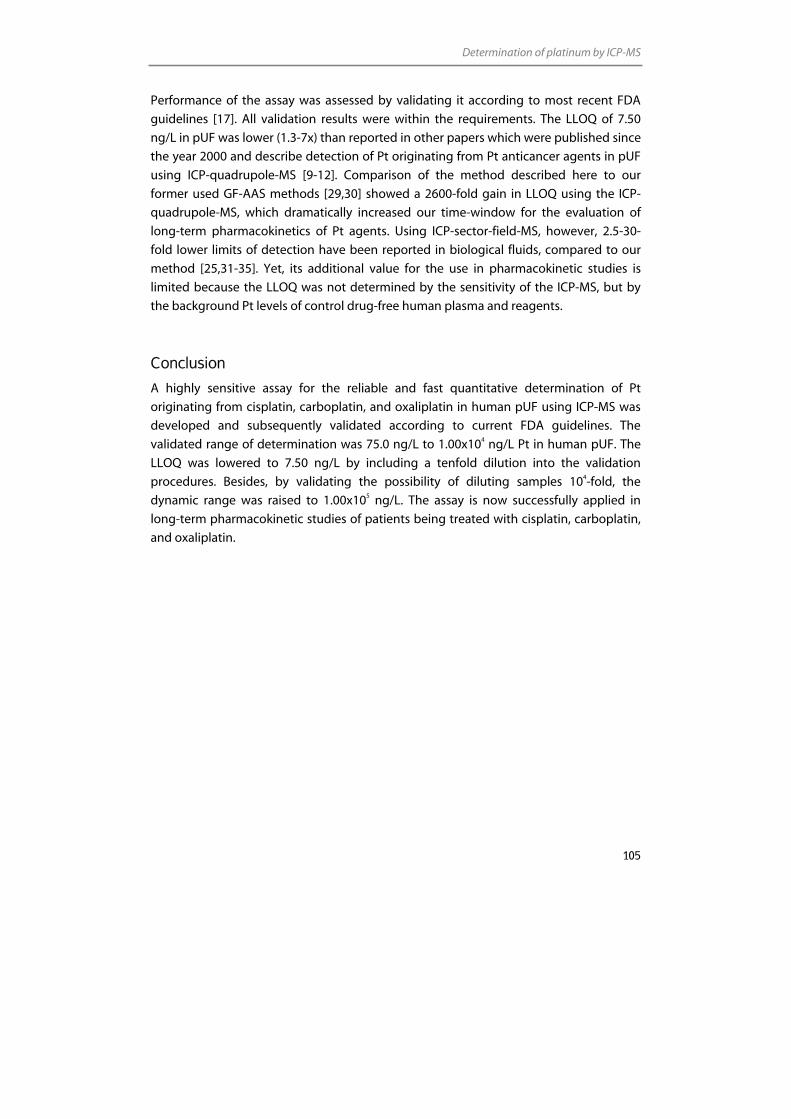
Determination of platinum by ICP-MS
105
Performance of the assay was assessed by validating it according to most recent FDA
guidelines [17]. All validation results were within the requirements. The LLOQ of 7.50
ng/L in pUF was lower (1.3-7x) than reported in other papers which were published since
the year 2000 and describe detection of Pt originating from Pt anticancer agents in pUF
using ICP-quadrupole-MS [9-12]. Comparison of the method described here to our
former used GF-AAS methods [29,30] showed a 2600-fold gain in LLOQ using the ICP-
quadrupole-MS, which dramatically increased our time-window for the evaluation of
long-term pharmacokinetics of Pt agents. Using ICP-sector-field-MS, however, 2.5-30-
fold lower limits of detection have been reported in biological fluids, compared to our
method [25,31-35]. Yet, its additional value for the use in pharmacokinetic studies is
limited because the LLOQ was not determined by the sensitivity of the ICP-MS, but by
the background Pt levels of control drug-free human plasma and reagents.
Conclusion
A highly sensitive assay for the reliable and fast quantitative determination of Pt
originating from cisplatin, carboplatin, and oxaliplatin in human pUF using ICP-MS was
developed and subsequently validated according to current FDA guidelines. The
validated range of determination was 75.0 ng/L to 1.00x10⁴ ng/L Pt in human pUF. The
LLOQ was lowered to 7.50 ng/L by including a tenfold dilution into the validation
procedures. Besides, by validating the possibility of diluting samples 104-fold, the
dynamic range was raised to 1.00x10⁵ ng/L. The assay is now successfully applied in
long-term pharmacokinetic studies of patients being treated with cisplatin, carboplatin,
and oxaliplatin.
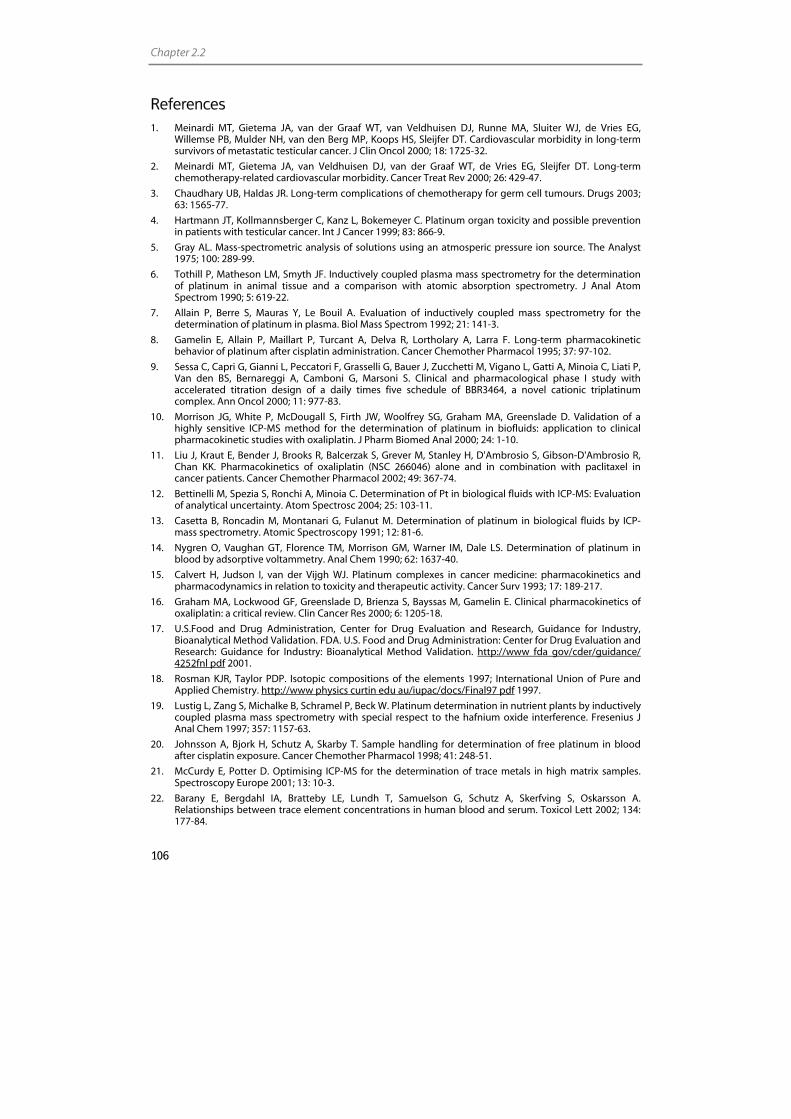
Chapter 2.2
106
References 1. Meinardi MT, Gietema JA, van der Graaf WT, van Veldhuisen DJ, Runne MA, Sluiter WJ, de Vries EG,
Willemse PB, Mulder NH, van den Berg MP, Koops HS, Sleijfer DT. Cardiovascular morbidity in long-term survivors of metastatic testicular cancer. J Clin Oncol 2000; 18: 1725-32.
2. Meinardi MT, Gietema JA, van Veldhuisen DJ, van der Graaf WT, de Vries EG, Sleijfer DT. Long-term chemotherapy-related cardiovascular morbidity. Cancer Treat Rev 2000; 26: 429-47.
3. Chaudhary UB, Haldas JR. Long-term complications of chemotherapy for germ cell tumours. Drugs 2003; 63: 1565-77.
4. Hartmann JT, Kollmannsberger C, Kanz L, Bokemeyer C. Platinum organ toxicity and possible prevention in patients with testicular cancer. Int J Cancer 1999; 83: 866-9.
5. Gray AL. Mass-spectrometric analysis of solutions using an atmosperic pressure ion source. The Analyst 1975; 100: 289-99.
6. Tothill P, Matheson LM, Smyth JF. Inductively coupled plasma mass spectrometry for the determination of platinum in animal tissue and a comparison with atomic absorption spectrometry. J Anal Atom Spectrom 1990; 5: 619-22.
7. Allain P, Berre S, Mauras Y, Le Bouil A. Evaluation of inductively coupled mass spectrometry for the determination of platinum in plasma. Biol Mass Spectrom 1992; 21: 141-3.
8. Gamelin E, Allain P, Maillart P, Turcant A, Delva R, Lortholary A, Larra F. Long-term pharmacokinetic behavior of platinum after cisplatin administration. Cancer Chemother Pharmacol 1995; 37: 97-102.
9. Sessa C, Capri G, Gianni L, Peccatori F, Grasselli G, Bauer J, Zucchetti M, Vigano L, Gatti A, Minoia C, Liati P, Van den BS, Bernareggi A, Camboni G, Marsoni S. Clinical and pharmacological phase I study with accelerated titration design of a daily times five schedule of BBR3464, a novel cationic triplatinum complex. Ann Oncol 2000; 11: 977-83.
10. Morrison JG, White P, McDougall S, Firth JW, Woolfrey SG, Graham MA, Greenslade D. Validation of a highly sensitive ICP-MS method for the determination of platinum in biofluids: application to clinical pharmacokinetic studies with oxaliplatin. J Pharm Biomed Anal 2000; 24: 1-10.
11. Liu J, Kraut E, Bender J, Brooks R, Balcerzak S, Grever M, Stanley H, D'Ambrosio S, Gibson-D'Ambrosio R, Chan KK. Pharmacokinetics of oxaliplatin (NSC 266046) alone and in combination with paclitaxel in cancer patients. Cancer Chemother Pharmacol 2002; 49: 367-74.
12. Bettinelli M, Spezia S, Ronchi A, Minoia C. Determination of Pt in biological fluids with ICP-MS: Evaluation of analytical uncertainty. Atom Spectrosc 2004; 25: 103-11.
13. Casetta B, Roncadin M, Montanari G, Fulanut M. Determination of platinum in biological fluids by ICP-mass spectrometry. Atomic Spectroscopy 1991; 12: 81-6.
14. Nygren O, Vaughan GT, Florence TM, Morrison GM, Warner IM, Dale LS. Determination of platinum in blood by adsorptive voltammetry. Anal Chem 1990; 62: 1637-40.
15. Calvert H, Judson I, van der Vijgh WJ. Platinum complexes in cancer medicine: pharmacokinetics and pharmacodynamics in relation to toxicity and therapeutic activity. Cancer Surv 1993; 17: 189-217.
16. Graham MA, Lockwood GF, Greenslade D, Brienza S, Bayssas M, Gamelin E. Clinical pharmacokinetics of oxaliplatin: a critical review. Clin Cancer Res 2000; 6: 1205-18.
17. U.S.Food and Drug Administration, Center for Drug Evaluation and Research, Guidance for Industry, Bioanalytical Method Validation. FDA. U.S. Food and Drug Administration: Center for Drug Evaluation and Research: Guidance for Industry: Bioanalytical Method Validation. http://www fda gov/cder/guidance/ 4252fnl pdf 2001.
18. Rosman KJR, Taylor PDP. Isotopic compositions of the elements 1997; International Union of Pure and Applied Chemistry. http://www physics curtin edu au/iupac/docs/Final97 pdf 1997.
19. Lustig L, Zang S, Michalke B, Schramel P, Beck W. Platinum determination in nutrient plants by inductively coupled plasma mass spectrometry with special respect to the hafnium oxide interference. Fresenius J Anal Chem 1997; 357: 1157-63.
20. Johnsson A, Bjork H, Schutz A, Skarby T. Sample handling for determination of free platinum in blood after cisplatin exposure. Cancer Chemother Pharmacol 1998; 41: 248-51.
21. McCurdy E, Potter D. Optimising ICP-MS for the determination of trace metals in high matrix samples. Spectroscopy Europe 2001; 13: 10-3.
22. Barany E, Bergdahl IA, Bratteby LE, Lundh T, Samuelson G, Schutz A, Skerfving S, Oskarsson A. Relationships between trace element concentrations in human blood and serum. Toxicol Lett 2002; 134: 177-84.
Determination of platinum by ICP-MS
107
23. Barany E, Bergdahl IA, Bratteby LE, Lundh T, Samuelson G, Schutz A, Skerfving S, Oskarsson A. Trace element levels in whole blood and serum from Swedish adolescents. Sci Total Environ 2002; 286: 129-41.
24. Goulle JP, Mahieu L, Castermant J, Neveu N, Bonneau L, Laine G, Bouige D, Lacroix C. Metal and metalloid multi-elementary ICP-MS validation in whole blood, plasma, urine and hair Reference values. Forensic Sci Int 2005; 153: 39-44.
25. Begerow J, Turfeld M, Dunemann L. Determination of physiological palladium, platinum, iridium and gold levels in human blood using double focusing magnetic sector field inductively coupled plasma mass spectrometry. Journal of Analytical Atomic Spectrometry 1997; 12: 1095-8.
26. Messerschmidt J, Alt F, Tolg G, Angerer J, Schaller KH. Adsorptive voltammetric procedure for the determination of platinum baseline levels in human body fluids. Fresenius J Anal Chem 1992; 343: 391-4.
27. Spieker WA, Liu J, Miller JT, Kropf AJ, Regalbuto JR. An EXAFS study of the co-ordination chemistry of hydrogen hexachloroplatinate(IV) 1. Speciation in aqueous solution. Applied Catalysis A: General 2002; 232: 219-35.
28. Nischwitz V, Michalke B, Kettrup A. Speciation of Pt(II) and Pt(IV) in spiked extracts from road dust using on-line liquid chromatography-inductively coupled plasma mass spectrometry. J Chromatogr A 2003; 1016: 223-34.
29. van Warmerdam LJC, van Tellingen O, Maes RAA, Beijnen JH. Validated method for the determination of carboplatin in biological fluids by Zeeman atomic absorption spectrometry. Fresenius J Anal Chem 1995; 351: 777-81.
30. Brouwers EEM, Tibben MM, Joerger M, van Tellingen O, Rosing H, Schellens JHM, Beijnen JH. Determination of oxaliplatin in human plasma and plasma ultrafiltrate by graphite-furnace atomic-absorption spectrometry. Anal Bioanal Chem 2005; 382: 1484-90.
31. Hann S, Koellensperger G, Kanitsar K, Stingeder G, Brunner M, Erovic B, Muller M, Reiter C. Platinum determination by inductively coupled plasma-sector field mass spectrometry (ICP-SFMS) in different matrices relevant to human biomonitoring. Anal Bioanal Chem 2003; 376: 198-204.
32. Krachler M, Alimonti A, Petrucci F, Irgolic KJ, Forastiere F, Caroli S. Analytical problems in the determination of platinum-group metals in urine by quadrupole and magnetic sector field inductively coupled plasma mass spectrometry. Analytica Chimica Acta 1998; 363: 1-10.
33. Rodushkin I, Engstrom E, Stenberg A, Baxter DC. Determination of low-abundance elements at ultra-trace levels in urine and serum by inductively coupled plasma-sector field mass spectrometry. Anal Bioanal Chem 2004; 380: 247-57.
34. Begerow J, Turfeld M, Dunemann L. Determination of physiological palladium and platinum levels in urine using double focusing magnetic sector field ICP-MS. Fresenius J Anal Chem 1997; 359: 427-9.
35. Spezia S, Bocca B, Forte G, Gatti A, Mincione G, Ronchi A, Bavazzano P, Alimonti A, Minoia C. Comparison of inductively coupled plasma mass spectrometry techniques in the determination of platinum in urine: quadrupole vs. sector field. Rapid Commun Mass Spectrom 2005; 19: 1551-6.

Chapter 2.3
Determination of ruthenium originating from the investigational anticancer drug NAMI-A in human plasma ultrafiltrate,
plasma, and urine by inductively coupled plasma mass spectrometry
Elke E.M. Brouwers Matthijs M. Tibben
Hilde Rosing Jan H.M. Schellens
Jos H. Beijnen
Rapid Communications in Mass Spectrometry 2007; 21; 1521-1530
Chapter 2.3
110
Abstract
We present a highly sensitive, rapid method for the determination of ruthenium (Ru)
originating from the investigational anticancer drug NAMI-A in human plasma
ultrafiltrate, plasma, and urine. The method is based on the quantification of Ru by
inductively coupled plasma mass spectrometry and allows quantification of 30 ng/L Ru
in plasma ultrafiltrate and urine, and 75 ng/L Ru in human plasma in 150 µL of matrix.
The sample pretreatment procedure is straight forward and only involves dilution with
appropriate diluents. The performance of the method, in terms of accuracy and
precision, fulfilled the most recent FDA guidelines for bioanalytical method validation.
Validated ranges of quantification were 30.0 to 1x10⁵ ng/L for Ru in plasma ultrafiltrate
and urine and 75.0 to 1x10⁵ ng/L for Ru in plasma. The applicability of the method and its
superiority to atomic absorption spectrometry were demonstrated in two patients who
were treated with intravenous NAMI-A in a phase I trial. The assay is now successfully
used to support pharmacokinetic studies in cancer patients treated with NAMI-A.
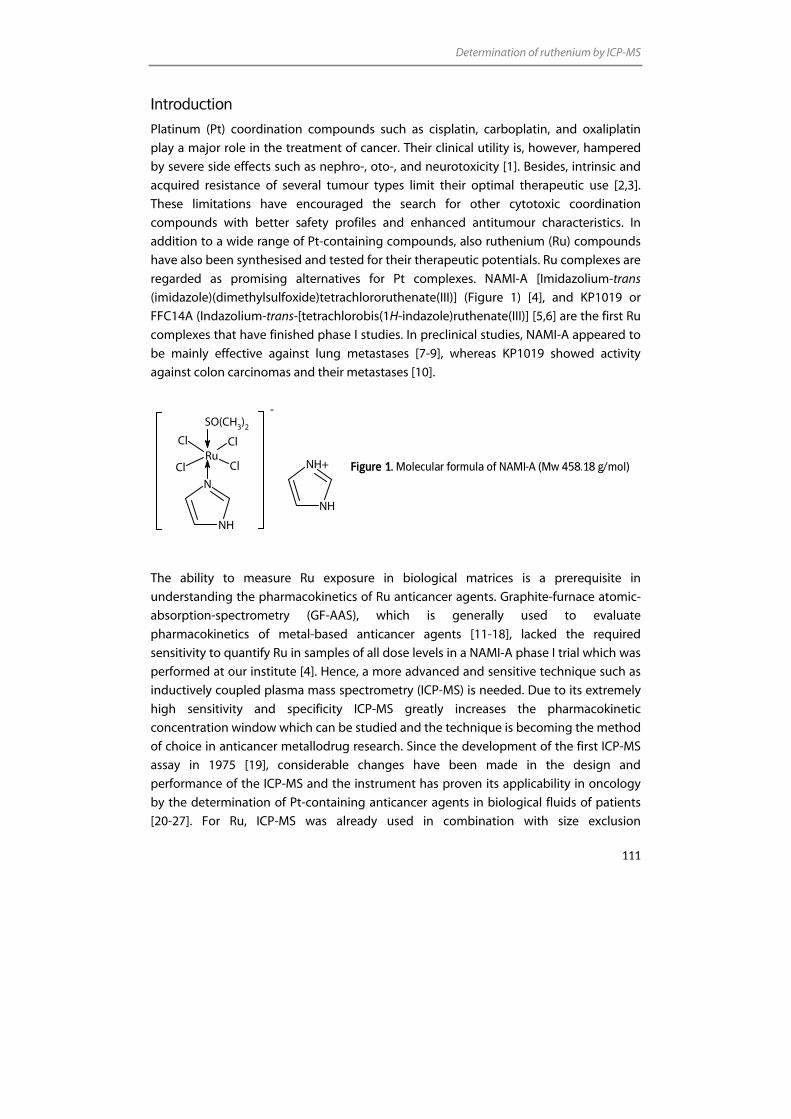
Determination of ruthenium by ICP-MS
111
Introduction
Platinum (Pt) coordination compounds such as cisplatin, carboplatin, and oxaliplatin
play a major role in the treatment of cancer. Their clinical utility is, however, hampered
by severe side effects such as nephro-, oto-, and neurotoxicity [1]. Besides, intrinsic and
acquired resistance of several tumour types limit their optimal therapeutic use [2,3].
These limitations have encouraged the search for other cytotoxic coordination
compounds with better safety profiles and enhanced antitumour characteristics. In
addition to a wide range of Pt-containing compounds, also ruthenium (Ru) compounds
have also been synthesised and tested for their therapeutic potentials. Ru complexes are
regarded as promising alternatives for Pt complexes. NAMI-A [Imidazolium-trans
(imidazole)(dimethylsulfoxide)tetrachlororuthenate(III)] (Figure 1) [4], and KP1019 or
FFC14A (Indazolium-trans-[tetrachlorobis(1H-indazole)ruthenate(III)] [5,6] are the first Ru
complexes that have finished phase I studies. In preclinical studies, NAMI-A appeared to
be mainly effective against lung metastases [7-9], whereas KP1019 showed activity
against colon carcinomas and their metastases [10].
Figure 1. Molecular formula of NAMI-A (Mw 458.18 g/mol)
The ability to measure Ru exposure in biological matrices is a prerequisite in
understanding the pharmacokinetics of Ru anticancer agents. Graphite-furnace atomic-
absorption-spectrometry (GF-AAS), which is generally used to evaluate
pharmacokinetics of metal-based anticancer agents [11-18], lacked the required
sensitivity to quantify Ru in samples of all dose levels in a NAMI-A phase I trial which was
performed at our institute [4]. Hence, a more advanced and sensitive technique such as
inductively coupled plasma mass spectrometry (ICP-MS) is needed. Due to its extremely
high sensitivity and specificity ICP-MS greatly increases the pharmacokinetic
concentration window which can be studied and the technique is becoming the method
of choice in anticancer metallodrug research. Since the development of the first ICP-MS
assay in 1975 [19], considerable changes have been made in the design and
performance of the ICP-MS and the instrument has proven its applicability in oncology
by the determination of Pt-containing anticancer agents in biological fluids of patients
[20-27]. For Ru, ICP-MS was already used in combination with size exclusion
N
NH
-
NH+
NH
RuClCl
Cl Cl
SO(CH3)2
Chapter 2.3
112
chromatography (SEC) to study the interaction of Ru compounds with serum proteins
[28-30]. However, until now, no ICP-MS method has been described for the
determination of Ru originating from anticancer agents in biological fluids.
In order to assess Ru levels originating from NAMI-A in ultrafiltrated plasma (pUF),
plasma, and urine, we developed a highly sensitive, rapid ICP-MS assay. For this method,
samples were diluted with appropriate diluents to prevent contamination of the sample
introduction system. Although the presence of polyatomic interferences from matrix
components confined the quantification limits, the method was still 740- (pUF), 1500-
(plasma), and 3700- (urine) fold more sensitive than the GF-AAS method published by
Crul et al. [11].
In this article we describe the development and validation of the method, according to
most recent FDA guidelines on bioanalytical method validation [31]. Validated ranges of
quantification were 30.0 to 1x10⁴ ng/L for Ru in plasma ultrafiltrate and urine and 75.0 to
1x10⁴ ng/L for Ru in plasma. The applicability of the method and its superiority to GF-
AAS were demonstrated in two patients who had been treated intravenously with NAMI-
A in a phase I trial.
Experimental
Chemicals
NAMI-A reference standard, used for preparation of calibration solution and quality
control (QC) samples, was obtained from the Department of Chemical Sciences,
University of Trieste, Italy. Yttrium ICP standard, containing 1,000 mg/L yttrium (Y), used
for internal standardisation, was purchased from Merck (Darmstadt, Germany). Nitric
acid (HNO3) 70% Ultrex II ultrapure reagent was obtained from Mallinckrodt Baker
(Philipsburg, NJ, USA). Edta diammonium salt and Triton X-100 (4-oxtylphenol
polyethoxylate) were from Sigma-Aldrich (St. Louis, MO, USA). Water used for the ICP-MS
analysis was sterile water for irrigation (Aqua B. Braun Medical, Melsungen, Germany). A
multi-element solution containing 10 mg/L of Ba, Be, Ce, Co, In, Mg, Pb, Th, and Tl (VAR-
TS-MS) was purchased from Inorganic Ventures/IV Labs (Lakewood, NJ, USA). Drug-free
human heparinised plasma was obtained from the Central Laboratory for Blood
Transfusion (Sanquin, Amsterdam, The Netherlands). Drug-free urine from healthy
volunteers was used. Van Linde Gas Benelux (Schiedam, the Netherlands) provided
argon gas (4.6) of 99.996% purity.
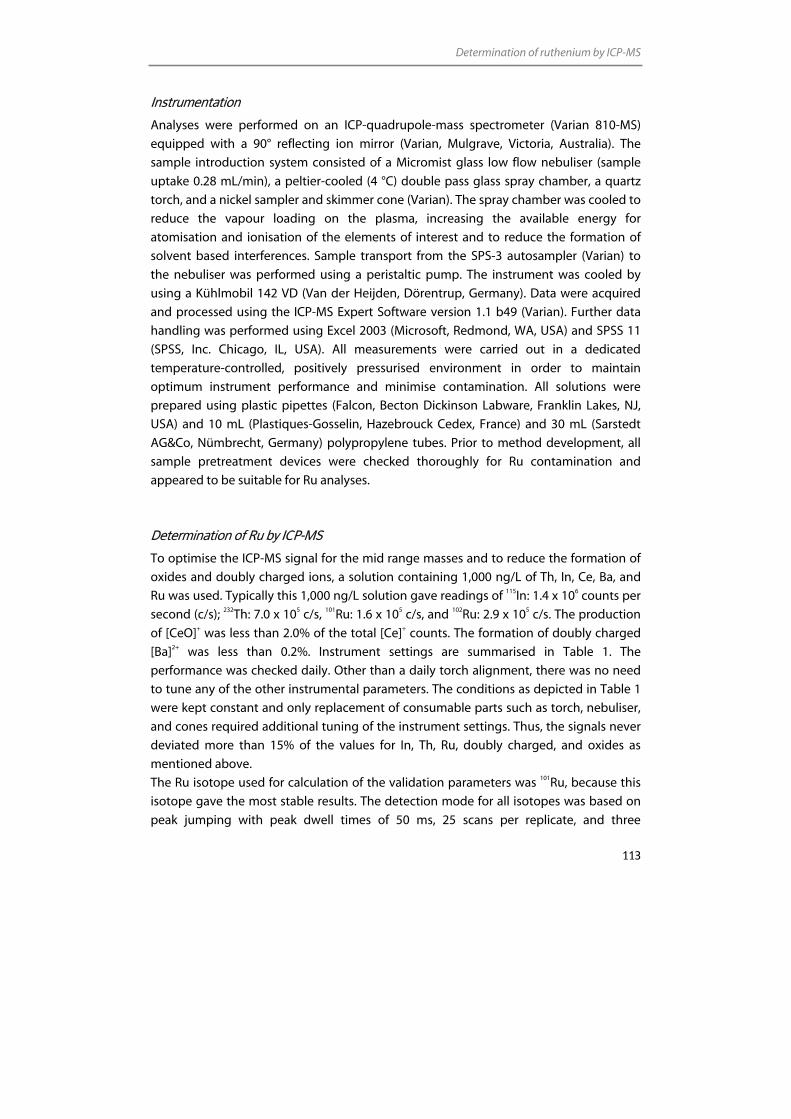
Determination of ruthenium by ICP-MS
113
Instrumentation
Analyses were performed on an ICP-quadrupole-mass spectrometer (Varian 810-MS)
equipped with a 90° reflecting ion mirror (Varian, Mulgrave, Victoria, Australia). The
sample introduction system consisted of a Micromist glass low flow nebuliser (sample
uptake 0.28 mL/min), a peltier-cooled (4 °C) double pass glass spray chamber, a quartz
torch, and a nickel sampler and skimmer cone (Varian). The spray chamber was cooled to
reduce the vapour loading on the plasma, increasing the available energy for
atomisation and ionisation of the elements of interest and to reduce the formation of
solvent based interferences. Sample transport from the SPS-3 autosampler (Varian) to
the nebuliser was performed using a peristaltic pump. The instrument was cooled by
using a Kühlmobil 142 VD (Van der Heijden, Dörentrup, Germany). Data were acquired
and processed using the ICP-MS Expert Software version 1.1 b49 (Varian). Further data
handling was performed using Excel 2003 (Microsoft, Redmond, WA, USA) and SPSS 11
(SPSS, Inc. Chicago, IL, USA). All measurements were carried out in a dedicated
temperature-controlled, positively pressurised environment in order to maintain
optimum instrument performance and minimise contamination. All solutions were
prepared using plastic pipettes (Falcon, Becton Dickinson Labware, Franklin Lakes, NJ,
USA) and 10 mL (Plastiques-Gosselin, Hazebrouck Cedex, France) and 30 mL (Sarstedt
AG&Co, Nümbrecht, Germany) polypropylene tubes. Prior to method development, all
sample pretreatment devices were checked thoroughly for Ru contamination and
appeared to be suitable for Ru analyses.
Determination of Ru by ICP-MS
To optimise the ICP-MS signal for the mid range masses and to reduce the formation of
oxides and doubly charged ions, a solution containing 1,000 ng/L of Th, In, Ce, Ba, and
Ru was used. Typically this 1,000 ng/L solution gave readings of 115In: 1.4 x 10⁶ counts per
second (c/s); 232Th: 7.0 x 10⁵ c/s, 101Ru: 1.6 x 10⁵ c/s, and 102Ru: 2.9 x 10⁵ c/s. The production
of [CeO]+ was less than 2.0% of the total [Ce]+ counts. The formation of doubly charged
[Ba]2+ was less than 0.2%. Instrument settings are summarised in Table 1. The
performance was checked daily. Other than a daily torch alignment, there was no need
to tune any of the other instrumental parameters. The conditions as depicted in Table 1
were kept constant and only replacement of consumable parts such as torch, nebuliser,
and cones required additional tuning of the instrument settings. Thus, the signals never
deviated more than 15% of the values for In, Th, Ru, doubly charged, and oxides as
mentioned above.
The Ru isotope used for calculation of the validation parameters was 101Ru, because this
isotope gave the most stable results. The detection mode for all isotopes was based on
peak jumping with peak dwell times of 50 ms, 25 scans per replicate, and three
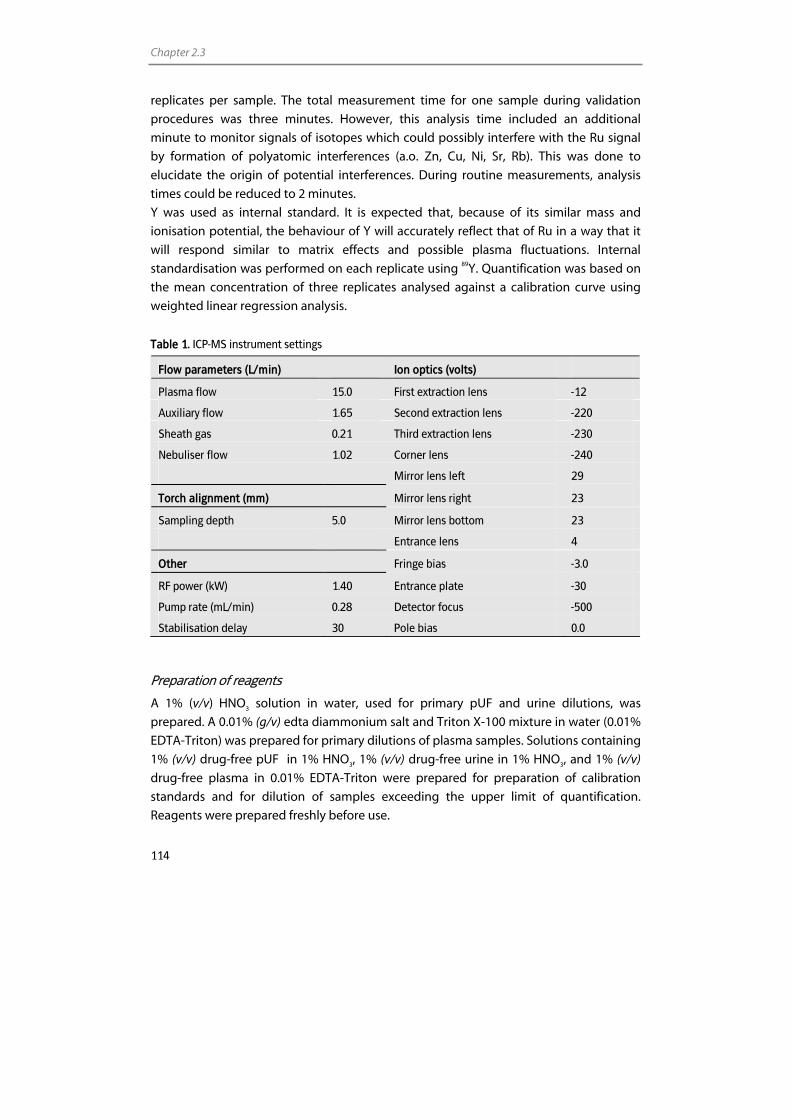
Chapter 2.3
114
replicates per sample. The total measurement time for one sample during validation
procedures was three minutes. However, this analysis time included an additional
minute to monitor signals of isotopes which could possibly interfere with the Ru signal
by formation of polyatomic interferences (a.o. Zn, Cu, Ni, Sr, Rb). This was done to
elucidate the origin of potential interferences. During routine measurements, analysis
times could be reduced to 2 minutes.
Y was used as internal standard. It is expected that, because of its similar mass and
ionisation potential, the behaviour of Y will accurately reflect that of Ru in a way that it
will respond similar to matrix effects and possible plasma fluctuations. Internal
standardisation was performed on each replicate using 89Y. Quantification was based on
the mean concentration of three replicates analysed against a calibration curve using
weighted linear regression analysis.
Table 1. ICP-MS instrument settings
Flow parameters (L/min) Ion optics (volts)
Plasma flow 15.0 First extraction lens -12
Auxiliary flow 1.65 Second extraction lens -220
Sheath gas 0.21 Third extraction lens -230
Nebuliser flow 1.02 Corner lens -240
Mirror lens left 29
Torch alignment (mm) Mirror lens right 23
Sampling depth 5.0 Mirror lens bottom 23
Entrance lens 4
Other Fringe bias -3.0
RF power (kW) 1.40 Entrance plate -30
Pump rate (mL/min) 0.28 Detector focus -500
Stabilisation delay 30 Pole bias 0.0
Preparation of reagents
A 1% (v/v) HNO3 solution in water, used for primary pUF and urine dilutions, was
prepared. A 0.01% (g/v) edta diammonium salt and Triton X-100 mixture in water (0.01%
EDTA-Triton) was prepared for primary dilutions of plasma samples. Solutions containing
1% (v/v) drug-free pUF in 1% HNO3, 1% (v/v) drug-free urine in 1% HNO3, and 1% (v/v)
drug-free plasma in 0.01% EDTA-Triton were prepared for preparation of calibration
standards and for dilution of samples exceeding the upper limit of quantification.
Reagents were prepared freshly before use.
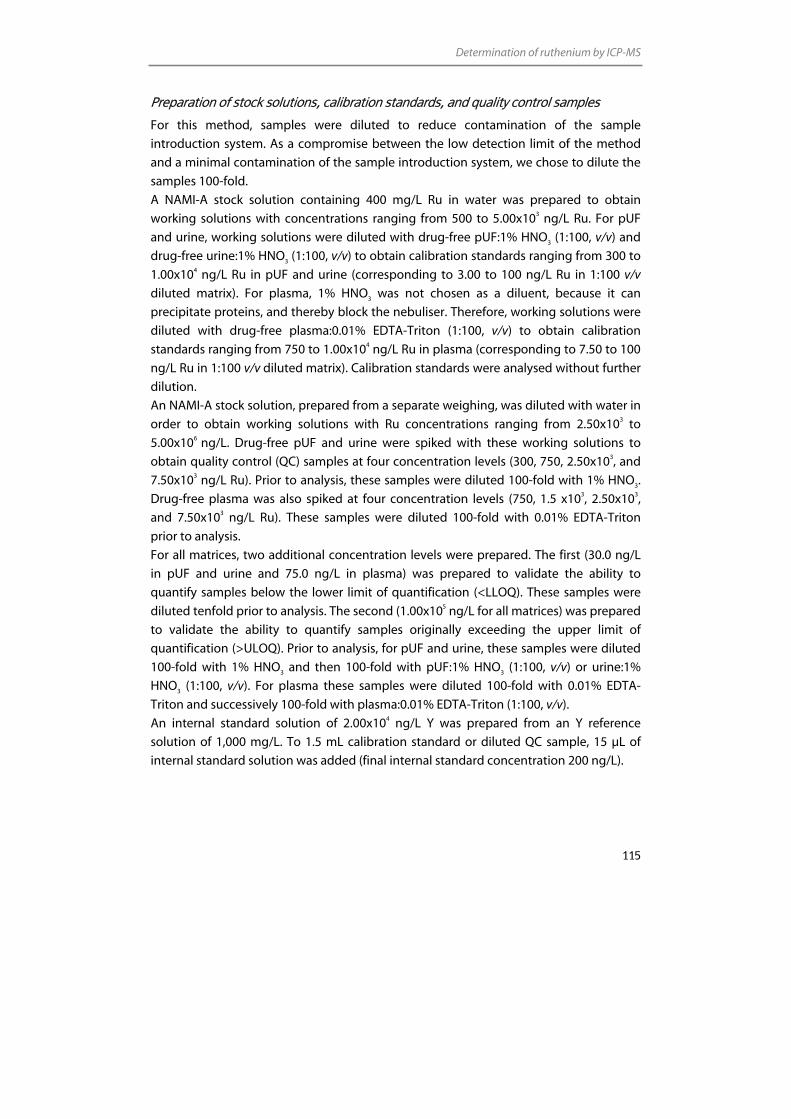
Determination of ruthenium by ICP-MS
115
Preparation of stock solutions, calibration standards, and quality control samples
For this method, samples were diluted to reduce contamination of the sample
introduction system. As a compromise between the low detection limit of the method
and a minimal contamination of the sample introduction system, we chose to dilute the
samples 100-fold.
A NAMI-A stock solution containing 400 mg/L Ru in water was prepared to obtain
working solutions with concentrations ranging from 500 to 5.00x10³ ng/L Ru. For pUF
and urine, working solutions were diluted with drug-free pUF:1% HNO3 (1:100, v/v) and
drug-free urine:1% HNO3 (1:100, v/v) to obtain calibration standards ranging from 300 to
1.00x10⁴ ng/L Ru in pUF and urine (corresponding to 3.00 to 100 ng/L Ru in 1:100 v/v
diluted matrix). For plasma, 1% HNO3 was not chosen as a diluent, because it can
precipitate proteins, and thereby block the nebuliser. Therefore, working solutions were
diluted with drug-free plasma:0.01% EDTA-Triton (1:100, v/v) to obtain calibration
standards ranging from 750 to 1.00x10⁴ ng/L Ru in plasma (corresponding to 7.50 to 100
ng/L Ru in 1:100 v/v diluted matrix). Calibration standards were analysed without further
dilution.
An NAMI-A stock solution, prepared from a separate weighing, was diluted with water in
order to obtain working solutions with Ru concentrations ranging from 2.50x10³ to
5.00x10⁶ ng/L. Drug-free pUF and urine were spiked with these working solutions to
obtain quality control (QC) samples at four concentration levels (300, 750, 2.50x10³, and
7.50x10³ ng/L Ru). Prior to analysis, these samples were diluted 100-fold with 1% HNO3.
Drug-free plasma was also spiked at four concentration levels (750, 1.5 x10³, 2.50x10³,
and 7.50x10³ ng/L Ru). These samples were diluted 100-fold with 0.01% EDTA-Triton
prior to analysis.
For all matrices, two additional concentration levels were prepared. The first (30.0 ng/L
in pUF and urine and 75.0 ng/L in plasma) was prepared to validate the ability to
quantify samples below the lower limit of quantification (<LLOQ). These samples were
diluted tenfold prior to analysis. The second (1.00x10⁵ ng/L for all matrices) was prepared
to validate the ability to quantify samples originally exceeding the upper limit of
quantification (>ULOQ). Prior to analysis, for pUF and urine, these samples were diluted
100-fold with 1% HNO3 and then 100-fold with pUF:1% HNO3 (1:100, v/v) or urine:1%
HNO3 (1:100, v/v). For plasma these samples were diluted 100-fold with 0.01% EDTA-
Triton and successively 100-fold with plasma:0.01% EDTA-Triton (1:100, v/v).
An internal standard solution of 2.00x10⁴ ng/L Y was prepared from an Y reference
solution of 1,000 mg/L. To 1.5 mL calibration standard or diluted QC sample, 15 µL of
internal standard solution was added (final internal standard concentration 200 ng/L).
Chapter 2.3
116
Sample pretreatment
Whole blood samples were collected in 10 mL heparin-containing tubes (Becton
Dickinson Vacutainer Systems, Plymouth, UK). Plasma was obtained by centrifuging the
whole blood samples for 5 min (1,000 g, 4 °C). PUF was obtained by centrifuging the
plasma fraction through a 30 kDa cut-off ultrafiltrate filter (Centriplus YM-30, Millipore
Corporation, Bedford, MA, USA) for 10 min (1,000 g, 20 °C). The preparation of pUF from
plasma was performed immediately after blood collection, to prevent the decrease of
free Ru levels due to progressive ex vivo binding of Ru to plasma proteins. Urine samples
were collected in 30 mL polypropylene tubes (Sarstedt AG&Co, Nümbrecht, Germany).
All samples were stored at –20 °C until analysis. Prior to analysis, pUF and urine samples
were thawed, vortex mixed and subsequently diluted 100-fold with 1% HNO3 solution.
However, when a pUF or urine sample was expected to have a Ru concentration under
the LLOQ (300 ng/L), the sample was diluted tenfold with a 1% HNO3 solution. When a
pUF or urine sample contained a Ru concentration above the ULOQ (1.00x10⁴ ng/L),
successive dilutions in pUF:1% HNO3 (1:100, v/v) or urine:1% HNO3 (1:100, v/v) were
performed. A similar procedure was followed for plasma samples. However, these were
diluted with a 0.01% EDTA-Triton solution and if necessary successively with a
plasma:0.01% EDTA-Triton solution (1:100, v/v). To each 1.5 mL diluted sample, 15 µL of
internal standard solution was added. Subsequently, diluted samples were transferred to
autosampler tubes.
Validation procedures
For the pUF assay, full validation according to the FDA guidelines [31] was, as far as
applicable for ICP-MS, performed. For urine and plasma, a partial validation was carried
out. According to the FDA guidelines a partial validation is sufficient to test the method,
when a change in matrix with the same analyte is concerned. A full validation required
the assessment of linearity, accuracy, and precision in three analytical runs, whereas a
partial validation only required the assessment of these parameters in one analytical run.
Application of ICP-MS assay
The analytical method described in this paper is used to support clinical pharmaco-
kinetic studies of NAMI-A. Phase I study samples from a patient who was treated with 2.4
mg/m2 NAMI-A, which could not be analysed by GF-AAS [4] due to its lack of sensitivity,
were analysed using the method described here. Additionally, samples of a patient who
was treated with 78 mg/m2 NAMI-A, which could be partly analysed by GF-AAS, were re-
analysed to demonstrate the reliability of both techniques. Plasma samples were taken
Determination of ruthenium by ICP-MS
117
up to 24 h after the intravenous administration of NAMI-A and pUF samples were
obtained and processed as described above.
Non-compartmental pharmacokinetics parameters (terminal half-life (t1/2) and area under
the concentration-time curve (AUC) from time point 0 to 24 h) were estimated by the
computer program WinNonlinTM (version 5.0, Pharsight Corporation, Mountain View,
California, USA). The maximal drug concentration (Cmax) was derived directly from the
experimental data.
Results and discussion
Validation
Interferences
The determination of Ru by ICP-MS might be hampered by the presence of spectral
interferences originating from the biological matrices. Unfortunately, ICP-quadrupole-
MS lacks the resolution power to separate interfering mass to charge (m/z) ratios from
analyte m/z signals, because the quadrupole mass analyser limits the resolution to
approximately one unit mass. ICP-sector-field-MS could reduce this problem; however,
Rodushkin et al. showed that, even when using this technique, not all interferences
could be separated [32]. Despite the presence of interferences, the limit of detection of
ICP-quadrupole-MS was judged sufficient for the investigation of Ru pharmacokinetics
after a NAMI-A infusion.
To prevent spectral interferences, a careful selection of the analyte isotope was of prime
importance. In order to select the most suitable isotope and to evaluate unresolved
spectral interferences, scans of 1% HNO3, 0.01% EDTA-Triton, and drug-free pUF, urine,
and plasma were made covering the Ru masses of interest (99Ru (natural abundance
12.7%), 101Ru (17.0%), 102Ru (31.6%), and 104Ru (18.7%) [33]). Of each human matrix, six
batches were selected, which were all diluted tenfold prior to analysis. The signal
intensities of the ions are shown in Table 2. To get an impression of the height of the
signals, Table 2 also shows the signal intensities of each isotope of 1 ng/L Ru in 1% HNO3.
As expected, the diluents 1% HNO3 and 0.01% EDTA-Triton did not show interfering
peaks at the m/z ratios of Ru, indicating that the noise of the instrument was negligible.
Data from Table 2 show that, compared to 1% HNO3 and 0.01% EDTA-Triton, increased
signals were observed for all isotopes in the biological matrices. Because the ratios of the
intensities of the Ru isotopes did not approach the natural ratios, these raised signals
reflect, at least partly, substantial interferences. [64Zn35Cl]+, [59Co40Ar]+, and [63Cu36Ar]+ ions
may interfere with 99Ru analysis in plasma and urine. Although 101Ru suffers from only
minor interferences, increased signals for plasma samples, probably due to [65Cu36Ar]+,
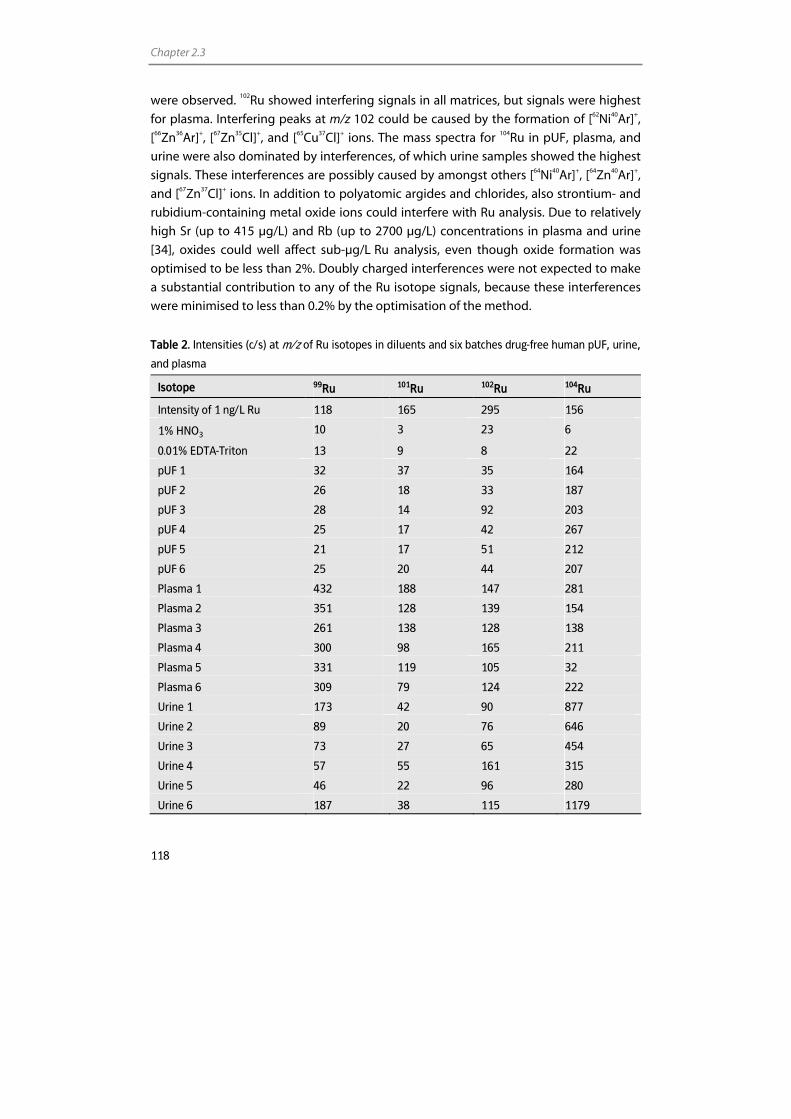
Chapter 2.3
118
were observed. 102Ru showed interfering signals in all matrices, but signals were highest
for plasma. Interfering peaks at m/z 102 could be caused by the formation of [62Ni40Ar]+,
[66Zn36Ar]+, [67Zn35Cl]+, and [65Cu37Cl]+ ions. The mass spectra for 104Ru in pUF, plasma, and
urine were also dominated by interferences, of which urine samples showed the highest
signals. These interferences are possibly caused by amongst others [64Ni40Ar]+, [64Zn40Ar]+,
and [67Zn37Cl]+ ions. In addition to polyatomic argides and chlorides, also strontium- and
rubidium-containing metal oxide ions could interfere with Ru analysis. Due to relatively
high Sr (up to 415 µg/L) and Rb (up to 2700 µg/L) concentrations in plasma and urine
[34], oxides could well affect sub-µg/L Ru analysis, even though oxide formation was
optimised to be less than 2%. Doubly charged interferences were not expected to make
a substantial contribution to any of the Ru isotope signals, because these interferences
were minimised to less than 0.2% by the optimisation of the method.
Table 2. Intensities (c/s) at m/z of Ru isotopes in diluents and six batches drug-free human pUF, urine,
and plasma
Isotope 99Ru 101Ru 102Ru 104Ru
Intensity of 1 ng/L Ru 118 165 295 156
1% HNO3 10 3 23 6
0.01% EDTA-Triton 13 9 8 22
pUF 1 32 37 35 164
pUF 2 26 18 33 187
pUF 3 28 14 92 203
pUF 4 25 17 42 267
pUF 5 21 17 51 212
pUF 6 25 20 44 207
Plasma 1 432 188 147 281
Plasma 2 351 128 139 154
Plasma 3 261 138 128 138
Plasma 4 300 98 165 211
Plasma 5 331 119 105 32
Plasma 6 309 79 124 222
Urine 1 173 42 90 877
Urine 2 89 20 76 646
Urine 3 73 27 65 454
Urine 4 57 55 161 315
Urine 5 46 22 96 280
Urine 6 187 38 115 1179
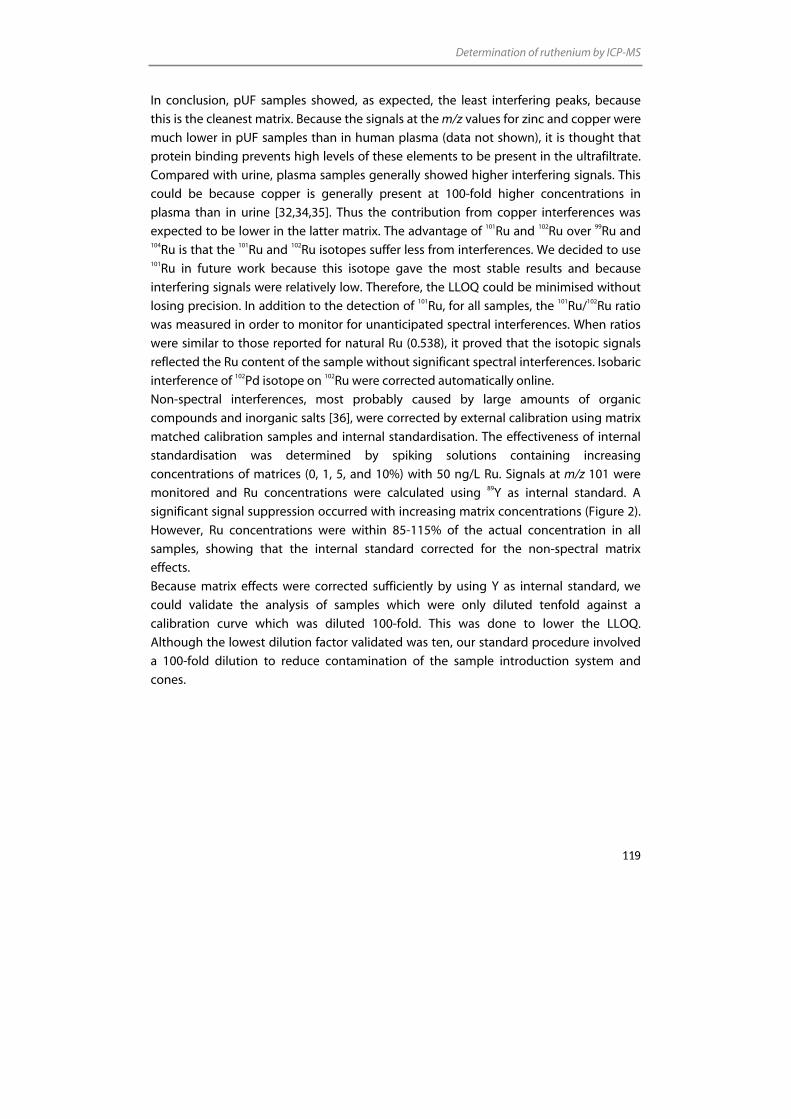
Determination of ruthenium by ICP-MS
119
In conclusion, pUF samples showed, as expected, the least interfering peaks, because
this is the cleanest matrix. Because the signals at the m/z values for zinc and copper were
much lower in pUF samples than in human plasma (data not shown), it is thought that
protein binding prevents high levels of these elements to be present in the ultrafiltrate.
Compared with urine, plasma samples generally showed higher interfering signals. This
could be because copper is generally present at 100-fold higher concentrations in
plasma than in urine [32,34,35]. Thus the contribution from copper interferences was
expected to be lower in the latter matrix. The advantage of 101Ru and 102Ru over 99Ru and 104Ru is that the 101Ru and 102Ru isotopes suffer less from interferences. We decided to use 101Ru in future work because this isotope gave the most stable results and because
interfering signals were relatively low. Therefore, the LLOQ could be minimised without
losing precision. In addition to the detection of 101Ru, for all samples, the 101Ru/102Ru ratio
was measured in order to monitor for unanticipated spectral interferences. When ratios
were similar to those reported for natural Ru (0.538), it proved that the isotopic signals
reflected the Ru content of the sample without significant spectral interferences. Isobaric
interference of 102Pd isotope on 102Ru were corrected automatically online.
Non-spectral interferences, most probably caused by large amounts of organic
compounds and inorganic salts [36], were corrected by external calibration using matrix
matched calibration samples and internal standardisation. The effectiveness of internal
standardisation was determined by spiking solutions containing increasing
concentrations of matrices (0, 1, 5, and 10%) with 50 ng/L Ru. Signals at m/z 101 were
monitored and Ru concentrations were calculated using 89Y as internal standard. A
significant signal suppression occurred with increasing matrix concentrations (Figure 2).
However, Ru concentrations were within 85-115% of the actual concentration in all
samples, showing that the internal standard corrected for the non-spectral matrix
effects.
Because matrix effects were corrected sufficiently by using Y as internal standard, we
could validate the analysis of samples which were only diluted tenfold against a
calibration curve which was diluted 100-fold. This was done to lower the LLOQ.
Although the lowest dilution factor validated was ten, our standard procedure involved
a 100-fold dilution to reduce contamination of the sample introduction system and
cones.
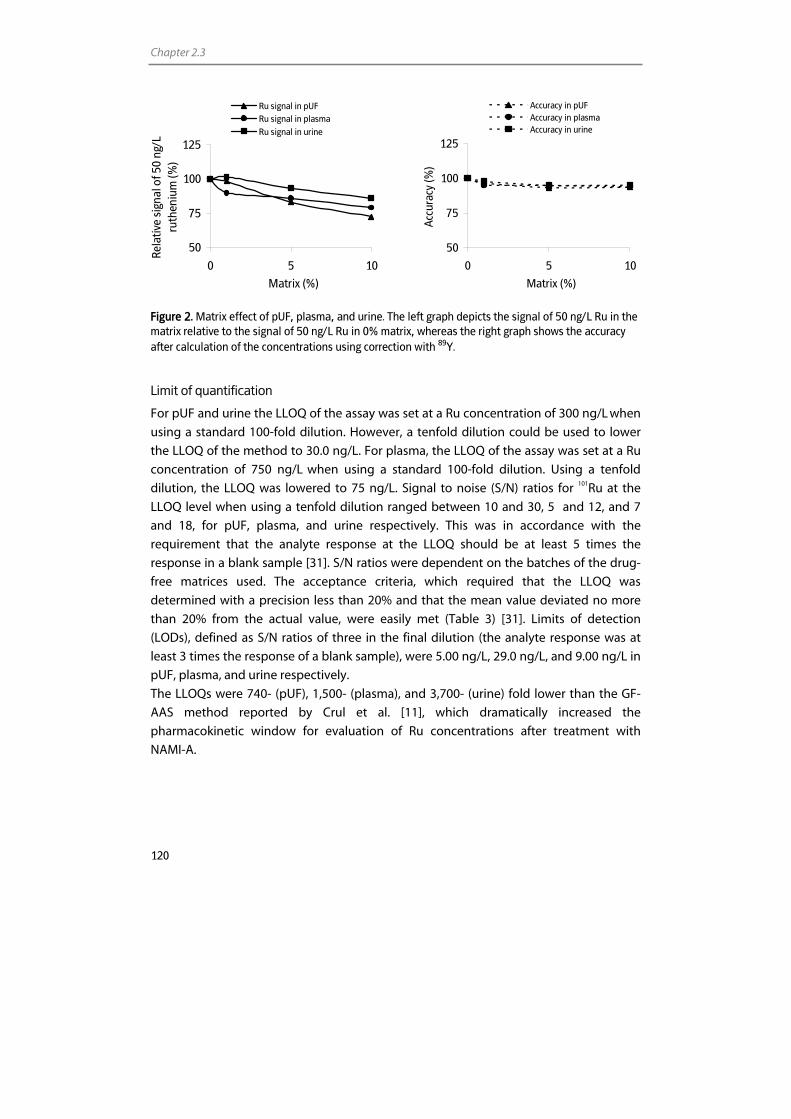
Chapter 2.3
120
50
75
100
125
0 5 10
Matrix (%)
Acc
urac
y (%
)
Accuracy in pUF Accuracy in plasmaAccuracy in urine
Figure 2. Matrix effect of pUF, plasma, and urine. The left graph depicts the signal of 50 ng/L Ru in the matrix relative to the signal of 50 ng/L Ru in 0% matrix, whereas the right graph shows the accuracy after calculation of the concentrations using correction with 89Y.
Limit of quantification
For pUF and urine the LLOQ of the assay was set at a Ru concentration of 300 ng/L when
using a standard 100-fold dilution. However, a tenfold dilution could be used to lower
the LLOQ of the method to 30.0 ng/L. For plasma, the LLOQ of the assay was set at a Ru
concentration of 750 ng/L when using a standard 100-fold dilution. Using a tenfold
dilution, the LLOQ was lowered to 75 ng/L. Signal to noise (S/N) ratios for 101Ru at the
LLOQ level when using a tenfold dilution ranged between 10 and 30, 5 and 12, and 7
and 18, for pUF, plasma, and urine respectively. This was in accordance with the
requirement that the analyte response at the LLOQ should be at least 5 times the
response in a blank sample [31]. S/N ratios were dependent on the batches of the drug-
free matrices used. The acceptance criteria, which required that the LLOQ was
determined with a precision less than 20% and that the mean value deviated no more
than 20% from the actual value, were easily met (Table 3) [31]. Limits of detection
(LODs), defined as S/N ratios of three in the final dilution (the analyte response was at
least 3 times the response of a blank sample), were 5.00 ng/L, 29.0 ng/L, and 9.00 ng/L in
pUF, plasma, and urine respectively.
The LLOQs were 740- (pUF), 1,500- (plasma), and 3,700- (urine) fold lower than the GF-
AAS method reported by Crul et al. [11], which dramatically increased the
pharmacokinetic window for evaluation of Ru concentrations after treatment with
NAMI-A.
50
75
100
125
0 5 10
Matrix (%)
Rela
tive
sign
al o
f 50
ng/L
ru
then
ium
(%)
Ru signal in pUFRu signal in plasmaRu signal in urine
Determination of ruthenium by ICP-MS
121
Carry-over
Although ICP-MS has a linear performance over nine orders of magnitude, the assay
described here did not allow us to fully utilise this range. The concentration of the
highest calibration sample was limited by the memory effect it produced and by the
desired LLOQ. The response of a blank solution following the ULOQ calibration standard
should be less than 20% of the LLOQ standard signal. Therefore, the highest possible
calibration standard and optimal rinse time had to be assessed.
To evaluate and minimise the effect of carry-over, we studied the signals of blank
readings following the ULOQ calibration sample (1.00x10⁴ ng/L Ru diluted 100-fold) and
we optimised the rinse time. A 20 s rinse time with 1% HNO3 between two samples was
required to avoid a memory effect from the preceding high concentration sample and to
allow the determination of 300 ng/L (diluted 100-fold) in pUF and urine and 750 ng/L
(diluted 100-fold) in plasma.
Samples above the ULOQ should be diluted to fit them within the calibration range and
re-assayed. Dilutions up to 104 were validated (see Table 3).
Linearity
Seven non-zero calibration standards in a dynamic range of 300-1.00x10⁴ ng/L of Ru in
pUF and urine and of 750-1.00x10⁴ ng/L of Ru in plasma were processed and single
measurements were performed. For pUF, calibration samples were analysed in three
separate analytical runs. As a partial validation was carried out for urine and plasma,
calibration samples for these matrices were analysed in one analytical run.
The calibration curves were best described by linear regression, using 1/(relative
standard deviation (RSD) of triplicate sample reading) as weight-factor, to avoid bias in
favour of samples with high standard deviations or high concentrations. The calibration
concentrations were back-calculated from the responses. In Table 4, deviations for pUF,
plasma, and urine and relative standard deviations (RSD) for pUF are presented.
Deviations from the nominal concentration were between –2.09 and 3.24% for all
concentration levels, which all met the requirements of within ±20% for the LLOQ and
±15% for other concentrations [31]. RSDs for the calibration samples in pUF were less
than 5.17%. Correlation coefficients were better than > 0.9999.
Accuracy and precision
The accuracy and precision of the method were determined by assaying QC samples at
six concentration levels, with different dilution factors. For pUF, the accuracy, and
within- and between-run precision data were assessed by analysing five replicates of
each sample in three analytical runs. For plasma and urine, the accuracy and within-run
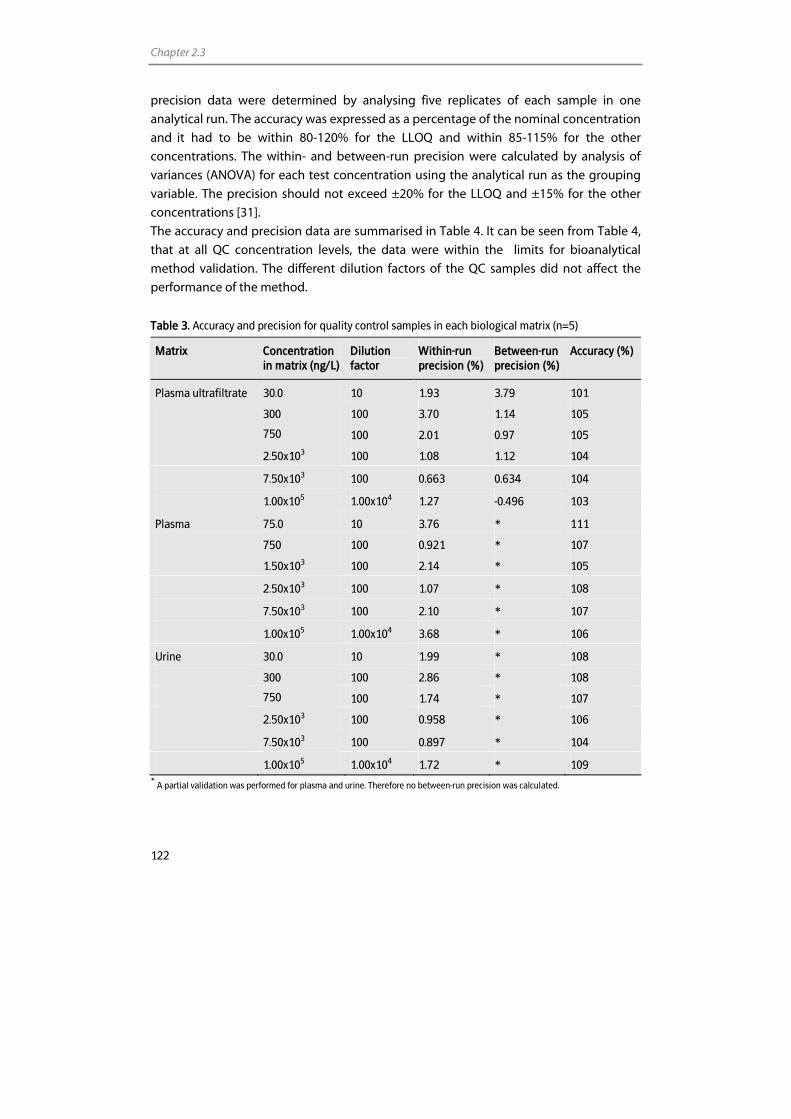
Chapter 2.3
122
precision data were determined by analysing five replicates of each sample in one
analytical run. The accuracy was expressed as a percentage of the nominal concentration
and it had to be within 80-120% for the LLOQ and within 85-115% for the other
concentrations. The within- and between-run precision were calculated by analysis of
variances (ANOVA) for each test concentration using the analytical run as the grouping
variable. The precision should not exceed ±20% for the LLOQ and ±15% for the other
concentrations [31].
The accuracy and precision data are summarised in Table 4. It can be seen from Table 4,
that at all QC concentration levels, the data were within the limits for bioanalytical
method validation. The different dilution factors of the QC samples did not affect the
performance of the method.
Table 3. Accuracy and precision for quality control samples in each biological matrix (n=5)
Matrix
Concentration in matrix (ng/L)
Dilution factor
Within-run precision (%)
Between-run precision (%)
Accuracy (%)
Plasma ultrafiltrate 30.0 10 1.93 3.79 101
300 100 3.70 1.14 105
750 100 2.01 0.97 105
2.50x10³ 100 1.08 1.12 104
7.50x10³ 100 0.663 0.634 104
1.00x10⁵ 1.00x10⁴ 1.27 -0.496 103
Plasma 75.0 10 3.76 * 111
750 100 0.921 * 107
1.50x10³ 100 2.14 * 105
2.50x10³ 100 1.07 * 108
7.50x10³ 100 2.10 * 107
1.00x10⁵ 1.00x10⁴ 3.68 * 106
Urine 30.0 10 1.99 * 108
300 100 2.86 * 108
750 100 1.74 * 107
2.50x10³ 100 0.958 * 106
7.50x10³ 100 0.897 * 104
1.00x10⁵ 1.00x10⁴ 1.72 * 109 *
A partial validation was performed for plasma and urine. Therefore no between-run precision was calculated.
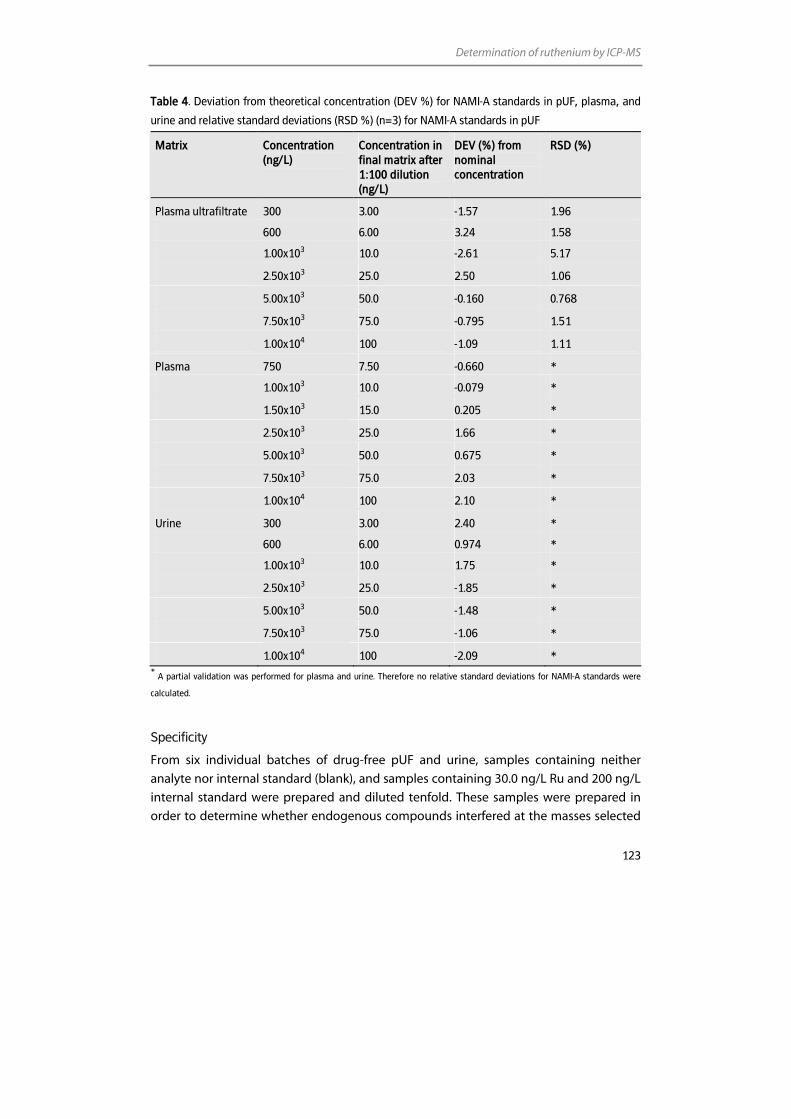
Determination of ruthenium by ICP-MS
123
Table 4. Deviation from theoretical concentration (DEV %) for NAMI-A standards in pUF, plasma, and
urine and relative standard deviations (RSD %) (n=3) for NAMI-A standards in pUF
Matrix Concentration (ng/L)
Concentration in final matrix after 1:100 dilution (ng/L)
DEV (%) from nominal concentration
RSD (%)
Plasma ultrafiltrate 300 3.00 -1.57 1.96
600 6.00 3.24 1.58
1.00x10³ 10.0 -2.61 5.17
2.50x10³ 25.0 2.50 1.06
5.00x10³ 50.0 -0.160 0.768
7.50x10³ 75.0 -0.795 1.51
1.00x10⁴ 100 -1.09 1.11
Plasma 750 7.50 -0.660 *
1.00x103 10.0 -0.079 *
1.50x103 15.0 0.205 *
2.50x103 25.0 1.66 *
5.00x103 50.0 0.675 *
7.50x103 75.0 2.03 *
1.00x104 100 2.10 *
Urine 300 3.00 2.40 *
600 6.00 0.974 *
1.00x103 10.0 1.75 *
2.50x103 25.0 -1.85 *
5.00x103 50.0 -1.48 *
7.50x103 75.0 -1.06 *
1.00x104 100 -2.09 * *
A partial validation was performed for plasma and urine. Therefore no relative standard deviations for NAMI-A standards were
calculated.
Specificity
From six individual batches of drug-free pUF and urine, samples containing neither
analyte nor internal standard (blank), and samples containing 30.0 ng/L Ru and 200 ng/L
internal standard were prepared and diluted tenfold. These samples were prepared in
order to determine whether endogenous compounds interfered at the masses selected
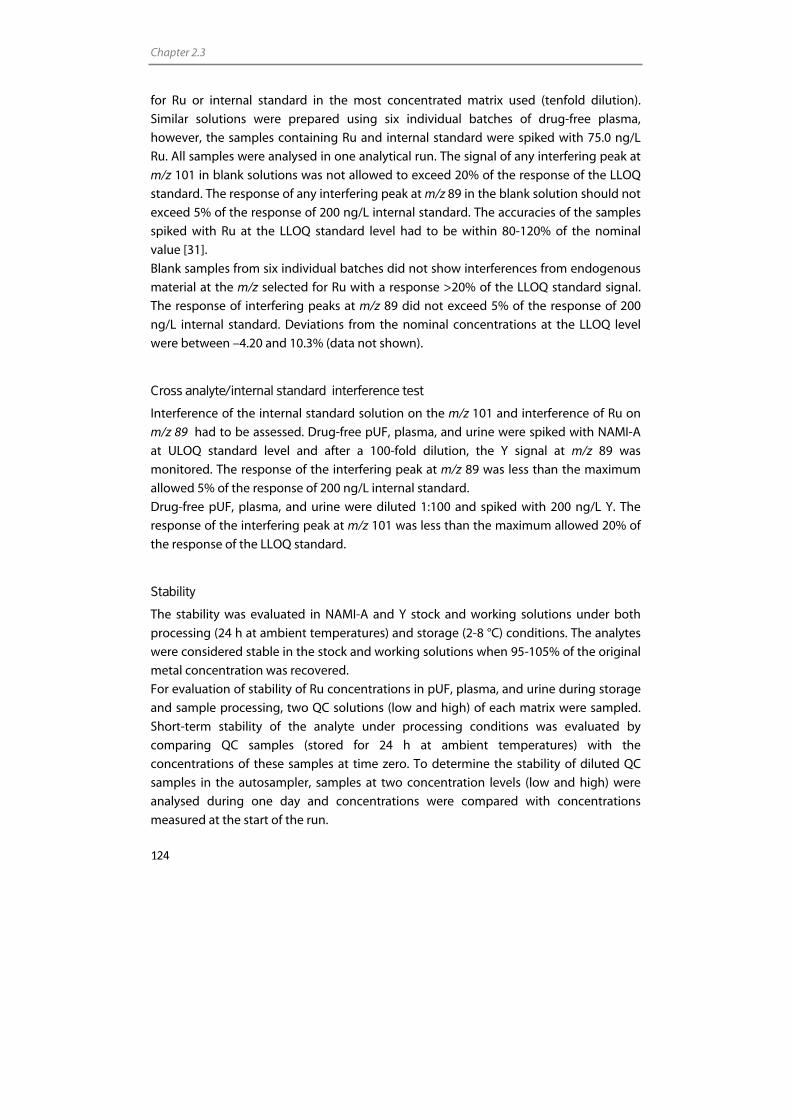
Chapter 2.3
124
for Ru or internal standard in the most concentrated matrix used (tenfold dilution).
Similar solutions were prepared using six individual batches of drug-free plasma,
however, the samples containing Ru and internal standard were spiked with 75.0 ng/L
Ru. All samples were analysed in one analytical run. The signal of any interfering peak at
m/z 101 in blank solutions was not allowed to exceed 20% of the response of the LLOQ
standard. The response of any interfering peak at m/z 89 in the blank solution should not
exceed 5% of the response of 200 ng/L internal standard. The accuracies of the samples
spiked with Ru at the LLOQ standard level had to be within 80-120% of the nominal
value [31].
Blank samples from six individual batches did not show interferences from endogenous
material at the m/z selected for Ru with a response >20% of the LLOQ standard signal.
The response of interfering peaks at m/z 89 did not exceed 5% of the response of 200
ng/L internal standard. Deviations from the nominal concentrations at the LLOQ level
were between –4.20 and 10.3% (data not shown).
Cross analyte/internal standard interference test
Interference of the internal standard solution on the m/z 101 and interference of Ru on
m/z 89 had to be assessed. Drug-free pUF, plasma, and urine were spiked with NAMI-A
at ULOQ standard level and after a 100-fold dilution, the Y signal at m/z 89 was
monitored. The response of the interfering peak at m/z 89 was less than the maximum
allowed 5% of the response of 200 ng/L internal standard.
Drug-free pUF, plasma, and urine were diluted 1:100 and spiked with 200 ng/L Y. The
response of the interfering peak at m/z 101 was less than the maximum allowed 20% of
the response of the LLOQ standard.
Stability
The stability was evaluated in NAMI-A and Y stock and working solutions under both
processing (24 h at ambient temperatures) and storage (2-8 °C) conditions. The analytes
were considered stable in the stock and working solutions when 95-105% of the original
metal concentration was recovered.
For evaluation of stability of Ru concentrations in pUF, plasma, and urine during storage
and sample processing, two QC solutions (low and high) of each matrix were sampled.
Short-term stability of the analyte under processing conditions was evaluated by
comparing QC samples (stored for 24 h at ambient temperatures) with the
concentrations of these samples at time zero. To determine the stability of diluted QC
samples in the autosampler, samples at two concentration levels (low and high) were
analysed during one day and concentrations were compared with concentrations
measured at the start of the run.
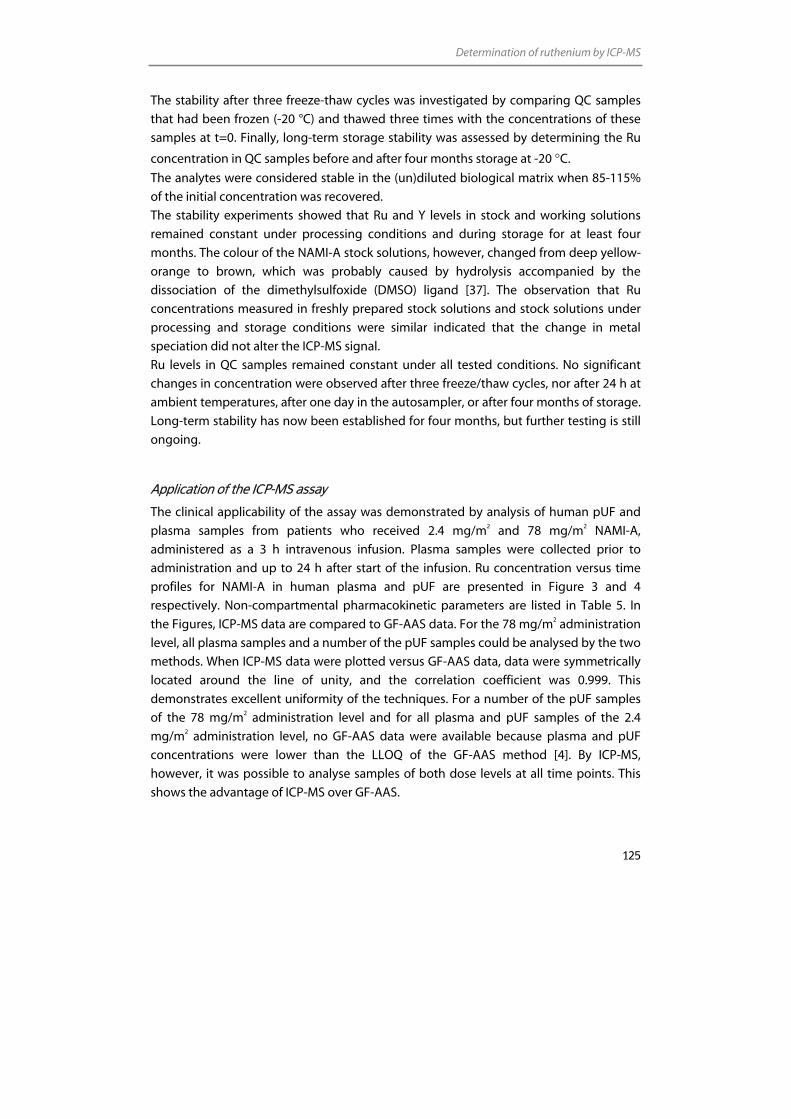
Determination of ruthenium by ICP-MS
125
The stability after three freeze-thaw cycles was investigated by comparing QC samples
that had been frozen (-20 °C) and thawed three times with the concentrations of these
samples at t=0. Finally, long-term storage stability was assessed by determining the Ru
concentration in QC samples before and after four months storage at -20 °C.
The analytes were considered stable in the (un)diluted biological matrix when 85-115%
of the initial concentration was recovered.
The stability experiments showed that Ru and Y levels in stock and working solutions
remained constant under processing conditions and during storage for at least four
months. The colour of the NAMI-A stock solutions, however, changed from deep yellow-
orange to brown, which was probably caused by hydrolysis accompanied by the
dissociation of the dimethylsulfoxide (DMSO) ligand [37]. The observation that Ru
concentrations measured in freshly prepared stock solutions and stock solutions under
processing and storage conditions were similar indicated that the change in metal
speciation did not alter the ICP-MS signal.
Ru levels in QC samples remained constant under all tested conditions. No significant
changes in concentration were observed after three freeze/thaw cycles, nor after 24 h at
ambient temperatures, after one day in the autosampler, or after four months of storage.
Long-term stability has now been established for four months, but further testing is still
ongoing.
Application of the ICP-MS assay
The clinical applicability of the assay was demonstrated by analysis of human pUF and
plasma samples from patients who received 2.4 mg/m2 and 78 mg/m2 NAMI-A,
administered as a 3 h intravenous infusion. Plasma samples were collected prior to
administration and up to 24 h after start of the infusion. Ru concentration versus time
profiles for NAMI-A in human plasma and pUF are presented in Figure 3 and 4
respectively. Non-compartmental pharmacokinetic parameters are listed in Table 5. In
the Figures, ICP-MS data are compared to GF-AAS data. For the 78 mg/m2 administration
level, all plasma samples and a number of the pUF samples could be analysed by the two
methods. When ICP-MS data were plotted versus GF-AAS data, data were symmetrically
located around the line of unity, and the correlation coefficient was 0.999. This
demonstrates excellent uniformity of the techniques. For a number of the pUF samples
of the 78 mg/m2 administration level and for all plasma and pUF samples of the 2.4
mg/m2 administration level, no GF-AAS data were available because plasma and pUF
concentrations were lower than the LLOQ of the GF-AAS method [4]. By ICP-MS,
however, it was possible to analyse samples of both dose levels at all time points. This
shows the advantage of ICP-MS over GF-AAS.
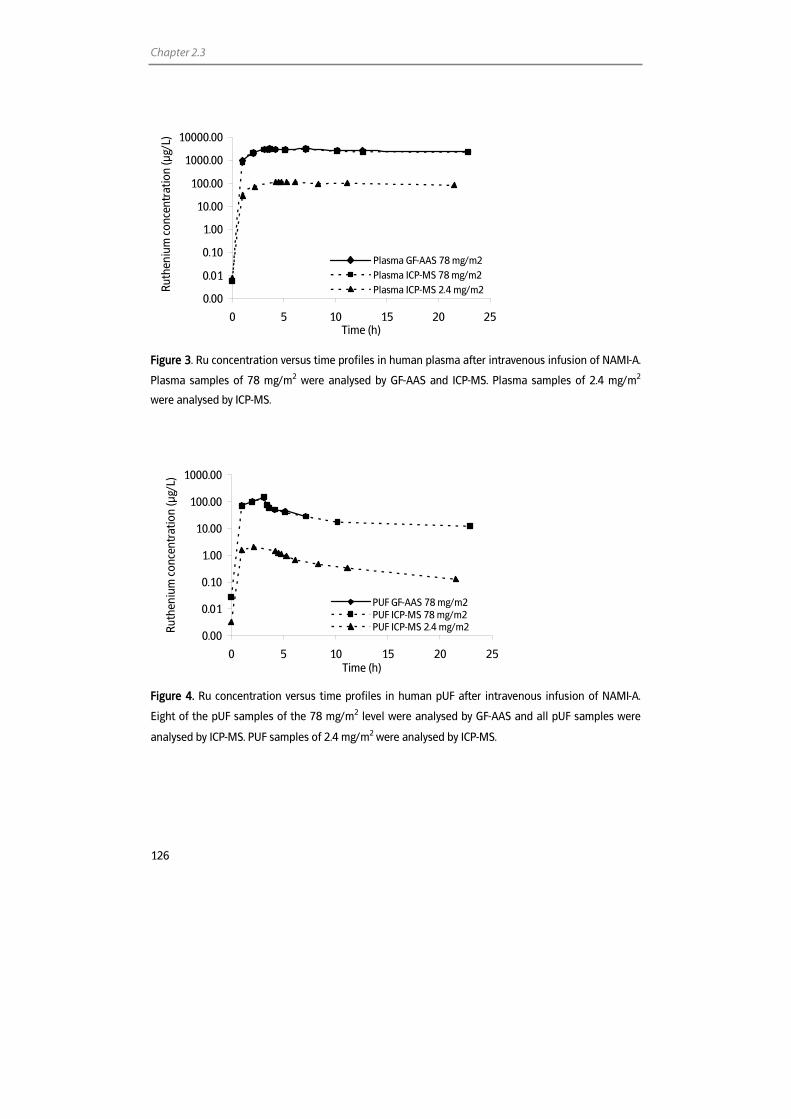
Chapter 2.3
126
0.00
0.01
0.10
1.00
10.00
100.00
1000.00
10000.00
0 5 10 15 20 25Time (h)
Ruth
eniu
m c
once
ntra
tion
(µg/
L)
Plasma GF-AAS 78 mg/m2Plasma ICP-MS 78 mg/m2Plasma ICP-MS 2.4 mg/m2
Figure 3. Ru concentration versus time profiles in human plasma after intravenous infusion of NAMI-A.
Plasma samples of 78 mg/m2 were analysed by GF-AAS and ICP-MS. Plasma samples of 2.4 mg/m2
were analysed by ICP-MS.
0.00
0.01
0.10
1.00
10.00
100.00
1000.00
0 5 10 15 20 25Time (h)
Ruth
eniu
m c
once
ntra
tion
(µg/
L)
PUF GF-AAS 78 mg/m2PUF ICP-MS 78 mg/m2PUF ICP-MS 2.4 mg/m2
Figure 4. Ru concentration versus time profiles in human pUF after intravenous infusion of NAMI-A.
Eight of the pUF samples of the 78 mg/m2 level were analysed by GF-AAS and all pUF samples were
analysed by ICP-MS. PUF samples of 2.4 mg/m2 were analysed by ICP-MS.
Determination of ruthenium by ICP-MS
127
Table 5. Summary of non-compartmental pharmacokinetic parameters for Ru in plasma ultrafiltrate
and plasma
Matrix Dose level
(mg/m2/day)
Cmax
(mg/L)
AUC 0-24
(mgxh/L)
t1/2
(h)
Plasma ultrafiltrate 2.4 0.002 0.013 7.21
78 0.145 0.693 8.90
Plasma 2.4 0.116 1.91 33.8
78 2.97 53.4 49.9
Conclusion
A highly sensitive ICP-MS assay for the reliable and fast quantitative determination of Ru
originating from NAMI-A in human pUF, plasma, and urine, was developed.
Subsequently, the assay was validated according to current FDA guidelines. The
validated range were from 300 to 1x10⁵ ng/L Ru in human pUF and urine, and from 750
to 1x10⁵ ng/L Ru in human plasma. The LLOQ was lowered from 300 to 30.0 ng/L for Ru
in pUF and urine and from 750 to 75.0 ng/L for Ru in plasma by including a tenfold
dilution into the validation procedures. A dilution factor of 104 was validated, resulting in
excellent accuracy and precision data. The assay is now successfully applied to support
pharmacokinetic studies of patients treated with NAMI-A.
Chapter 2.3
128
References 1. Hartmann JT, Lipp HP. Toxicity of platinum compounds. Expert Opin Pharmacother 2003; 4: 889-901.
2. Rabik CA, Dolan ME. Molecular mechanisms of resistance and toxicity associated with platinating agents. Cancer Treat Rev 2007; 33: 9-23.
3. Kartalou M, Essigmann JM. Mechanisms of resistance to cisplatin. Mutat Res 2001; 478: 23-43.
4. Rademaker-Lakhai JM, van den BD, Pluim D, Beijnen JH, Schellens JH. A Phase I and pharmacological study with imidazolium-trans-DMSO-imidazole-tetrachlororuthenate, a novel ruthenium anticancer agent. Clin Cancer Res 2004; 10: 3717-27.
5. Hartinger CG, Zorbas-Seifried S, Jakupec MA, Kynast B, Zorbas H, Keppler BK. From bench to bedside--preclinical and early clinical development of the anticancer agent indazolium trans-[tetrachlorobis(1H-indazole)ruthenate(III)] (KP1019 or FFC14A). J Inorg Biochem 2006; 100: 891-904.
6. Scheulen ME, Kynast B, Jaehde U, Hilger RA, Scheuch E, Arion V, Kupsch P, Henke MM, Dittrich C, Keppler BK. A phase I dose-escalation trial with the new redox activated compound sodium trans-[tetrachlorobis(1H-indazole)ruthenate(III)]/indazolhydrochloride (1:1.1) (FFC14A) in patients with solid tumours - a CESAR study. J Clin Oncol , 2004 ASCO Annual Meeting Proceedings 2004; 22: 2101.
7. Sava G, Capozzi I, Clerici K, Gagliardi G, Alessio E, Mestroni G. Pharmacological control of lung metastases of solid tumours by a novel ruthenium complex. Clin Exp Metastasis 1998; 16: 371-9.
8. Sava G, Gagliardi R, Bergamo A, Alessio E, Mestroni G. Treatment of metastases of solid mouse tumours by NAMI-A: comparison with cisplatin, cyclophosphamide and dacarbazine. Anticancer Res 1999; 19: 969-72.
9. Sava G, Clerici K, Capozzi I, Cocchietto M, Gagliardi R, Alessio E, Mestroni G, Perbellini A. Reduction of lung metastasis by ImH[trans-RuCl4(DMSO)Im]: mechanism of the selective action investigated on mouse tumours. Anticancer Drugs 1999; 10: 129-38.
10. Galanski M, Arion VB, Jakupec MA, Keppler BK. Recent developments in the field of tumour-inhibiting metal complexes. Curr Pharm Des 2003; 9: 2078-89.
11. Crul M, van den Bongard HJ, Tibben MM, van Tellingen O, Sava G, Schellens JH, Beijnen JH. Validated method for the determination of the novel organo-ruthenium anticancer drug NAMI-A in human biological fluids by Zeeman atomic absorption spectrometry. Fresenius J Anal Chem 2001; 369: 442-5.
12. Vouillamoz-Lorenz S, Bauer J, Lejeune F, Decosterd LA. Validation of an AAS method for the determination of platinum in biological fluids from patients receiving the oral platinum derivative JM216. J Pharm Biomed Anal 2001; 25: 465-75.
13. Brouwers EEM, Tibben MM, Joerger M, van Tellingen O, Rosing H, Schellens JHM, Beijnen JH. Determination of oxaliplatin in human plasma and plasma ultrafiltrate by graphite-furnace atomic-absorption spectrometry. Anal Bioanal Chem 2005; 382: 1484-90.
14. van Warmerdam LJC, van Tellingen O, Maes RAA, Beijnen JH. Validated method for the determination of carboplatin in biological fluids by Zeeman atomic absorption spectrometry. Fresenius J Anal Chem 1995; 351: 777-81.
15. Kloft C, Appelius H, Siegert W, Schunack W, Jaehde U. Determination of platinum complexes in clinical samples by a rapid flameless atomic absorption spectrometry assay. Ther Drug Monit 1999; 21: 631-7.
16. LeRoy AF, Wehling ML, Sponseller HL, Friauf WS, Solomon RE, Dedrick RL, Litterst CL, Gram TE, Guarino AM, Becker DA. Analysis of platinum in biological materials by flameless atomic absorption spectrophotometry. Biochem Med 1977; 18: 184-91.
17. Meerum Terwogt JM, Tibben MM, Welbank H, Schellens JHM, Beijnen JH. Validated method for the determination of platinum from a liposomal source (SPI-77) in human plasma using graphite furnace Zeeman atomic absorption spectrometry. Fresenius J Anal Chem 2000; 366: 298-302.
18. Tibben MM, Rademaker-Lakhai JM, Rice JR, Stewart DR, Schellens JHM, Beijnen JH. Determination of total platinum in plasma and plasma ultrafiltrate, from subjects dosed with the platinum-containing N-(2-hydroxypropyl)methacrylamide copolymer AP5280, by use of graphite-furnace Zeeman atomic-absorption spectrometry. Anal Bioanal Chem 2002; 373: 233-6.
19. Gray AL. Mass-spectrometric analysis of solutions using an atmosperic pressure ion source. The Analyst 1975; 100: 289-99.
20. Tothill P, Matheson LM, Smyth JF. Inductively coupled plasma mass spectrometry for the determination of platinum in animal tissue and a comparison with atomic absorption spectrometry. J Anal Atom Spectrom 1990; 5: 619-22.
21. Allain P, Berre S, Mauras Y, Le Bouil A. Evaluation of inductively coupled mass spectrometry for the determination of platinum in plasma. Biol Mass Spectrom 1992; 21: 141-3.
Determination of ruthenium by ICP-MS
129
22. Gamelin E, Allain P, Maillart P, Turcant A, Delva R, Lortholary A, Larra F. Long-term pharmacokinetic behavior of platinum after cisplatin administration. Cancer Chemother Pharmacol 1995; 37: 97-102.
23. Sessa C, Capri G, Gianni L, Peccatori F, Grasselli G, Bauer J, Zucchetti M, Vigano L, Gatti A, Minoia C, Liati P, Van den BS, Bernareggi A, Camboni G, Marsoni S. Clinical and pharmacological phase I study with accelerated titration design of a daily times five schedule of BBR3464, a novel cationic triplatinum complex. Ann Oncol 2000; 11: 977-83.
24. Morrison JG, White P, McDougall S, Firth JW, Woolfrey SG, Graham MA, Greenslade D. Validation of a highly sensitive ICP-MS method for the determination of platinum in biofluids: application to clinical pharmacokinetic studies with oxaliplatin. J Pharm Biomed Anal 2000; 24: 1-10.
25. Liu J, Kraut E, Bender J, Brooks R, Balcerzak S, Grever M, Stanley H, D'Ambrosio S, Gibson-D'Ambrosio R, Chan KK. Pharmacokinetics of oxaliplatin (NSC 266046) alone and in combination with paclitaxel in cancer patients. Cancer Chemother Pharmacol 2002; 49: 367-74.
26. Bettinelli M, Spezia S, Ronchi A, Minoia C. Determination of Pt in biological fluids with ICP-MS: Evaluation of analytical uncertainty. Atom Spectrosc 2004; 25: 103-11.
27. Brouwers EEM, Tibben MM, Rosing H, Hillebrand MJX, Joerger M, Schellens JHM, Beijnen JH. Sensitive inductively coupled plasma mass spectrometry assay for the determination of platinum originating from cisplatin, carboplatin, and oxaliplatin in human plasma ultrafiltrate. J Mass Spectrom 2006; 41: 1186-94.
28. Szpunar J, Makarov A, Pieper T, Keppler BK, Lobinski R. Investigation of metallodrug-protein interactions by size-exclusion chromatography coupled with inductively coupled plasma mass spectrometry (ICP-MS). Anal Chim Acta 1999; 387: 135-44.
29. Hartinger CG, Hann S, Koellensperger G, Sulyok M, Groessl M, Timerbaev AR, Rudnev AV, Stingeder G, Keppler BK. Interactions of a novel ruthenium-based anticancer drug (KP1019 or FFC14a) with serum proteins--significance for the patient. Int J Clin Pharmacol Ther 2005; 43: 583-5.
30. Sulyok M, Hann S, Hartinger CG, Keppler BK, Stingeder G, Koellensperger G. Two dimensional separation schemes for investigation of the interaction of an anticancer ruthenium(III) compound with plasma proteins. J Anal Atom Spectrom 2005; 20: 856-63.
31. U.S.Food and Drug Administration, Center for Drug Evaluation and Research, Guidance for Industry, Bioanalytical Method Validation. FDA. U.S. Food and Drug Administration: Center for Drug Evaluation and Research: Guidance for Industry: Bioanalytical Method Validation. http://www fda gov/cder/guidance/ 4252fnl pdf 2001.
32. Rodushkin I, Engstrom E, Stenberg A, Baxter DC. Determination of low-abundance elements at ultra-trace levels in urine and serum by inductively coupled plasma-sector field mass spectrometry. Anal Bioanal Chem 2004; 380: 247-57.
33. Rosman KJR, Taylor PDP. Isotopic compositions of the elements 1997; International Union of Pure and Applied Chemistry. http://www physics curtin edu au/iupac/docs/Final97 pdf 1997.
34. Goulle JP, Mahieu L, Castermant J, Neveu N, Bonneau L, Laine G, Bouige D, Lacroix C. Metal and metalloid multi-elementary ICP-MS validation in whole blood, plasma, urine and hair Reference values. Forensic Sci Int 2005; 153: 39-44.
35. Forte G, Bocca B, Senofonte O, Petrucci F, Brusa L, Stanzione P, Zannino S, Violante N, Alimonti A, Sancesario G. Trace and major elements in whole blood, serum, cerebrospinal fluid and urine of patients with Parkinson's disease. J Neural Transm 2004; 111: 1031-40.
36. McCurdy E, Potter D. Optimising ICP-MS for the determination of trace metals in high matrix samples. Spectroscopy Europe 2001; 13: 10-3.
37. Sava G, Bergamo A, Zorzet S, Gava B, Casarsa C, Cocchietto M, Furlani A, Scarcia V, Serli B, Iengo E, Alessio E, Mestroni G. Influence of chemical stability on the activity of the antimetastasis ruthenium compound NAMI-A. Eur J Cancer 2002; 38: 427-35.

Chapter 3
Determination of platinum-DNA adducts

Chapter 3.1
Inductively coupled plasma mass spectrometric analysis of the total amount
of platinum-DNA adducts in peripheral blood mononuclear cells and tissue from
patients treated with cisplatin
Elke E.M. Brouwers Matthijs M. Tibben
Dick Pluim Hilde Rosing
Henk Boot Annemiek Cats
Jan H.M. Schellens Jos H. Beijnen
Submitted for publication
Chapter 3.1
134
Abstract
We present a highly sensitive method for the determination of platinum-DNA (Pt-DNA)
adducts in peripheral blood mononuclear cells and tissue samples from patients treated
with the anticancer agent cisplatin. The method is based on the measurement of
platinum by inductively coupled plasma mass spectrometry (ICP-MS) and allows
quantification of Pt-DNA adducts in PBMCs isolated from 10 mL of blood and in 1 mg of
tissue. The lower limit of quantification is 0.75 pg Pt or 7.5 fg Pt/µg DNA when using 100
µg DNA.
The method proved to be accurate and precise. The results obtained using the ICP-MS
method were in good agreement with results from the alternative 32P-postlabeling assay.
The ICP-MS method was, however, more sensitive than the 32P-postlabeling assay. In
addition, the ICP-MS method proved to be less laborious.
The advantages of the presented ICP-MS technique were demonstrated by the analysis
of PBMCs, normal gastric tissue, and gastric tumour tissue of patients treated with
cisplatin. This method for the analysis of Pt-DNA adducts in tissue samples allows us to
study adduct levels in biopsy samples e.g. from fine needle aspirates and to investigate
the distribution of adducts across a tumour sample.
Analysis of Pt-DNA adducts
135
Introduction
After the discovery of the antiproliferative effects of cisplatin (cis-
diaminedichloridoplatinum(II)) in the 1960s [1], the drug has developed successfully into
one of the most commonly used anticancer agents. The mechanism of action of cisplatin
is still not completely understood. It is, however, generally accepted that DNA
platination is the ultimate event in the cytotoxic activity of cisplatin. The hydrolysed
products of cisplatin attack the nucleophilic N7 positions from guanine (G) and adenine
(A) leading to the formation of various platinum-DNA (Pt-DNA) adducts, which affect the
DNA replication and transcription and thereby inhibit the tumour growth.
The interest in the formation of Pt-DNA adducts has increased the demand for analytical
methods to quantify these adducts in biological matrices. Evidently, tumour tissue is the
most relevant matrix to study. This matrix, however, is rather difficult to obtain.
Therefore, Pt-DNA adduct levels in peripheral blood mononuclear cells (PBMCs) are
often used as a surrogate marker for adduct levels in tumour tissue. Previous reports link
the adduct levels in PBMCs to clinical activity [2,3] and it was postulated that adduct
levels in PBMCs could predict chemosensitivity. Other investigations, comparing adduct
levels in PBMCs to levels in tumour tissue for head and neck carcinoma [4] and testicular
cancer [5], showed the lack of a relationship between Pt adduct levels in PBMCs and
tumour tissue. Hoebers et al. reported that adduct levels in PBMCs were 4-5 fold lower
than in tumour tissue and that adduct levels in tumour tissue were predictive for
treatment outcome [4]. These results indicate that in addition to the analysis for Pt-DNA
adducts in PBMCs, levels in tumour tissue should be investigated.
The limited availability of tissue and the fact that only 1% of the cisplatin molecules that
enter the cell actually bind to the DNA [6,7] illustrate the need for highly sensitive
techniques with the potential to detect low levels of Pt in limited amounts of DNA. The 32P-postlabeling method shows this high sensitivity [8], but it is less suitable for routine
clinical diagnostics due to its high radioactivity and its complex, labour intensive sample
pretreatment procedure. A less complex technique is inductively coupled plasma mass
spectrometry (ICP-MS), which, currently, is the most sensitive technique for the
determination of Pt originating from anticancer agents and is frequently used to study
Pt levels in various biological matrices. ICP-MS was applied previously for the
determination of Pt-DNA adducts in PBMCs [9,10] and tissue from patients [11] and
rodents [12,13]. The technique was also used to measure the amount of Pt-DNA adducts
in various cell types after incubation with Pt compounds [14,15]. For only a few assays,
however, the validation has been described [9,14,15]. The most sensitive assay was
described by Yamada et al. [14]. They were able to determine an absolute amount of 2
pg Pt.
The aim of the current work was to develop and validate a sensitive and reliable method
for the determination of Pt bound to DNA in PBMCs and tissue of patients after
Chapter 3.1
136
administration of cisplatin. Hence, we developed a sensitive ICP-MS assay requiring only
10 mL of blood or 1 mg of tissue. The method proved to be accurate and precise. The
usefulness of the technique was demonstrated in PBMCs, normal gastric tissue, and
gastric tumour tissue of patients treated with cisplatin. We compared the results of ICP-
MS with the widely applied 32P-postlabeling assay [8].
Experimental
Chemicals
Cisplatin reference standard was purchased from Calbiochem (San Diego, CA, USA).
Nitric acid (HNO3) 70% Ultrex II ultrapure reagent was obtained from Mallinckrodt Baker
(Philipsburg, NJ, USA). Water used for the ICP-MS analysis was sterile water for injection
(Aqua B. Braun Medical, Melsungen, Germany). Proteinase K and sodium dodecylsulfate
(SDS) were acquired from Sigma-Aldrich (Steinheim, Germany). Sodium chloride (NaCl),
edta disodium salt, potassium hydrogencarbonate (KHCO3), ammonium chloride (NH4Cl)
and iridium chloride were purchased from Merck (Darmstadt, Germany). Ammonium
hydrogencarbonate (NH4HCO3) was purchased from VWR (Fontenay-sous-Bois, France).
Calf thymus DNA, tris-HCl, phosphate buffered saline (PBS), and triton X-100 were
acquired from Sigma-Aldrich (St. Louis, MO, USA). Absolute ethanol was obtained from
Biosolve (Valkenswaard, the Netherlands).
Instruments
Pt analyses were performed on an ICP-quadrupole-MS (Varian 810-MS) equipped with a
90° reflecting ion mirror (Varian, Mulgrave, Victoria, Australia). The sample introduction
system consisted of a Micromist glass low-flow nebuliser (sample uptake 0.4 mL/min), a
peltier-cooled (4 °C) double pass glass spray chamber and a quartz torch. Sample
transport from the SPS-3 autosampler (Varian) to the nebuliser was performed using a
peristaltic pump. The instrument was cooled by using a Kühlmobil 142 VD (Van der
Heijden, Dörentrup, Germany). Hoek Loos (Schiedam, The Netherlands) provided argon
gas (4.6) with a 99.996% purity. The instrument settings of the ICP-MS are listed in Table
1. Data were acquired and processed using the ICP-MS Expert Software version 1.1 b49
(Varian). Further data handling was performed using Excel 2000 (Microsoft, Redmond,
WA, USA).
The Pt isotope used for calculation of Pt concentrations was 194Pt. Pt determination at this
isotope can be subject to the interference of hafnium-oxides [16]. But, since oxide
formation and observed hafnium counts were low in all of the analysed samples, these
oxides were considered insignificant and no corrections were necessary. The detection
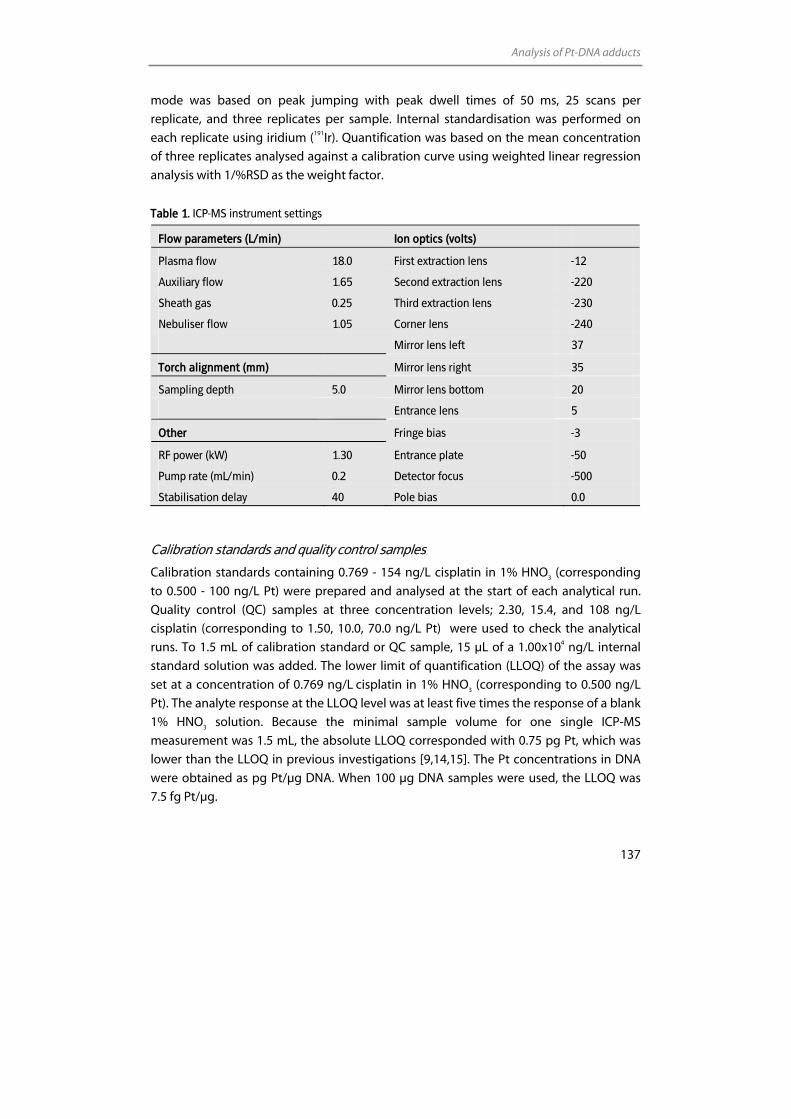
Analysis of Pt-DNA adducts
137
mode was based on peak jumping with peak dwell times of 50 ms, 25 scans per
replicate, and three replicates per sample. Internal standardisation was performed on
each replicate using iridium (191Ir). Quantification was based on the mean concentration
of three replicates analysed against a calibration curve using weighted linear regression
analysis with 1/%RSD as the weight factor.
Table 1. ICP-MS instrument settings
Flow parameters (L/min) Ion optics (volts)
Plasma flow 18.0 First extraction lens -12
Auxiliary flow 1.65 Second extraction lens -220
Sheath gas 0.25 Third extraction lens -230
Nebuliser flow 1.05 Corner lens -240
Mirror lens left 37
Torch alignment (mm) Mirror lens right 35
Sampling depth 5.0 Mirror lens bottom 20
Entrance lens 5
Other Fringe bias -3
RF power (kW) 1.30 Entrance plate -50
Pump rate (mL/min) 0.2 Detector focus -500
Stabilisation delay 40 Pole bias 0.0
Calibration standards and quality control samples
Calibration standards containing 0.769 - 154 ng/L cisplatin in 1% HNO3 (corresponding
to 0.500 - 100 ng/L Pt) were prepared and analysed at the start of each analytical run.
Quality control (QC) samples at three concentration levels; 2.30, 15.4, and 108 ng/L
cisplatin (corresponding to 1.50, 10.0, 70.0 ng/L Pt) were used to check the analytical
runs. To 1.5 mL of calibration standard or QC sample, 15 µL of a 1.00x10⁴ ng/L internal
standard solution was added. The lower limit of quantification (LLOQ) of the assay was
set at a concentration of 0.769 ng/L cisplatin in 1% HNO3 (corresponding to 0.500 ng/L
Pt). The analyte response at the LLOQ level was at least five times the response of a blank
1% HNO3 solution. Because the minimal sample volume for one single ICP-MS
measurement was 1.5 mL, the absolute LLOQ corresponded with 0.75 pg Pt, which was
lower than the LLOQ in previous investigations [9,14,15]. The Pt concentrations in DNA
were obtained as pg Pt/µg DNA. When 100 µg DNA samples were used, the LLOQ was
7.5 fg Pt/µg.
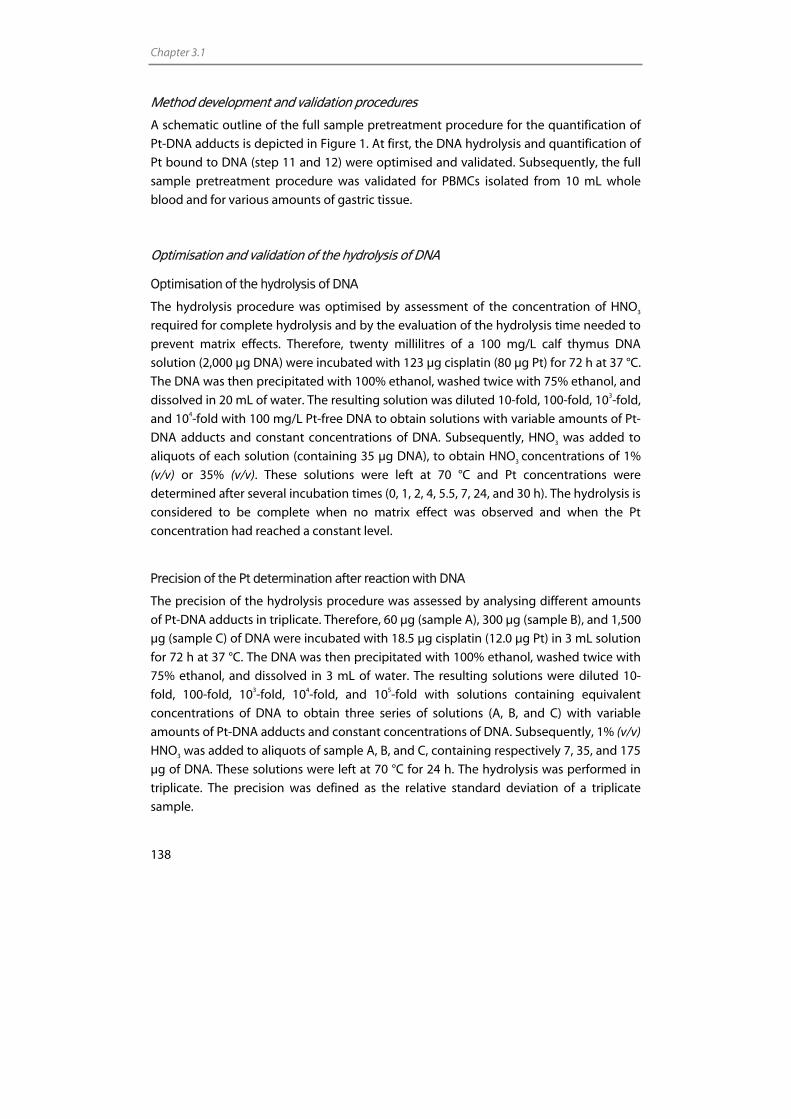
Chapter 3.1
138
Method development and validation procedures
A schematic outline of the full sample pretreatment procedure for the quantification of
Pt-DNA adducts is depicted in Figure 1. At first, the DNA hydrolysis and quantification of
Pt bound to DNA (step 11 and 12) were optimised and validated. Subsequently, the full
sample pretreatment procedure was validated for PBMCs isolated from 10 mL whole
blood and for various amounts of gastric tissue.
Optimisation and validation of the hydrolysis of DNA
Optimisation of the hydrolysis of DNA
The hydrolysis procedure was optimised by assessment of the concentration of HNO3
required for complete hydrolysis and by the evaluation of the hydrolysis time needed to
prevent matrix effects. Therefore, twenty millilitres of a 100 mg/L calf thymus DNA
solution (2,000 µg DNA) were incubated with 123 µg cisplatin (80 µg Pt) for 72 h at 37 °C.
The DNA was then precipitated with 100% ethanol, washed twice with 75% ethanol, and
dissolved in 20 mL of water. The resulting solution was diluted 10-fold, 100-fold, 103-fold,
and 104-fold with 100 mg/L Pt-free DNA to obtain solutions with variable amounts of Pt-
DNA adducts and constant concentrations of DNA. Subsequently, HNO3 was added to
aliquots of each solution (containing 35 µg DNA), to obtain HNO3 concentrations of 1%
(v/v) or 35% (v/v). These solutions were left at 70 °C and Pt concentrations were
determined after several incubation times (0, 1, 2, 4, 5.5, 7, 24, and 30 h). The hydrolysis is
considered to be complete when no matrix effect was observed and when the Pt
concentration had reached a constant level.
Precision of the Pt determination after reaction with DNA
The precision of the hydrolysis procedure was assessed by analysing different amounts
of Pt-DNA adducts in triplicate. Therefore, 60 µg (sample A), 300 µg (sample B), and 1,500
µg (sample C) of DNA were incubated with 18.5 µg cisplatin (12.0 µg Pt) in 3 mL solution
for 72 h at 37 °C. The DNA was then precipitated with 100% ethanol, washed twice with
75% ethanol, and dissolved in 3 mL of water. The resulting solutions were diluted 10-
fold, 100-fold, 103-fold, 104-fold, and 105-fold with solutions containing equivalent
concentrations of DNA to obtain three series of solutions (A, B, and C) with variable
amounts of Pt-DNA adducts and constant concentrations of DNA. Subsequently, 1% (v/v)
HNO3 was added to aliquots of sample A, B, and C, containing respectively 7, 35, and 175
µg of DNA. These solutions were left at 70 °C for 24 h. The hydrolysis was performed in
triplicate. The precision was defined as the relative standard deviation of a triplicate
sample.
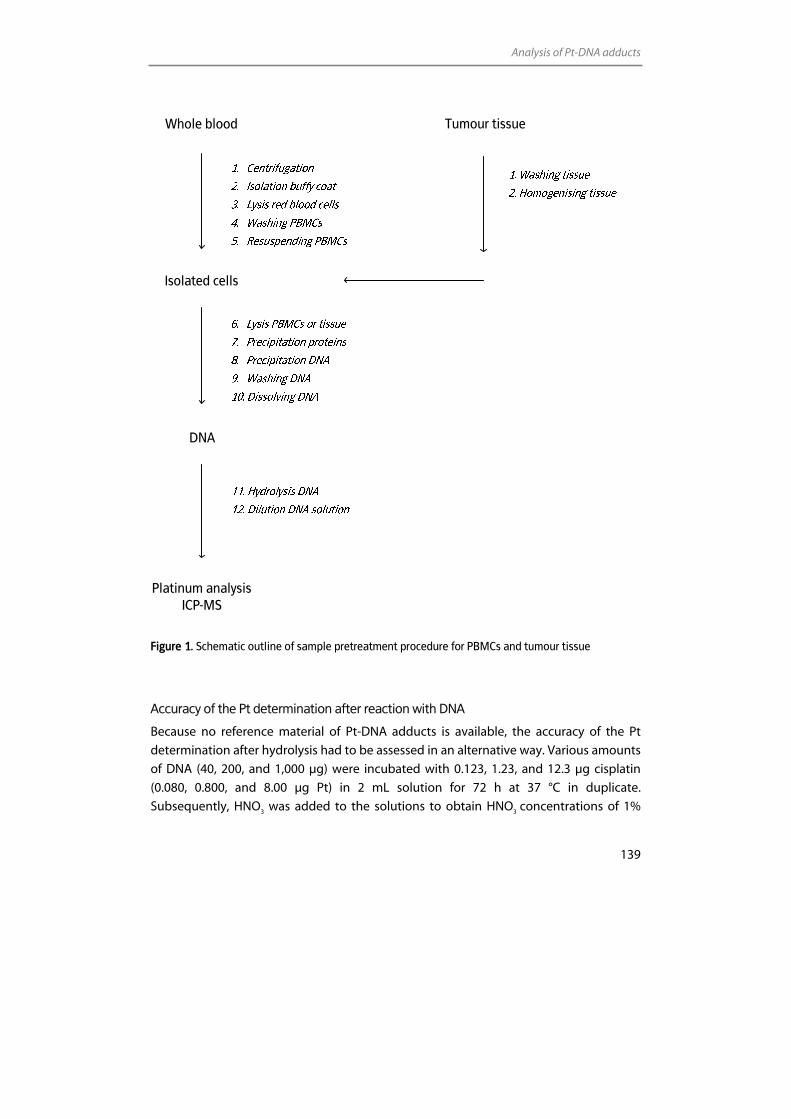
Analysis of Pt-DNA adducts
139
Whole blood Tumour tissue
Isolated cells
DNA
Platinum analysis ICP-MS
Figure 1. Schematic outline of sample pretreatment procedure for PBMCs and tumour tissue
Accuracy of the Pt determination after reaction with DNA
Because no reference material of Pt-DNA adducts is available, the accuracy of the Pt
determination after hydrolysis had to be assessed in an alternative way. Various amounts
of DNA (40, 200, and 1,000 µg) were incubated with 0.123, 1.23, and 12.3 µg cisplatin
(0.080, 0.800, and 8.00 µg Pt) in 2 mL solution for 72 h at 37 °C in duplicate.
Subsequently, HNO3 was added to the solutions to obtain HNO3 concentrations of 1%
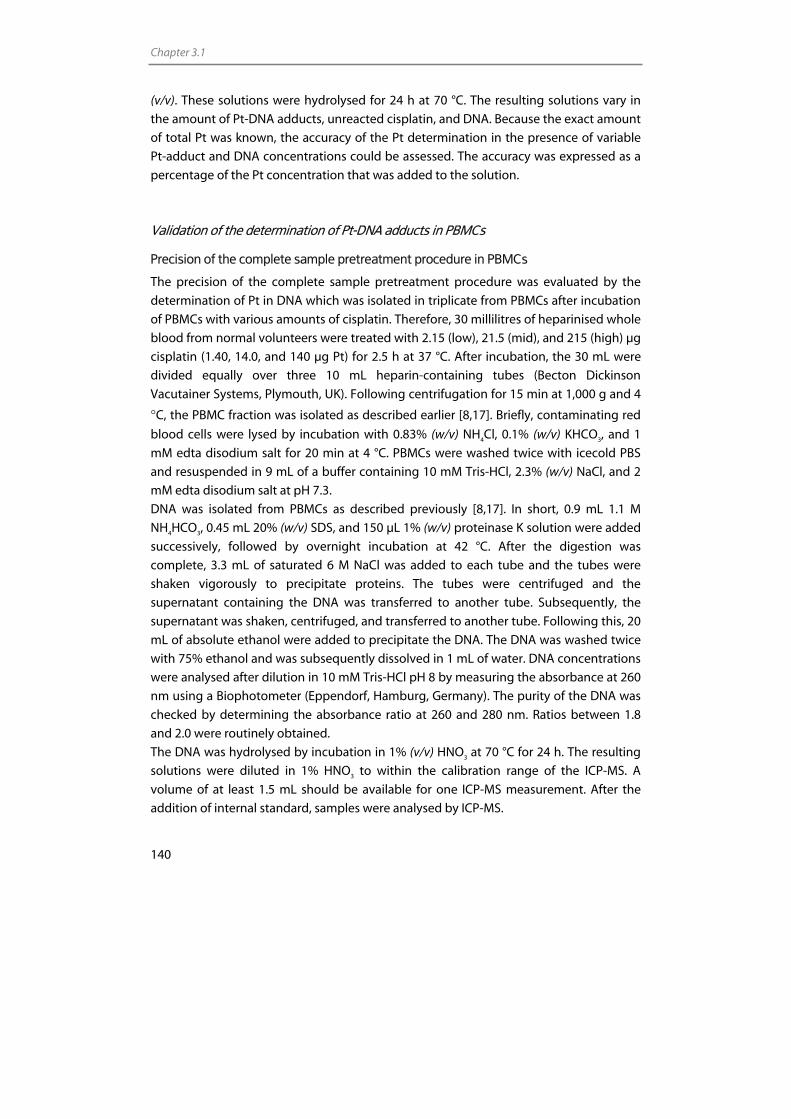
Chapter 3.1
140
(v/v). These solutions were hydrolysed for 24 h at 70 °C. The resulting solutions vary in
the amount of Pt-DNA adducts, unreacted cisplatin, and DNA. Because the exact amount
of total Pt was known, the accuracy of the Pt determination in the presence of variable
Pt-adduct and DNA concentrations could be assessed. The accuracy was expressed as a
percentage of the Pt concentration that was added to the solution.
Validation of the determination of Pt-DNA adducts in PBMCs
Precision of the complete sample pretreatment procedure in PBMCs
The precision of the complete sample pretreatment procedure was evaluated by the
determination of Pt in DNA which was isolated in triplicate from PBMCs after incubation
of PBMCs with various amounts of cisplatin. Therefore, 30 millilitres of heparinised whole
blood from normal volunteers were treated with 2.15 (low), 21.5 (mid), and 215 (high) µg
cisplatin (1.40, 14.0, and 140 µg Pt) for 2.5 h at 37 °C. After incubation, the 30 mL were
divided equally over three 10 mL heparin-containing tubes (Becton Dickinson
Vacutainer Systems, Plymouth, UK). Following centrifugation for 15 min at 1,000 g and 4
°C, the PBMC fraction was isolated as described earlier [8,17]. Briefly, contaminating red
blood cells were lysed by incubation with 0.83% (w/v) NH4Cl, 0.1% (w/v) KHCO3, and 1
mM edta disodium salt for 20 min at 4 °C. PBMCs were washed twice with icecold PBS
and resuspended in 9 mL of a buffer containing 10 mM Tris-HCl, 2.3% (w/v) NaCl, and 2
mM edta disodium salt at pH 7.3.
DNA was isolated from PBMCs as described previously [8,17]. In short, 0.9 mL 1.1 M
NH4HCO3, 0.45 mL 20% (w/v) SDS, and 150 µL 1% (w/v) proteinase K solution were added
successively, followed by overnight incubation at 42 °C. After the digestion was
complete, 3.3 mL of saturated 6 M NaCl was added to each tube and the tubes were
shaken vigorously to precipitate proteins. The tubes were centrifuged and the
supernatant containing the DNA was transferred to another tube. Subsequently, the
supernatant was shaken, centrifuged, and transferred to another tube. Following this, 20
mL of absolute ethanol were added to precipitate the DNA. The DNA was washed twice
with 75% ethanol and was subsequently dissolved in 1 mL of water. DNA concentrations
were analysed after dilution in 10 mM Tris-HCl pH 8 by measuring the absorbance at 260
nm using a Biophotometer (Eppendorf, Hamburg, Germany). The purity of the DNA was
checked by determining the absorbance ratio at 260 and 280 nm. Ratios between 1.8
and 2.0 were routinely obtained.
The DNA was hydrolysed by incubation in 1% (v/v) HNO3 at 70 °C for 24 h. The resulting
solutions were diluted in 1% HNO3 to within the calibration range of the ICP-MS. A
volume of at least 1.5 mL should be available for one ICP-MS measurement. After the
addition of internal standard, samples were analysed by ICP-MS.
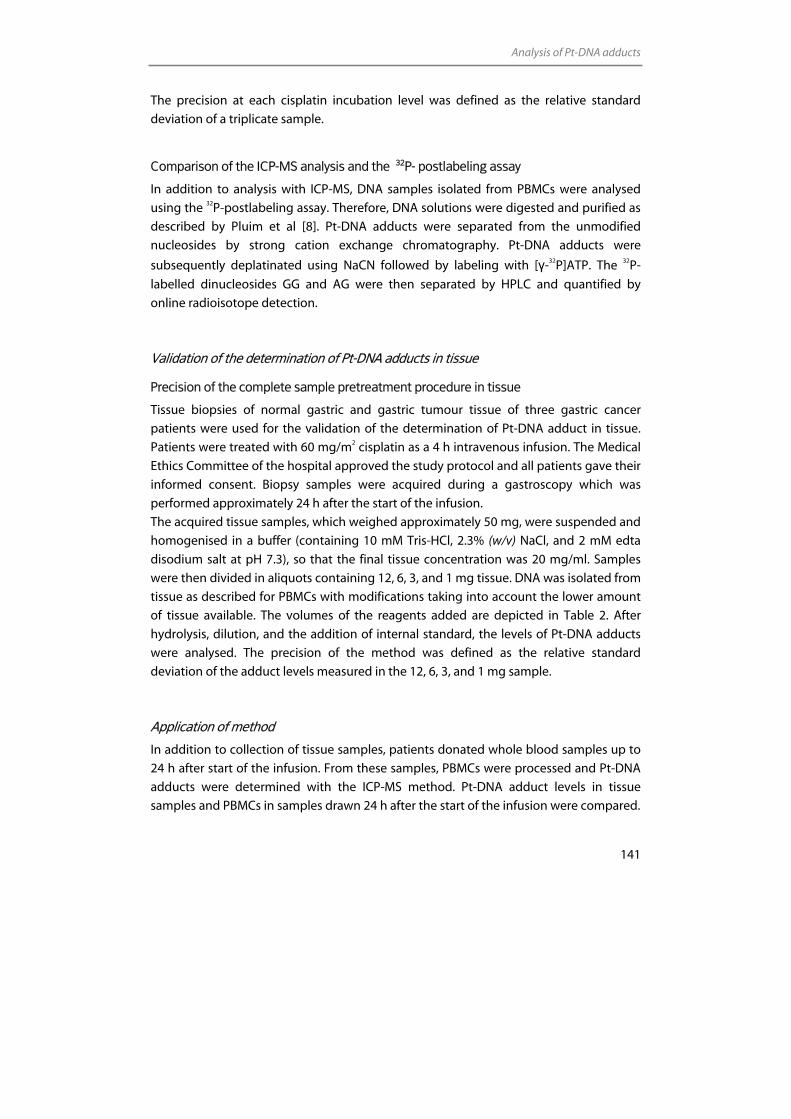
Analysis of Pt-DNA adducts
141
The precision at each cisplatin incubation level was defined as the relative standard
deviation of a triplicate sample.
Comparison of the ICP-MS analysis and the 32P- postlabeling assay
In addition to analysis with ICP-MS, DNA samples isolated from PBMCs were analysed
using the 32P-postlabeling assay. Therefore, DNA solutions were digested and purified as
described by Pluim et al [8]. Pt-DNA adducts were separated from the unmodified
nucleosides by strong cation exchange chromatography. Pt-DNA adducts were
subsequently deplatinated using NaCN followed by labeling with [γ-32P]ATP. The 32P-
labelled dinucleosides GG and AG were then separated by HPLC and quantified by
online radioisotope detection.
Validation of the determination of Pt-DNA adducts in tissue
Precision of the complete sample pretreatment procedure in tissue
Tissue biopsies of normal gastric and gastric tumour tissue of three gastric cancer
patients were used for the validation of the determination of Pt-DNA adduct in tissue.
Patients were treated with 60 mg/m2 cisplatin as a 4 h intravenous infusion. The Medical
Ethics Committee of the hospital approved the study protocol and all patients gave their
informed consent. Biopsy samples were acquired during a gastroscopy which was
performed approximately 24 h after the start of the infusion.
The acquired tissue samples, which weighed approximately 50 mg, were suspended and
homogenised in a buffer (containing 10 mM Tris-HCl, 2.3% (w/v) NaCl, and 2 mM edta
disodium salt at pH 7.3), so that the final tissue concentration was 20 mg/ml. Samples
were then divided in aliquots containing 12, 6, 3, and 1 mg tissue. DNA was isolated from
tissue as described for PBMCs with modifications taking into account the lower amount
of tissue available. The volumes of the reagents added are depicted in Table 2. After
hydrolysis, dilution, and the addition of internal standard, the levels of Pt-DNA adducts
were analysed. The precision of the method was defined as the relative standard
deviation of the adduct levels measured in the 12, 6, 3, and 1 mg sample.
Application of method
In addition to collection of tissue samples, patients donated whole blood samples up to
24 h after start of the infusion. From these samples, PBMCs were processed and Pt-DNA
adducts were determined with the ICP-MS method. Pt-DNA adduct levels in tissue
samples and PBMCs in samples drawn 24 h after the start of the infusion were compared.
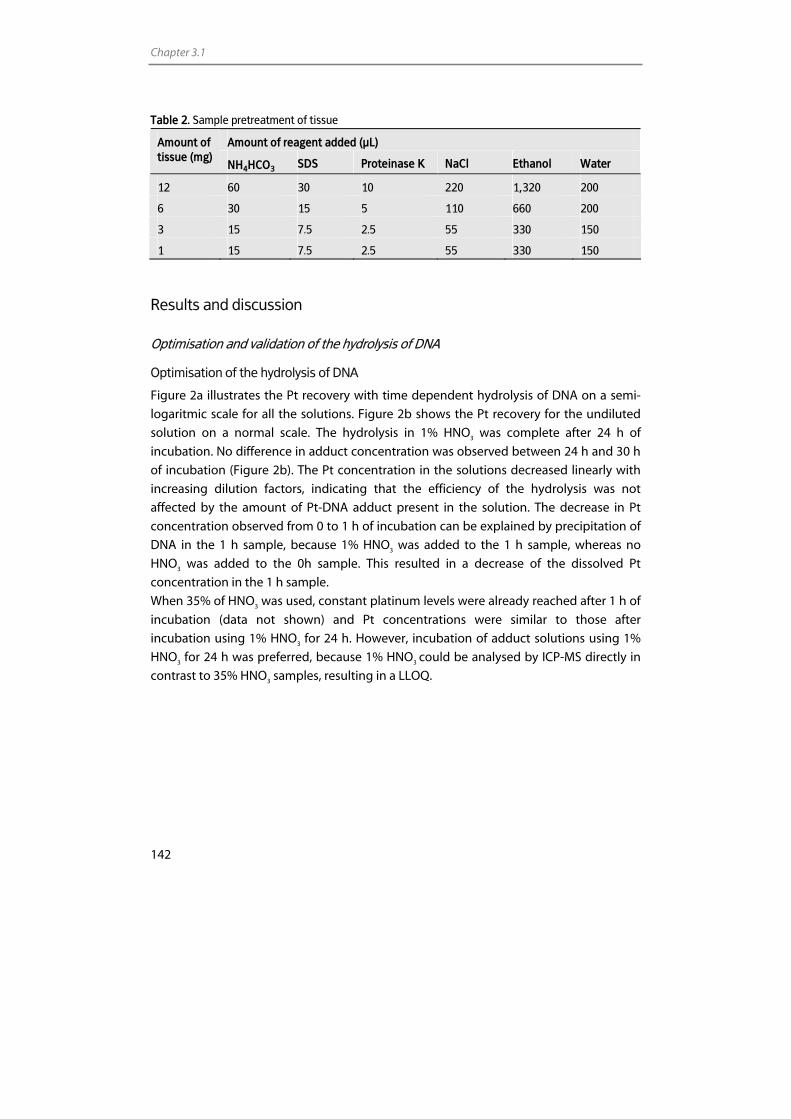
Chapter 3.1
142
Table 2. Sample pretreatment of tissue
Amount of reagent added (µL) Amount of tissue (mg)
NH4HCO3 SDS Proteinase K NaCl Ethanol Water
12 60 30 10 220 1,320 200
6 30 15 5 110 660 200
3 15 7.5 2.5 55 330 150
1 15 7.5 2.5 55 330 150
Results and discussion
Optimisation and validation of the hydrolysis of DNA
Optimisation of the hydrolysis of DNA
Figure 2a illustrates the Pt recovery with time dependent hydrolysis of DNA on a semi-
logaritmic scale for all the solutions. Figure 2b shows the Pt recovery for the undiluted
solution on a normal scale. The hydrolysis in 1% HNO3 was complete after 24 h of
incubation. No difference in adduct concentration was observed between 24 h and 30 h
of incubation (Figure 2b). The Pt concentration in the solutions decreased linearly with
increasing dilution factors, indicating that the efficiency of the hydrolysis was not
affected by the amount of Pt-DNA adduct present in the solution. The decrease in Pt
concentration observed from 0 to 1 h of incubation can be explained by precipitation of
DNA in the 1 h sample, because 1% HNO3 was added to the 1 h sample, whereas no
HNO3 was added to the 0h sample. This resulted in a decrease of the dissolved Pt
concentration in the 1 h sample.
When 35% of HNO3 was used, constant platinum levels were already reached after 1 h of
incubation (data not shown) and Pt concentrations were similar to those after
incubation using 1% HNO3 for 24 h. However, incubation of adduct solutions using 1%
HNO3 for 24 h was preferred, because 1% HNO3 could be analysed by ICP-MS directly in
contrast to 35% HNO3 samples, resulting in a LLOQ.
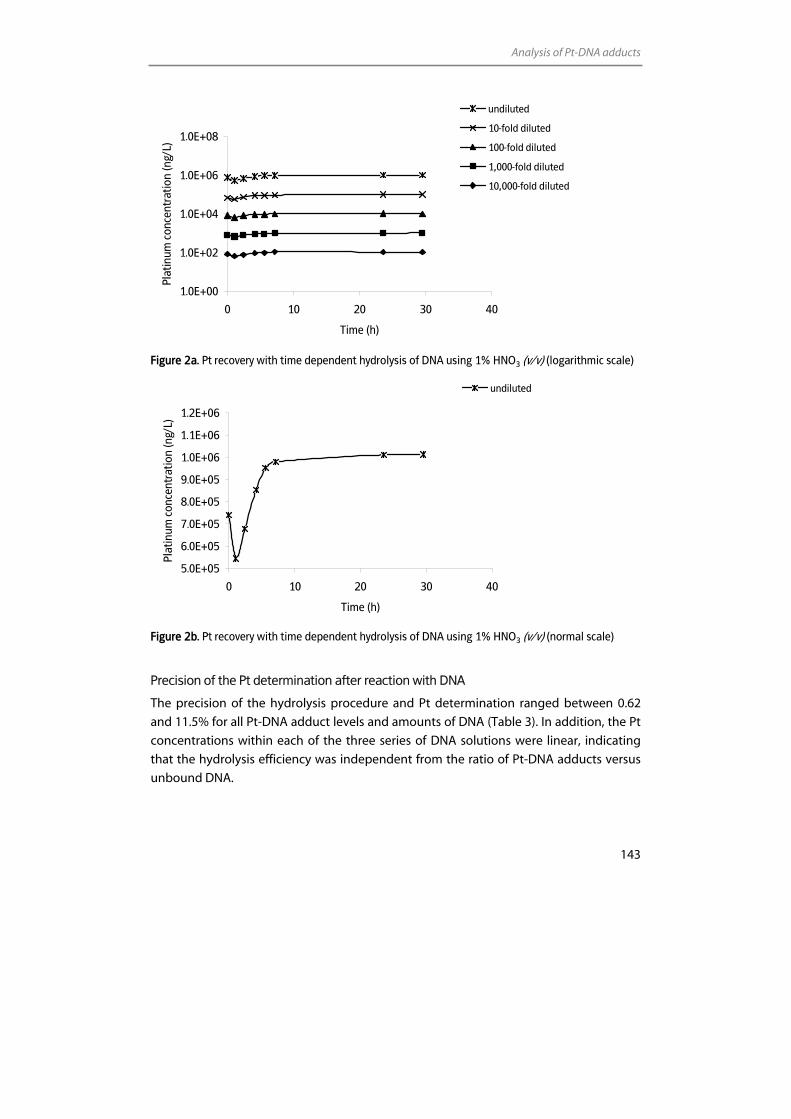
Analysis of Pt-DNA adducts
143
1.0E+00
1.0E+02
1.0E+04
1.0E+06
1.0E+08
0 10 20 30 40
Time (h)
Plat
inum
con
cent
ratio
n (n
g/L)
undiluted
10-fold diluted
100-fold diluted
1,000-fold diluted
10,000-fold diluted
Figure 2a. Pt recovery with time dependent hydrolysis of DNA using 1% HNO3 (v/v) (logarithmic scale)
5.0E+05
6.0E+05
7.0E+05
8.0E+05
9.0E+05
1.0E+06
1.1E+06
1.2E+06
0 10 20 30 40
Time (h)
Plat
inum
con
cent
ratio
n (n
g/L)
undiluted
Figure 2b. Pt recovery with time dependent hydrolysis of DNA using 1% HNO3 (v/v) (normal scale)
Precision of the Pt determination after reaction with DNA
The precision of the hydrolysis procedure and Pt determination ranged between 0.62
and 11.5% for all Pt-DNA adduct levels and amounts of DNA (Table 3). In addition, the Pt
concentrations within each of the three series of DNA solutions were linear, indicating
that the hydrolysis efficiency was independent from the ratio of Pt-DNA adducts versus
unbound DNA.
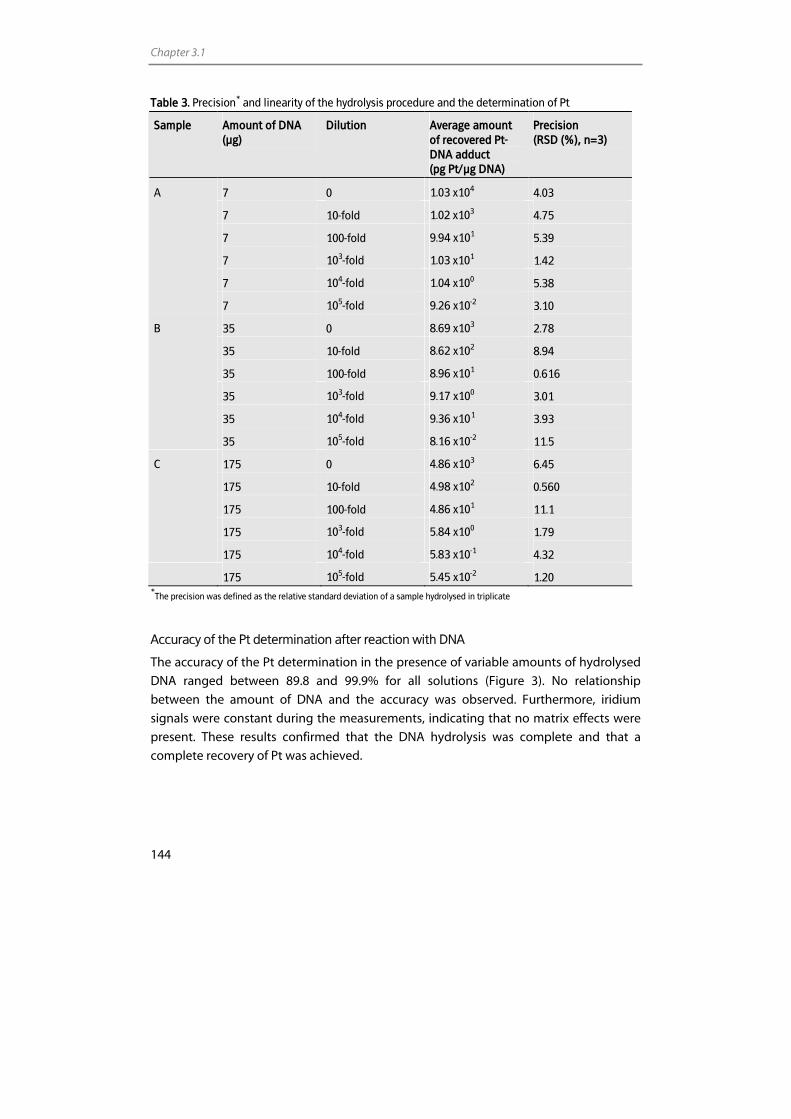
Chapter 3.1
144
Table 3. Precision* and linearity of the hydrolysis procedure and the determination of Pt
Sample Amount of DNA (µg)
Dilution Average amount of recovered Pt-DNA adduct (pg Pt/µg DNA)
Precision (RSD (%), n=3)
7 0 1.03 x10⁴ 4.03
7 10-fold 1.02 x10³ 4.75
7 100-fold 9.94 x101 5.39
7 103-fold 1.03 x101 1.42
7 104-fold 1.04 x100 5.38
A
7 105-fold 9.26 x10⁻² 3.10
35 0 8.69 x10³ 2.78
35 10-fold 8.62 x10² 8.94
35 100-fold 8.96 x101 0.616
35 103-fold 9.17 x100 3.01
35 104-fold 9.36 x10⁻¹ 3.93
B
35 105-fold 8.16 x10⁻² 11.5
175 0 4.86 x10³ 6.45
175 10-fold 4.98 x10² 0.560
175 100-fold 4.86 x101 11.1
175 103-fold 5.84 x100 1.79
C
175 104-fold 5.83 x10⁻¹ 4.32
175 105-fold 5.45 x10⁻² 1.20 *
The precision was defined as the relative standard deviation of a sample hydrolysed in triplicate
Accuracy of the Pt determination after reaction with DNA
The accuracy of the Pt determination in the presence of variable amounts of hydrolysed
DNA ranged between 89.8 and 99.9% for all solutions (Figure 3). No relationship
between the amount of DNA and the accuracy was observed. Furthermore, iridium
signals were constant during the measurements, indicating that no matrix effects were
present. These results confirmed that the DNA hydrolysis was complete and that a
complete recovery of Pt was achieved.
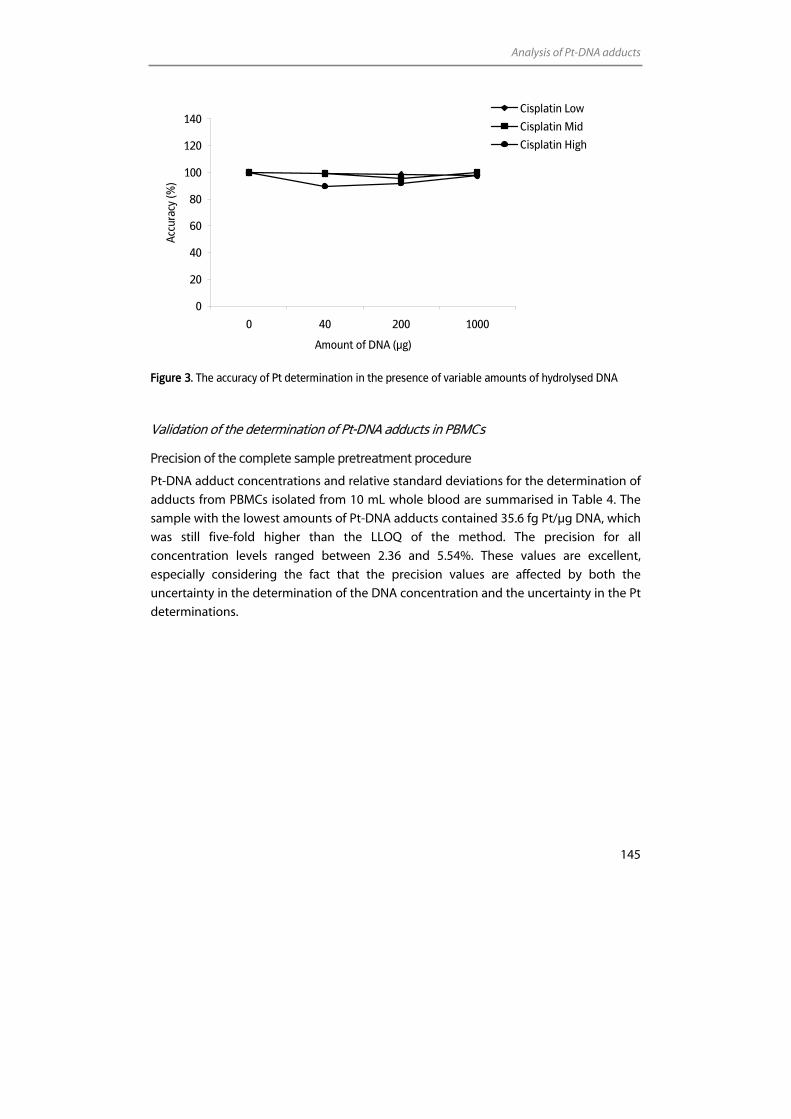
Analysis of Pt-DNA adducts
145
0
20
40
60
80
100
120
140
0 40 200 1000
Amount of DNA (µg)
Acc
urac
y (%
)
Cisplatin Low
Cisplatin Mid
Cisplatin High
Figure 3. The accuracy of Pt determination in the presence of variable amounts of hydrolysed DNA
Validation of the determination of Pt-DNA adducts in PBMCs
Precision of the complete sample pretreatment procedure
Pt-DNA adduct concentrations and relative standard deviations for the determination of
adducts from PBMCs isolated from 10 mL whole blood are summarised in Table 4. The
sample with the lowest amounts of Pt-DNA adducts contained 35.6 fg Pt/µg DNA, which
was still five-fold higher than the LLOQ of the method. The precision for all
concentration levels ranged between 2.36 and 5.54%. These values are excellent,
especially considering the fact that the precision values are affected by both the
uncertainty in the determination of the DNA concentration and the uncertainty in the Pt
determinations.
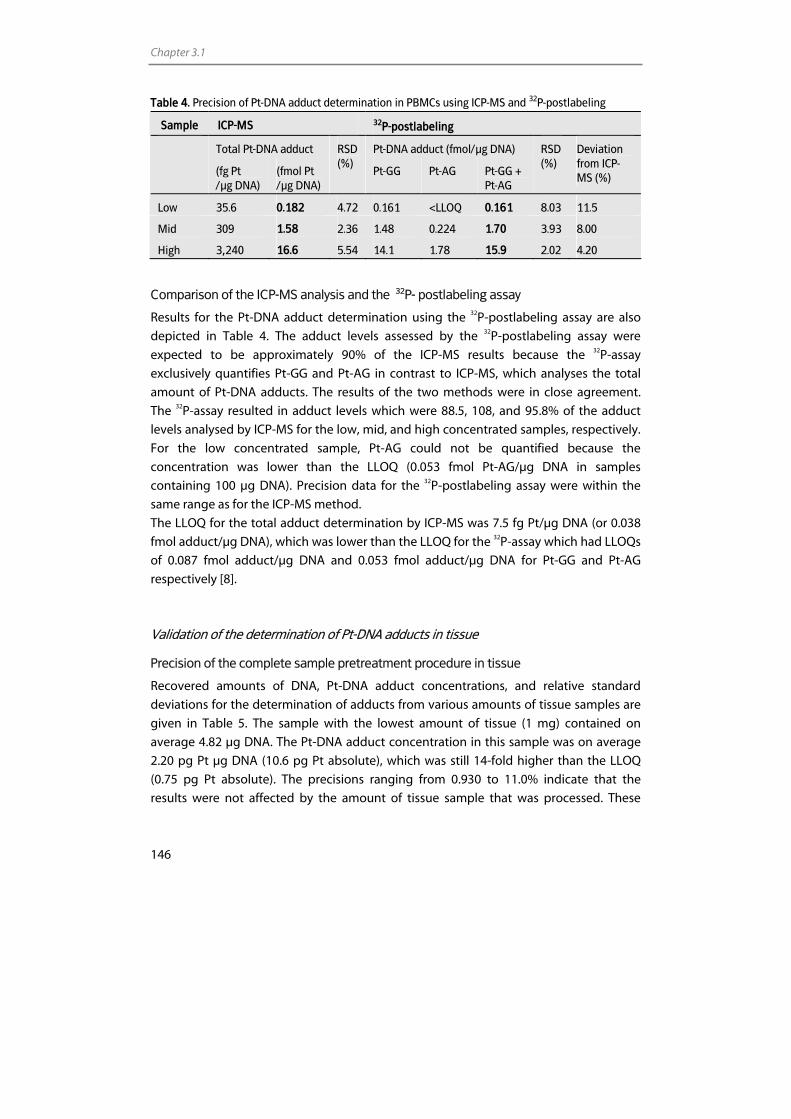
Chapter 3.1
146
Table 4. Precision of Pt-DNA adduct determination in PBMCs using ICP-MS and 32P-postlabeling
Sample ICP-MS 32P-postlabeling
Total Pt-DNA adduct Pt-DNA adduct (fmol/µg DNA)
(fg Pt /µg DNA)
(fmol Pt /µg DNA)
RSD (%)
Pt-GG Pt-AG Pt-GG + Pt-AG
RSD (%)
Deviation from ICP-MS (%)
Low 35.6 0.182 4.72 0.161 <LLOQ 0.161 8.03 11.5
Mid 309 1.58 2.36 1.48 0.224 1.70 3.93 8.00
High 3,240 16.6 5.54 14.1 1.78 15.9 2.02 4.20
Comparison of the ICP-MS analysis and the 32P- postlabeling assay
Results for the Pt-DNA adduct determination using the 32P-postlabeling assay are also
depicted in Table 4. The adduct levels assessed by the 32P-postlabeling assay were
expected to be approximately 90% of the ICP-MS results because the 32P-assay
exclusively quantifies Pt-GG and Pt-AG in contrast to ICP-MS, which analyses the total
amount of Pt-DNA adducts. The results of the two methods were in close agreement.
The 32P-assay resulted in adduct levels which were 88.5, 108, and 95.8% of the adduct
levels analysed by ICP-MS for the low, mid, and high concentrated samples, respectively.
For the low concentrated sample, Pt-AG could not be quantified because the
concentration was lower than the LLOQ (0.053 fmol Pt-AG/µg DNA in samples
containing 100 µg DNA). Precision data for the 32P-postlabeling assay were within the
same range as for the ICP-MS method.
The LLOQ for the total adduct determination by ICP-MS was 7.5 fg Pt/µg DNA (or 0.038
fmol adduct/µg DNA), which was lower than the LLOQ for the 32P-assay which had LLOQs
of 0.087 fmol adduct/µg DNA and 0.053 fmol adduct/µg DNA for Pt-GG and Pt-AG
respectively [8].
Validation of the determination of Pt-DNA adducts in tissue
Precision of the complete sample pretreatment procedure in tissue
Recovered amounts of DNA, Pt-DNA adduct concentrations, and relative standard
deviations for the determination of adducts from various amounts of tissue samples are
given in Table 5. The sample with the lowest amount of tissue (1 mg) contained on
average 4.82 µg DNA. The Pt-DNA adduct concentration in this sample was on average
2.20 pg Pt µg DNA (10.6 pg Pt absolute), which was still 14-fold higher than the LLOQ
(0.75 pg Pt absolute). The precisions ranging from 0.930 to 11.0% indicate that the
results were not affected by the amount of tissue sample that was processed. These
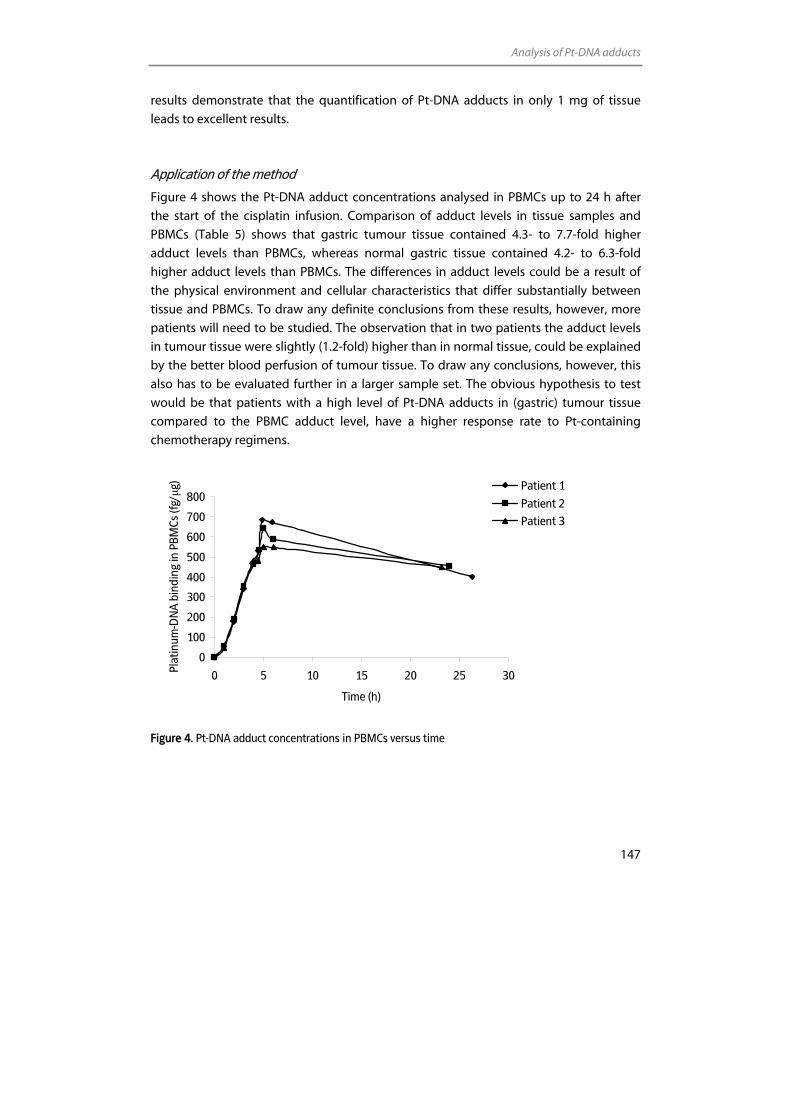
Analysis of Pt-DNA adducts
147
results demonstrate that the quantification of Pt-DNA adducts in only 1 mg of tissue
leads to excellent results.
Application of the method
Figure 4 shows the Pt-DNA adduct concentrations analysed in PBMCs up to 24 h after
the start of the cisplatin infusion. Comparison of adduct levels in tissue samples and
PBMCs (Table 5) shows that gastric tumour tissue contained 4.3- to 7.7-fold higher
adduct levels than PBMCs, whereas normal gastric tissue contained 4.2- to 6.3-fold
higher adduct levels than PBMCs. The differences in adduct levels could be a result of
the physical environment and cellular characteristics that differ substantially between
tissue and PBMCs. To draw any definite conclusions from these results, however, more
patients will need to be studied. The observation that in two patients the adduct levels
in tumour tissue were slightly (1.2-fold) higher than in normal tissue, could be explained
by the better blood perfusion of tumour tissue. To draw any conclusions, however, this
also has to be evaluated further in a larger sample set. The obvious hypothesis to test
would be that patients with a high level of Pt-DNA adducts in (gastric) tumour tissue
compared to the PBMC adduct level, have a higher response rate to Pt-containing
chemotherapy regimens.
0
100
200
300
400
500
600
700
800
0 5 10 15 20 25 30
Time (h)
Plat
inum
-DN
A b
indi
ng in
PBM
Cs (f
g/µg
) Patient 1
Patient 2
Patient 3
Figure 4. Pt-DNA adduct concentrations in PBMCs versus time
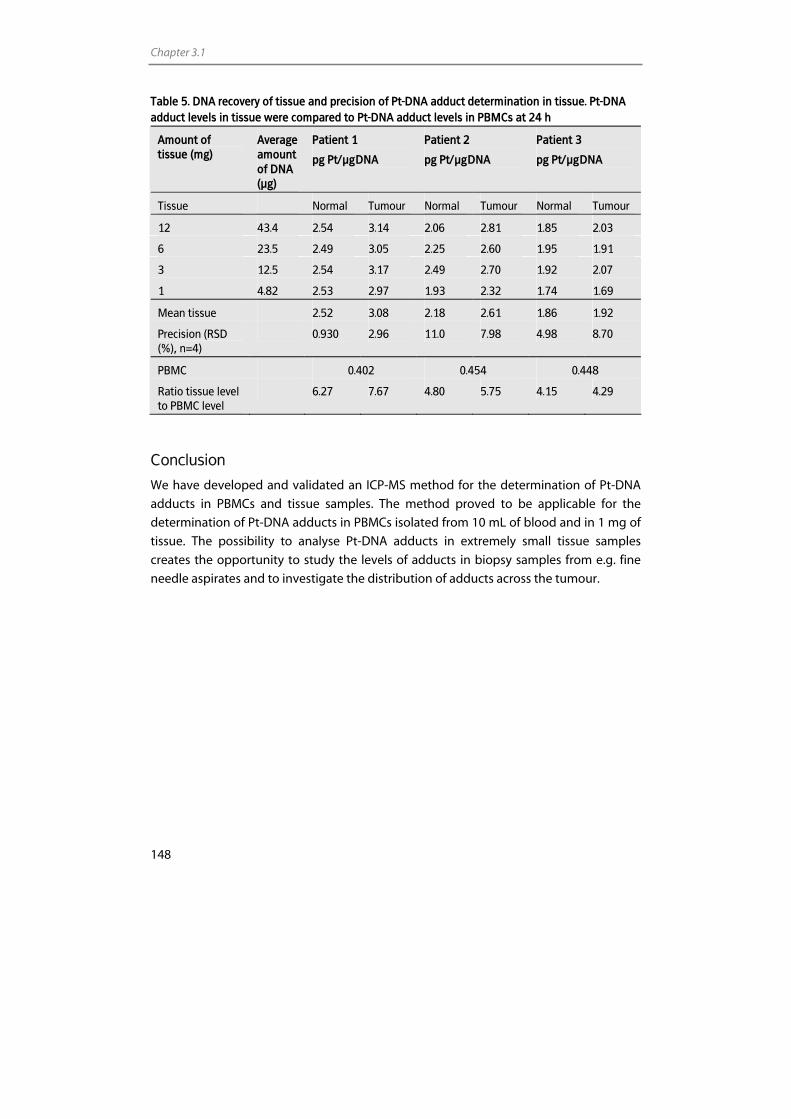
Chapter 3.1
148
Table 5. DNA recovery of tissue and precision of Pt-DNA adduct determination in tissue. Pt-DNA adduct levels in tissue were compared to Pt-DNA adduct levels in PBMCs at 24 h
Amount of tissue (mg)
Average amount of DNA (µg)
Patient 1
pg Pt/µg DNA
Patient 2
pg Pt/µg DNA
Patient 3
pg Pt/µg DNA
Tissue Normal Tumour Normal Tumour Normal Tumour
12 43.4 2.54 3.14 2.06 2.81 1.85 2.03
6 23.5 2.49 3.05 2.25 2.60 1.95 1.91
3 12.5 2.54 3.17 2.49 2.70 1.92 2.07
1 4.82 2.53 2.97 1.93 2.32 1.74 1.69
Mean tissue 2.52 3.08 2.18 2.61 1.86 1.92
Precision (RSD (%), n=4)
0.930 2.96 11.0 7.98 4.98 8.70
PBMC 0.402 0.454 0.448
Ratio tissue level to PBMC level
6.27 7.67 4.80 5.75 4.15 4.29
Conclusion
We have developed and validated an ICP-MS method for the determination of Pt-DNA
adducts in PBMCs and tissue samples. The method proved to be applicable for the
determination of Pt-DNA adducts in PBMCs isolated from 10 mL of blood and in 1 mg of
tissue. The possibility to analyse Pt-DNA adducts in extremely small tissue samples
creates the opportunity to study the levels of adducts in biopsy samples from e.g. fine
needle aspirates and to investigate the distribution of adducts across the tumour.
Analysis of Pt-DNA adducts
149
References 1. Rosenberg B, Vancamp L, Krigas T. Inhibition of cell division in escherichia coli by electrolysis products
from a platinum electrode. Nature 1965; 205: 698-9.
2. Schellens JH, Ma J, Planting AS, van der Burg ME, van Meerten E, Boer-Dennert M, Schmitz PI, Stoter G, Verweij J. Relationship between the exposure to cisplatin, DNA-adduct formation in leucocytes and tumour response in patients with solid tumours. Br J Cancer 1996; 73: 1569-75.
3. Reed E, Parker RJ, Gill I, Bicher A, Dabholkar M, Vionnet JA, Bostick-Bruton F, Tarone R, Muggia FM. Platinum-DNA adduct in leukocyte DNA of a cohort of 49 patients with 24 different types of malignancies. Cancer Res 1993; 53: 3694-9.
4. Hoebers FJ, Pluim D, Verheij M, Balm AJ, Bartelink H, Schellens JH, Begg AC. Prediction of treatment outcome by cisplatin-DNA adduct formation in patients with stage III/IV head and neck squamous cell carcinoma, treated by concurrent cisplatin-radiation (RADPLAT). Int J Cancer 2006; 119: 750-6.
5. Fichtinger-Schepman AM, van der Velde-Visser SD, Dijk-Knijnenburg HC, van Oosterom AT, Baan RA, Berends F. Kinetics of the formation and removal of cisplatin-DNA adducts in blood cells and tumor tissue of cancer patients receiving chemotherapy: comparison with in vitro adduct formation. Cancer Res 1990; 50: 7887-94.
6. Reedijk J. Why does Cisplatin reach Guanine-N7 with competing S-donor ligands available in the cell? Chem Rev 1999; 99: 2499-510.
7. Centerwall CR, Tacka KA, Kerwood DJ, Goodisman J, Toms BB, Dubowy RL, Dabrowiak JC. Modification and uptake of a cisplatin carbonato complex by Jurkat cells. Mol Pharmacol 2006; 70: 348-55.
8. Pluim D, Maliepaard M, van Waardenburg RC, Beijnen JH, Schellens JHM. 32P-postlabeling assay for the quantification of the major platinum-DNA adducts. Anal Biochem 1999; 275: 30-8.
9. Bonetti A, Apostoli P, Zaninelli M, Pavanel F, Colombatti M, Cetto GL, Franceschi T, Sperotto L, Leone R. Inductively coupled plasma mass spectroscopy quantitation of platinum-DNA adducts in peripheral blood leukocytes of patients receiving cisplatin- or carboplatin-based chemotherapy. Clin Cancer Res 1996; 2: 1829-35.
10. Liu J, Kraut E, Bender J, Brooks R, Balcerzak S, Grever M, Stanley H, D'Ambrosio S, Gibson-D'Ambrosio R, Chan KK. Pharmacokinetics of oxaliplatin (NSC 266046) alone and in combination with paclitaxel in cancer patients. Cancer Chemother Pharmacol 2002; 49: 367-74.
11. Cooper BW, Veal GJ, Radivoyevitch T, Tilby MJ, Meyerson HJ, Lazarus HM, Koc ON, Creger RJ, Pearson G, Nowell GM, Gosky D, Ingalls ST, Hoppel CL, Gerson SL. A phase I and pharmacodynamic study of fludarabine, carboplatin, and topotecan in patients with relapsed, refractory, or high-risk acute leukemia. Clin Cancer Res 2004; 10: 6830-9.
12. McDonald ES, Randon KR, Knight A, Windebank AJ. Cisplatin preferentially binds to DNA in dorsal root ganglion neurons in vitro and in vivo: a potential mechanism for neurotoxicity. Neurobiol Dis 2005; 18: 305-13.
13. Rice JR, Gerberich JL, Nowotnik DP, Howell SB. Preclinical efficacy and pharmacokinetics of AP5346, a novel diaminocyclohexane-platinum tumor-targeting drug delivery system. Clin Cancer Res 2006; 12: 2248-54.
14. Yamada K, Kato N, Takagi A, Koi M, Hemmi H. One-milliliter wet-digestion for inductively coupled plasma mass spectrometry (ICP-MS): determination of platinum-DNA adducts in cells treated with platinum(II) complexes. Anal Bioanal Chem 2005; 382: 1702-7.
15. Bjorn E, Nygren Y, Nguyen TT, Ericson C, Nojd M, Naredi P. Determination of platinum in human subcellular microsamples by inductively coupled plasma mass spectrometry. Anal Biochem 2007; 363: 135-42.
16. Lustig L, Zang S, Michalke B, Schramel P, Beck W. Platinum determination in nutrient plants by inductively coupled plasma mass spectrometry with special respect to the hafnium oxide interference. Fresenius J Anal Chem 1997; 357: 1157-63.
17. Ma J, Verweij J, Planting AS, Boer-Dennert M, van Ingen HE, van der Burg ME, Stoter G, Schellens JH. Current sample handling methods for measurement of platinum-DNA adducts in leucocytes in man lead to discrepant results in DNA adduct levels and DNA repair. Br J Cancer 1995; 71: 512-7.

Chapter 3.2
The effects of sulfur-containing compounds and gemcitabine on the
binding of cisplatin to plasma proteins and DNA determined by ICP-MS and
HPLC-ICP-MS
Elke E.M. Brouwers Alwin D.R. Huitema Jan H.M. Schellens
Jos H. Beijnen
Submitted for publication
Chapter 3.2
152
Abstract
The aim of this study was to investigate the effect of the compounds sodium thiosulfate
(STS), glutathione (GSH), acetylcysteine (AC), and gemcitabine on the platinum-protein
(Pt-protein) and platinum-DNA (Pt-DNA) binding of cisplatin in whole blood. This was
done to obtain more insight into the platinum (Pt) binding in whole blood and the
effects of modulators on this process.
STS, GSH, AC, and gemcitabine were added before and after the incubation of whole
blood with cisplatin. Pt levels in plasma and plasma ultrafiltrate and bound to DNA in
peripheral blood mononuclear cells were determined using inductively coupled plasma
mass spectrometry (ICP-MS). Additionally, information on the major Pt-DNA adducts was
obtained by separation of the Pt-DNA adducts by high performance liquid chromato-
graphy (HPLC) with off-line ICP-MS detection.
Results showed that the reactive Pt levels in whole blood are reduced by STS, GSH, and
AC. This reduction was demonstrated by a reduced Pt-protein and Pt-DNA binding in the
presence of sulfur-containing compounds. Furthermore, STS and AC appeared to be
able to release Pt from proteins. The compounds could hardly release Pt from the DNA.
Gemcitabine slightly inhibited Pt-DNA binding and did not alter Pt-protein binding. The
type of Pt-DNA adducts were found not altered in the presence of the modulators.
In conclusion, the results of the current study illustrate that STS, GSH, and AC affect the
Pt binding in whole blood, which suggests that these compounds could affect Pt-
binding in patients. By interfering with Pt-DNA and Pt-protein binding, the compounds
could influence side effects and cytotoxicity.
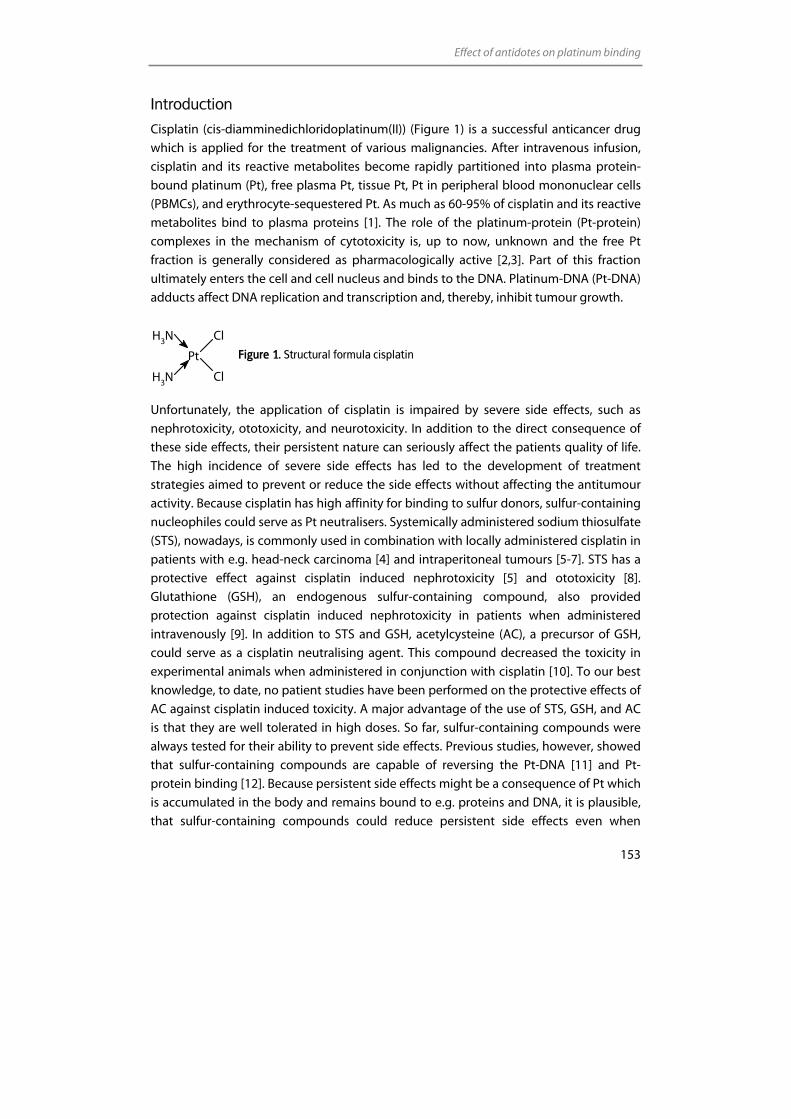
Effect of antidotes on platinum binding
153
Introduction
Cisplatin (cis-diamminedichloridoplatinum(II)) (Figure 1) is a successful anticancer drug
which is applied for the treatment of various malignancies. After intravenous infusion,
cisplatin and its reactive metabolites become rapidly partitioned into plasma protein-
bound platinum (Pt), free plasma Pt, tissue Pt, Pt in peripheral blood mononuclear cells
(PBMCs), and erythrocyte-sequestered Pt. As much as 60-95% of cisplatin and its reactive
metabolites bind to plasma proteins [1]. The role of the platinum-protein (Pt-protein)
complexes in the mechanism of cytotoxicity is, up to now, unknown and the free Pt
fraction is generally considered as pharmacologically active [2,3]. Part of this fraction
ultimately enters the cell and cell nucleus and binds to the DNA. Platinum-DNA (Pt-DNA)
adducts affect DNA replication and transcription and, thereby, inhibit tumour growth.
Figure 1. Structural formula cisplatin
Unfortunately, the application of cisplatin is impaired by severe side effects, such as
nephrotoxicity, ototoxicity, and neurotoxicity. In addition to the direct consequence of
these side effects, their persistent nature can seriously affect the patients quality of life.
The high incidence of severe side effects has led to the development of treatment
strategies aimed to prevent or reduce the side effects without affecting the antitumour
activity. Because cisplatin has high affinity for binding to sulfur donors, sulfur-containing
nucleophiles could serve as Pt neutralisers. Systemically administered sodium thiosulfate
(STS), nowadays, is commonly used in combination with locally administered cisplatin in
patients with e.g. head-neck carcinoma [4] and intraperitoneal tumours [5-7]. STS has a
protective effect against cisplatin induced nephrotoxicity [5] and ototoxicity [8].
Glutathione (GSH), an endogenous sulfur-containing compound, also provided
protection against cisplatin induced nephrotoxicity in patients when administered
intravenously [9]. In addition to STS and GSH, acetylcysteine (AC), a precursor of GSH,
could serve as a cisplatin neutralising agent. This compound decreased the toxicity in
experimental animals when administered in conjunction with cisplatin [10]. To our best
knowledge, to date, no patient studies have been performed on the protective effects of
AC against cisplatin induced toxicity. A major advantage of the use of STS, GSH, and AC
is that they are well tolerated in high doses. So far, sulfur-containing compounds were
always tested for their ability to prevent side effects. Previous studies, however, showed
that sulfur-containing compounds are capable of reversing the Pt-DNA [11] and Pt-
protein binding [12]. Because persistent side effects might be a consequence of Pt which
is accumulated in the body and remains bound to e.g. proteins and DNA, it is plausible,
that sulfur-containing compounds could reduce persistent side effects even when
Pt
Cl
Cl
NH3
NH3
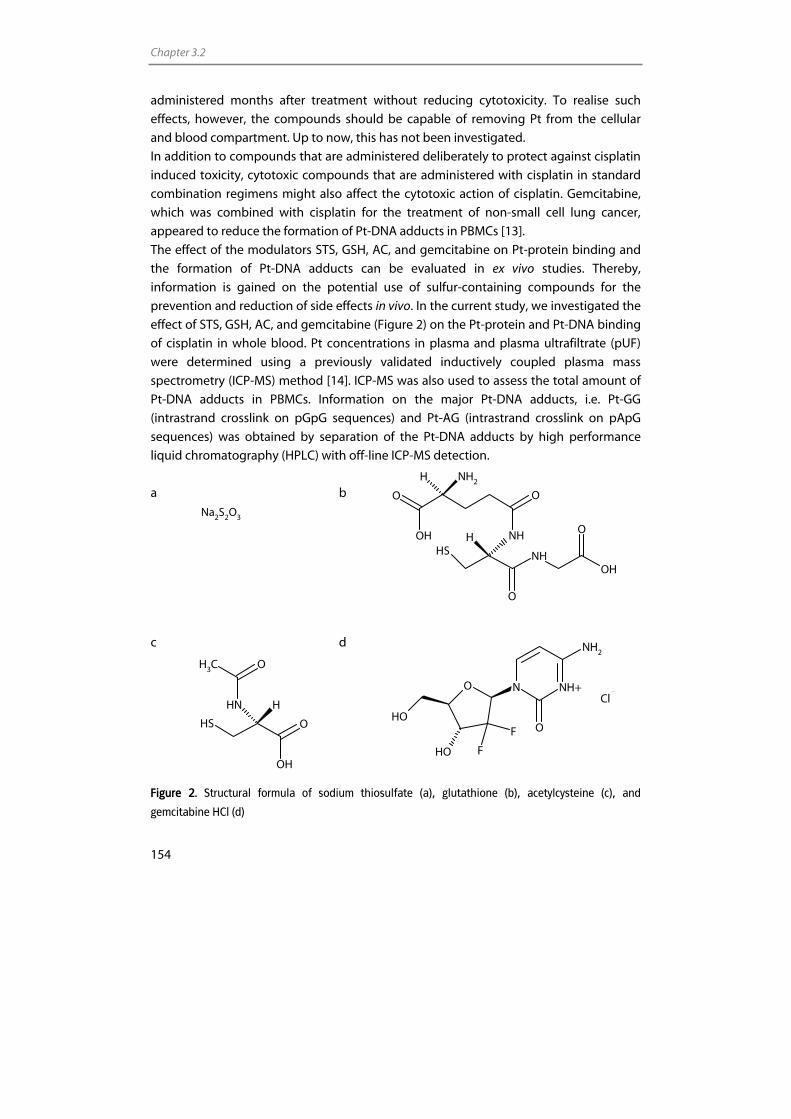
Chapter 3.2
154
administered months after treatment without reducing cytotoxicity. To realise such
effects, however, the compounds should be capable of removing Pt from the cellular
and blood compartment. Up to now, this has not been investigated.
In addition to compounds that are administered deliberately to protect against cisplatin
induced toxicity, cytotoxic compounds that are administered with cisplatin in standard
combination regimens might also affect the cytotoxic action of cisplatin. Gemcitabine,
which was combined with cisplatin for the treatment of non-small cell lung cancer,
appeared to reduce the formation of Pt-DNA adducts in PBMCs [13].
The effect of the modulators STS, GSH, AC, and gemcitabine on Pt-protein binding and
the formation of Pt-DNA adducts can be evaluated in ex vivo studies. Thereby,
information is gained on the potential use of sulfur-containing compounds for the
prevention and reduction of side effects in vivo. In the current study, we investigated the
effect of STS, GSH, AC, and gemcitabine (Figure 2) on the Pt-protein and Pt-DNA binding
of cisplatin in whole blood. Pt concentrations in plasma and plasma ultrafiltrate (pUF)
were determined using a previously validated inductively coupled plasma mass
spectrometry (ICP-MS) method [14]. ICP-MS was also used to assess the total amount of
Pt-DNA adducts in PBMCs. Information on the major Pt-DNA adducts, i.e. Pt-GG
(intrastrand crosslink on pGpG sequences) and Pt-AG (intrastrand crosslink on pApG
sequences) was obtained by separation of the Pt-DNA adducts by high performance
liquid chromatography (HPLC) with off-line ICP-MS detection.
a b
c d
Figure 2. Structural formula of sodium thiosulfate (a), glutathione (b), acetylcysteine (c), and
gemcitabine HCl (d)
Na2S2O3
SH NHOH
O
O
HOH
O
NH
H NH2
O
SH O
OH
NH H
OCH3
N NH+
O
NH2
O
OH
OH F
F
Cl
Effect of antidotes on platinum binding
155
Experimental
Chemicals
Cisplatin reference standard was purchased from Calbiochem (San Diego, CA, USA).
Nitric acid (HNO3) 70% Ultrex II ultrapure reagent was obtained from Mallinckrodt Baker
(Philipsburg, NJ, USA). Water used for the analyses was sterile water for irrigation (Aqua
B. Braun Medical, Melsungen, Germany). Heparinised whole blood was obtained from
healthy volunteers. The STS solution (250 g/L) was supplied by the Hospital Pharmacy of
Haarlem (the Netherlands). AC was purchased from Zambon (Amersfoort, the
Netherlands). Gemcitabine HCl was obtained from Eli Lilly (Houten, the Netherlands).
Proteinase K and sodium dodecylsulfate (SDS) were acquired from Sigma-Aldrich
(Steinheim, Germany). Sodium chloride (NaCl), edta disodium and diammonium salt,
potassium hydrogencarbonate (KHCO3), ammonium acetate, and iridium chloride were
purchased from Merck (Darmstadt, Germany). Ammonium hydrogencarbonate
(NH4HCO3) was purchased from VWR (Fontenay-sous-Bois, France). GSH, zink chloride
(ZnCl2), magnesium chloride (MgCl2), nuclease P1, tris-HCl, phosphate buffered saline
(PBS), and triton X-100 were obtained from Sigma-Aldrich (St. Louis, MO, USA). DNAse I
and alkaline phosphatase were acquired from Roche Applied Science (Basel,
Switzerland). The dinucleosides GpG and ApG were purchased from Metabion (Planegg-
Martinsried, Germany). Absolute ethanol en methanol were obtained from Biosolve
(Valkenswaard, the Netherlands).
Treatment of whole blood with cisplatin and modulators
Two separate experiments were performed to evaluate the effects of STS, GSH, AC, and
gemcitabine on Pt-protein and Pt-DNA binding. In the first experiment, modulators were
added prior to cisplatin incubation to assess whether the modulators could prevent Pt-
protein and Pt-DNA binding. In the second experiment, modulators were added 3 h after
cisplatin incubation to assess whether the modulators were capable of removing Pt from
the proteins and DNA. The administered concentrations of the sulfur-containing
compounds used in the experiments were calculated by dividing the initial dose
generally administered to patients by a blood volume of 5 L [4,15,16]. The cisplatin and
gemcitabine concentrations chosen for the experiments were approximately 30-fold
higher than the maximal concentrations reached after a common intravenous infusion
[17,18]. This was done to achieve Pt-DNA adduct levels that were detectable after HPLC
speciation analysis.
For the first experiment, four samples of 30 mL of heparinised whole blood were
incubated at 37 °C with 3.6 g/L STS, 0.5 g/L GSH, 2.1 g/L AC, or 0.65 g/L gemcitabine. To
Chapter 3.2
156
two 30 mL whole blood samples no modulator was added. After 30 min, cisplatin was
added to all samples up to a final concentration of 0.1 g/L cisplatin (corresponding to
0.065 g/L Pt) and incubation was continued for 6 h.
After 1, 3, and 6 h, aliquots of 10 mL of whole blood were taken from the samples and
transferred to 10 mL heparin-containing tubes (Becton Dickinson Vacutainer Systems,
Plymouth, UK). Following centrifugation for 15 min at 1,000 g and 4 °C, the plasma
fraction was isolated. PUF was obtained by centrifuging the plasma fraction through 30
kDa cut-off ultrafiltrate filters (Centriplus Millipore Corporation, Bedford, MA, USA) for 30
min (1,000 g, 20 °C). Plasma samples were diluted in a 0.01% (g/v) edta diammonium salt
and Triton-X solution in water. PUF samples were diluted using a 1% (v/v) HNO3 solution
in water. After the addition of an internal standard, the Pt contents of the plasma and
pUF samples were analysed using ICP-MS.
The PBMC fraction was isolated from the centrifuged whole blood as described earlier
[19,20]. The sample pretreatment procedure for PBMCs is outlined in Figure 3. Briefly,
contaminating red blood cells were lysed by incubation with 0.83% (w/v) NH4Cl, 0.1%
(w/v) KHCO3, and 1 mM edta disodium salt for 20 min at 4 °C. PBMCs were washed twice
with icecold PBS and resuspended in 9 mL of a buffer containing 10 mM Tris-HCl, 2.3%
(w/v) NaCl, and 2 mM edta disodium salt at pH 7.3.
DNA was isolated from PBMCs as described previously [19,20]. In brief, 0.9 mL 1.1 M
NH4HCO3, 0.45 mL 20% (w/v) SDS, and 150 µL 1% (w/v) proteinase K solution were added
successively, followed by overnight incubation at 42 °C. After the digestion was
complete, 3.3 mL of saturated, 6 M NaCl was added to each tube and the tubes were
shaken vigorously to precipitate proteins. The tubes were centrifuged and the
supernatant containing the DNA was transferred to another tube. Subsequently, the
supernatant was shaken, centrifuged, and transferred to another tube. Following this, 20
mL of absolute ethanol were added to precipitate the DNA. The DNA was washed twice
with 75% ethanol and was subsequently dissolved in 1 mL of water. DNA concentrations
were analysed after dilution in 10 mM Tris-HCl pH 8 by measuring the absorbance at 260
nm using a Biophotometer (Eppendorf, Hamburg, Germany). The purity of the DNA was
checked by determining the absorbance ratio at 260 and 280 nm. Ratios between 1.8
and 2.0 were routinely obtained.
Aliquots of 75 µg of DNA were hydrolysed by incubation in 1% (v/v) HNO3 at 70 °C for 24
h. The resulting solutions were diluted in 1% HNO3 to concentrations within the
calibration range of the ICP-MS. After the addition of internal standard, the total amount
of Pt-DNA adducts was analysed by ICP-MS. The total Pt-adduct concentrations were
expressed in pg Pt per µg DNA. Another 100 µg of DNA were processed to quantitate the
individual adducts by HPLC-ICP-MS as described below.
For the second experiment, six samples of 30 mL of whole blood were incubated with 100
mg/L cisplatin at 37 °C and after 3 h samples were taken for Pt analyses. Subsequently,
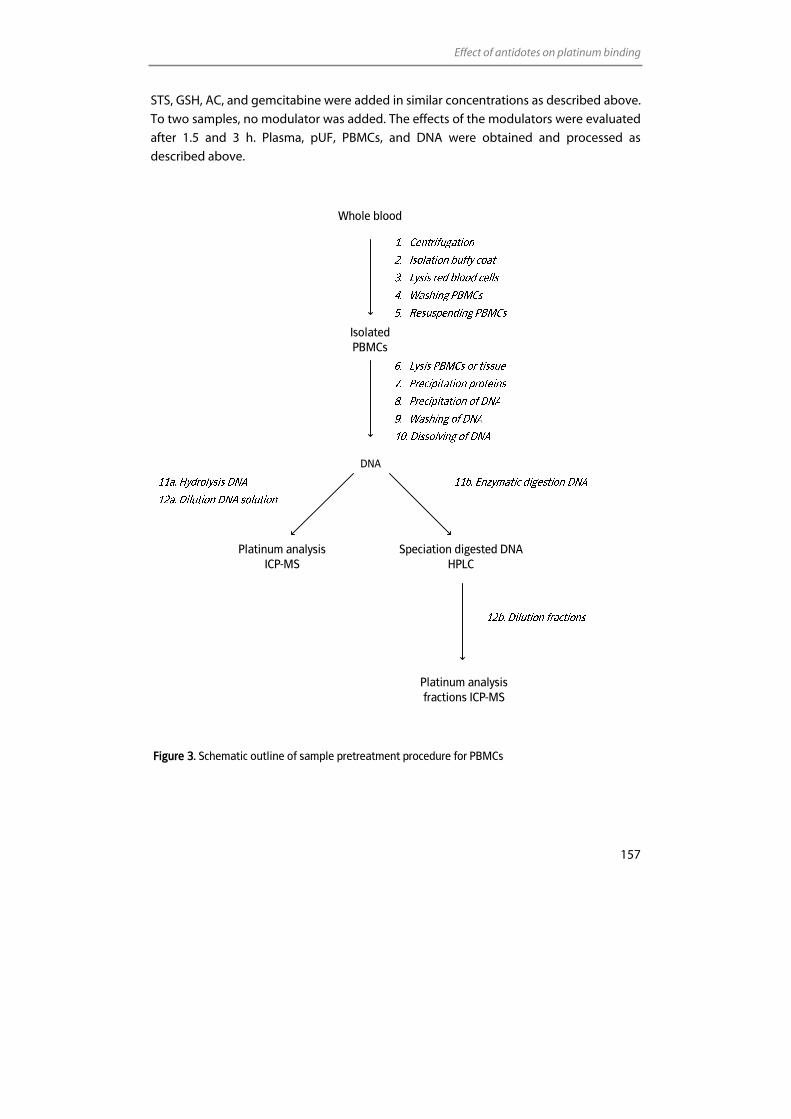
Effect of antidotes on platinum binding
157
STS, GSH, AC, and gemcitabine were added in similar concentrations as described above.
To two samples, no modulator was added. The effects of the modulators were evaluated
after 1.5 and 3 h. Plasma, pUF, PBMCs, and DNA were obtained and processed as
described above.
Whole blood
Isolated PBMCs
DNA
Platinum analysis ICP-MS
Speciation digested DNAHPLC
Platinum analysis fractions ICP-MS
Figure 3. Schematic outline of sample pretreatment procedure for PBMCs
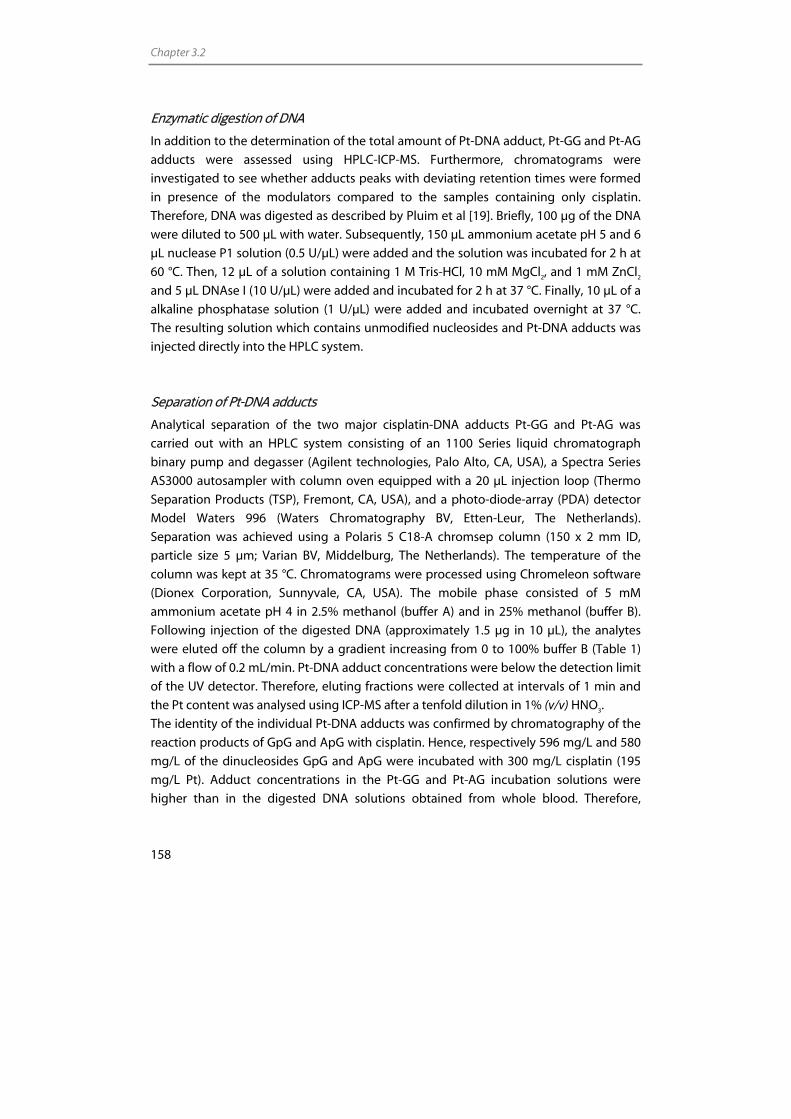
Chapter 3.2
158
Enzymatic digestion of DNA
In addition to the determination of the total amount of Pt-DNA adduct, Pt-GG and Pt-AG
adducts were assessed using HPLC-ICP-MS. Furthermore, chromatograms were
investigated to see whether adducts peaks with deviating retention times were formed
in presence of the modulators compared to the samples containing only cisplatin.
Therefore, DNA was digested as described by Pluim et al [19]. Briefly, 100 µg of the DNA
were diluted to 500 µL with water. Subsequently, 150 µL ammonium acetate pH 5 and 6
µL nuclease P1 solution (0.5 U/µL) were added and the solution was incubated for 2 h at
60 °C. Then, 12 µL of a solution containing 1 M Tris-HCl, 10 mM MgCl2, and 1 mM ZnCl2
and 5 µL DNAse I (10 U/µL) were added and incubated for 2 h at 37 °C. Finally, 10 µL of a
alkaline phosphatase solution (1 U/µL) were added and incubated overnight at 37 °C.
The resulting solution which contains unmodified nucleosides and Pt-DNA adducts was
injected directly into the HPLC system.
Separation of Pt-DNA adducts
Analytical separation of the two major cisplatin-DNA adducts Pt-GG and Pt-AG was
carried out with an HPLC system consisting of an 1100 Series liquid chromatograph
binary pump and degasser (Agilent technologies, Palo Alto, CA, USA), a Spectra Series
AS3000 autosampler with column oven equipped with a 20 µL injection loop (Thermo
Separation Products (TSP), Fremont, CA, USA), and a photo-diode-array (PDA) detector
Model Waters 996 (Waters Chromatography BV, Etten-Leur, The Netherlands).
Separation was achieved using a Polaris 5 C18-A chromsep column (150 x 2 mm ID,
particle size 5 µm; Varian BV, Middelburg, The Netherlands). The temperature of the
column was kept at 35 °C. Chromatograms were processed using Chromeleon software
(Dionex Corporation, Sunnyvale, CA, USA). The mobile phase consisted of 5 mM
ammonium acetate pH 4 in 2.5% methanol (buffer A) and in 25% methanol (buffer B).
Following injection of the digested DNA (approximately 1.5 µg in 10 µL), the analytes
were eluted off the column by a gradient increasing from 0 to 100% buffer B (Table 1)
with a flow of 0.2 mL/min. Pt-DNA adduct concentrations were below the detection limit
of the UV detector. Therefore, eluting fractions were collected at intervals of 1 min and
the Pt content was analysed using ICP-MS after a tenfold dilution in 1% (v/v) HNO3.
The identity of the individual Pt-DNA adducts was confirmed by chromatography of the
reaction products of GpG and ApG with cisplatin. Hence, respectively 596 mg/L and 580
mg/L of the dinucleosides GpG and ApG were incubated with 300 mg/L cisplatin (195
mg/L Pt). Adduct concentrations in the Pt-GG and Pt-AG incubation solutions were
higher than in the digested DNA solutions obtained from whole blood. Therefore,
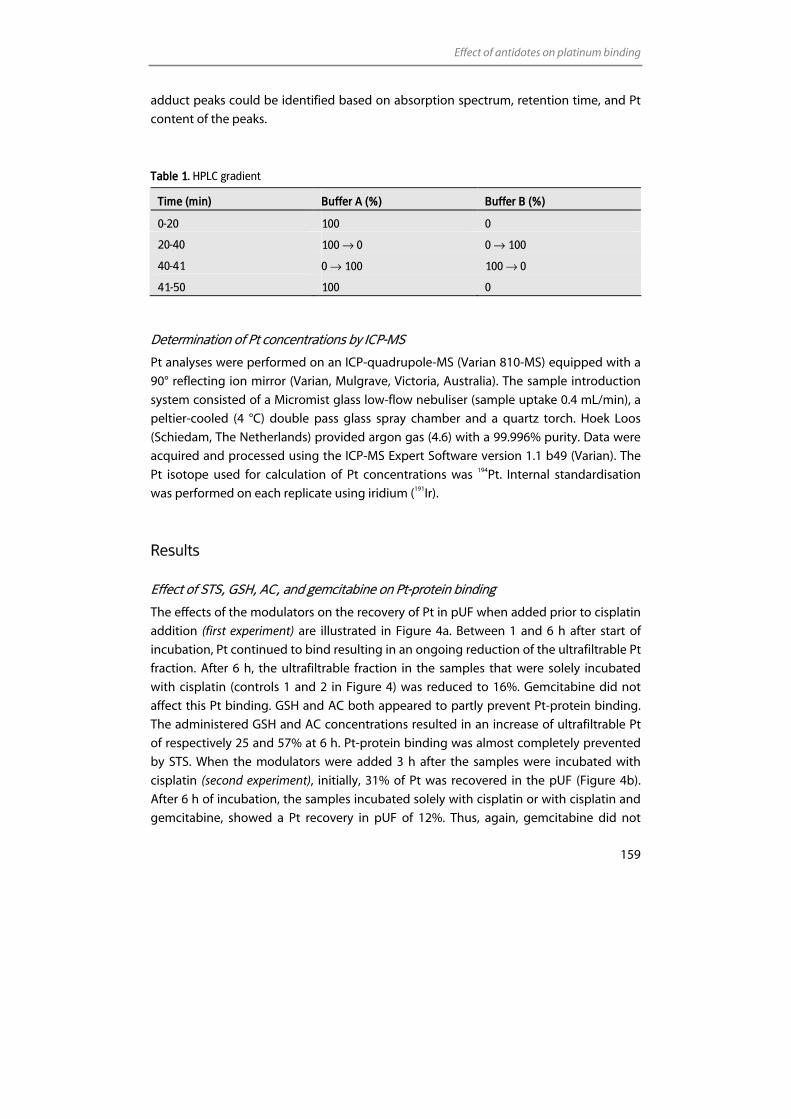
Effect of antidotes on platinum binding
159
adduct peaks could be identified based on absorption spectrum, retention time, and Pt
content of the peaks.
Table 1. HPLC gradient
Time (min) Buffer A (%) Buffer B (%)
0-20 100 0
20-40 100 → 0 0 → 100
40-41 0 → 100 100 → 0
41-50 100 0
Determination of Pt concentrations by ICP-MS
Pt analyses were performed on an ICP-quadrupole-MS (Varian 810-MS) equipped with a
90° reflecting ion mirror (Varian, Mulgrave, Victoria, Australia). The sample introduction
system consisted of a Micromist glass low-flow nebuliser (sample uptake 0.4 mL/min), a
peltier-cooled (4 °C) double pass glass spray chamber and a quartz torch. Hoek Loos
(Schiedam, The Netherlands) provided argon gas (4.6) with a 99.996% purity. Data were
acquired and processed using the ICP-MS Expert Software version 1.1 b49 (Varian). The
Pt isotope used for calculation of Pt concentrations was 194Pt. Internal standardisation
was performed on each replicate using iridium (191Ir).
Results
Effect of STS, GSH, AC, and gemcitabine on Pt-protein binding
The effects of the modulators on the recovery of Pt in pUF when added prior to cisplatin
addition (first experiment) are illustrated in Figure 4a. Between 1 and 6 h after start of
incubation, Pt continued to bind resulting in an ongoing reduction of the ultrafiltrable Pt
fraction. After 6 h, the ultrafiltrable fraction in the samples that were solely incubated
with cisplatin (controls 1 and 2 in Figure 4) was reduced to 16%. Gemcitabine did not
affect this Pt binding. GSH and AC both appeared to partly prevent Pt-protein binding.
The administered GSH and AC concentrations resulted in an increase of ultrafiltrable Pt
of respectively 25 and 57% at 6 h. Pt-protein binding was almost completely prevented
by STS. When the modulators were added 3 h after the samples were incubated with
cisplatin (second experiment), initially, 31% of Pt was recovered in the pUF (Figure 4b).
After 6 h of incubation, the samples incubated solely with cisplatin or with cisplatin and
gemcitabine, showed a Pt recovery in pUF of 12%. Thus, again, gemcitabine did not
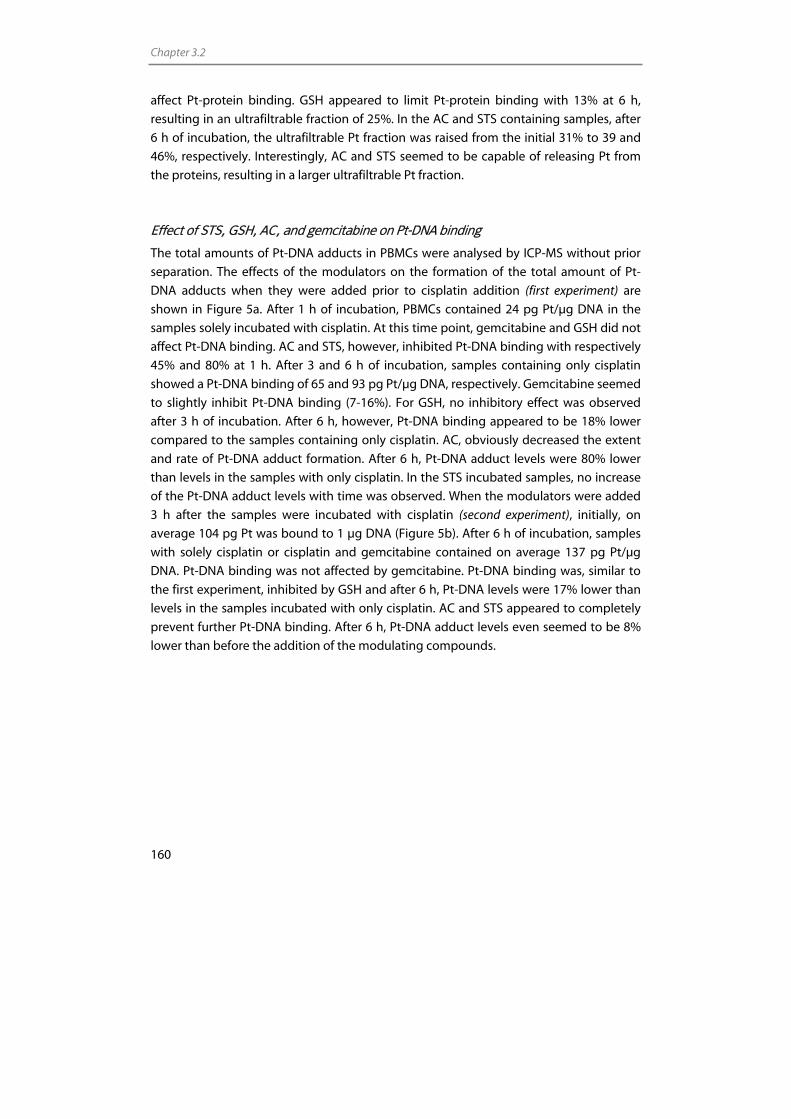
Chapter 3.2
160
affect Pt-protein binding. GSH appeared to limit Pt-protein binding with 13% at 6 h,
resulting in an ultrafiltrable fraction of 25%. In the AC and STS containing samples, after
6 h of incubation, the ultrafiltrable Pt fraction was raised from the initial 31% to 39 and
46%, respectively. Interestingly, AC and STS seemed to be capable of releasing Pt from
the proteins, resulting in a larger ultrafiltrable Pt fraction.
Effect of STS, GSH, AC, and gemcitabine on Pt-DNA binding
The total amounts of Pt-DNA adducts in PBMCs were analysed by ICP-MS without prior
separation. The effects of the modulators on the formation of the total amount of Pt-
DNA adducts when they were added prior to cisplatin addition (first experiment) are
shown in Figure 5a. After 1 h of incubation, PBMCs contained 24 pg Pt/µg DNA in the
samples solely incubated with cisplatin. At this time point, gemcitabine and GSH did not
affect Pt-DNA binding. AC and STS, however, inhibited Pt-DNA binding with respectively
45% and 80% at 1 h. After 3 and 6 h of incubation, samples containing only cisplatin
showed a Pt-DNA binding of 65 and 93 pg Pt/µg DNA, respectively. Gemcitabine seemed
to slightly inhibit Pt-DNA binding (7-16%). For GSH, no inhibitory effect was observed
after 3 h of incubation. After 6 h, however, Pt-DNA binding appeared to be 18% lower
compared to the samples containing only cisplatin. AC, obviously decreased the extent
and rate of Pt-DNA adduct formation. After 6 h, Pt-DNA adduct levels were 80% lower
than levels in the samples with only cisplatin. In the STS incubated samples, no increase
of the Pt-DNA adduct levels with time was observed. When the modulators were added
3 h after the samples were incubated with cisplatin (second experiment), initially, on
average 104 pg Pt was bound to 1 µg DNA (Figure 5b). After 6 h of incubation, samples
with solely cisplatin or cisplatin and gemcitabine contained on average 137 pg Pt/µg
DNA. Pt-DNA binding was not affected by gemcitabine. Pt-DNA binding was, similar to
the first experiment, inhibited by GSH and after 6 h, Pt-DNA levels were 17% lower than
levels in the samples incubated with only cisplatin. AC and STS appeared to completely
prevent further Pt-DNA binding. After 6 h, Pt-DNA adduct levels even seemed to be 8%
lower than before the addition of the modulating compounds.
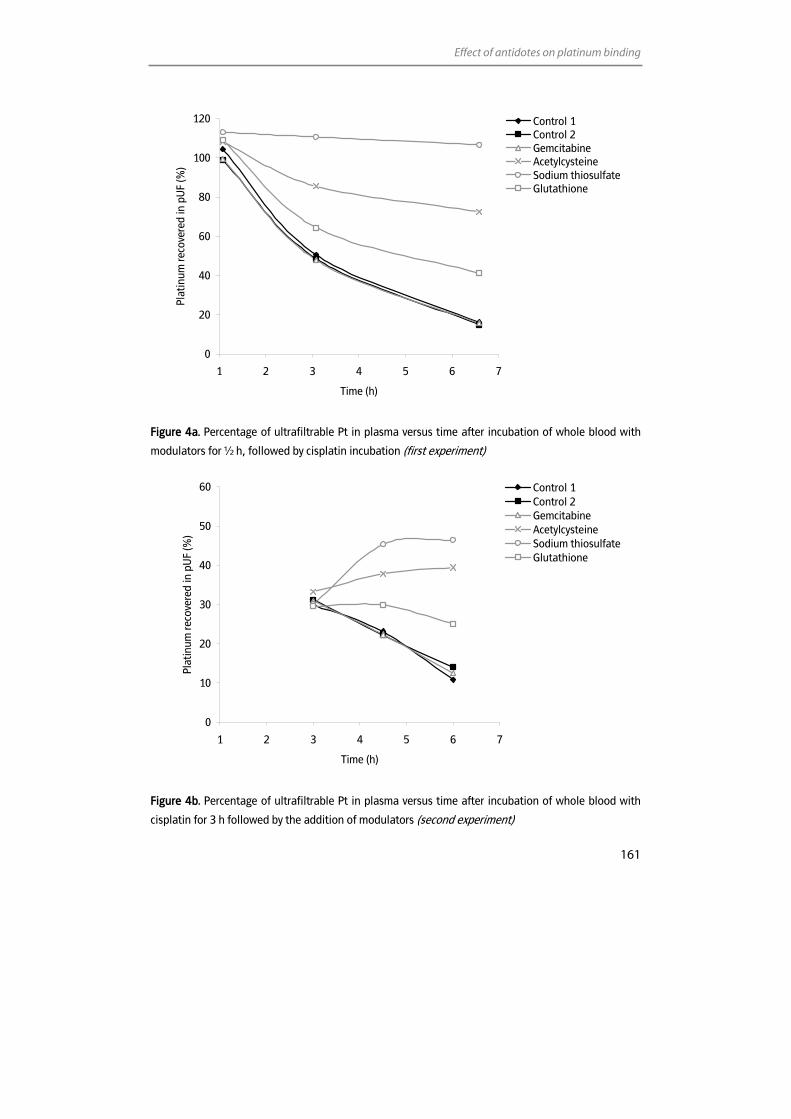
Effect of antidotes on platinum binding
161
0
20
40
60
80
100
120
1 2 3 4 5 6 7
Time (h)
Plat
inum
reco
vere
d in
pU
F (%
)
Control 1Control 2GemcitabineAcetylcysteineSodium thiosulfateGlutathione
Figure 4a. Percentage of ultrafiltrable Pt in plasma versus time after incubation of whole blood with
modulators for ½ h, followed by cisplatin incubation (first experiment)
0
10
20
30
40
50
60
1 2 3 4 5 6 7
Time (h)
Plat
inum
reco
vere
d in
pU
F (%
)
Control 1Control 2GemcitabineAcetylcysteineSodium thiosulfateGlutathione
Figure 4b. Percentage of ultrafiltrable Pt in plasma versus time after incubation of whole blood with
cisplatin for 3 h followed by the addition of modulators (second experiment)
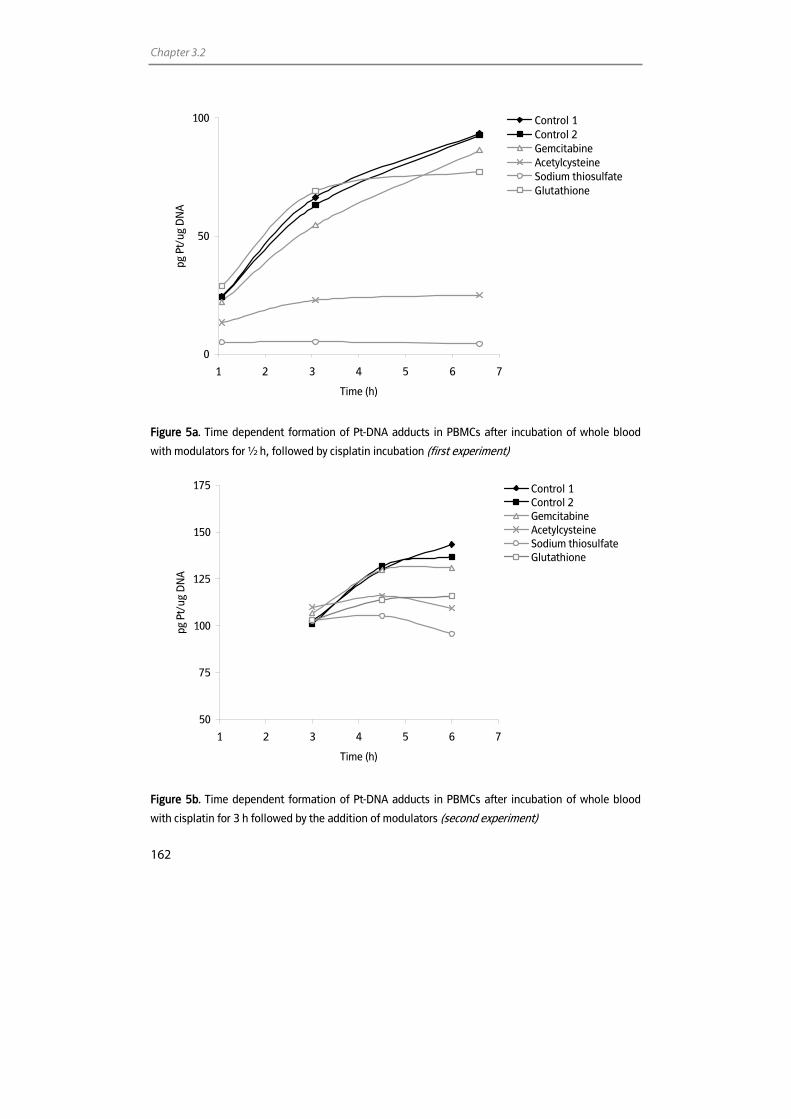
Chapter 3.2
162
0
50
100
1 2 3 4 5 6 7
Time (h)
pg P
t/ug
DN
A
Control 1Control 2GemcitabineAcetylcysteineSodium thiosulfateGlutathione
Figure 5a. Time dependent formation of Pt-DNA adducts in PBMCs after incubation of whole blood
with modulators for ½ h, followed by cisplatin incubation (first experiment)
50
75
100
125
150
175
1 2 3 4 5 6 7
Time (h)
pg P
t/ug
DN
A
Control 1Control 2GemcitabineAcetylcysteineSodium thiosulfateGlutathione
Figure 5b. Time dependent formation of Pt-DNA adducts in PBMCs after incubation of whole blood
with cisplatin for 3 h followed by the addition of modulators (second experiment)
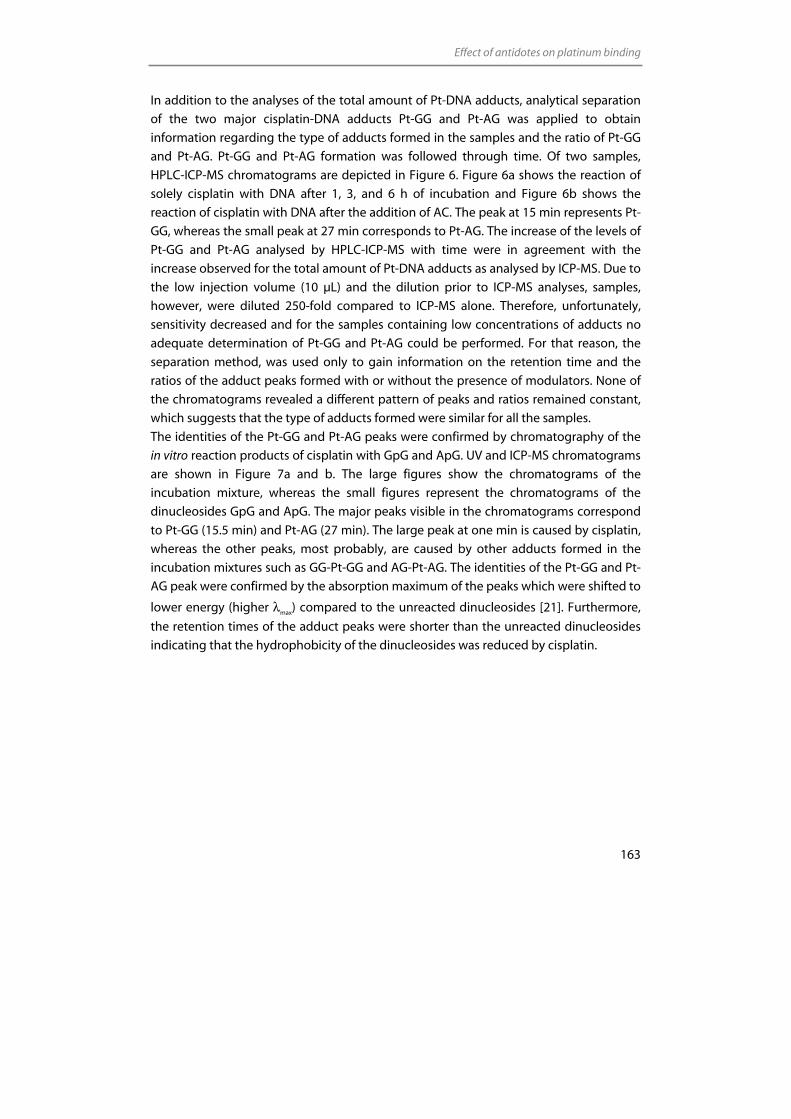
Effect of antidotes on platinum binding
163
In addition to the analyses of the total amount of Pt-DNA adducts, analytical separation
of the two major cisplatin-DNA adducts Pt-GG and Pt-AG was applied to obtain
information regarding the type of adducts formed in the samples and the ratio of Pt-GG
and Pt-AG. Pt-GG and Pt-AG formation was followed through time. Of two samples,
HPLC-ICP-MS chromatograms are depicted in Figure 6. Figure 6a shows the reaction of
solely cisplatin with DNA after 1, 3, and 6 h of incubation and Figure 6b shows the
reaction of cisplatin with DNA after the addition of AC. The peak at 15 min represents Pt-
GG, whereas the small peak at 27 min corresponds to Pt-AG. The increase of the levels of
Pt-GG and Pt-AG analysed by HPLC-ICP-MS with time were in agreement with the
increase observed for the total amount of Pt-DNA adducts as analysed by ICP-MS. Due to
the low injection volume (10 µL) and the dilution prior to ICP-MS analyses, samples,
however, were diluted 250-fold compared to ICP-MS alone. Therefore, unfortunately,
sensitivity decreased and for the samples containing low concentrations of adducts no
adequate determination of Pt-GG and Pt-AG could be performed. For that reason, the
separation method, was used only to gain information on the retention time and the
ratios of the adduct peaks formed with or without the presence of modulators. None of
the chromatograms revealed a different pattern of peaks and ratios remained constant,
which suggests that the type of adducts formed were similar for all the samples.
The identities of the Pt-GG and Pt-AG peaks were confirmed by chromatography of the
in vitro reaction products of cisplatin with GpG and ApG. UV and ICP-MS chromatograms
are shown in Figure 7a and b. The large figures show the chromatograms of the
incubation mixture, whereas the small figures represent the chromatograms of the
dinucleosides GpG and ApG. The major peaks visible in the chromatograms correspond
to Pt-GG (15.5 min) and Pt-AG (27 min). The large peak at one min is caused by cisplatin,
whereas the other peaks, most probably, are caused by other adducts formed in the
incubation mixtures such as GG-Pt-GG and AG-Pt-AG. The identities of the Pt-GG and Pt-
AG peak were confirmed by the absorption maximum of the peaks which were shifted to
lower energy (higher λmax) compared to the unreacted dinucleosides [21]. Furthermore,
the retention times of the adduct peaks were shorter than the unreacted dinucleosides
indicating that the hydrophobicity of the dinucleosides was reduced by cisplatin.
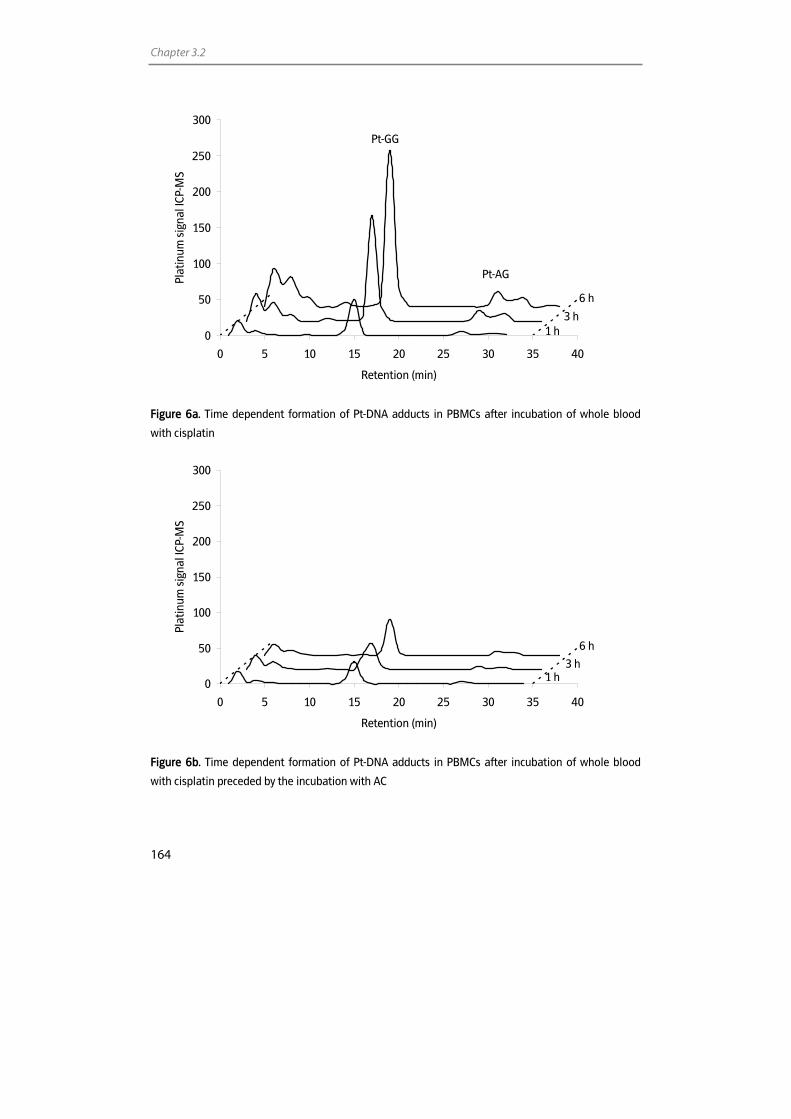
Chapter 3.2
164
0
50
100
150
200
250
300
0 5 10 15 20 25 30 35 40
Retention (min)
Plat
inum
sig
nal I
CP-M
S
Figure 6a. Time dependent formation of Pt-DNA adducts in PBMCs after incubation of whole blood
with cisplatin
0
50
100
150
200
250
300
0 5 10 15 20 25 30 35 40
Retention (min)
Plat
inum
sig
nal I
CP-M
S
Figure 6b. Time dependent formation of Pt-DNA adducts in PBMCs after incubation of whole blood
with cisplatin preceded by the incubation with AC
Pt-GG
1 h 3 h
6 h
Pt-AG
1 h 3 h
6 h
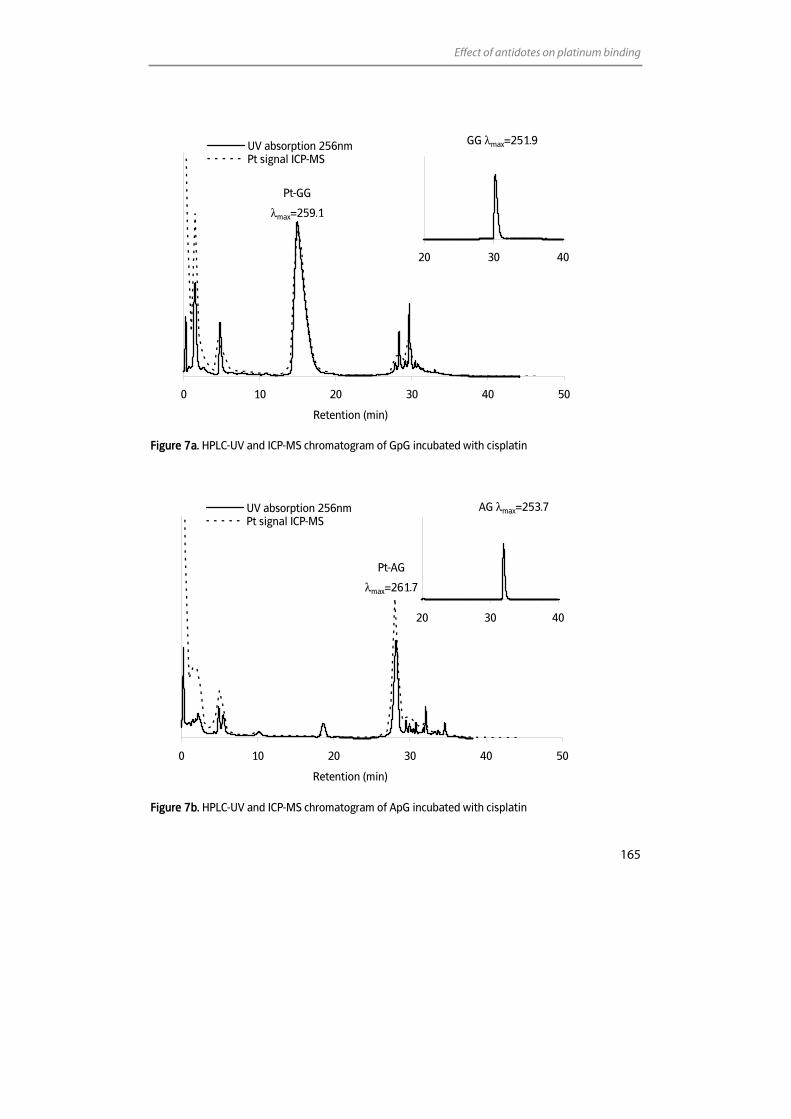
Effect of antidotes on platinum binding
165
0 10 20 30 40 50
Retention (min)
UV absorption 256nmPt signal ICP-MS
Figure 7a. HPLC-UV and ICP-MS chromatogram of GpG incubated with cisplatin
0 10 20 30 40 50
Retention (min)
UV absorption 256nmPt signal ICP-MS
Figure 7b. HPLC-UV and ICP-MS chromatogram of ApG incubated with cisplatin
20 30 40
20 30 40
Pt-GG
λmax=259.1
GG λmax=251.9
Pt-AG
λmax=261.7
AG λmax=253.7
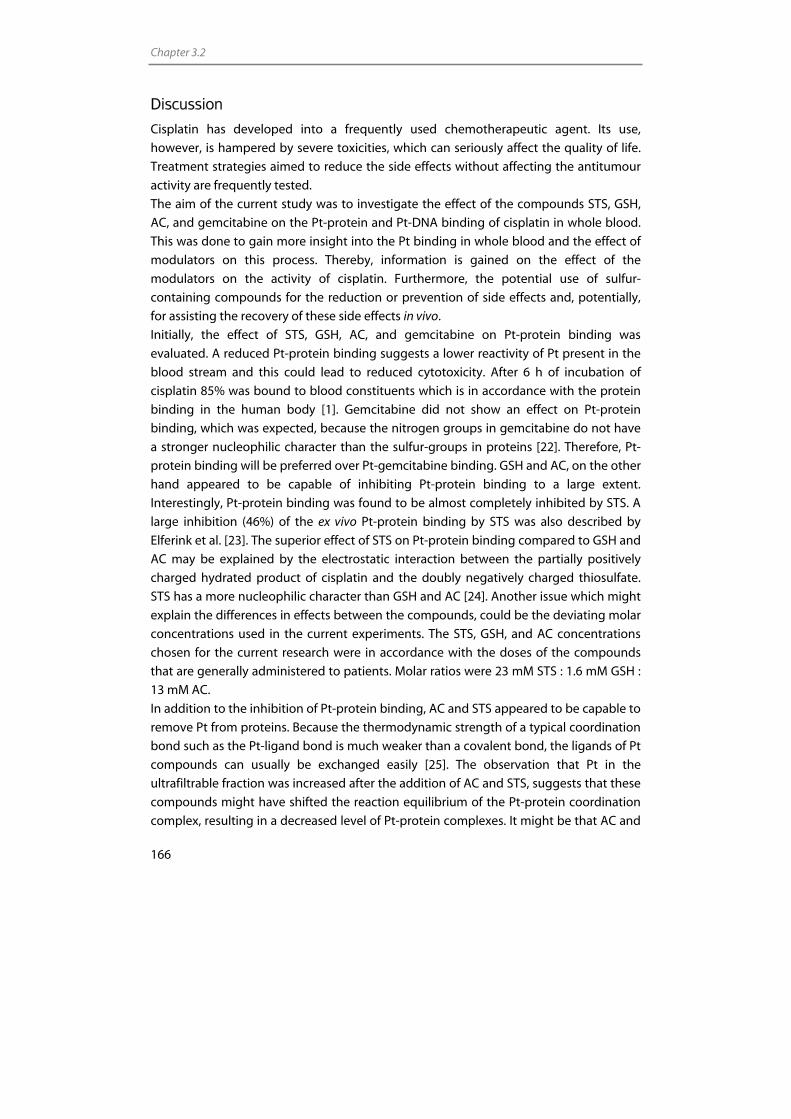
Chapter 3.2
166
Discussion
Cisplatin has developed into a frequently used chemotherapeutic agent. Its use,
however, is hampered by severe toxicities, which can seriously affect the quality of life.
Treatment strategies aimed to reduce the side effects without affecting the antitumour
activity are frequently tested.
The aim of the current study was to investigate the effect of the compounds STS, GSH,
AC, and gemcitabine on the Pt-protein and Pt-DNA binding of cisplatin in whole blood.
This was done to gain more insight into the Pt binding in whole blood and the effect of
modulators on this process. Thereby, information is gained on the effect of the
modulators on the activity of cisplatin. Furthermore, the potential use of sulfur-
containing compounds for the reduction or prevention of side effects and, potentially,
for assisting the recovery of these side effects in vivo.
Initially, the effect of STS, GSH, AC, and gemcitabine on Pt-protein binding was
evaluated. A reduced Pt-protein binding suggests a lower reactivity of Pt present in the
blood stream and this could lead to reduced cytotoxicity. After 6 h of incubation of
cisplatin 85% was bound to blood constituents which is in accordance with the protein
binding in the human body [1]. Gemcitabine did not show an effect on Pt-protein
binding, which was expected, because the nitrogen groups in gemcitabine do not have
a stronger nucleophilic character than the sulfur-groups in proteins [22]. Therefore, Pt-
protein binding will be preferred over Pt-gemcitabine binding. GSH and AC, on the other
hand appeared to be capable of inhibiting Pt-protein binding to a large extent.
Interestingly, Pt-protein binding was found to be almost completely inhibited by STS. A
large inhibition (46%) of the ex vivo Pt-protein binding by STS was also described by
Elferink et al. [23]. The superior effect of STS on Pt-protein binding compared to GSH and
AC may be explained by the electrostatic interaction between the partially positively
charged hydrated product of cisplatin and the doubly negatively charged thiosulfate.
STS has a more nucleophilic character than GSH and AC [24]. Another issue which might
explain the differences in effects between the compounds, could be the deviating molar
concentrations used in the current experiments. The STS, GSH, and AC concentrations
chosen for the current research were in accordance with the doses of the compounds
that are generally administered to patients. Molar ratios were 23 mM STS : 1.6 mM GSH :
13 mM AC.
In addition to the inhibition of Pt-protein binding, AC and STS appeared to be capable to
remove Pt from proteins. Because the thermodynamic strength of a typical coordination
bond such as the Pt-ligand bond is much weaker than a covalent bond, the ligands of Pt
compounds can usually be exchanged easily [25]. The observation that Pt in the
ultrafiltrable fraction was increased after the addition of AC and STS, suggests that these
compounds might have shifted the reaction equilibrium of the Pt-protein coordination
complex, resulting in a decreased level of Pt-protein complexes. It might be that AC and
Effect of antidotes on platinum binding
167
STS are stronger Lewis bases than most of the sulfur groups present in the proteins, or
that interactions of AC and STS with Pt are impeded less by sterical effects and are thus
thermodynamically more stable than the interactions of proteins with Pt. The possibility
to release Pt from proteins might result in an increased rate of elimination of Pt from the
body and in that way in a reduced toxicity [15]. The ability of STS to remove Pt from
proteins shown in the current study, however, is in contrast to an earlier ex vivo
investigation by Elferink et al., who mentioned that STS was not able to reverse Pt-
protein binding to a major extent [23]. Hence, before drawing definite conclusions from
the current results, the effect of sulfur-containing compounds on protein structures and
proteolysis should be investigated. If sulfur-containing compounds could affect the
tertiary protein structure, or when they could induce proteolysis, an increased amount of
bound Pt would be recovered in the ultrafiltrate.
The ultrafiltrable Pt fraction observed after incubation with sulfur-containing
compounds, was expected to contain smaller amounts of reactive Pt compared to the
samples without sulfur-containing compounds. A previous investigation showed a
decreased reactivity of the ultrafiltrable Pt in patients who received co-administration of
STS, indicating that the Pt-STS complex was not reactive [26]. The Pt reactivity in this
study was measured as the ability of ultrafiltrable Pt to bind to diethyldithiocarbamate.
Other investigations reported that the ultrafiltrable fraction after STS co-administration
contained significantly less unchanged cisplatin than without STS treatment [12,27].
Lower concentrations of reactive Pt can of course lead to lower toxicity.
In order to assess the reactivity of Pt present in the samples of the current research, we
investigated the Pt-DNA binding reactivity in PBMCs. Pretreatment of the samples with
gemcitabine appeared to slightly inhibit Pt-DNA binding. Currently, no explanation for
this interaction is known. No effect of gemcitabine on the protein level was observed
and the interaction with Pt is expected to occur intracellulary. The highly significant
effect as was observed by Crul et al. [13], however, was absent in the present
investigation. A reason for this inconsistency could be the difference in experimental
circumstances. Crul et al. evaluated the effect of gemcitabine on Pt-DNA binding in vivo,
whereas the current experiments were performed ex vivo. The Pt-DNA binding observed
for GSH and AC were respectively 18 and 80% lower than observed for cisplatin alone.
STS appeared to completely prevent Pt-DNA adduct binding. The inhibition of Pt-DNA
by the modulators is a relevant parameter for the reactivity of Pt and thus for the
potential to prevent toxicity. The current data suggest that all of the tested sulfur-
containing compounds may reduce toxicity and that STS is the most potent compound.
Concurrent administration of cisplatin with sulfur-containing compounds might affect
side effects, as well as efficacy. Therefore, dosing regimens and administration routes
should be selected carefully, as illustrated by the intra-arterially cisplatin treatment with
intravenously administered STS for the treatment of head and neck cancer [4].
Chapter 3.2
168
In addition to the ability of the modulators to prevent Pt-DNA binding, it was also
investigated whether the modulators could release Pt from the DNA. For STS, the
distribution of which is limited to the extracellular space [23], it is unlikely that it can
directly interact with the Pt-DNA adducts and thereby release Pt. AC, however, is able to
enter cells [28] and, thus, might be able to release Pt from the DNA. The current
experiments showed that, although, AC and STS completely inhibited further Pt-DNA
binding when they were administered 3 h after the start of cisplatin incubation, they
could hardly release Pt from the DNA. GSH also limited Pt-DNA binding, but did not
prevent it. These observations are in line with observations in previous investigations
which suggested that platinum species might migrate from S to N donor ligands [29,30],
implying that Pt-DNA bonds at GG sites are thermodynamically more stable than Pt-S
bonds.
These data imply that, to be protective, the time of administration of the compound is
relevant, because none of the compounds could obviously release Pt from the DNA. The
cytotoxic protective effect should be initiated before the binding of cisplatin to the DNA.
As mentioned before for STS, protection against nephrotoxicity was accomplished only
when STS was given within one hour before and 30 min after cisplatin administration
[31]. Furthermore, the observation that no Pt was released from the DNA, implies that
the tested compounds are probably not capable of reducing persistent toxicity.
In addition to the total amount of Pt-DNA adducts, the different adducts formed after
separation using HPLC were studied. Incubation with STS, GSH, AC, and gemcitabine did
not result in different adducts. Furthermore, the ratio of Pt-GG and Pt-AG remained
constant under all conditions. These results suggest that the DNA binding mode of
cisplatin is not modified by STS, GSH, AC, and gemcitabine.
In conclusion, the current study showed that the reactive Pt levels in whole blood are
reduced by STS, GSH, and AC after ex vivo incubation of whole blood with cisplatin. This
reduction was demonstrated by a reduced Pt-protein and Pt-DNA binding in the
presence of the sulfur-containing compounds. Consequently, STS, GSH, and AC could
prevent cisplatin induced side effects. It is, however, not expected that these
compounds might reduce persistent toxicities, because they were not able to release Pt
from the DNA to a large extent. Hence, a large activity of the compounds is only
expected when they are administered during or shortly after cisplatin treatment, which
may have a large impact on cytotoxicity. The minor effect of gemcitabine on Pt-DNA
binding needs to be evaluated further in future experiments. The ex vivo effects
observed in the current study are expected to be larger than the in vivo effects, because
the exposure time to the modulators will be shorter in vivo, due to elimination of the
compounds from the blood. This study, however, provides further insight into the
potential effects and use of STS, GSH, AC, and gemcitabine in patients treated with
cisplatin.
Effect of antidotes on platinum binding
169
References 1. Mandal R, Teixeira C, Li XF. Studies of cisplatin and hemoglobin interactions using nanospray mass
spectrometry and liquid chromatography with inductively-coupled plasma mass spectrometry. Analyst 2003; 128: 629-34.
2. Calvert H, Judson I, van der Vijgh WJ. Platinum complexes in cancer medicine: pharmacokinetics and pharmacodynamics in relation to toxicity and therapeutic activity. Cancer Surv 1993; 17: 189-217.
3. Graham MA, Lockwood GF, Greenslade D, Brienza S, Bayssas M, Gamelin E. Clinical pharmacokinetics of oxaliplatin: a critical review. Clin Cancer Res 2000; 6: 1205-18.
4. Hoebers FJ, Pluim D, Verheij M, Balm AJ, Bartelink H, Schellens JH, Begg AC. Prediction of treatment outcome by cisplatin-DNA adduct formation in patients with stage III/IV head and neck squamous cell carcinoma, treated by concurrent cisplatin-radiation (RADPLAT). Int J Cancer 2006; 119: 750-6.
5. Howell SB, Pfeifle CE, Wung WE, Olshen RA. Intraperitoneal cis-diamminedichloroplatinum with systemic thiosulfate protection. Cancer Res 1983; 43: 1426-31.
6. Markman M, Howell SB, Lucas WE, Pfeifle CE, Green MR. Combination intraperitoneal chemotherapy with cisplatin, cytarabine, and doxorubicin for refractory ovarian carcinoma and other malignancies principally confined to the peritoneal cavity. J Clin Oncol 1984; 2: 1321-6.
7. van Rijswijk RE, Hoekman K, Burger CW, Verheijen RH, Vermorken JB. Experience with intraperitoneal cisplatin and etoposide and i.v. sodium thiosulphate protection in ovarian cancer patients with either pathologically complete response or minimal residual disease. Ann Oncol 1997; 8: 1235-41.
8. Madasu R, Ruckenstein MJ, Leake F, Steere E, Robbins KT. Ototoxic effects of supradose cisplatin with sodium thiosulfate neutralization in patients with head and neck cancer. Arch Otolaryngol Head Neck Surg 1997; 123: 978-81.
9. Di Re F, Bohm S, Oriana S, Spatti GB, Zunino F. Efficacy and safety of high-dose cisplatin and cyclophosphamide with glutathione protection in the treatment of bulky advanced epithelial ovarian cancer. Cancer Chemother Pharmacol 1990; 25: 355-60.
10. Dickey DT, Wu YJ, Muldoon LL, Neuwelt EA. Protection against cisplatin-induced toxicities by N-acetylcysteine and sodium thiosulfate as assessed at the molecular, cellular, and in vivo levels. J Pharmacol Exp Ther 2005; 314: 1052-8.
11. Filipski J, Kohn KW, Prather R, Bonner WM. Thiourea reverses cross-links and restores biological activity in DNA treated with dichlorodiaminoplatinum (II). Science 1979; 204: 181-3.
12. Brouwers EEM, Huitema ADR, Beijnen JH, Schellens JHM. Long-term platinum retention after treatment with cisplatin and oxaliplatin. Submitted 2007.
13. Crul M, Schoemaker NE, Pluim D, Maliepaard M, Underberg RW, Schot M, Sparidans RW, Baas P, Beijnen JH, van Zandwijk N, Schellens JH. Randomized phase I clinical and pharmacologic study of weekly versus twice-weekly dose-intensive cisplatin and gemcitabine in patients with advanced non-small cell lung cancer. Clin Cancer Res 2003; 9: 3526-33.
14. Brouwers EEM, Tibben MM, Rosing H, Hillebrand MJX, Joerger M, Schellens JHM, Beijnen JH. Sensitive inductively coupled plasma mass spectrometry assay for the determination of platinum originating from cisplatin, carboplatin, and oxaliplatin in human plasma ultrafiltrate. J Mass Spectrom 2006; 41: 1186-94.
15. Leone R, Fracasso ME, Soresi E, Cimino G, Tedeschi M, Castoldi D, Monzani V, Colombi L, Usari T, Bernareggi A. Influence of glutathione administration on the disposition of free and total platinum in patients after administration of cisplatin. Cancer Chemother Pharmacol 1992; 29: 385-90.
16. Prescott LF, Donovan JW, Jarvie DR, Proudfoot AT. The disposition and kinetics of intravenous N-acetylcysteine in patients with paracetamol overdosage. Eur J Clin Pharmacol 1989; 37: 501-6.
17. Siegel-Lakhai WS, Crul M, Zhang S, Sparidans RW, Pluim D, Howes A, Solanki B, Beijnen JH, Schellens JH. Phase I and pharmacological study of the farnesyltransferase inhibitor tipifarnib (Zarnestra, R115777) in combination with gemcitabine and cisplatin in patients with advanced solid tumours. Br J Cancer 2005; 93: 1222-9.
18. Rademaker-Lakhai JM, Crul M, Pluim D, Sparidans RW, Baas P, Beijnen JH, van Zandwijk N, Schellens JH. Phase I clinical and pharmacologic study of a 2-weekly administration of cisplatin and gemcitabine in patients with advanced non-small cell lung cancer. Anticancer Drugs 2005; 16: 1029-36.
19. Pluim D, Maliepaard M, van Waardenburg RC, Beijnen JH, Schellens JHM. 32P-postlabeling assay for the quantification of the major platinum-DNA adducts. Anal Biochem 1999; 275: 30-8.
Chapter 3.2
170
20. Ma J, Verweij J, Planting AS, Boer-Dennert M, van Ingen HE, van der Burg ME, Stoter G, Schellens JH. Current sample handling methods for measurement of platinum-DNA adducts in leucocytes in man lead to discrepant results in DNA adduct levels and DNA repair. Br J Cancer 1995; 71: 512-7.
21. Hann S, Zenker A, Galanski M, Bereuter TL, Stingeder G, Keppler BK. HPIC-UV-ICP-SFMS study of the interaction of cisplatin with guanosine monophosphate. Fresenius J Anal Chem 2001; 370: 581-6.
22. Hay RW, Porter DS. The reaction of sulphur and nitrogen nucleophiles with [Pt(dien)Cl]+. Transition Met Chem 1999; 24: 186-8.
23. Elferink F, van der Vijgh WJ, Klein I, Pinedo HM. Interaction of cisplatin and carboplatin with sodium thiosulfate: reaction rates and protein binding. Clin Chem 1986; 32: 641-5.
24. Videhult P, Laurell G, Wallin I, Ehrsson H. Kinetics of Cisplatin and its monohydrated complex with sulfur-containing compounds designed for local otoprotective administration. Exp Biol Med (Maywood ) 2006; 231: 1638-45.
25. Reedijk J. New clues for platinum antitumor chemistry: kinetically controlled metal binding to DNA. Proc Natl Acad Sci U S A 2003; 100: 3611-6.
26. Goel R, Cleary SM, Horton C, Kirmani S, Abramson I, Kelly C, Howell SB. Effect of sodium thiosulfate on the pharmacokinetics and toxicity of cisplatin. J Natl Cancer Inst 1989; 81: 1552-60.
27. Nagai N, Hotta K, Yamamura H, Ogata H. Effects of sodium thiosulfate on the pharmacokinetics of unchanged cisplatin and on the distribution of platinum species in rat kidney: protective mechanism against cisplatin nephrotoxicity. Cancer Chemother Pharmacol 1995; 36: 404-10.
28. McLellan LI, Lewis AD, Hall DJ, Ansell JD, Wolf CR. Uptake and distribution of N-acetylcysteine in mice: tissue-specific effects on glutathione concentrations. Carcinogenesis 1995; 16: 2099-106.
29. Reedijk J. Why does Cisplatin reach Guanine-N7 with competing S-donor ligands available in the cell? Chem Rev 1999; 99: 2499-510.
30. Chen Y, Guo ZD, Murdoch PD, Zang EL, Sadler PJ. Interconversion between S- and N-bound L-methionine adducts of Pt(dien)2+ (dien=diethylenetriamine) via dien ring-opened intermediates. J Chem Soc , Dalton Trans 1998; 1503-8.
31. Gandara DR, Wiebe VJ, Perez EA, Makuch RW, DeGregorio MW. Cisplatin rescue therapy: experience with sodium thiosulfate, WR2721, and diethyldithiocarbamate. Crit Rev Oncol Hematol 1990; 10: 353-65.


Chapter 4 Persistent effects of
platinum agents

Chapter 4.1
Long-term platinum retention after treatment with cisplatin and oxaliplatin
Elke E.M. Brouwers Alwin D.R. Huitema
Jos H. Beijnen Jan H.M. Schellens
Submitted for publication
Chapter 4.1
176
Abstract
The purpose of this study was to evaluate long-term platinum (Pt) retention in patients
previously treated with oxaliplatin and cisplatin. Forty-five patients, treated 8-75 months
before participating in this study, were included. Pt levels in plasma and plasma
ultrafiltrate (pUF) were determined using a highly sensitive inductively coupled plasma
mass spectrometry method. In addition, the reactivity of Pt species recovered in pUF was
evaluated. Relationships between long-term Pt retention and possible determinants
were evaluated using non linear mixed effects modeling.
Pt plasma concentrations ranged between 142-2.99x10³ ng/L. On average 15% and 24%
of plasma Pt was recovered in pUF for cisplatin and oxaliplatin, respectively. No Pt-DNA
adducts in peripheral blood mononuclear cells (PBMCs) could be detected. Ex vivo
incubation of DNA with pUF of patients revealed that up to 10% of the reactivity of Pt
species in patients pUF was retained. Protein binding was shown to proceed during
sample storage. Sodium thiosulfate (STS) appeared to be capable of releasing Pt from
the plasma proteins, suggesting that protein binding was not irreversible. Pt levels were
related to follow-up time, age, cumulative dose, co-administration of STS with intra-
arterial cisplatin administration, and glomerular filtration rates before start of
chemotherapy. No relationship between glutathione S-transferase genotypes and Pt
levels was observed.
In conclusion, our data suggest that plasma Pt levels are related to follow-up time, age,
cumulative dose, GFR at time of treatment, and STS use. Pt levels in plasma, most
probably, represent Pt eliminated from regenerating tissue. Although no Pt-DNA
adducts could be detected in PBMCs, it was shown that Pt species in pUF were still
present in a reactive form. The clinical consequences of the observed reactivity remain
to be established.
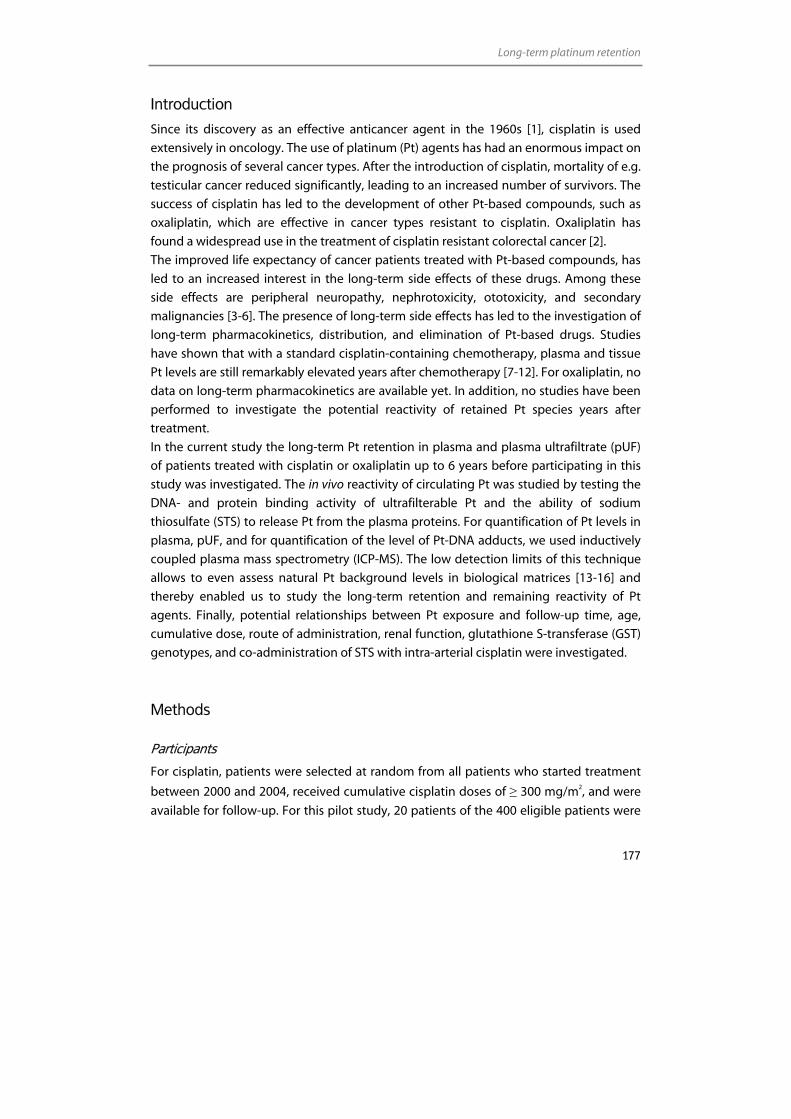
Long-term platinum retention
177
Introduction
Since its discovery as an effective anticancer agent in the 1960s [1], cisplatin is used
extensively in oncology. The use of platinum (Pt) agents has had an enormous impact on
the prognosis of several cancer types. After the introduction of cisplatin, mortality of e.g.
testicular cancer reduced significantly, leading to an increased number of survivors. The
success of cisplatin has led to the development of other Pt-based compounds, such as
oxaliplatin, which are effective in cancer types resistant to cisplatin. Oxaliplatin has
found a widespread use in the treatment of cisplatin resistant colorectal cancer [2].
The improved life expectancy of cancer patients treated with Pt-based compounds, has
led to an increased interest in the long-term side effects of these drugs. Among these
side effects are peripheral neuropathy, nephrotoxicity, ototoxicity, and secondary
malignancies [3-6]. The presence of long-term side effects has led to the investigation of
long-term pharmacokinetics, distribution, and elimination of Pt-based drugs. Studies
have shown that with a standard cisplatin-containing chemotherapy, plasma and tissue
Pt levels are still remarkably elevated years after chemotherapy [7-12]. For oxaliplatin, no
data on long-term pharmacokinetics are available yet. In addition, no studies have been
performed to investigate the potential reactivity of retained Pt species years after
treatment.
In the current study the long-term Pt retention in plasma and plasma ultrafiltrate (pUF)
of patients treated with cisplatin or oxaliplatin up to 6 years before participating in this
study was investigated. The in vivo reactivity of circulating Pt was studied by testing the
DNA- and protein binding activity of ultrafilterable Pt and the ability of sodium
thiosulfate (STS) to release Pt from the plasma proteins. For quantification of Pt levels in
plasma, pUF, and for quantification of the level of Pt-DNA adducts, we used inductively
coupled plasma mass spectrometry (ICP-MS). The low detection limits of this technique
allows to even assess natural Pt background levels in biological matrices [13-16] and
thereby enabled us to study the long-term retention and remaining reactivity of Pt
agents. Finally, potential relationships between Pt exposure and follow-up time, age,
cumulative dose, route of administration, renal function, glutathione S-transferase (GST)
genotypes, and co-administration of STS with intra-arterial cisplatin were investigated.
Methods
Participants
For cisplatin, patients were selected at random from all patients who started treatment
between 2000 and 2004, received cumulative cisplatin doses of ≥ 300 mg/m2, and were
available for follow-up. For this pilot study, 20 patients of the 400 eligible patients were
Chapter 4.1
178
included. To select the patients, random selections were performed on the 400 eligible
patients until 20 patients agreed to participate in the study. SPSS (SPSSinc, version 11.0,
Chicago, IL, USA) was used for random sample selection. For oxaliplatin, all available
patients who started treatment between 2000 and 2005 and received cumulative
oxaliplatin doses of ≥ 600 mg/m2 were approached for participation in the current study.
This led to an inclusion of 25 patients. The Medical Ethics Committee of the hospital
approved the study protocol and all patients gave their written informed consent.
Additionally, we included 20 cancer patients who were not treated with cisplatin and 20
normal volunteers, both as a control for Pt background levels in plasma.
Blood sampling
Whole blood samples for Pt analysis were collected in 10 mL edta-containing tubes
(Becton Dickinson Vacutainer Systems, Plymouth, UK). Plasma was obtained by
centrifuging the whole blood samples for 15 min (1,000 g, 4 °C). Plasma ultrafiltrate was
obtained by centrifuging the plasma fraction through 3 and 30 kDa cut-off ultrafiltrate
filter (Centriplus Millipore Corporation, Bedford, MA, USA) for 30 min (1,000 g, 20 °C). The
fraction containing peripheral blood mononuclear cells (PBMCs) was isolated from the
whole blood sample using the method described by Pluim et al [17].
Additionally, from each patient, 5 ml blood samples were obtained for genetic analysis.
Lymphocyte DNA was isolated according to the method of Boom [18]. All samples were
stored at –20 °C until analysis.
Determination of Pt levels
Pt analyses were performed using an ICP-quadrupole-MS (Varian 810-MS, Varian,
Mulgrave, Victoria, Australia) and a validated method described previously [19]. The Pt
isotope used for calculation of the validation parameters was 194Pt. 191Ir (Merck,
Darmstadt, Germany) was used for internal standardisation. From patient samples, Pt
levels were assessed in plasma, pUF, and bound to DNA in PBMCs. Plasma samples were
diluted in a 0.01% (g/v) edta diammonium salt (Merck) and 0.01% (g/v) Triton-X solution
(Sigma-Aldrich, St. Louis, MO, USA) in water. PUF samples were diluted using a 1% (v/v)
nitric acid (HNO3) solution in water (Mallinckrodt Baker, Philipsburg, NJ, USA). DNA was
isolated from PBMCs using a method described by Pluim et al [17]. Following isolation,
the DNA content was determined after dilution in 10 mM Tris-HCl pH 8 by measuring the
absorbance at 260 nm using a Biophotometer (Eppendorf, Hamburg, Germany). The
purity of the DNA was checked by measurement of the absorbance ratio at 260 and 280
nm. Ratios between 1.8 and 2.0 were routinely obtained. Before ICP-MS analysis, the
DNA was hydrolysed for 24 h in 1% (v/v) HNO3 solution at 70 °C. The limit of
Long-term platinum retention
179
quantification (LLOQ) of the method was 20 ng/L for plasma, 7.5 ng/L for pUF, and the
absolute sensitivity for Pt bound to DNA was 0.75 pg Pt (7.5 fg Pt per µg DNA when
using 100 µg DNA). The LLOQs were determined on the basis of five times the noise in
blank matrix solutions. The noise was assessed by analysing different batches of control
plasma and pUF. The accuracies at the LLOQ levels were between 80-120%, whereas the
precisions were lower than 20% [19].
All dilutions were prepared using plastic pipettes (Falcon, Becton Dickinson Labware,
Franklin Lakes, NJ, USA) and polypropylene tubes of 10 mL (Plastiques-Gosselin,
Hazebrouck Cedex, France) and 30 mL (Sarstedt AG&Co, Nümbrecht, Germany), which
were all evaluated thoroughly for Pt contamination prior to method development [19].
Ex vivo assessment of DNA binding activity of Pt in pUF
PUF samples (500 µL) of two cisplatin and two oxaliplatin treated patients, which
contained relatively high Pt concentrations, were incubated with 500 µg of calf thymus
DNA (Sigma-Aldrich). Additionally, pUF from normal volunteers was incubated with 500
µg of calf thymus DNA and cisplatin or oxaliplatin with Pt concentrations equivalent to
the investigated patients samples. The latter was done to assess the binding capacity of
the parent compounds at concentrations in the same range as the patients samples.
After a five-day incubation at 37 °C to achieve a maximal Pt-DNA binding, the DNA was
precipitated using 100% ethanol (Biosolve, Valkenswaard, the Netherlands) followed by
two wash steps with 75% ethanol to remove unbound Pt. The DNA was then dissolved in
water. After determination of the DNA concentrations, the DNA samples were
hydrolysed at 70 °C for 24 h in 1% HNO3 and Pt-DNA binding was analysed.
Ex vivo assessment of protein binding capacity of Pt in pUF
To assess the protein binding capacity of Pt present in pUF, pUF (30 kDa) was prepared
for four cisplatin and oxaliplatin plasma samples after storage at -30 °C for 144-278 days.
Samples contained Pt concentrations in the low, mid, and high region. Pt concentrations
analysed in pUF prepared after storage were compared to Pt concentrations analysed in
pUF which was prepared immediately after blood sampling. Additionally, plasma
samples were reanalysed to assess whether Pt concentrations in plasma were reduced
during storage due to adsorption to the tubes.
Ex vivo activity of STS
Four plasma samples for both cisplatin and oxaliplatin were used to investigate the
ability of STS to remove Pt from proteins. Therefore, 750 µL of plasma were incubated
Chapter 4.1
180
with 25 µL of a 250 g/L STS solution (Hospital Pharmacy of Haarlem, Haarlem, the
Netherlands). As control, 750 µL of plasma were incubated with 25 µL of water. After
incubation, pUF was prepared (30 kDa) and Pt concentrations of the STS incubated
samples and control samples were compared. Protein concentrations in the ultrafiltrates
were analysed using a 2-D Quant Kit (GE healthcare Bio-Sciences AB, Uppsala, Sweden).
In contrast to other methods to assess protein concentrations, this method uses protein
precipitation to avoid interference of reducing agents such as STS.
Genotyping
Polymorphisms in the genes encoding the enzymes GSTM1, GSTT1, and GSTP1 were
determined. In GSTT1 and GSTM1, known inherited homozygous deletions are
equivalent to nonfunctional enzymes [20]. In the GSTP1 gene, a functional SNP between
adenosine (A) and guanosine (G) at base pair 313 leads to the expression of either Ile or
Val at codon 105. This polymorphism significantly affects enzyme activity [21].
PCR amplifications were performed in 50 µL reactions with ~100 ng of genomic DNA,
200 µM dNTPs (Epicentre Technologies, Madison, WI, USA), 10 x PCR Buffer II (Applied
Biosystems, Foster City, CA, USA), magnesium chloride (MgCl2), 0.5-1 U AmpliTaq Gold
(Applied Biosystems), and forward and reverse primers (Metabion, Planegg-Martinsried,
Germany). GSTM1 and GSTT1 deletions were analysed using a gel electrophoresis
method with β-globulin as internal control as described by Sreelekha et al [22]. GSTP1
(exon 5) was genotyped according to Jerónimo et al [23].
Clinical parameters
Information regarding cumulative cisplatin and oxaliplatin dose, follow-up time (time
from end of Pt therapy until inclusion in the current study), route of Pt administration,
co-administration of STS, and serum creatinine before start of chemotherapy were
collected from patient files. Additionally, serum creatinine was assessed at the time of
study.
Statistical analyses
Differences between Pt levels of cisplatin and oxaliplatin treated patients, control cancer
patients, and normal controls were evaluated using the Mann-Whitney U test. The
Wilcoxon signed rank test was used to test the difference between the renal function at
the time of chemotherapy and at follow-up. Correlations between plasma and pUF levels
of Pt treated patients were evaluated by using the Pearson correlation coefficient.
Long-term platinum retention
181
Determination of the Mann-Whitney U test, Wilcoxon signed rank test, and calculation of
the Pearson correlation coefficient were performed using SPSS. Possible relationships
between determinants and Pt levels were evaluated using non-linear mixed effects
modeling using NONMEM software (Version V1) (GloboMax LLC, Ellicott city, MD, USA).
The first order conditional estimation method was used throughout. It was assumed
that, due to the long follow-up, the treatment period was negligible compared to the
follow-up time. The significance of established relationships was assessed using the
likelihood ratio test.
Results
Participants
Table 1 summarises the characteristics of the participants. Participants were treated with
cisplatin for diverse tumour types, whereas all patients treated with oxaliplatin were
diagnosed with colorectal cancer. Five participants were treated with STS in
combination with 600 mg/m2 intra-arterially administered cisplatin. The range in the
follow-up time of patients was between 8 and 75 months.
Pt levels
Figure 1 shows Pt levels in plasma of 20 normal controls, 20 cancer control patients, 20
cisplatin treated cancer patients treated 18-75 months before entering this study, and 25
oxaliplatin treated cancer patients treated 8-33 months before entering this study.
Moreover, pUF levels from Pt treated patients are shown. All plasma and pUF samples of
the Pt treated patients were above the LLOQ of the method (plasma: 142-2.99x10³ ng/L
median 647ng/L, pUF: 15.3-565 ng/L,, median 157 ng/L), whereas only three plasma
samples of control patients exceeded the LLOQ (plasma: <LLOQ-55.6 ng/L) (Figure 1).
For the cancer control patients, the signals of eight of the 20 samples were more than
three-fold higher than the noise. For the normal control patients, signals of two of the 20
samples were more than three-fold higher than the noise (Figure 1). Pt concentrations in
plasma of Pt treated patients were significantly higher than those in control patients
(Mann-Whitney U test, p<0.0001). Pt levels in pUF were highly correlated to levels in
plasma. The Pearson correlation coefficients were 0.97 and 0.95 for cisplatin and
oxaliplatin respectively. For cisplatin, on average 14.8% of plasma Pt was recovered in
pUF. This percentage was 24.2% for oxaliplatin. The percentage of Pt in pUF was not
dependent on the amount of plasma Pt. No difference was observed between 3 and 30
kDa filters. The levels of Pt-DNA adducts in PBMCs were below the LLOQ in all samples.
For nine of the 45 samples, Pt signals were higher than three-fold the noise signal.
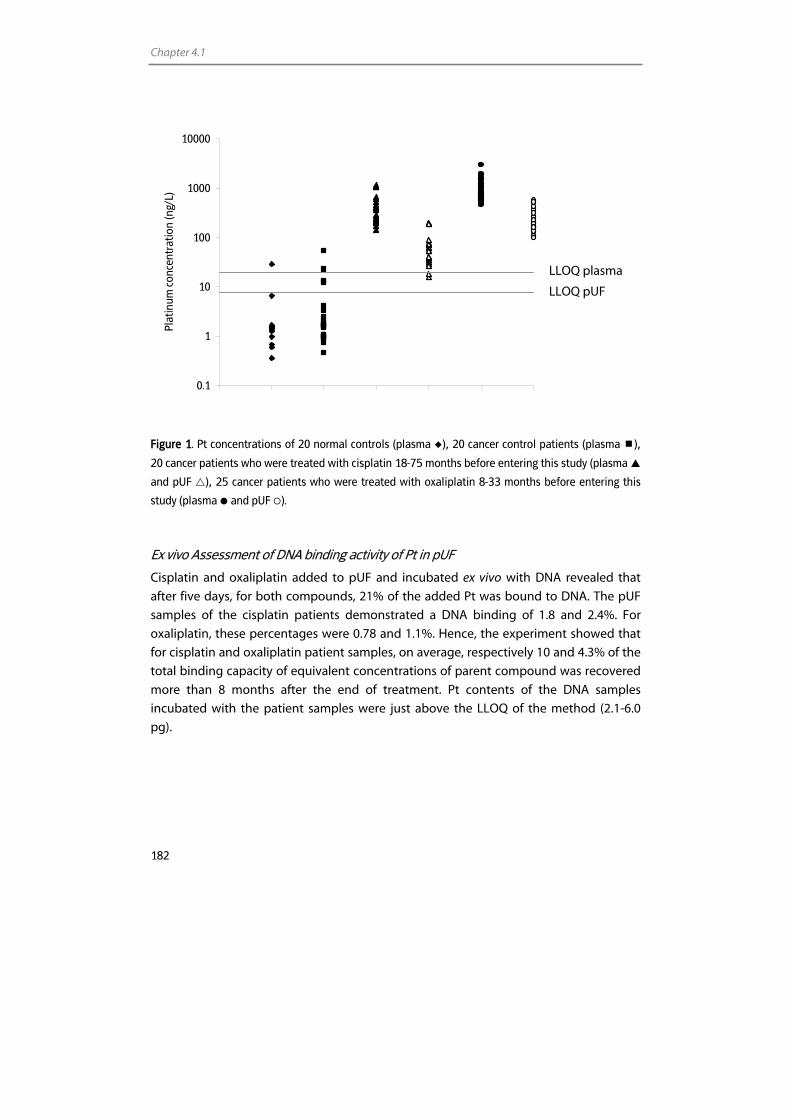
Chapter 4.1
182
0.1
1
10
100
1000
10000
Plat
inum
con
cent
ratio
n (n
g/L)
Figure 1. Pt concentrations of 20 normal controls (plasma ), 20 cancer control patients (plasma ),
20 cancer patients who were treated with cisplatin 18-75 months before entering this study (plasma
and pUF ), 25 cancer patients who were treated with oxaliplatin 8-33 months before entering this
study (plasma and pUF ).
Ex vivo Assessment of DNA binding activity of Pt in pUF
Cisplatin and oxaliplatin added to pUF and incubated ex vivo with DNA revealed that
after five days, for both compounds, 21% of the added Pt was bound to DNA. The pUF
samples of the cisplatin patients demonstrated a DNA binding of 1.8 and 2.4%. For
oxaliplatin, these percentages were 0.78 and 1.1%. Hence, the experiment showed that
for cisplatin and oxaliplatin patient samples, on average, respectively 10 and 4.3% of the
total binding capacity of equivalent concentrations of parent compound was recovered
more than 8 months after the end of treatment. Pt contents of the DNA samples
incubated with the patient samples were just above the LLOQ of the method (2.1-6.0
pg).
LLOQ plasma
LLOQ pUF
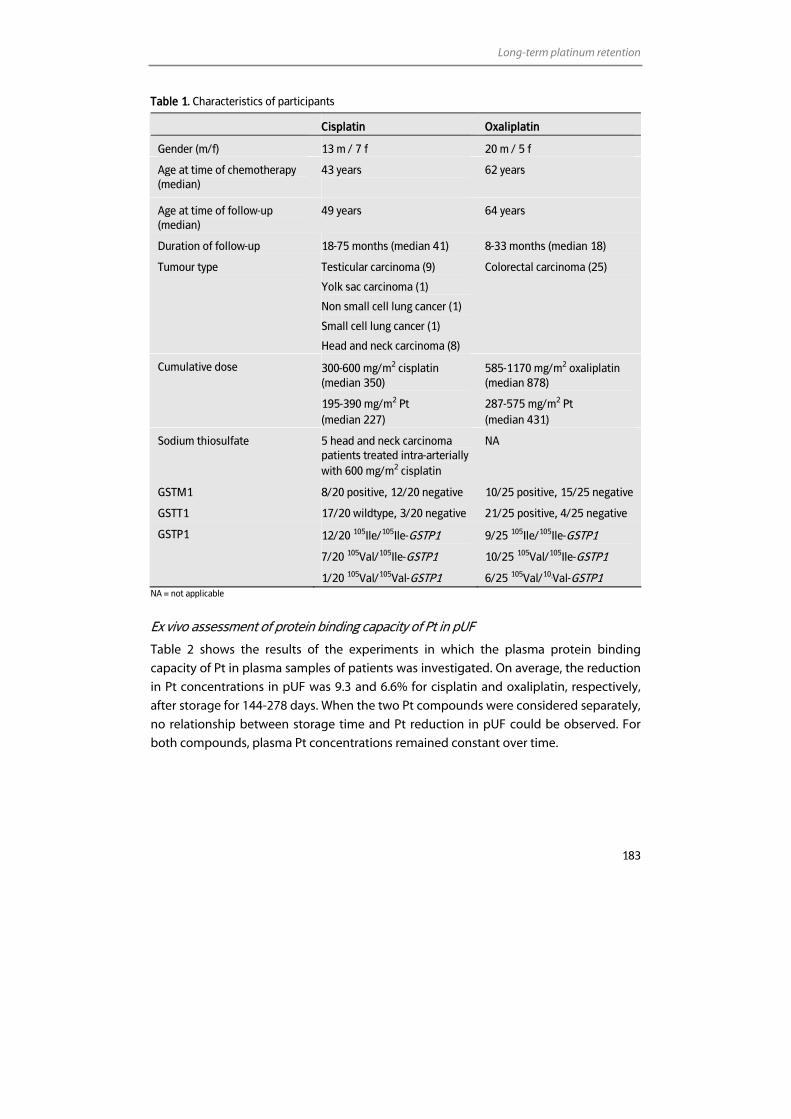
Long-term platinum retention
183
Table 1. Characteristics of participants
Cisplatin Oxaliplatin
Gender (m/f) 13 m / 7 f 20 m / 5 f
Age at time of chemotherapy (median)
43 years
62 years
Age at time of follow-up (median)
49 years 64 years
Duration of follow-up 18-75 months (median 41) 8-33 months (median 18)
Tumour type Testicular carcinoma (9)
Yolk sac carcinoma (1)
Non small cell lung cancer (1)
Small cell lung cancer (1)
Head and neck carcinoma (8)
Colorectal carcinoma (25)
Cumulative dose 300-600 mg/m2 cisplatin (median 350)
195-390 mg/m2 Pt (median 227)
585-1170 mg/m2 oxaliplatin (median 878)
287-575 mg/m2 Pt (median 431)
Sodium thiosulfate 5 head and neck carcinoma patients treated intra-arterially with 600 mg/m2 cisplatin
NA
GSTM1 8/20 positive, 12/20 negative 10/25 positive, 15/25 negative
GSTT1 17/20 wildtype, 3/20 negative 21/25 positive, 4/25 negative
GSTP1 12/20 105Ile/105Ile-GSTP1
7/20 105Val/105Ile-GSTP1
1/20 105Val/105Val-GSTP1
9/25 105Ile/105Ile-GSTP1
10/25 105Val/105Ile-GSTP1
6/25 105Val/105Val-GSTP1
NA = not applicable
Ex vivo assessment of protein binding capacity of Pt in pUF
Table 2 shows the results of the experiments in which the plasma protein binding
capacity of Pt in plasma samples of patients was investigated. On average, the reduction
in Pt concentrations in pUF was 9.3 and 6.6% for cisplatin and oxaliplatin, respectively,
after storage for 144-278 days. When the two Pt compounds were considered separately,
no relationship between storage time and Pt reduction in pUF could be observed. For
both compounds, plasma Pt concentrations remained constant over time.
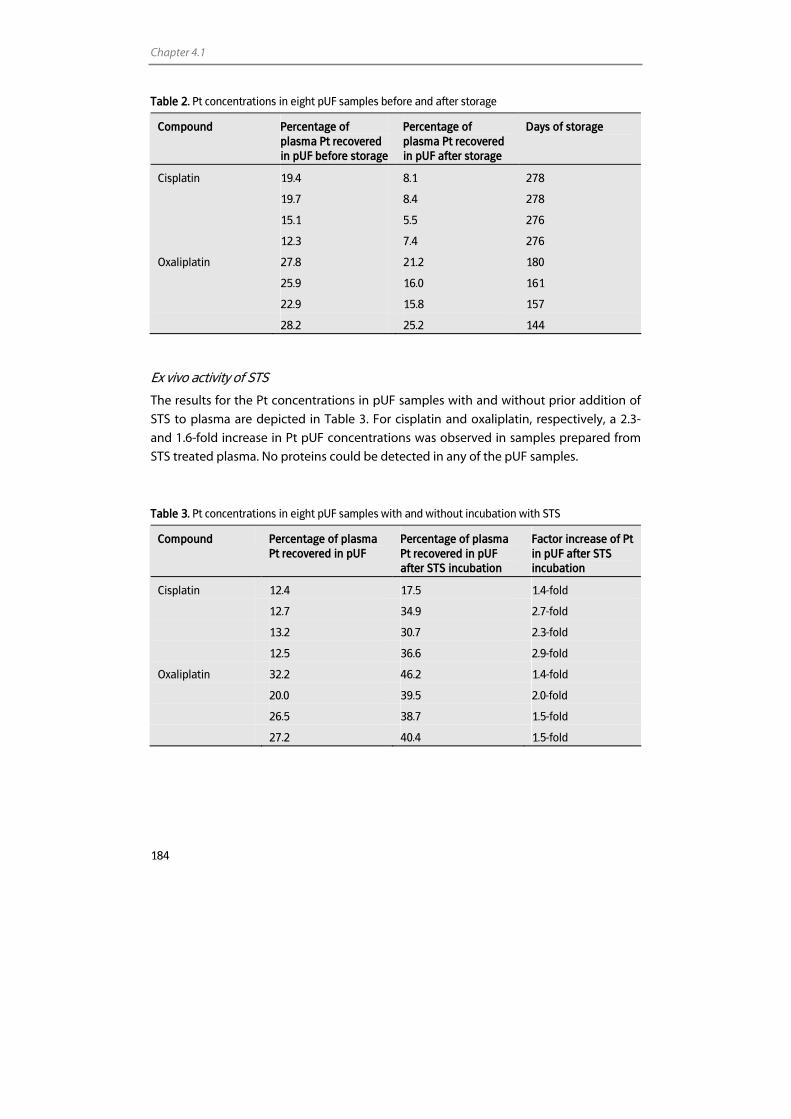
Chapter 4.1
184
Table 2. Pt concentrations in eight pUF samples before and after storage
Compound Percentage of plasma Pt recovered in pUF before storage
Percentage of plasma Pt recovered in pUF after storage
Days of storage
Cisplatin 19.4 8.1 278
19.7 8.4 278
15.1 5.5 276
12.3 7.4 276
Oxaliplatin 27.8 21.2 180
25.9 16.0 161
22.9 15.8 157
28.2 25.2 144
Ex vivo activity of STS
The results for the Pt concentrations in pUF samples with and without prior addition of
STS to plasma are depicted in Table 3. For cisplatin and oxaliplatin, respectively, a 2.3-
and 1.6-fold increase in Pt pUF concentrations was observed in samples prepared from
STS treated plasma. No proteins could be detected in any of the pUF samples.
Table 3. Pt concentrations in eight pUF samples with and without incubation with STS
Compound Percentage of plasma Pt recovered in pUF
Percentage of plasma Pt recovered in pUF after STS incubation
Factor increase of Pt in pUF after STS incubation
Cisplatin 12.4 17.5 1.4-fold
12.7 34.9 2.7-fold
13.2 30.7 2.3-fold
12.5 36.6 2.9-fold
Oxaliplatin 32.2 46.2 1.4-fold
20.0 39.5 2.0-fold
26.5 38.7 1.5-fold
27.2 40.4 1.5-fold
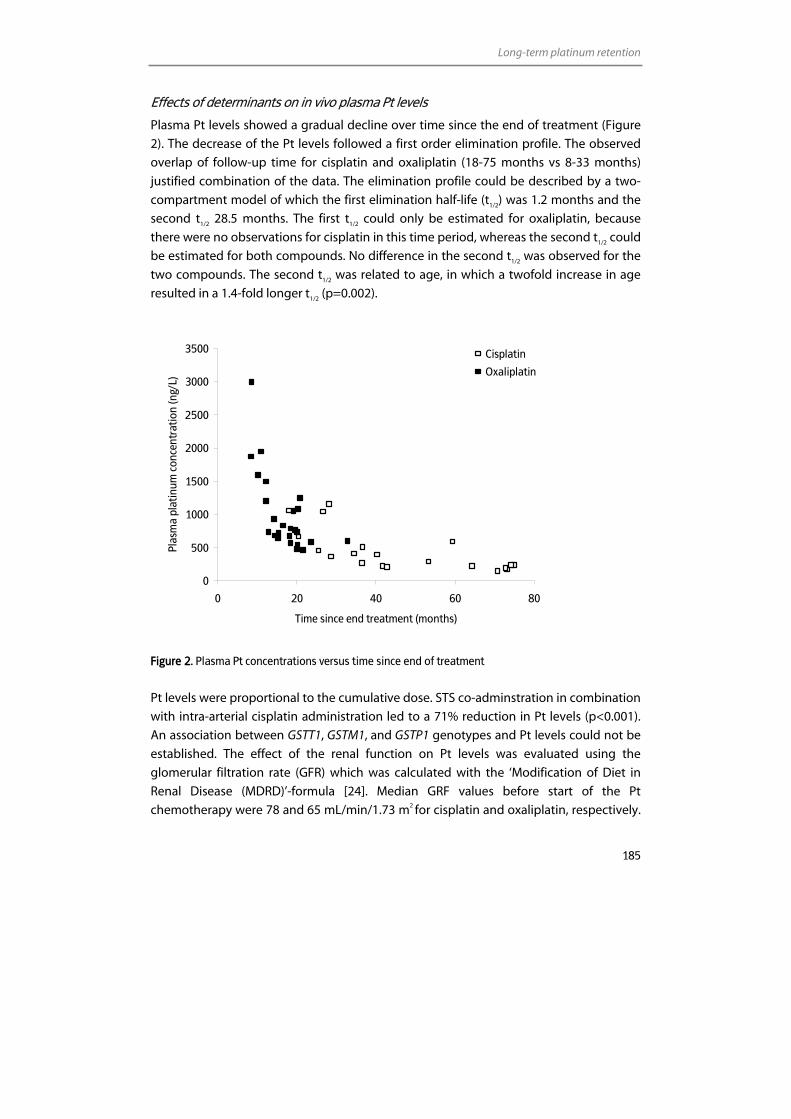
Long-term platinum retention
185
Effects of determinants on in vivo plasma Pt levels
Plasma Pt levels showed a gradual decline over time since the end of treatment (Figure
2). The decrease of the Pt levels followed a first order elimination profile. The observed
overlap of follow-up time for cisplatin and oxaliplatin (18-75 months vs 8-33 months)
justified combination of the data. The elimination profile could be described by a two-
compartment model of which the first elimination half-life (t1/2) was 1.2 months and the
second t1/2 28.5 months. The first t1/2 could only be estimated for oxaliplatin, because
there were no observations for cisplatin in this time period, whereas the second t1/2 could
be estimated for both compounds. No difference in the second t1/2 was observed for the
two compounds. The second t1/2 was related to age, in which a twofold increase in age
resulted in a 1.4-fold longer t1/2 (p=0.002).
0
500
1000
1500
2000
2500
3000
3500
0 20 40 60 80
Time since end treatment (months)
Plas
ma
plat
inum
con
cent
ratio
n (n
g/L)
Cisplatin
Oxaliplatin
Figure 2. Plasma Pt concentrations versus time since end of treatment
Pt levels were proportional to the cumulative dose. STS co-adminstration in combination
with intra-arterial cisplatin administration led to a 71% reduction in Pt levels (p<0.001).
An association between GSTT1, GSTM1, and GSTP1 genotypes and Pt levels could not be
established. The effect of the renal function on Pt levels was evaluated using the
glomerular filtration rate (GFR) which was calculated with the ‘Modification of Diet in
Renal Disease (MDRD)’-formula [24]. Median GRF values before start of the Pt
chemotherapy were 78 and 65 mL/min/1.73 m2 for cisplatin and oxaliplatin, respectively.
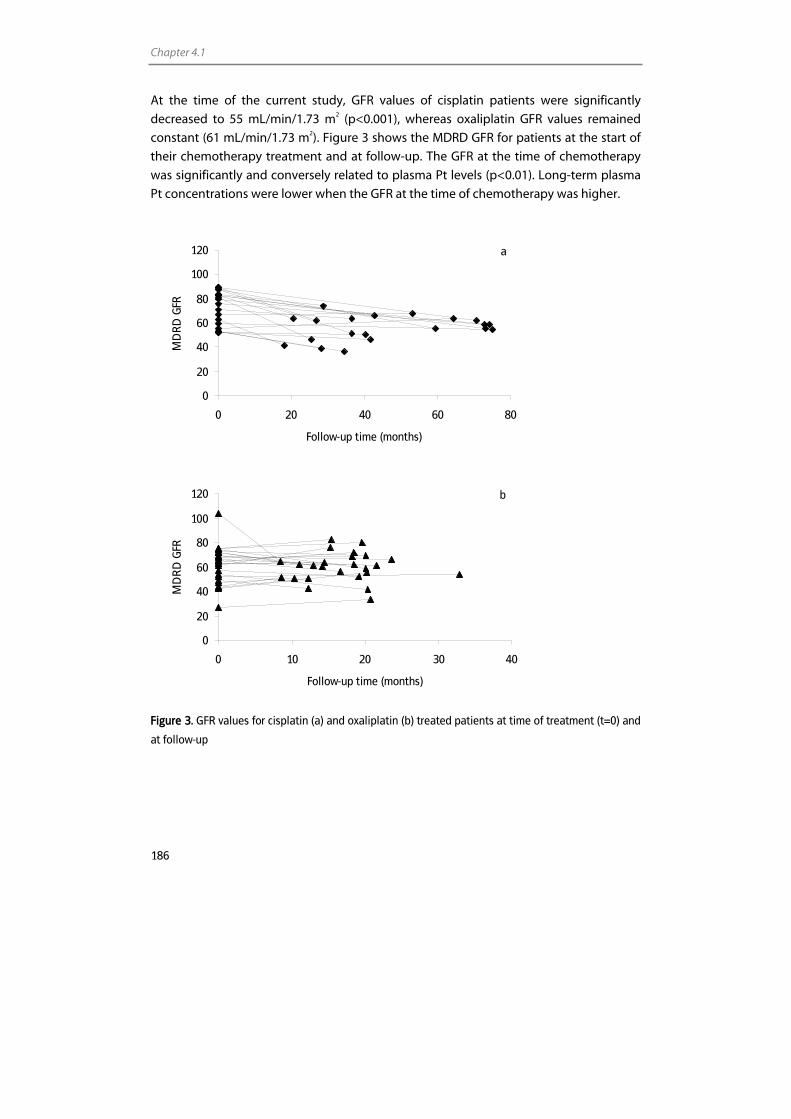
Chapter 4.1
186
At the time of the current study, GFR values of cisplatin patients were significantly
decreased to 55 mL/min/1.73 m2 (p<0.001), whereas oxaliplatin GFR values remained
constant (61 mL/min/1.73 m2). Figure 3 shows the MDRD GFR for patients at the start of
their chemotherapy treatment and at follow-up. The GFR at the time of chemotherapy
was significantly and conversely related to plasma Pt levels (p<0.01). Long-term plasma
Pt concentrations were lower when the GFR at the time of chemotherapy was higher.
0
20
40
60
80
100
120
0 20 40 60 80
Follow-up time (months)
MD
RD
GFR
a
0
20
40
60
80
100
120
0 10 20 30 40
Follow-up time (months)
MD
RD
GFR
b
Figure 3. GFR values for cisplatin (a) and oxaliplatin (b) treated patients at time of treatment (t=0) and
at follow-up
Long-term platinum retention
187
Discussion
Since the discovery of the antineoplastic effects of Pt-based compounds, cisplatin and
later oxaliplatin have developed into commonly used anticancer agents. The increased
survival of patients treated with these agents and the associated long-term side effects,
have initiated the investigation of the long-term pharmacokinetics, distribution, and
elimination of Pt-based compounds.
The current study focussed on the long-term pharmacokinetics of cisplatin and
oxaliplatin in plasma and pUF. We showed that plasma Pt levels of patients, treated with
cisplatin or oxaliplatin 8 to 75 months before participating in the current study, were still
>30-fold higher than the mean level of unexposed controls (normal volunteers and
cancer patients not treated with Pt). In earlier studies, raised plasma or serum Pt levels
one to 240 months after treatment with cisplatin were also reported [7,8,10,11].
In addition to elevated plasma Pt levels, the ultrafiltrable fraction of the plasma also
contained Pt species. This has not been reported before. The fraction of plasma Pt
recovered in the pUF was higher for oxaliplatin than for cisplatin, which could be a result
of a higher reactivity of cisplatin and hence, a more extensive protein binding of
cisplatin. Because pUF is generally considered to contain the pharmacologically active Pt
fraction [25], the question arises as to whether ultrafiltrable Pt measured up to 75
months after chemotherapy is composed exclusively of inactive Pt bound to low-
molecular-weight proteins, protein fragments, amino acids, and other molecules smaller
than 3 kDa, or whether it might also contain bound or unbound Pt with retained
reactivity. Because ICP-MS can not distinguish between unchanged cisplatin/oxaliplatin
and its metabolites or adducts, no information on the composition of the Pt species in
the pUF samples could be obtained. Unfortunately, up to now, no other technique is
sensitive enough to elucidate the chemical composition of the pool of Pt metabolites
and adducts that are probably present in the pUF samples.
Therefore, to address the question whether the Pt present in the pUF samples was still
reactive, we attempted to assess the Pt-DNA binding activity in vivo and ex vivo.
Although we were not able to quantify Pt-DNA adduct levels in PBMCs of the patients,
we did show that for cisplatin and oxaliplatin patient pUF samples, respectively 10% and
4.3% of the DNA binding activity of the parent compound was retained. The difference
between the reactivity of cisplatin and oxaliplatin samples is in agreement with the
difference in DNA binding activity of the parent compounds. In vitro studies reported
that cisplatin showed a 1.3 to 10-fold higher DNA binding compared to similar
concentrations of oxaliplatin [26,27]. Whether the Pt-DNA adducts are similar to the
adducts formed by the parent compounds remains to be established.
In addition to the remaining DNA binding properties, Pt in plasma also appeared to have
remaining protein binding capacity, which substantiates the observations that Pt species
recovered years after treatment may still show reactivity.
Chapter 4.1
188
The investigation of the Pt levels in pUF after the ex vivo incubation of plasma with STS
revealed that STS incubation resulted in higher Pt levels in pUF. This suggests that the Pt
protein binding is not irreversible and that a nucleophilic compound such as STS is
capable of releasing Pt from the proteins because the nucleophilic sulfide group,
possibly, has a higher binding affinity for Pt than proteins do. This observation, however,
should be interpreted with caution because the effect of STS on protein structure and
thus of the ability of the proteins to pass the ultrafilteration membrane could not be
evaluated because protein concentrations in pUF were too low to be detected.
Investigation of the effects of determinants on plasma Pt levels revealed a strong
relationship between Pt levels and the follow-up time. The relationship suggested that
plasma Pt was eliminated according to a first order elimination profile, which could be
best described by a two-compartment model for which the first t1/2 (1.2 months) could
be estimated for oxaliplatin and the second t1/2 (28.5 months) could be estimated for
cisplatin and oxaliplatin, with no difference between the two compounds. For cisplatin,
associations between plasma Pt levels and follow-up time were published before [7-11].
Hohnloser et al. reported an elimination half-life of 6.6 months for the time segment of
5.4 to 32 months and 26 months for the time segment of 21 to 107 months [11]. The last
t1/2 is in agreement with our findings. Although the two elimination half-lives found in
this study characterise the data between 8 and 75 months after the end of treatment,
the complete elimination of plasma Pt can presumably be described by numerous half-
lives which increase with a longer follow-up period. This was confirmed by
investigations of Gelevert et al., who calculated a t1/2 of 54 months for patients who were
treated with cisplatin 120 to 240 months before follow-up.
The long-term Pt plasma levels are, most probably, a result of Pt that has accumulated in
the tissue and is released into the bloodstream due to regeneration of tissue. Although,
for e.g. cisplatin, half of the Pt dose will be excreted during the first week after treatment,
it is estimated, based on animal models, that the long-term Pt retention in human might
still exceed 5% months after treatment [7]. Several investigations have shown raised Pt
levels in tissue samples up to years after chemotherapy [28,29]. The two compartments
in the Pt elimination observed in this study, could be explained by the Pt release from
fast regenerating tissue, followed by a release from slower regenerating tissue. This
hypothesis is supported by observations of Heydorn et al. and Gregg et al. Heydorn et al.
who reported that different tissues showed variable elimination half-lives. Gregg et al.
even showed that Pt levels in peripheral nerve tissue such as the dorsal root ganglia, did
not decay with time [29], which was expected considering the slow regeneration of
peripheral nerve tissue [30]. Because the rate of regeneration of tissue decreases with
age, the observation that a higher age was associated with a longer t1/2 was in
correspondence with the hypothesis that Pt levels recovered in the plasma represent the
regeneration of tissue.
Long-term platinum retention
189
In addition to follow-up time, the cumulative dose also appeared to be associated with
plasma Pt levels, which was expected as a higher initial Pt load will result in higher tissue
concentrations [29] and thus higher long-term plasma Pt levels. Few other studies also
suggested a correlation between cumulative Pt dose and long-term plasma or serum Pt
levels [8,11].
The association between renal function and plasma Pt levels was also evaluated. The
main excretion route of Pt agents is via the kidneys. In a previous study it was shown
that urinary Pt concentrations of patients studied 5.3 to 16.8 years after completion of
cisplatin chemotherapy, were strongly correlated to serum concentrations suggesting
rate limiting release of Pt from the tissues followed by fast renal excretion [10]. This
observation implies that no effect of renal function at follow-up on plasma Pt
elimination would be expected. The renal function before start of the treatment,
however, could affect the initial level of Pt accumulation in the tissues and thus long-
term plasma Pt levels. This hypothesis was in accordance with our observation that a
higher GFR was associated with lower plasma Pt levels.
A similar approach counts for the administration of STS at the time of chemotherapy.
The binding of STS to cisplatin could inactivate cisplatin resulting in a reduction of initial
Pt accumulation in tissue. Our results demonstrated that long-term plasma Pt levels
were reduced by 71% with co-administration of STS, which is in agreement with a
reduced tissue accumulation. Although, the intra-arterial administration of cisplatin in
patients who received STS could affect the venous plasma pharmacokinetics after
administration due to a first pass effect in tissue [31], we do not expect that the
administration route affects the total amount of Pt bound to tissue and thus the long-
term plasma Pt levels.
Although no reports have been published on the effects of GST genotypes on Pt
pharmacokinetics, GST genotypes could, considering the detoxification mechanism for
Pt from cells [32], affect the initial Pt elimination from the tissues and thus the long-term
tissue and plasma Pt levels. For the current study, however, no such relationship could
be established.
To summarise, our data suggest that plasma Pt levels are related to follow-up time, age,
cumulative dose, GFR at time of treatment, and STS use. Although no Pt-DNA adducts
could be detected in PBMCs, it was shown that Pt species in pUF were still present in a
reactive form. The clinical consequences of the observed reactivity remain to be
established.
Chapter 4.1
190
References 1. Rosenberg B, Vancamp L, Krigas T. Inhibition of cell division in escherichia coli by electrolysis products
from a platinum electrode. Nature 1965; 205: 698-9.
2. O'Dwyer PJ, Johnson SW. Current status of oxaliplatin in colorectal cancer. Semin Oncol 2003; 30: 78-87.
3. Grothey A. Oxaliplatin-safety profile: neurotoxicity. Semin Oncol 2003; 30: 5-13.
4. Bokemeyer C, Berger CC, Kuczyk MA, Schmoll HJ. Evaluation of long-term toxicity after chemotherapy for testicular cancer. J Clin Oncol 1996; 14: 2923-32.
5. Chaudhary UB, Haldas JR. Long-term complications of chemotherapy for germ cell tumours. Drugs 2003; 63: 1565-77.
6. Travis LB, Fossa SD, Schonfeld SJ, McMaster ML, Lynch CF, Storm H, Hall P, Holowaty E, Andersen A, Pukkala E, Andersson M, Kaijser M, Gospodarowicz M, Joensuu T, Cohen RJ, Boice JD, Jr., Dores GM, Gilbert ES. Second cancers among 40,576 testicular cancer patients: focus on long-term survivors. J Natl Cancer Inst 2005; 97: 1354-65.
7. Tothill P, Klys HS, Matheson LM, McKay K, Smyth JF. The long-term retention of platinum in human tissues following the administration of cisplatin or carboplatin for cancer therapy. Eur J Cancer 1992; 28: 1358-61.
8. Gietema JA, Meinardi MT, Messerschmidt J, Gelevert T, Alt F, Uges DR, Sleijfer DT. Circulating plasma platinum more than 10 years after cisplatin treatment for testicular cancer. Lancet 2000; 355: 1075-6.
9. Gelevert T, Messerschmidt J, Meinardi MT, Alt F, Gietema JA, Franke JP, Sleijfer DT, Uges DR. Adsorptive voltametry to determine platinum levels in plasma from testicular cancer patients treated with cisplatin. Ther Drug Monit 2001; 23: 169-73.
10. Gerl A, Schierl R. Urinary excretion of platinum in chemotherapy-treated long-term survivors of testicular cancer. Acta Oncol 2000; 39: 519-22.
11. Hohnloser JH, Schierl R, Hasford B, Emmerich B. Cisplatin based chemotherapy in testicular cancer patients: long term platinum excretion and clinical effects. Eur J Med Res 1996; 1: 509-14.
12. Stewart DJ, Benjamin RS, Luna M, Feun L, Caprioli R, Seifert W, Loo TL. Human tissue distribution of platinum after cis-diamminedichloroplatinum. Cancer Chemother Pharmacol 1982; 10: 51-4.
13. Barany E, Bergdahl IA, Bratteby LE, Lundh T, Samuelson G, Schutz A, Skerfving S, Oskarsson A. Relationships between trace element concentrations in human blood and serum. Toxicol Lett 2002; 134: 177-84.
14. Barany E, Bergdahl IA, Bratteby LE, Lundh T, Samuelson G, Schutz A, Skerfving S, Oskarsson A. Trace element levels in whole blood and serum from Swedish adolescents. Sci Total Environ 2002; 286: 129-41.
15. Goulle JP, Mahieu L, Castermant J, Neveu N, Bonneau L, Laine G, Bouige D, Lacroix C. Metal and metalloid multi-elementary ICP-MS validation in whole blood, plasma, urine and hair Reference values. Forensic Sci Int 2005; 153: 39-44.
16. Begerow J, Turfeld M, Dunemann L. Determination of physiological palladium, platinum, iridium and gold levels in human blood using double focusing magnetic sector field inductively coupled plasma mass spectrometry. Journal of Analytical Atomic Spectrometry 1997; 12: 1095-8.
17. Pluim D, Maliepaard M, van Waardenburg RC, Beijnen JH, Schellens JHM. 32P-postlabeling assay for the quantification of the major platinum-DNA adducts. Anal Biochem 1999; 275: 30-8.
18. Boom R, Sol CJ, Salimans MM, Jansen CL, Wertheim-van Dillen PM, van der NJ. Rapid and simple method for purification of nucleic acids. J Clin Microbiol 1990; 28: 495-503.
19. Brouwers EEM, Tibben MM, Rosing H, Hillebrand MJX, Joerger M, Schellens JHM, Beijnen JH. Sensitive inductively coupled plasma mass spectrometry assay for the determination of platinum originating from cisplatin, carboplatin, and oxaliplatin in human plasma ultrafiltrate. J Mass Spectrom 2006; 41: 1186-94.
20. Pemble S, Schroeder KR, Spencer SR, Meyer DJ, Hallier E, Bolt HM, Ketterer B, Taylor JB. Human glutathione S-transferase theta (GSTT1): cDNA cloning and the characterization of a genetic polymorphism. Biochem J 1994; 300: 271-6.
21. Ali-Osman F, Akande O, Antoun G, Mao JX, Buolamwini J. Molecular cloning, characterization, and expression in Escherichia coli of full-length cDNAs of three human glutathione S-transferase Pi gene variants. Evidence for differential catalytic activity of the encoded proteins. J Biol Chem 1997; 272: 10004-12.
22. Sreelekha TT, Ramadas K, Pandey M, Thomas G, Nalinakumari KR, Pillai MR. Genetic polymorphism of CYP1A1, GSTM1 and GSTT1 genes in Indian oral cancer. Oral Oncol 2001; 37: 593-8.
Long-term platinum retention
191
23. Jeronimo C, Varzim G, Henrique R, Oliveira J, Bento MJ, Silva C, Lopes C, Sidransky D. I105V polymorphism and promoter methylation of the GSTP1 gene in prostate adenocarcinoma. Cancer Epidemiol Biomarkers Prev 2002; 11: 445-50.
24. Levey AS, Bosch JP, Lewis JB, Greene T, Rogers N, Roth D. A more accurate method to estimate glomerular filtration rate from serum creatinine: a new prediction equation. Modification of Diet in Renal Disease Study Group. Ann Intern Med 1999; 130: 461-70.
25. Calvert H, Judson I, van der Vijgh WJ. Platinum complexes in cancer medicine: pharmacokinetics and pharmacodynamics in relation to toxicity and therapeutic activity. Cancer Surv 1993; 17: 189-217.
26. Goodisman J, Hagrman D, Tacka KA, Souid AK. Analysis of cytotoxicities of platinum compounds. Cancer Chemother Pharmacol 2006; 57: 257-67.
27. Saris CP, van de Vaart PJ, Rietbroek RC, Blommaert FA. In vitro formation of DNA adducts by cisplatin, lobaplatin and oxaliplatin in calf thymus DNA in solution and in cultured human cells. Carcinogenesis 1996; 17: 2763-9.
28. Heydorn K, Rietz B, Krarup-Hansen A. Distribution of platinum in patients treated with cisplatin determined by radiochemical neutron activation analysis. The Journal of Trace Elements in Experimental Medicine 1998; 11: 37-43.
29. Gregg RW, Molepo JM, Monpetit VJ, Mikael NZ, Redmond D, Gadia M, Stewart DJ. Cisplatin neurotoxicity: the relationship between dosage, time, and platinum concentration in neurologic tissues, and morphologic evidence of toxicity. J Clin Oncol 1992; 10: 795-803.
30. Jacobs WB, Fehlings MG. The molecular basis of neural regeneration. Neurosurgery 2003; 53: 943-8.
31. Sileni VC, Fosser V, Maggian P, Padula E, Beltrame M, Nicolini M, Arslan P. Pharmacokinetics and tumor concentration of intraarterial and intravenous cisplatin in patients with head and neck squamous cancer. Cancer Chemother Pharmacol 1992; 30: 221-5.
32. Goekkurt E, Hoehn S, Wolschke C, Wittmer C, Stueber C, Hossfeld DK, Stoehlmacher J. Polymorphisms of glutathione S-transferases (GST) and thymidylate synthase (TS)-novel predictors for response and survival in gastric cancer patients. Br J Cancer 2006; 94: 281-6.

Chapter 4.2
Persistent neuropathy after treatment with cisplatin and oxaliplatin
Elke E.M. Brouwers Alwin D.R. Huitema
Willem Boogerd Jos H. Beijnen
Jan H.M. Schellens
Submitted for publication
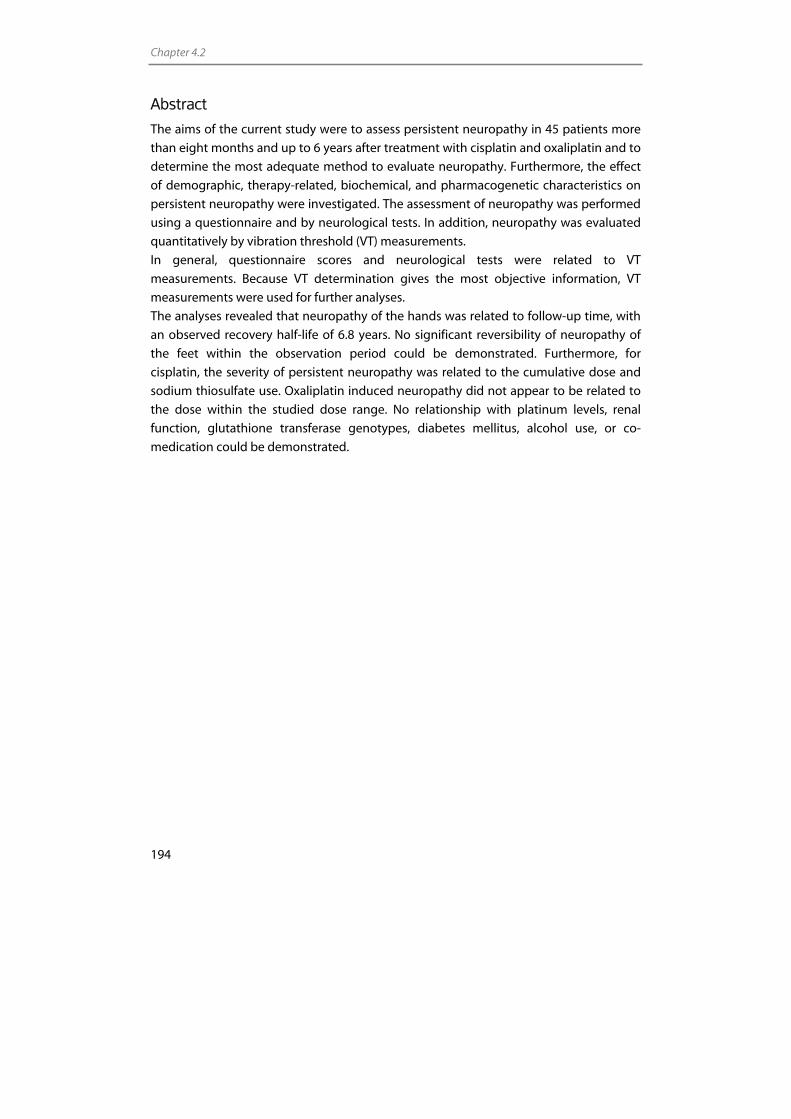
Chapter 4.2
194
Abstract
The aims of the current study were to assess persistent neuropathy in 45 patients more
than eight months and up to 6 years after treatment with cisplatin and oxaliplatin and to
determine the most adequate method to evaluate neuropathy. Furthermore, the effect
of demographic, therapy-related, biochemical, and pharmacogenetic characteristics on
persistent neuropathy were investigated. The assessment of neuropathy was performed
using a questionnaire and by neurological tests. In addition, neuropathy was evaluated
quantitatively by vibration threshold (VT) measurements.
In general, questionnaire scores and neurological tests were related to VT
measurements. Because VT determination gives the most objective information, VT
measurements were used for further analyses.
The analyses revealed that neuropathy of the hands was related to follow-up time, with
an observed recovery half-life of 6.8 years. No significant reversibility of neuropathy of
the feet within the observation period could be demonstrated. Furthermore, for
cisplatin, the severity of persistent neuropathy was related to the cumulative dose and
sodium thiosulfate use. Oxaliplatin induced neuropathy did not appear to be related to
the dose within the studied dose range. No relationship with platinum levels, renal
function, glutathione transferase genotypes, diabetes mellitus, alcohol use, or co-
medication could be demonstrated.
Cisplatin and oxaliplatin induced persistent neuropathy
195
Introduction
Cisplatin belongs to one of the most frequently used chemotherapeutics and is applied
extensively in the treatment of several tumour types. Chemotherapy with cisplatin
containing regimens is, however, often accompanied by severe side effects, such as
nephrotoxicity, ototoxicity, and peripheral sensory neuropathy. The search for platinum
(Pt) anticancer agents with less severe side effects and increased efficacy has led to the
development of several Pt-based compounds, including oxaliplatin. Oxaliplatin was first
introduced into clinical trials in 1986 [1] and is now part of the standard first-line
treatment in patients with colorectal cancer [2-4]. Unfortunately, patients treated with
this compound also frequently suffer from persistent peripheral sensory neuropathy.
Considering the fact that the life expectancy of patients treated with cisplatin and
oxaliplatin has improved, persistent side effects, such as neuropathy, can greatly affect
the quality of life of patients.
Clinical manifestations of cisplatin and oxaliplatin induced persistent neuropathy are
primarily sensory in nature and are mainly a consequence of effects on large myelinated
sensory fibers [5]. Parasthesia and dysesthesia in the hands and feet are the most
prominent symptoms [4,6]. The occurrence of L’hermitte’s sign is also reported,
indicating the involvement of the dorsal columns of the spinal cord [7-9]. For cisplatin, it
is mentioned that symptoms often occur or increase after completion of treatment [10]
with off-therapy deterioration up to approximately 6 months after withdrawal of
cisplatin [7,8]. In general, symptoms tend to recover slowly and the process is often
incomplete [6]. Oxaliplatin induced persistent neuropathy has been less well
characterised. Long-term follow-up is difficult because the prognosis of patients treated
with this drug is often less than 20 months [11]. It has, however, been mentioned that
the recovery from oxaliplatin neuropathy is faster and more complete than recovery
from cisplatin neuropathy [6].
Many studies have been performed to unravel the mechanism behind Pt-induced
persistent neuropathy, but still, the exact mechanism has not been clarified. The dorsal
root ganglion appears to be the primary site at which neural damage occurs. For
cisplatin, it was shown that Pt was retained in the dorsal root ganglia of patients who
were analysed post mortem [12,13] and that there were morphological changes visible
in these ganglia following treatment [12,14].
Despite the hypotheses on the mechanisms of Pt-induced sensory neuropathy, it still is
not fully elucidated why neuropathy has such a chronic character. It was suggested that
neuropathy may be persistent due to an irreversible damage at the time of
chemotherapy or due to a persistent Pt binding in the dorsal root ganglia.
The evaluation of sensory neuropathy is complicated by the subjective nature of most
assessment methods. Several approaches for the determination of the presence and
severity of neuropathy have been used in the past, among which were clinical
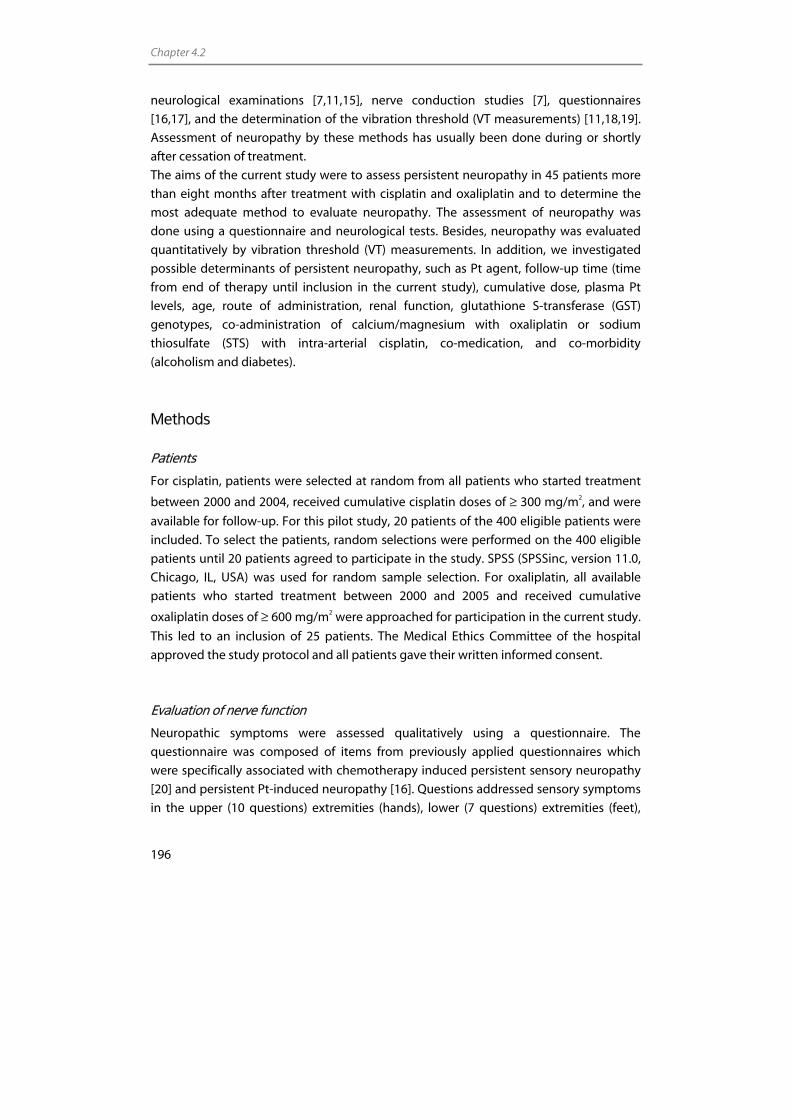
Chapter 4.2
196
neurological examinations [7,11,15], nerve conduction studies [7], questionnaires
[16,17], and the determination of the vibration threshold (VT measurements) [11,18,19].
Assessment of neuropathy by these methods has usually been done during or shortly
after cessation of treatment.
The aims of the current study were to assess persistent neuropathy in 45 patients more
than eight months after treatment with cisplatin and oxaliplatin and to determine the
most adequate method to evaluate neuropathy. The assessment of neuropathy was
done using a questionnaire and neurological tests. Besides, neuropathy was evaluated
quantitatively by vibration threshold (VT) measurements. In addition, we investigated
possible determinants of persistent neuropathy, such as Pt agent, follow-up time (time
from end of therapy until inclusion in the current study), cumulative dose, plasma Pt
levels, age, route of administration, renal function, glutathione S-transferase (GST)
genotypes, co-administration of calcium/magnesium with oxaliplatin or sodium
thiosulfate (STS) with intra-arterial cisplatin, co-medication, and co-morbidity
(alcoholism and diabetes).
Methods
Patients
For cisplatin, patients were selected at random from all patients who started treatment
between 2000 and 2004, received cumulative cisplatin doses of ≥ 300 mg/m2, and were
available for follow-up. For this pilot study, 20 patients of the 400 eligible patients were
included. To select the patients, random selections were performed on the 400 eligible
patients until 20 patients agreed to participate in the study. SPSS (SPSSinc, version 11.0,
Chicago, IL, USA) was used for random sample selection. For oxaliplatin, all available
patients who started treatment between 2000 and 2005 and received cumulative
oxaliplatin doses of ≥ 600 mg/m2 were approached for participation in the current study.
This led to an inclusion of 25 patients. The Medical Ethics Committee of the hospital
approved the study protocol and all patients gave their written informed consent.
Evaluation of nerve function
Neuropathic symptoms were assessed qualitatively using a questionnaire. The
questionnaire was composed of items from previously applied questionnaires which
were specifically associated with chemotherapy induced persistent sensory neuropathy
[20] and persistent Pt-induced neuropathy [16]. Questions addressed sensory symptoms
in the upper (10 questions) extremities (hands), lower (7 questions) extremities (feet),
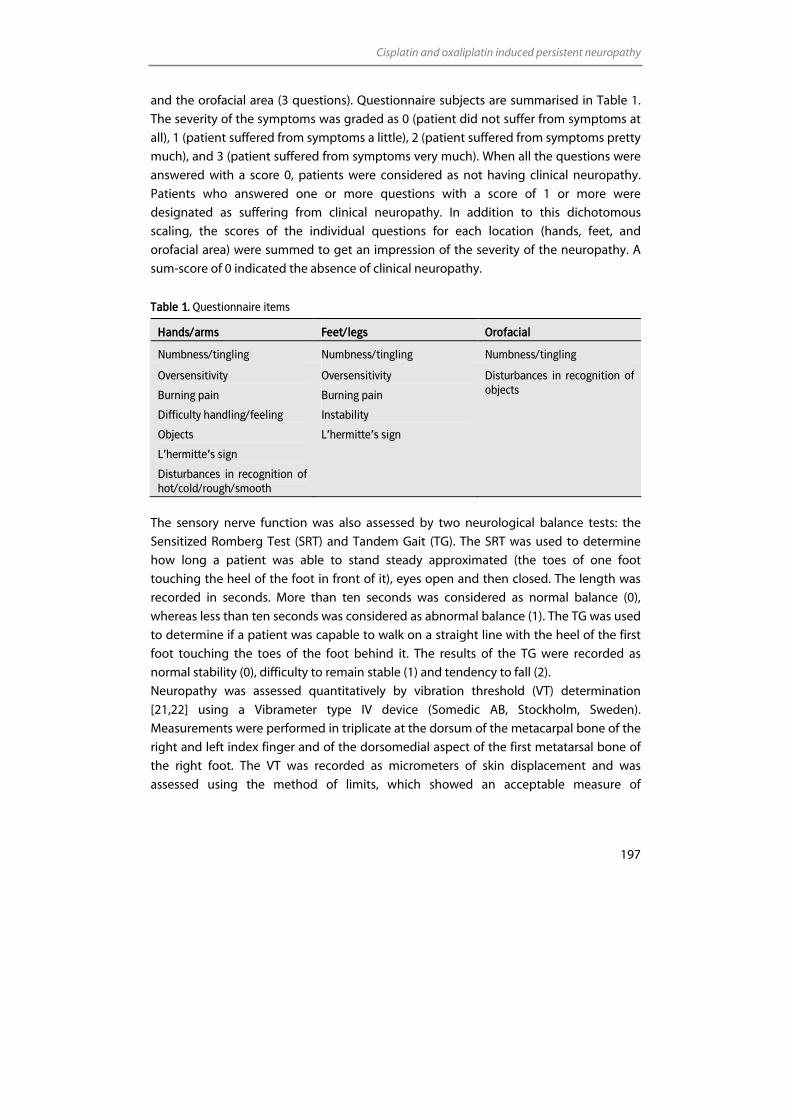
Cisplatin and oxaliplatin induced persistent neuropathy
197
and the orofacial area (3 questions). Questionnaire subjects are summarised in Table 1.
The severity of the symptoms was graded as 0 (patient did not suffer from symptoms at
all), 1 (patient suffered from symptoms a little), 2 (patient suffered from symptoms pretty
much), and 3 (patient suffered from symptoms very much). When all the questions were
answered with a score 0, patients were considered as not having clinical neuropathy.
Patients who answered one or more questions with a score of 1 or more were
designated as suffering from clinical neuropathy. In addition to this dichotomous
scaling, the scores of the individual questions for each location (hands, feet, and
orofacial area) were summed to get an impression of the severity of the neuropathy. A
sum-score of 0 indicated the absence of clinical neuropathy.
Table 1. Questionnaire items
Hands/arms Feet/legs Orofacial
Numbness/tingling Numbness/tingling Numbness/tingling
Oversensitivity
Burning pain
Difficulty handling/feeling
Objects
L’hermitte’s sign
Disturbances in recognition of hot/cold/rough/smooth
Oversensitivity
Burning pain
Instability
L’hermitte’s sign
Disturbances in recognition of objects
The sensory nerve function was also assessed by two neurological balance tests: the
Sensitized Romberg Test (SRT) and Tandem Gait (TG). The SRT was used to determine
how long a patient was able to stand steady approximated (the toes of one foot
touching the heel of the foot in front of it), eyes open and then closed. The length was
recorded in seconds. More than ten seconds was considered as normal balance (0),
whereas less than ten seconds was considered as abnormal balance (1). The TG was used
to determine if a patient was capable to walk on a straight line with the heel of the first
foot touching the toes of the foot behind it. The results of the TG were recorded as
normal stability (0), difficulty to remain stable (1) and tendency to fall (2).
Neuropathy was assessed quantitatively by vibration threshold (VT) determination
[21,22] using a Vibrameter type IV device (Somedic AB, Stockholm, Sweden).
Measurements were performed in triplicate at the dorsum of the metacarpal bone of the
right and left index finger and of the dorsomedial aspect of the first metatarsal bone of
the right foot. The VT was recorded as micrometers of skin displacement and was
assessed using the method of limits, which showed an acceptable measure of

Chapter 4.2
198
reproducibility and validity [21,23,24]. All VT measurements were determined by the
same investigator to prevent inter-observer variability.
The dichotomous results from the questionnaires and VT method were compared and
the questionnaire was used to select an optimal cut-off value for the VT method.
Furthermore, the questionnaire sum-scores were compared to the continuous VT
measurements to see whether the VT measurements could predict the patients
experience of neuropathy. Besides, the associations between questionnaire sum-scores,
VT measurements, and neurological tests were evaluated.
Genotyping
Blood samples were drawn in 5 mL edta-containing tubes (Becton Dickinson Vacutainer
Systems, Plymouth, UK) for genotyping of detoxifying GST enzymes. Lymphocyte DNA
was isolated according to the method of Boom [25]. All samples were stored at –20 °C
until analysis. Polymorphisms in the genes encoding the enzymes GSTM1, GSTT1, and
GSTP1 were determined. In GSTT1 and GSTM1, known inherited homozygous deletions
are equivalent to nonfunctional enzymes and are encoded as positive and negative [26].
In the GSTP1 gene, a functional SNP between adenosine (A) and guanosine (G) at base
pair 313 leads to the expression of either Ile or Val at codon 105. This polymorphism
significantly affects enzyme activity [27].
PCR amplifications were performed in 50 µL reactions with ~100 ng of genomic DNA,
200 µM dNTPs (Epicentre Technologies, Madison, WI, USA), 10 x PCR Buffer II (Applied
Biosystems, Foster City, CA, USA), magnesiumchloride (MgCl2), 0.5-1 U AmpliTaq Gold
(Applied Biosystems), and forward and reverse primers (Metabion, Planegg-Martinsried,
Germany). GSTM1 and GSTT1 deletions were analysed using a gel electrophoresis
method with β-globulin as internal control as described by Sreelekha et al [28]. GSTP1
(exon 5) was genotyped according to Jerónimo et al [29].
Clinical parameters
Data regarding determinants that might affect sensory nerve function were collected.
Cumulative dose of the Pt agents, age, follow-up time, route of administration, co-
administration of calcium/magnesium or STS, co-morbidity e.g. alcoholism and diabetes,
co-medication, and serum creatinine before start of chemotherapy were collected from
patient files. Additionally, serum creatinine was assessed at the time of study. The
glomerular filtration rate (GFR) was estimated from serum creatinine using the
‘Modification of Diet in Renal Disease (MDRD)’-formula [30]. Plasma Pt levels at the time
of follow-up were described in a previous investigation [31].
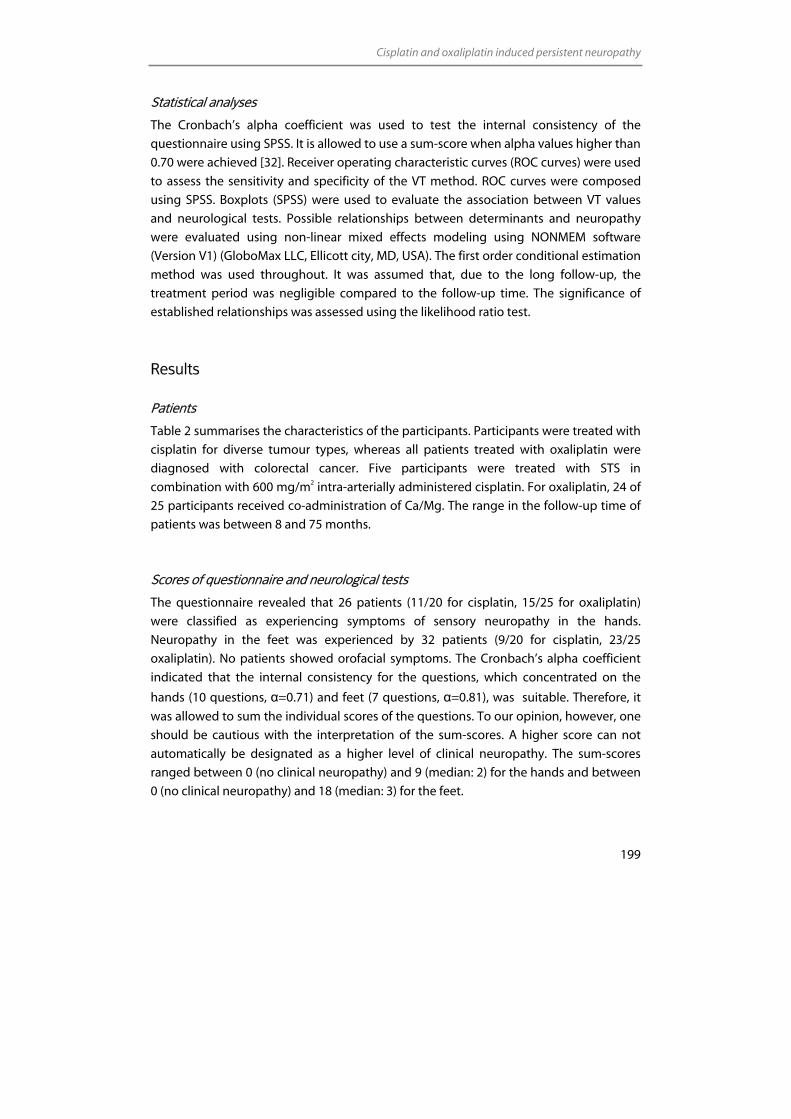
Cisplatin and oxaliplatin induced persistent neuropathy
199
Statistical analyses
The Cronbach’s alpha coefficient was used to test the internal consistency of the
questionnaire using SPSS. It is allowed to use a sum-score when alpha values higher than
0.70 were achieved [32]. Receiver operating characteristic curves (ROC curves) were used
to assess the sensitivity and specificity of the VT method. ROC curves were composed
using SPSS. Boxplots (SPSS) were used to evaluate the association between VT values
and neurological tests. Possible relationships between determinants and neuropathy
were evaluated using non-linear mixed effects modeling using NONMEM software
(Version V1) (GloboMax LLC, Ellicott city, MD, USA). The first order conditional estimation
method was used throughout. It was assumed that, due to the long follow-up, the
treatment period was negligible compared to the follow-up time. The significance of
established relationships was assessed using the likelihood ratio test.
Results
Patients
Table 2 summarises the characteristics of the participants. Participants were treated with
cisplatin for diverse tumour types, whereas all patients treated with oxaliplatin were
diagnosed with colorectal cancer. Five participants were treated with STS in
combination with 600 mg/m2 intra-arterially administered cisplatin. For oxaliplatin, 24 of
25 participants received co-administration of Ca/Mg. The range in the follow-up time of
patients was between 8 and 75 months.
Scores of questionnaire and neurological tests
The questionnaire revealed that 26 patients (11/20 for cisplatin, 15/25 for oxaliplatin)
were classified as experiencing symptoms of sensory neuropathy in the hands.
Neuropathy in the feet was experienced by 32 patients (9/20 for cisplatin, 23/25
oxaliplatin). No patients showed orofacial symptoms. The Cronbach’s alpha coefficient
indicated that the internal consistency for the questions, which concentrated on the
hands (10 questions, α=0.71) and feet (7 questions, α=0.81), was suitable. Therefore, it
was allowed to sum the individual scores of the questions. To our opinion, however, one
should be cautious with the interpretation of the sum-scores. A higher score can not
automatically be designated as a higher level of clinical neuropathy. The sum-scores
ranged between 0 (no clinical neuropathy) and 9 (median: 2) for the hands and between
0 (no clinical neuropathy) and 18 (median: 3) for the feet.
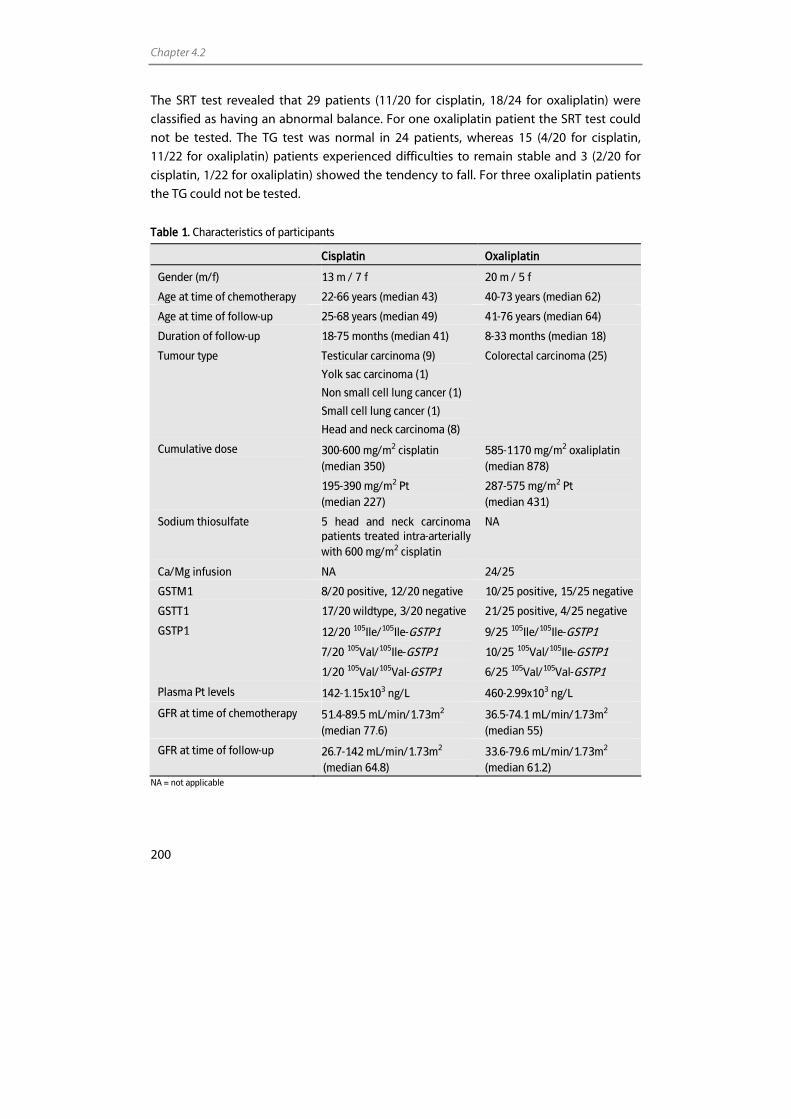
Chapter 4.2
200
The SRT test revealed that 29 patients (11/20 for cisplatin, 18/24 for oxaliplatin) were
classified as having an abnormal balance. For one oxaliplatin patient the SRT test could
not be tested. The TG test was normal in 24 patients, whereas 15 (4/20 for cisplatin,
11/22 for oxaliplatin) patients experienced difficulties to remain stable and 3 (2/20 for
cisplatin, 1/22 for oxaliplatin) showed the tendency to fall. For three oxaliplatin patients
the TG could not be tested.
Table 1. Characteristics of participants
Cisplatin Oxaliplatin
Gender (m/f) 13 m / 7 f 20 m / 5 f
Age at time of chemotherapy 22-66 years (median 43) 40-73 years (median 62)
Age at time of follow-up 25-68 years (median 49) 41-76 years (median 64)
Duration of follow-up 18-75 months (median 41) 8-33 months (median 18)
Tumour type Testicular carcinoma (9)
Yolk sac carcinoma (1)
Non small cell lung cancer (1)
Small cell lung cancer (1)
Head and neck carcinoma (8)
Colorectal carcinoma (25)
Cumulative dose 300-600 mg/m2 cisplatin (median 350)
195-390 mg/m2 Pt (median 227)
585-1170 mg/m2 oxaliplatin (median 878)
287-575 mg/m2 Pt (median 431)
Sodium thiosulfate 5 head and neck carcinoma patients treated intra-arterially with 600 mg/m2 cisplatin
NA
Ca/Mg infusion NA 24/25
GSTM1 8/20 positive, 12/20 negative 10/25 positive, 15/25 negative
GSTT1 17/20 wildtype, 3/20 negative 21/25 positive, 4/25 negative
GSTP1 12/20 105Ile/105Ile-GSTP1
7/20 105Val/105Ile-GSTP1
1/20 105Val/105Val-GSTP1
9/25 105Ile/105Ile-GSTP1
10/25 105Val/105Ile-GSTP1
6/25 105Val/105Val-GSTP1
Plasma Pt levels 142-1.15x10³ ng/L 460-2.99x10³ ng/L
GFR at time of chemotherapy 51.4-89.5 mL/min/1.73m2 (median 77.6)
36.5-74.1 mL/min/1.73m2
(median 55)
GFR at time of follow-up 26.7-142 mL/min/1.73m2
(median 64.8) 33.6-79.6 mL/min/1.73m2 (median 61.2)
NA = not applicable
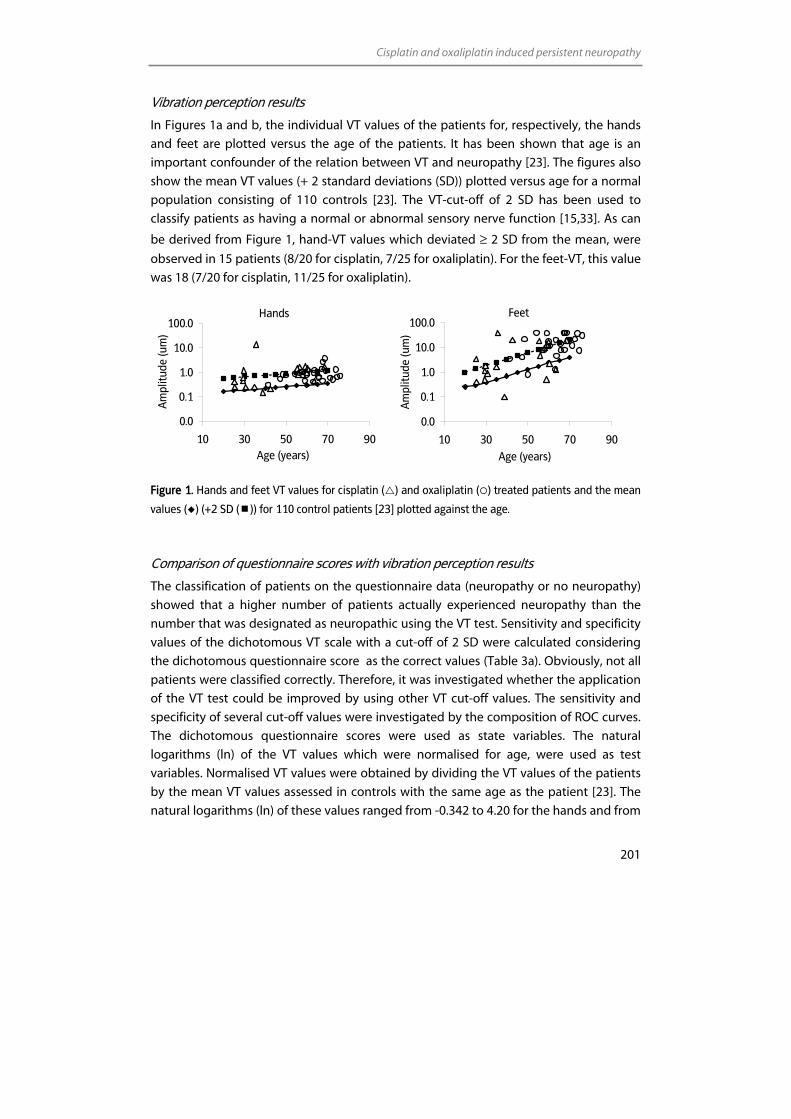
Cisplatin and oxaliplatin induced persistent neuropathy
201
Vibration perception results
In Figures 1a and b, the individual VT values of the patients for, respectively, the hands
and feet are plotted versus the age of the patients. It has been shown that age is an
important confounder of the relation between VT and neuropathy [23]. The figures also
show the mean VT values (+ 2 standard deviations (SD)) plotted versus age for a normal
population consisting of 110 controls [23]. The VT-cut-off of 2 SD has been used to
classify patients as having a normal or abnormal sensory nerve function [15,33]. As can
be derived from Figure 1, hand-VT values which deviated ≥ 2 SD from the mean, were
observed in 15 patients (8/20 for cisplatin, 7/25 for oxaliplatin). For the feet-VT, this value
was 18 (7/20 for cisplatin, 11/25 for oxaliplatin).
Feet
0.0
0.1
1.0
10.0
100.0
10 30 50 70 90Age (years)
Am
plitu
de (u
m)
Figure 1. Hands and feet VT values for cisplatin ( ) and oxaliplatin ( ) treated patients and the mean
values ( ) (+2 SD ( )) for 110 control patients [23] plotted against the age.
Comparison of questionnaire scores with vibration perception results
The classification of patients on the questionnaire data (neuropathy or no neuropathy)
showed that a higher number of patients actually experienced neuropathy than the
number that was designated as neuropathic using the VT test. Sensitivity and specificity
values of the dichotomous VT scale with a cut-off of 2 SD were calculated considering
the dichotomous questionnaire score as the correct values (Table 3a). Obviously, not all
patients were classified correctly. Therefore, it was investigated whether the application
of the VT test could be improved by using other VT cut-off values. The sensitivity and
specificity of several cut-off values were investigated by the composition of ROC curves.
The dichotomous questionnaire scores were used as state variables. The natural
logarithms (ln) of the VT values which were normalised for age, were used as test
variables. Normalised VT values were obtained by dividing the VT values of the patients
by the mean VT values assessed in controls with the same age as the patient [23]. The
natural logarithms (ln) of these values ranged from -0.342 to 4.20 for the hands and from
Hands
0.0
0.1
1.0
10.0
100.0
10 30 50 70 90Age (years)
Am
plitu
de (u
m)
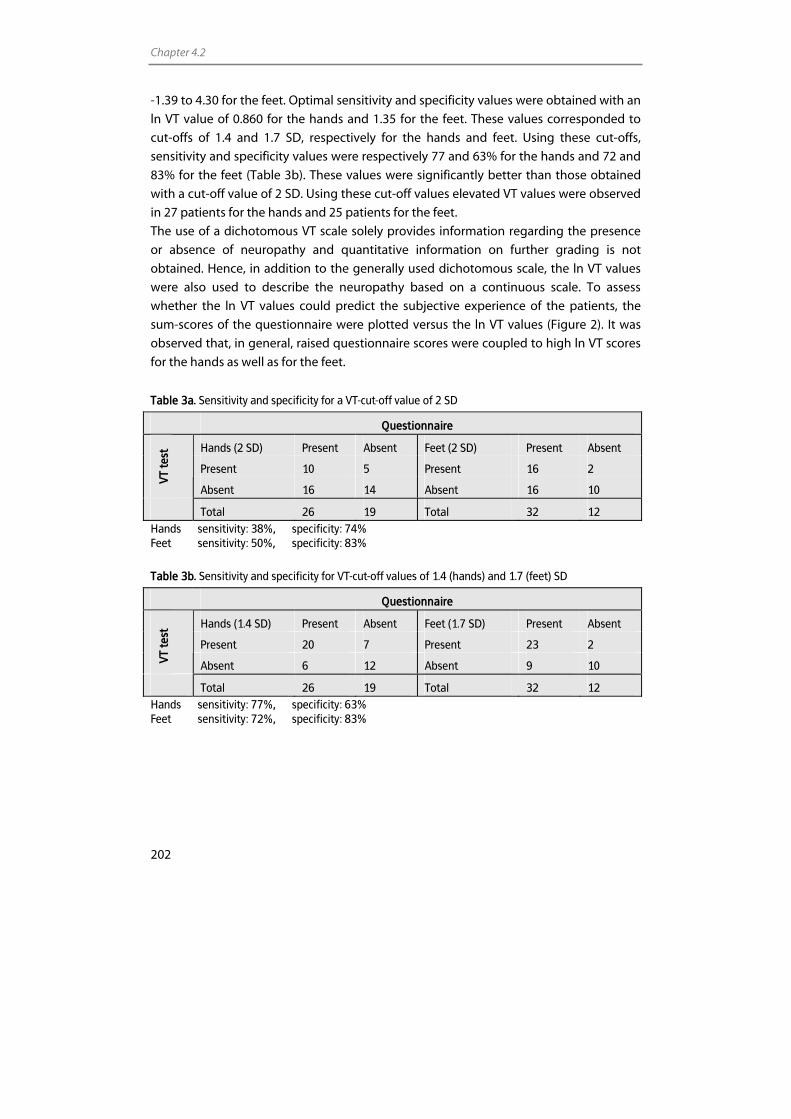
Chapter 4.2
202
-1.39 to 4.30 for the feet. Optimal sensitivity and specificity values were obtained with an
ln VT value of 0.860 for the hands and 1.35 for the feet. These values corresponded to
cut-offs of 1.4 and 1.7 SD, respectively for the hands and feet. Using these cut-offs,
sensitivity and specificity values were respectively 77 and 63% for the hands and 72 and
83% for the feet (Table 3b). These values were significantly better than those obtained
with a cut-off value of 2 SD. Using these cut-off values elevated VT values were observed
in 27 patients for the hands and 25 patients for the feet.
The use of a dichotomous VT scale solely provides information regarding the presence
or absence of neuropathy and quantitative information on further grading is not
obtained. Hence, in addition to the generally used dichotomous scale, the ln VT values
were also used to describe the neuropathy based on a continuous scale. To assess
whether the ln VT values could predict the subjective experience of the patients, the
sum-scores of the questionnaire were plotted versus the ln VT values (Figure 2). It was
observed that, in general, raised questionnaire scores were coupled to high ln VT scores
for the hands as well as for the feet.
Table 3a. Sensitivity and specificity for a VT-cut-off value of 2 SD
Questionnaire
Hands (2 SD) Present Absent Feet (2 SD) Present Absent
Present 10 5 Present 16 2
VT te
st
Absent 16 14 Absent 16 10
Total 26 19 Total 32 12 Hands sensitivity: 38%, specificity: 74% Feet sensitivity: 50%, specificity: 83%
Table 3b. Sensitivity and specificity for VT-cut-off values of 1.4 (hands) and 1.7 (feet) SD
Questionnaire
Hands (1.4 SD) Present Absent Feet (1.7 SD) Present Absent
Present 20 7 Present 23 2
VT te
st
Absent 6 12 Absent 9 10
Total 26 19 Total 32 12 Hands sensitivity: 77%, specificity: 63% Feet sensitivity: 72%, specificity: 83%
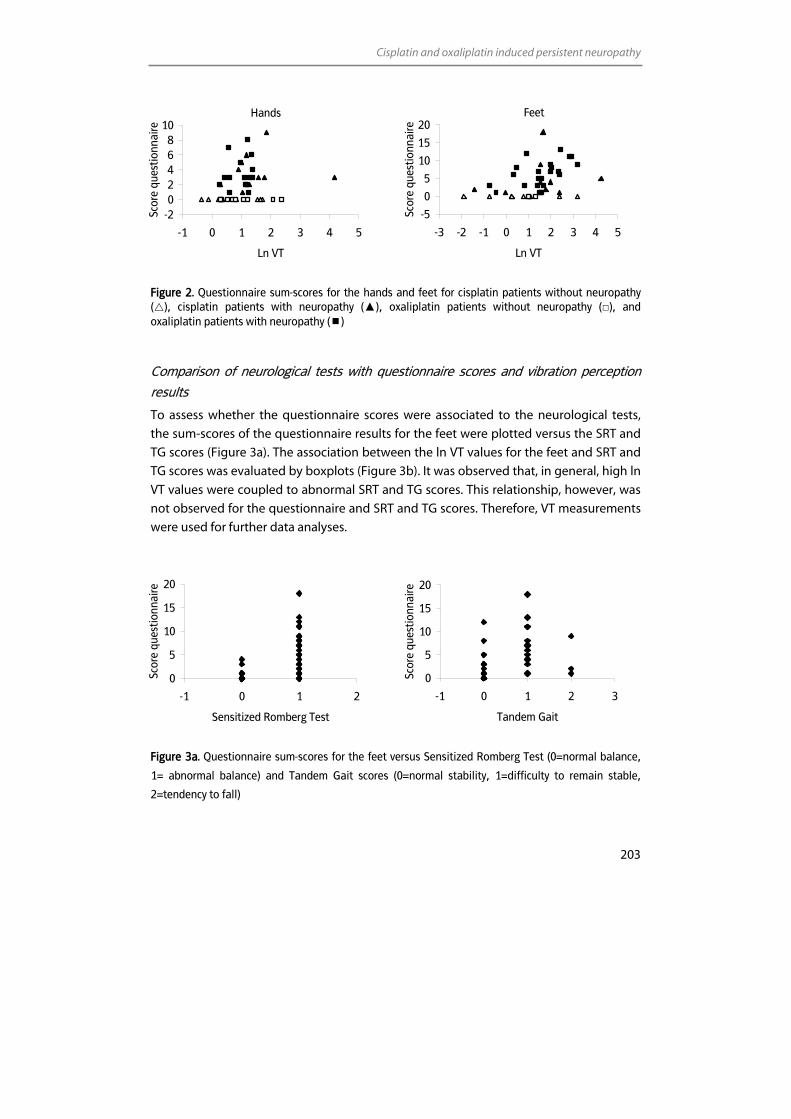
Cisplatin and oxaliplatin induced persistent neuropathy
203
Feet
-5
0
5
10
15
20
-3 -2 -1 0 1 2 3 4 5
Ln VT
Scor
e qu
estio
nnai
re
Figure 2. Questionnaire sum-scores for the hands and feet for cisplatin patients without neuropathy ( ), cisplatin patients with neuropathy (▲), oxaliplatin patients without neuropathy (□), and oxaliplatin patients with neuropathy ( )
Comparison of neurological tests with questionnaire scores and vibration perception
results
To assess whether the questionnaire scores were associated to the neurological tests,
the sum-scores of the questionnaire results for the feet were plotted versus the SRT and
TG scores (Figure 3a). The association between the ln VT values for the feet and SRT and
TG scores was evaluated by boxplots (Figure 3b). It was observed that, in general, high ln
VT values were coupled to abnormal SRT and TG scores. This relationship, however, was
not observed for the questionnaire and SRT and TG scores. Therefore, VT measurements
were used for further data analyses.
0
5
10
15
20
-1 0 1 2 3
Tandem Gait
Scor
e qu
estio
nnai
re
Figure 3a. Questionnaire sum-scores for the feet versus Sensitized Romberg Test (0=normal balance,
1= abnormal balance) and Tandem Gait scores (0=normal stability, 1=difficulty to remain stable,
2=tendency to fall)
0
5
10
15
20
-1 0 1 2
Sensitized Romberg Test
Scor
e qu
estio
nnai
re
Hands
-202468
10
-1 0 1 2 3 4 5
Ln VT
Scor
e qu
estio
nnai
re
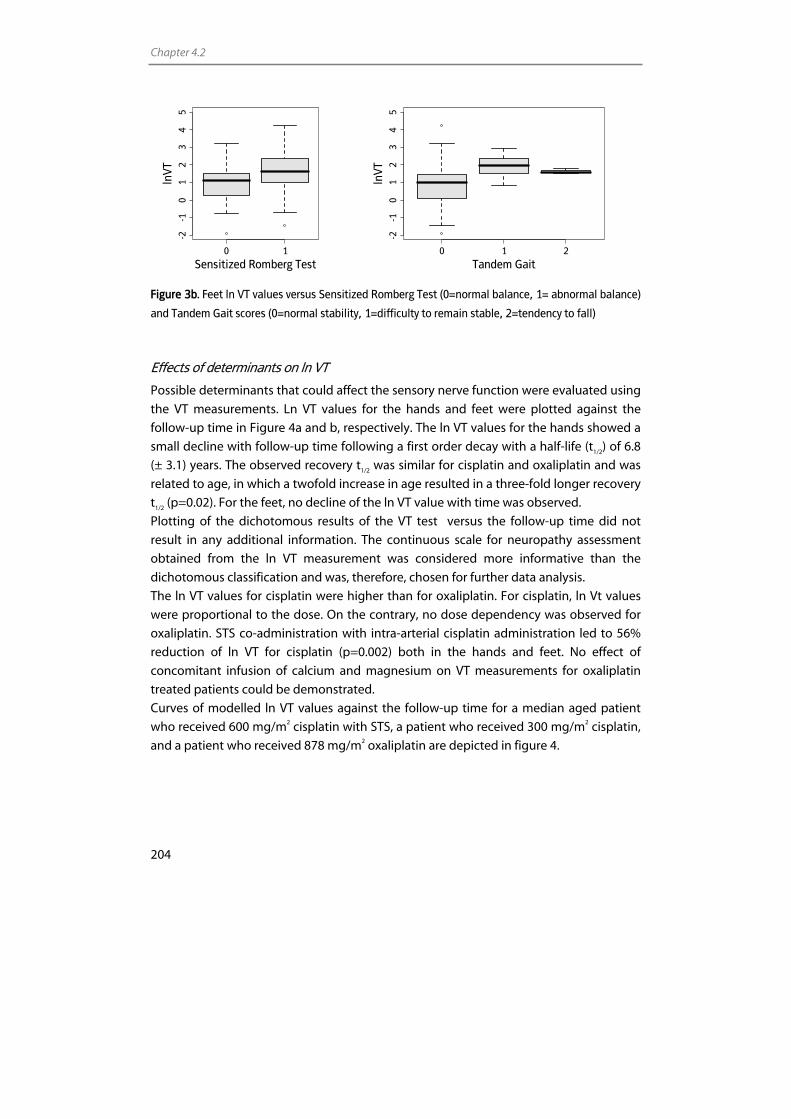
Chapter 4.2
204
0 1
-2-1
01
23
45
Sensitized Romberg Test
lnVT
0 1 2
-2-1
01
23
45
Tandem Gait
lnVT
Figure 3b. Feet ln VT values versus Sensitized Romberg Test (0=normal balance, 1= abnormal balance)
and Tandem Gait scores (0=normal stability, 1=difficulty to remain stable, 2=tendency to fall)
Effects of determinants on ln VT
Possible determinants that could affect the sensory nerve function were evaluated using
the VT measurements. Ln VT values for the hands and feet were plotted against the
follow-up time in Figure 4a and b, respectively. The ln VT values for the hands showed a
small decline with follow-up time following a first order decay with a half-life (t1/2) of 6.8
(± 3.1) years. The observed recovery t1/2 was similar for cisplatin and oxaliplatin and was
related to age, in which a twofold increase in age resulted in a three-fold longer recovery
t1/2 (p=0.02). For the feet, no decline of the ln VT value with time was observed.
Plotting of the dichotomous results of the VT test versus the follow-up time did not
result in any additional information. The continuous scale for neuropathy assessment
obtained from the ln VT measurement was considered more informative than the
dichotomous classification and was, therefore, chosen for further data analysis.
The ln VT values for cisplatin were higher than for oxaliplatin. For cisplatin, ln Vt values
were proportional to the dose. On the contrary, no dose dependency was observed for
oxaliplatin. STS co-administration with intra-arterial cisplatin administration led to 56%
reduction of ln VT for cisplatin (p=0.002) both in the hands and feet. No effect of
concomitant infusion of calcium and magnesium on VT measurements for oxaliplatin
treated patients could be demonstrated.
Curves of modelled ln VT values against the follow-up time for a median aged patient
who received 600 mg/m2 cisplatin with STS, a patient who received 300 mg/m2 cisplatin,
and a patient who received 878 mg/m2 oxaliplatin are depicted in figure 4.
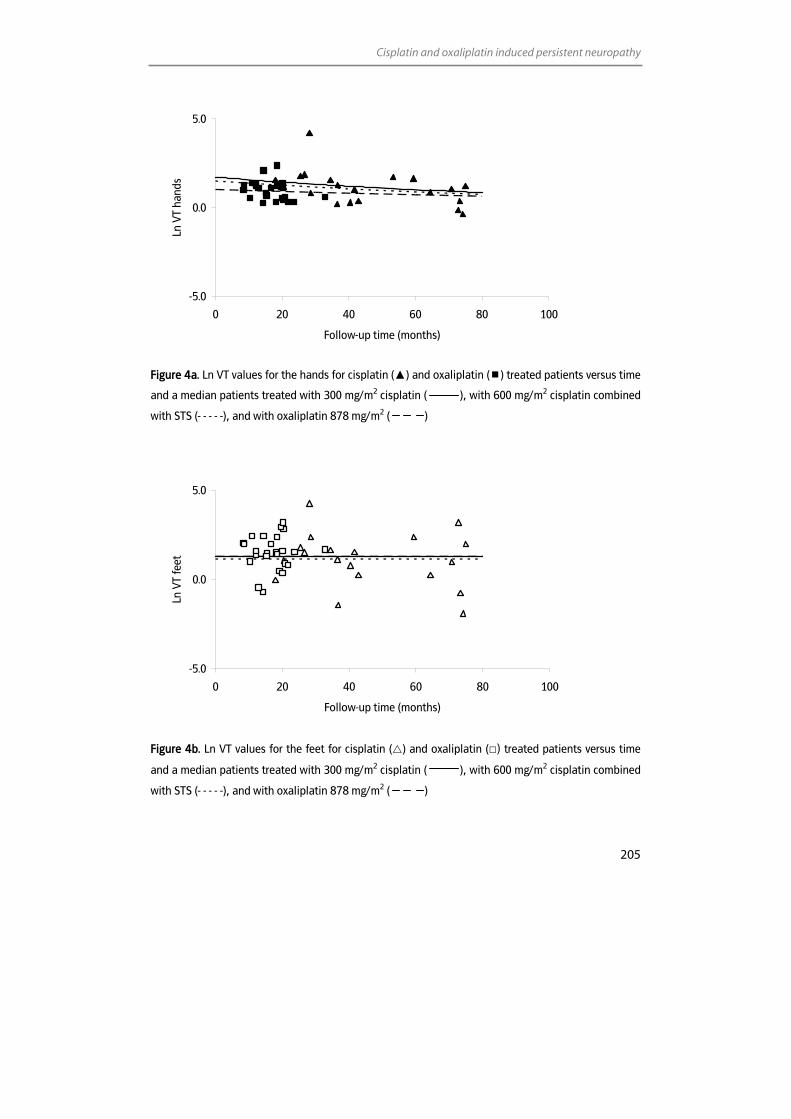
Cisplatin and oxaliplatin induced persistent neuropathy
205
-5.0
0.0
5.0
0 20 40 60 80 100
Follow-up time (months)
Ln V
T ha
nds
Figure 4a. Ln VT values for the hands for cisplatin (▲) and oxaliplatin ( ) treated patients versus time
and a median patients treated with 300 mg/m2 cisplatin ( ), with 600 mg/m2 cisplatin combined
with STS (- - - - -), and with oxaliplatin 878 mg/m2 ( )
-5.0
0.0
5.0
0 20 40 60 80 100
Follow-up time (months)
Ln V
T fe
et
Figure 4b. Ln VT values for the feet for cisplatin ( ) and oxaliplatin (□) treated patients versus time
and a median patients treated with 300 mg/m2 cisplatin ( ), with 600 mg/m2 cisplatin combined
with STS (- - - - -), and with oxaliplatin 878 mg/m2 ( )
Chapter 4.2
206
The observed plasma Pt levels at the time of follow-up and GST allele frequencies are
shown in Table 2. It was not considered plausible that Pt levels at the time of follow-up
were related to nerve function, because plasma Pt levels decrease with time [31],
whereas Pt levels in ganglia remain constant over time [12]. Therefore, Pt levels were
extrapolated to the time of treatment using the elimination half-life [31]. No relationship
between plasma Pt levels and ln VT values was observed. Furthermore, an association
between GSTT1, GSTM1, and GSTP1 genotypes and ln VT values could not be established.
The effect of the renal function on ln VT values was evaluated using the MDRD-GFR.
Median GRF values before start of the Pt chemotherapy were 78 and 65 mL/min/1.73m2
for cisplatin and oxaliplatin, respectively (Table 2). At the time of the current study, GFR
values of cisplatin patients were significantly decreased to 55 mL/min/1.73m2 (p<0.001),
whereas oxaliplatin GFR values remained constant (61 mL/min/1.73m2). No association
was observed between GFR and ln VT values. Furthermore, alcohol use, diabetes
mellitus, or co-medication did not seem to affect ln VT values.
Discussion
Cisplatin and oxaliplatin are frequently used chemotherapeutic agents. Their use,
however, is hampered by a peripheral sensory neuropathy, which can, even years after
cessation of treatment, seriously affect the quality of life.
The aims of the current study were to assess persistent neuropathy in 45 patients more
than eight months and up to 75 months after treatment with cisplatin and oxaliplatin
and to determine the most adequate method to evaluate neuropathy. The assessment
of neuropathy was performed using a questionnaire and by neurological tests. Besides,
neuropathy was assessed quantitatively by VT measurements.
Comparison of the questionnaire results and VT values showed that the generally used 2
SD cut-off value for the VT measurement may not lead to adequate classification of
neuropathy. Therefore, classification was improved by using different cut-off values.
However, by classifying the dichotomous VT measurements, quantitative information
regarding the nerve function was lost. Hence, the ln VT values were used to describe the
neuropathy based on a continuous scale. It was observed that, in general, raised
questionnaire sum-scores were coupled to high ln VT scores for the hands as well as for
the feet. When questionnaire sum-scores and ln VT values were plotted versus the scores
of the neurological tests, ln VT values were more obviously associated to the
neurological tests than the questionnaire sum-scores. This illustrates that the VT
determination gives more objective information than questionnaire sum-scores.
Because quantitative measurements may provide more precise and objective measures
of neuropathy, the VT determination was used to perform further data analyses.
Cisplatin and oxaliplatin induced persistent neuropathy
207
Investigation of the effects of determinants on ln VT values revealed that the ln VT values
for the hands declined with follow-up time. The recovery t1/2 of 6.8 years, however,
suggests that for both cisplatin and oxaliplatin, the reversibility is slow and incomplete.
The observation that a twofold increase in age resulted in a three-fold longer recovery
t1/2, suggests that the effect of age on VT values in our population was larger than the
effect observed in the population of Goldberg et al. [23]. Probably, the sensory nerve
function of patients treated with Pt agents is more susceptible to age than the nerve
function of normal individuals.
The observations that the ln VT values for the feet did not decline with time, suggests
that neuropathy in the feet is an even more important issue than neuropathy in the
hands. This was in accordance with an investigation performed by Land et al. who
mentioned that for oxaliplatin, 18 months after the start of treatment, neuropathy was
primarily present in the feet [17]. The apparent larger effect of Pt agents on the feet
compared to the hands is in accordance with the observation that other determinants
such as age also affect the sensory nerve function in the feet more than in the hands
[23].
The higher ln VT values observed for cisplatin compared to oxaliplatin could, probably,
be explained by the higher activity and thus toxicity of cisplatin.
The ln VT values for cisplatin were proportional to the cumulative dose. This association
was already extensively described in previous studies [8,34,35]. In contrast, no
association between dose and ln VT for oxaliplatin was observed. This might be a
consequence of the limited dose range studied in these patients. In contrast to our
observations, other studies mentioned the presence of a dose dependency for persistent
oxaliplatin induced neuropathy [6,11].
The ln VT values were not related to the plasma Pt levels at the time of chemotherapy.
Plasma Pt levels at the time of chemotherapy were estimated by extrapolating the
plasma Pt levels at follow-up using the estimated elimination t1/2. Because the
elimination t1/2 was estimated using only one data point per patient, this could have
resulted in an inaccurate estimation of Pt levels at the time of chemotherapy. Therefore,
to evaluate the relationship between plasma Pt levels and ln VT, more data points per
patient are indispensable.
The association between STS, calcium/magnesium co-administration, and ln VT values
was also evaluated. STS co-administration with intra-arterial cisplatin administration led
to 56% reduction in ln VT for cisplatin. By binding to cisplatin, STS can inactivate
cisplatin. This might lead to a reduction of Pt load in tissue and thereby a reduction of
toxicity. Because 24 of the 25 evaluated oxaliplatin patients received concomitant
calcium/magnesium infusions, the group of patients not treated with calcium and
magnesium was too small to be able to observe an effect on the ln VT values.
Chapter 4.2
208
It would be reasonable that the renal function at the time of chemotherapy affected the
severity of neuropathy. A better renal function could imply a faster initial elimination of
Pt, leading to lower tissue levels and thus less toxicity. This association, however, was not
observed in the current population. This could be due to the small sample size and a
limited variation in GFR.
Genetic factors, that potentially influence the pharmacokinetics of an anticancer drug
and thereby the development of drug toxicity in patients could be relevant
determinants in this study. The detoxifying GST enzymes are thought to participate
collectively in the intracellular metabolism and detoxification [36,37]. Recent
investigations showed that patients homozygous or heterozygous for the GSTP1 105Val
allele were less susceptible for developing severe oxaliplatin-induced neurotoxicity [38].
The presence of both alleles of 105Val-GSTP1 offered protection against cisplatin-induced
hearing impairment [39]. Although it might be suspected that mutations in the GSTs
genes could affect sensory neuropathy, we did not observe an association between ln VT
and any of the three (GSTM1, GSTT1 and GSTP1) genes investigated, which is probably
due to the small sample size of the current population.
To summarise, the effect of possible determinants on neuropathy could be evaluated
using continuous VT values, which provides the most extensive information about the
severity of neuropathy. Our data suggest that neuropathy in the hands is slowly
reversible, whereas no reversibility of neuropathy in the feet could be demonstrated
during follow-up in the current study. Furthermore, for cisplatin, the severity of
neuropathy was associated with cumulative dose and STS use. Oxaliplatin induced
neuropathy did not appear to be related to the dose. No relationship with renal function,
GST genotypes, diabetes mellitus, alcohol use, or co-medications could be
demonstrated.
Cisplatin and oxaliplatin induced persistent neuropathy
209
References 1. Mathé G, Kidani Y, Triana K, Brienza S, Ribaud P, Goldschmidt E, Ecstein E, Despax R, Musset M, Misset JL. A
phase I trial of trans-1-diaminocyclohexane oxalato-platinum (l-OHP). Biomed Pharmacother 1986; 40: 372-6.
2. Pendyala L, Creaven PJ. In vitro cytotoxicity, protein binding, red blood cell partitioning, and biotransformation of oxaliplatin. Cancer Res 1993; 53: 5970-6.
3. Schmidt W, Chaney SG. Role of carrier ligand in platinum resistance of human carcinoma cell lines. Cancer Res 1993; 53: 799-805.
4. Chaudhary UB, Haldas JR. Long-term complications of chemotherapy for germ cell tumours. Drugs 2003; 63: 1565-77.
5. Alberts DS, Noel JK. Cisplatin-associated neurotoxicity: can it be prevented? Anticancer Drugs 1995; 6: 369-83.
6. Grothey A. Oxaliplatin-safety profile: neurotoxicity. Semin Oncol 2003; 30: 5-13.
7. Boogerd W, Bokkel Huinink WW, Dalesio O, Hoppenbrouwers WJ, van der Sande JJ. Cisplatin induced neuropathy: central, peripheral and autonomic nerve involvement. J Neurooncol 1990; 9: 255-63.
8. Siegal T, Haim N. Cisplatin-induced peripheral neuropathy. Frequent off-therapy deterioration, demyelinating syndromes, and muscle cramps. Cancer 1990; 66: 1117-23.
9. Taieb S, Trillet-Lenoir V, Rambaud L, Descos L, Freyer G. Lhermitte sign and urinary retention: atypical presentation of oxaliplatin neurotoxicity in four patients. Cancer 2002; 94: 2434-40.
10. LoMonaco M, Milone M, Batocchi AP, Padua L, Restuccia D, Tonali P. Cisplatin neuropathy: clinical course and neurophysiological findings. J Neurol 1992; 239: 199-204.
11. Pietrangeli A, Leandri M, Terzoli E, Jandolo B, Garufi C. Persistence of high-dose oxaliplatin-induced neuropathy at long-term follow-up. Eur Neurol 2006; 56: 13-6.
12. Gregg RW, Molepo JM, Monpetit VJ, Mikael NZ, Redmond D, Gadia M, Stewart DJ. Cisplatin neurotoxicity: the relationship between dosage, time, and platinum concentration in neurologic tissues, and morphologic evidence of toxicity. J Clin Oncol 1992; 10: 795-803.
13. Heydorn K, Rietz B, Krarup-Hansen A. Distribution of platinum in patients treated with cisplatin determined by radiochemical neutron activation analysis. The Journal of Trace Elements in Experimental Medicine 1998; 11: 37-43.
14. McKeage MJ, Hsu T, Screnci D, Haddad G, Baguley BC. Nucleolar damage correlates with neurotoxicity induced by different platinum drugs. Br J Cancer 2001; 85: 1219-25.
15. Postma TJ, Hoekman K, van Riel JM, Heimans JJ, Vermorken JB. Peripheral neuropathy due to biweekly paclitaxel, epirubicin and cisplatin in patients with advanced ovarian cancer. J Neurooncol 1999; 45: 241-6.
16. Leonard GD, Wright MA, Quinn MG, Fioravanti S, Harold N, Schuler B, Thomas RR, Grem JL. Survey of oxaliplatin-associated neurotoxicity using an interview-based questionnaire in patients with metastatic colorectal cancer. BMC Cancer 2005; 5: 116.
17. Land SR, Kopec JA, Cecchini RS, Ganz PA, Wieand HS, Colangelo LH, Murphy K, Kuebler JP, Seay TE, Needles BM, Bearden JD, III, Colman LK, Lanier KS, Pajon ER, Jr., Cella D, Smith RE, O'Connell MJ, Costantino JP, Wolmark N. Neurotoxicity from oxaliplatin combined with weekly bolus fluorouracil and leucovorin as surgical adjuvant chemotherapy for stage II and III colon cancer: NSABP C-07. J Clin Oncol 2007; 25: 2205-11.
18. van der Hoop RG, Vecht CJ, van der Burg ME, Elderson A, Boogerd W, Heimans JJ, Vries EP, van Houwelingen JC, Jennekens FG, Gispen WH, . Prevention of cisplatin neurotoxicity with an ACTH(4-9) analogue in patients with ovarian cancer. N Engl J Med 1990; 322: 89-94.
19. Petersen PM, Hansen SW. The course of long-term toxicity in patients treated with cisplatin-based chemotherapy for non-seminomatous germ-cell cancer. Ann Oncol 1999; 10: 1475-83.
20. Postma TJ, Aaronson NK, Heimans JJ, Muller MJ, Hildebrand JG, Delattre JY, Hoang-Xuan K, Lanteri-Minet M, Grant R, Huddart R, Moynihan C, Maher J, Lucey R. The development of an EORTC quality of life questionnaire to assess chemotherapy-induced peripheral neuropathy: the QLQ-CIPN20. Eur J Cancer 2005; 41: 1135-9.
21. Gerr F, Letz R. Vibrotactile threshold testing in occupational health: a review of current issues and limitations. Environ Res 1993; 60: 145-59.
22. Chong PS, Cros DP. Technology literature review: quantitative sensory testing. Muscle Nerve 2004; 29: 734-47.
Chapter 4.2
210
23. Goldberg JM, Lindblom U. Standardised method of determining vibratory perception thresholds for diagnosis and screening in neurological investigation. J Neurol Neurosurg Psychiatry 1979; 42: 793-803.
24. Chuang HY, Schwartz J, Tsai SY, Lee ML, Wang JD, Hu H. Vibration perception thresholds in workers with long-term exposure to lead. Occup Environ Med 2000; 57: 588-94.
25. Boom R, Sol CJ, Salimans MM, Jansen CL, Wertheim-van Dillen PM, van der NJ. Rapid and simple method for purification of nucleic acids. J Clin Microbiol 1990; 28: 495-503.
26. Pemble S, Schroeder KR, Spencer SR, Meyer DJ, Hallier E, Bolt HM, Ketterer B, Taylor JB. Human glutathione S-transferase theta (GSTT1): cDNA cloning and the characterization of a genetic polymorphism. Biochem J 1994; 300: 271-6.
27. Ali-Osman F, Akande O, Antoun G, Mao JX, Buolamwini J. Molecular cloning, characterization, and expression in Escherichia coli of full-length cDNAs of three human glutathione S-transferase Pi gene variants. Evidence for differential catalytic activity of the encoded proteins. J Biol Chem 1997; 272: 10004-12.
28. Sreelekha TT, Ramadas K, Pandey M, Thomas G, Nalinakumari KR, Pillai MR. Genetic polymorphism of CYP1A1, GSTM1 and GSTT1 genes in Indian oral cancer. Oral Oncol 2001; 37: 593-8.
29. Jeronimo C, Varzim G, Henrique R, Oliveira J, Bento MJ, Silva C, Lopes C, Sidransky D. I105V polymorphism and promoter methylation of the GSTP1 gene in prostate adenocarcinoma. Cancer Epidemiol Biomarkers Prev 2002; 11: 445-50.
30. Levey AS, Bosch JP, Lewis JB, Greene T, Rogers N, Roth D. A more accurate method to estimate glomerular filtration rate from serum creatinine: a new prediction equation. Modification of Diet in Renal Disease Study Group. Ann Intern Med 1999; 130: 461-70.
31. Brouwers EEM, Huitema ADR, Beijnen JH, Schellens JHM. Long-term platinum retention after treatment with cisplatin and oxaliplatin. Submitted 2007.
32. Bland JM, Altman DG. Statistics note: Cronbach's alpha. BMJ 1997; 314: 572.
33. Somedic AB Stockholm Sweden. Manual for vibrameter Type III.1985
34. van der Hoop RG, van der Burg ME, Bokkel Huinink WW, van Houwelingen C, Neijt JP. Incidence of neuropathy in 395 patients with ovarian cancer treated with or without cisplatin. Cancer 1990; 66: 1697-702.
35. Bokemeyer C, Berger CC, Kuczyk MA, Schmoll HJ. Evaluation of long-term toxicity after chemotherapy for testicular cancer. J Clin Oncol 1996; 14: 2923-32.
36. Tew KD. Glutathione-associated enzymes in anticancer drug resistance. Cancer Res 1994; 54: 4313-20.
37. Zhang K, Chew M, Yang EB, Wong KP, Mack P. Modulation of cisplatin cytotoxicity and cisplatin-induced DNA cross-links in HepG2 cells by regulation of glutathione-related mechanisms. Mol Pharmacol 2001; 59: 837-43.
38. Lecomte T, Landi B, Beaune P, Laurent-Puig P, Loriot MA. Glutathione S-transferase P1 polymorphism (Ile105Val) predicts cumulative neuropathy in patients receiving oxaliplatin-based chemotherapy. Clin Cancer Res 2006; 12: 3050-6.
39. Oldenburg J, Kraggerud SM, Cvancarova M, Lothe RA, Fossa SD. Cisplatin-induced long-term hearing impairment is associated with specific glutathione s-transferase genotypes in testicular cancer survivors. J Clin Oncol 2007; 25: 708-14.


Chapter 5 Environmental monitoring
of platinum agents

Chapter 5.1
Monitoring of platinum surface contamination in seven Dutch hospital pharmacies using inductively coupled
plasma mass spectrometry
Elke E.M. Brouwers Alwin D.R. Huitema
Eke N. Bakker Jan Willem Douma
Kirsten J.M. Schimmel Geke van Weringh
Paul J. de Wolf Jan H.M. Schellens
Jos H. Beijnen
Submitted for publication
Chapter 5.1
216
Abstract
Objective: To develop, validate, and apply a method for the determination of platinum
(Pt) surface contamination, originating from cisplatin, oxaliplatin, and carboplatin.
Methods: Inductively coupled plasma mass spectrometry was used to determine Pt in
wipe samples. The sampling procedure and the analytical conditions were optimised
and the assay was validated. The method was applied to measure surface contamination
in seven Dutch hospital pharmacies.
Results: The developed method allowed reproducible quantification of 0.50 ng/L Pt (5
pg/wipe sample). Recoveries for stainless steel and linoleum surfaces ranged between
50.4% and 81.4% for the different Pt compounds tested. Pt contamination was reported
in 88% of the wipe samples. Although a substantial variation in surface contamination of
the pharmacies was noticed, in most pharmacies, the laminar-airflow (LAF) hoods, the
floor in front of the LAF hoods, door handles, and handles of service hatches showed
positive results. This demonstrates that contamination is spread throughout the
preparation rooms. Conclusion: We developed and validated an ultrasensitive and
reliable ICP-MS method for the determination of Pt in surface samples. Surface
contamination with Pt was observed in all hospital pharmacies sampled. The
interpretation of these results is, however, complicated.
Environmental monitoring
217
Introduction
Cytotoxic drugs are widely used for the treatment of cancer. Occupational exposure to
these drugs has been recognised as a potential health hazard since 1970s [1,2]. Because
cytotoxic drugs can affect the DNA, RNA, or protein synthesis, many of these drugs are
classified as being carcinogenic, mutagenic, or teratogenic to humans [3]. Skin contact
with cytotoxic drugs, due to contamination of the work area or contamination of
packaging material, seems to play an important role in the uptake of these drugs by
hospital personnel [4,5]. Therefore, strict health and safety rules have been established
and applied for the handling of these agents. Evidently, the potential health risks for
persons manipulating cytotoxic drugs, such as pharmacists, pharmacy technicians,
nurses, and cleaners, however, still are a concern. This concern is consolidated by a
number of recent publications demonstrating workplace contamination [6-12] and
contamination of packaging of cytotoxic drugs [7,13-15]. Moreover, detection of
cytotoxic agents in urine [4,16-22] and blood [23] of personnel who were involved in
preparation or administration has been reported with increasing frequency.
The relationship between prolonged exposure to small quantities of cytotoxic drugs and
harmful effects is difficult to establish. Based on current scientific knowledge, it is
impossible to set a level of exposure that, beyond doubt, will not cause adverse effects.
Because no regulations on the maximal acceptable amount of contamination for these
drugs have been set so far, hospitals should aim for the lowest contamination as is
reasonably achievable. Monitoring of contamination, therefore, is essential. This can aid
in the identification of the main exposure routes and in assessing the effectiveness of
cleaning and working procedures. Evaluation of environmental contamination will,
moreover, lead to an increase of the consciousness among personnel, concerning the
handling of the chemotherapeutic agents. This can lead to an improvement of and the
compliance with working and cleaning procedures. Wipe sampling is a common method
to monitor surfaces for the presence of cytotoxic drugs. Hence, sensitive and validated
methods are indispensable to be able to detect the relatively low quantities of drug
present on surfaces.
Platinum (Pt) coordination complexes, such as cisplatin, oxaliplatin, and carboplatin, play
a major role in the treatment of a variety of tumours. As a result, large amounts of these
agents are processed in hospital pharmacies. Several wipe sample methods for Pt
containing drugs have been used in earlier studies and Pt was detected as a surface
contaminant in many of the workplaces [9-12] or drug vials [13,14] investigated. A
description of the validation of the analytical methods, however, has been scarce.
Validation results were mentioned briefly for the method of Ziegler et al., using electro
thermal vaporisation coupled to inductively coupled plasma mass spectrometry (ICP-
MS) [9]. Raghavan et al. described the validation of a high-performance liquid
chromatography method for the determination of cisplatin in cleaning validation
Chapter 5.1
218
samples [24]. The lower limit of quantification (LLOQ) of this method, was 500 ng/L,
which is high compared to the limits achievable with for example ICP-MS or
voltammetry. Schmaus et al. reported the validation of a voltammetric method with a
limit of quantification of 40 pg of Pt per sample [10].
In the present study, we describe the development and validation of an ICP-MS method
for the evaluation of surface contamination by Pt originating from cisplatin, oxaliplatin,
and carboplatin. ICP-MS assures an ultra high sensitivity and specificity and requires
relatively simple sample pretreatment procedures. The validated method has been
applied to measure surface contamination in seven Dutch hospital pharmacies.
Experimental
Chemicals
Cisplatin and carboplatin reference standards were purchased from Calbiochem (San
Diego, CA, USA). Oxaliplatin was obtained from Sigma-Aldrich (St. Louis, MO, USA).
Chloroplatinic acid, containing 1,000 mg/L Pt in 3.3% hydrochloric acid (HCl), used for
preparation of calibration solutions, was obtained from Inorganic Ventures/IV Labs
(Lakewood, NJ, USA). Iridium chloride, containing 1,000 mg/L iridium (Ir) in 3.3% HCl,
used for internal standardisation, was also purchased from Inorganic Ventures/IV Labs.
Nitric acid (HNO3) 70% and HCl 35% Ultrex II ultrapure reagents were obtained from
Mallinckrodt Baker (Philipsburg, NJ, USA). Water used for the ICP-MS analysis was sterile
water for irrigation (Aqua B. Braun Medical, Melsungen, Germany). Ethanol 80% was
purchased from Fresenius Kabi (Den Bosch, the Netherlands). A multi-element solution
containing 10 mg/L of Ba, Be, Ce, Co, In, Mg, Pb, Th, and Tl (VAR-TS-MS) was purchased
from Inorganic Ventures/IV Labs. Hoek Loos (Schiedam, The Netherlands) provided
argon gas (4.6) with 99.996% purity.
Instrumentation
Analyses were performed on an ICP-quadrupole-MS (Varian 810-MS) equipped with a
90° reflecting ion mirror (Varian, Mulgrave, Victoria, Australia). The sample introduction
system consisted of a Micromist glass low flow nebuliser (sample uptake 0.4 mL/min), a
peltier-cooled (4 °C) double pass glass spray chamber and a quartz torch. The spray
chamber was cooled to reduce the vapour loading on the plasma, increasing the
available energy for atomisation and ionisation of the elements of interest and to reduce
the formation of solvent based interferences. Sample transport from the SPS-3
autosampler (Varian) to the nebuliser was performed using a peristaltic pump (Watson-
Marlow Alitea, Stockholm, Sweden). The instrument was cooled by using a Kühlmobil
Environmental monitoring
219
142 VD (Van der Heijden, Dörentrup, Germany). Data were acquired and processed using
the ICP-MS Expert Software version 1.1 b49 (Varian). Further data handling was
performed using Excel 2000 (Microsoft, Redmond, WA, USA). All measurements were
carried out in a dedicated temperature-controlled, positively pressurised environment in
order to maintain optimum instrument performance and minimise exogenous
contamination. All solutions were prepared using pipettes (Falcon, Becton Dickinson
Labware, Franklin Lakes, NJ, USA) and polypropylene tubes 10 mL (Plastiques-Gosselin,
Hazebrouck Cedex, France) and 30 mL (Sarstedt AG&Co, Nümbrecht, Germany). Filters
(Minisart) used for filtration of wipe samples were obtained from Sartorius (Hannover,
Germany). Prior to method development, tubes were checked thoroughly for Pt, Ir, and
hafnium (Hf) contamination and appeared to be suitable for Pt analyses.
Determination of Pt by ICP-MS
To optimise the ICP-MS signal for the high masses and to reduce the formation of oxides,
a solution containing 1,000 ng/L of Th, In, Ce, Ba, and Pt was used. Typically this 1,000
ng/L solution gave readings of 115In: 7x10⁵ c/s; 232Th: 1x10⁶ c/s, and 194Pt: 2x10⁵ c/s. The
production of [CeO]+ was less than 1.0% of the total [Ce]+ counts. The formation of
doubly charged [Ba]2+ was less than 3%. Performance was checked daily.
The Pt isotope used for calculation of Pt concentrations was 194Pt. Ir was used as internal
standard. Detection of Pt can be subject to the interference of Hf-oxides [25]. Therefore,
Hf signals were monitored for all samples. The detection mode for all isotopes was based
on peak jumping with peak dwell times of 50 ms, 25 scans per replicate, and three
replicates per sample. Quantification was based on the mean concentration of three
replicates analysed against a calibration curve using weighted linear regression analysis.
Assay development
The most suitable wipe material, extraction solvent, and wipe solvent were selected
using one surface sampling and extraction procedure. This will be described below.
Recovery data were assessed for the three most commonly used Pt agents; cisplatin,
oxaliplatin, and carboplatin. The different molecular structures and the variable physical
characteristics might lead to a variation in absorption and extraction characteristics,
therefore, we decided to evaluate all three compounds instead of choosing one
reference compound.
Chapter 5.1
220
Surface sampling and extraction procedure
Each wipe tissue was moistened with 500 µL wipe solvent. In general, sampling was
performed by wiping a defined surface area of 10x10 cm. However, for surfaces for
which it was not possible to take a 10x10 cm sample, the complete top of the device was
sampled and the area was estimated. All wipe samples were collected with a uniform
sampling procedure by wiping in three different directions (vertical, horizontal, and
diagonal). Wipe samples were stored in 50 mL disposable polypropylene flasks (Falcon,
Becton Dickinson Labware, Franklin Lakes, NJ, USA) at –20 °C until further processing.
Prior to analysis, 10 mL of extraction solvent was added to the sample and flasks were
kept in an ultrasonic bath for 60 min. Then, samples were filtered to remove particles
which could possibly obstruct the ICP-MS nebuliser, or could interfere with the analysis.
Two millilitres of sample were, after addition of Ir as internal standard, introduced
directly into the ICP-MS. Samples of locations which were expected to be highly
contaminated, were diluted prior to analysis to minimise washout memory effects of the
sample introduction system of the ICP-MS.
Wipe material
A variety of wipe tissues are available for collecting samples of surface contaminants
These vary in type of material, surface area, and content of Pt contaminants. Three types
of tissues were evaluated for this study; Kimtech Science precision tissues (Kimberley-
Clark Professional, Irving, TX, USA), Whatman glass fiber filters (Schleicher&Schuell
Microscience GmbH, Dassel, Germany), and Klinion non-woven gauzes (Medeco, Oud-
Beijerland, the Netherlands). The tissues were checked for Pt contamination and for their
ability to release Pt from stainless steel surfaces.
Extraction solvent
One percent HNO3 (v/v), 5% HNO3 (v/v), and 1% HCl (v/v) were evaluated as extraction
solutions. Kimtech Science precision tissues were spiked with cisplatin, oxaliplatin, and
carboplatin and the Pt recovery was determined after extraction with 10 mL of each
solvent.
Wipe solvent
Initially, water, 1% HCl, and 80% ethanol were selected as wiping solutions. To
investigate the capability of these solutions to effectively wipe surfaces, 100 cm2
stainless steel surfaces were spiked with cisplatin, oxaliplatin, and carboplatin. These
Environmental monitoring
221
surfaces were subsequently wiped and the material collected by wiping the surface was
extracted from the wipe using a 1% HCl solution.
Validation procedures
Linearity
For calibration, the chloroplatinic acid reference solution containing 1,000 mg/L Pt was
diluted with 1% HCl to obtain working solutions with concentrations ranging from 50.0
to 5.00x10³ ng/L Pt. Working solutions were diluted with 1% HCl to obtain calibration
standards, ranging from 0.500 to 100 ng/L Pt. Before analysis, 15 µL of Ir internal
standard solution was added to 1.5 mL of each calibration standard (final internal
standard concentration 100 ng/L). The seven non-zero calibration standards were
processed and analysed in singular in three separate analytical runs. The calibrations
were back-calculated from the responses. Deviations from the nominal concentration
were evaluated.
Recovery and precision
Quality control (QC) samples were prepared to obtain information on the recovery and
precision of the extraction method and Pt analysis. These samples were analysed in the
validation runs and subsequently also during the analysis of the wipe samples of each
hospital pharmacy. Therefore, stock solutions of the Pt agents in water, each containing
a concentration of drug equivalent to 400 mg/L Pt, were prepared. These stock solutions
were further diluted to obtain spiking solutions with concentrations ranging from 10.0
to 2.00x10³ ng/L. Tissues were spiked with these solutions serving as QC samples at the
following concentration levels; 5.00x10⁻³, 2.5x10⁻², 0.100, and 1.00 ng Pt on the tissues,
corresponding to 0.500, 2.50, 10.0, and 100 ng/L Pt in the final solution. These tissues
were processed as described earlier. Three replicates of each sample were analysed in
three analytical runs. Recovery was expressed as a percentage of the nominal
concentration. Within-run and between-run precisions were calculated by analysis of
variances (ANOVA) for each test concentration using the analytical run as the grouping
variable.
Two of the most important surfaces, stainless steel and linoleum, were used to obtain
information on the recovery and within-run and between-run precisions of the complete
sampling procedure, including both wiping and extraction. Therefore, 1.00 ng of
cisplatin, oxaliplatin, or carboplatin was pipetted in triplicate on a 100 cm2 stainless steel
and linoleum surface. After drying overnight, surfaces were wiped following the
previously described procedure and analysed using ICP-MS. Three replicates of each
sample were analysed in three analytical runs for both surfaces. The recovery was
Chapter 5.1
222
expressed as a percentage of the nominal concentration. The within-run and between-
run precision were calculated ANOVA for each test concentration using the analytical
run as the grouping variable.
Limit of quantification
The LLOQ was defined as the concentration at which the analyte response was at least
five times the response of a blank wipe sample. Besides, the LLOQ, when spiked on blank
tissues, had to be determined with a precision less than 20% and the mean value should
not deviate more than 20% of the actual value.
Stability
Stability of cisplatin, oxaliplatin, and carboplatin spiked to tissues, at two concentration
levels, was evaluated at ambient temperatures for one week and under storage
conditions (-20 °C) for up to three weeks. From each storage condition two wipe samples
were analysed. Samples were considered stable when 80-120% of the initial
concentration was recovered.
Pt determination in pharmacy facilities where no cytotoxic agents are processed
Pt is an element that not only appears in the environment due to contamination with Pt
containing cytotoxic drugs, but also due to pollution by car exhaust catalysts. As a
consequence, road dust also contains Pt [26]. Even though, in the pharmacy facilities,
precautions (use of slippers/clogs) are taken to reduce the chance of contamination of
the facility, road dust contamination might occur. Because ICP-MS does not differentiate
between the sources of elemental Pt, this should be taken into account when
considering this technique for evaluation of environmental contamination by cytotoxic
Pt agents. Therefore, two additional locations were included in this study to set a
threshold below which it was not possible to address the source of the contamination.
The first location was the laminar-airflow (LAF) hood in a clean room in which no Pt
contamination was expected. The second location was a preparation unit with LAF hood
of a public pharmacy.
Monitoring of surface contamination in seven Dutch hospital pharmacies
The wipe samples were taken in seven hospital pharmacies in the Netherlands.
Characteristics of the facilities are shown in Table 1. The facilities were selected to
provide a representation of the diversity in hospital pharmacies in the Netherlands in
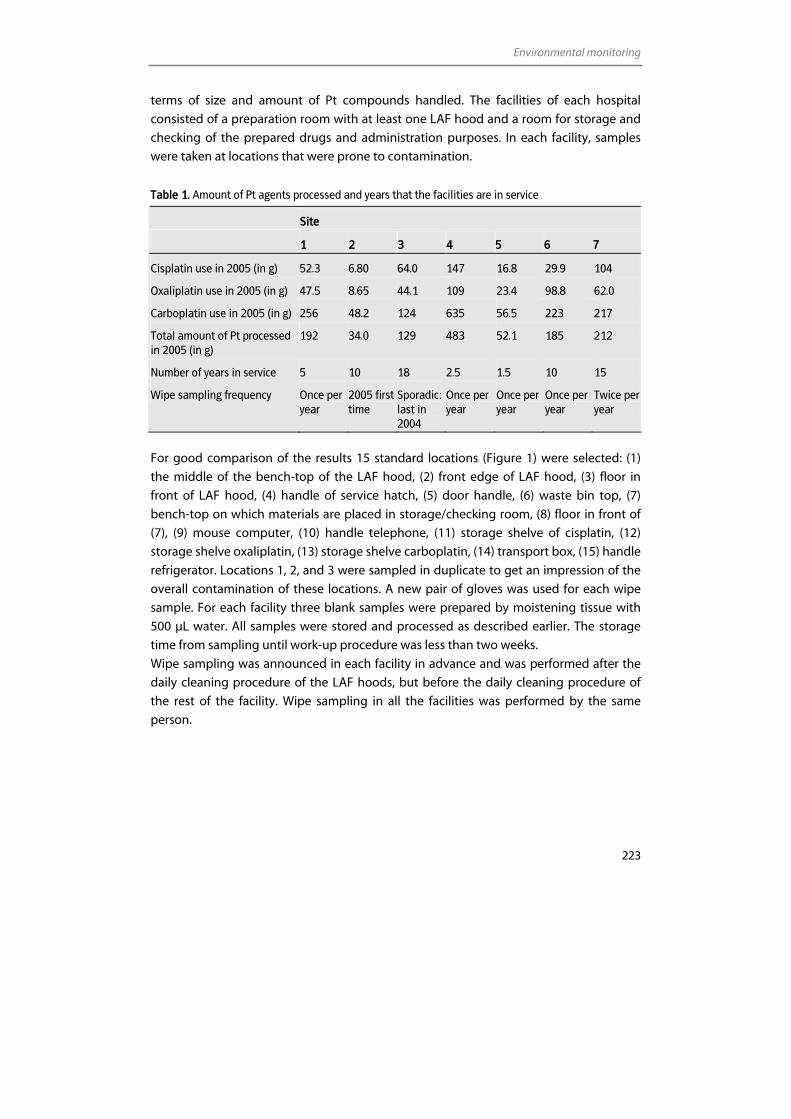
Environmental monitoring
223
terms of size and amount of Pt compounds handled. The facilities of each hospital
consisted of a preparation room with at least one LAF hood and a room for storage and
checking of the prepared drugs and administration purposes. In each facility, samples
were taken at locations that were prone to contamination.
Table 1. Amount of Pt agents processed and years that the facilities are in service
Site
1 2 3 4 5 6 7
Cisplatin use in 2005 (in g) 52.3 6.80 64.0 147 16.8 29.9 104
Oxaliplatin use in 2005 (in g) 47.5 8.65 44.1 109 23.4 98.8 62.0
Carboplatin use in 2005 (in g) 256 48.2 124 635 56.5 223 217
Total amount of Pt processed in 2005 (in g)
192 34.0 129 483 52.1 185 212
Number of years in service 5 10 18 2.5 1.5 10 15
Wipe sampling frequency Once per year
2005 first time
Sporadic: last in 2004
Once per year
Once per year
Once per year
Twice per year
For good comparison of the results 15 standard locations (Figure 1) were selected: (1)
the middle of the bench-top of the LAF hood, (2) front edge of LAF hood, (3) floor in
front of LAF hood, (4) handle of service hatch, (5) door handle, (6) waste bin top, (7)
bench-top on which materials are placed in storage/checking room, (8) floor in front of
(7), (9) mouse computer, (10) handle telephone, (11) storage shelve of cisplatin, (12)
storage shelve oxaliplatin, (13) storage shelve carboplatin, (14) transport box, (15) handle
refrigerator. Locations 1, 2, and 3 were sampled in duplicate to get an impression of the
overall contamination of these locations. A new pair of gloves was used for each wipe
sample. For each facility three blank samples were prepared by moistening tissue with
500 µL water. All samples were stored and processed as described earlier. The storage
time from sampling until work-up procedure was less than two weeks.
Wipe sampling was announced in each facility in advance and was performed after the
daily cleaning procedure of the LAF hoods, but before the daily cleaning procedure of
the rest of the facility. Wipe sampling in all the facilities was performed by the same
person.
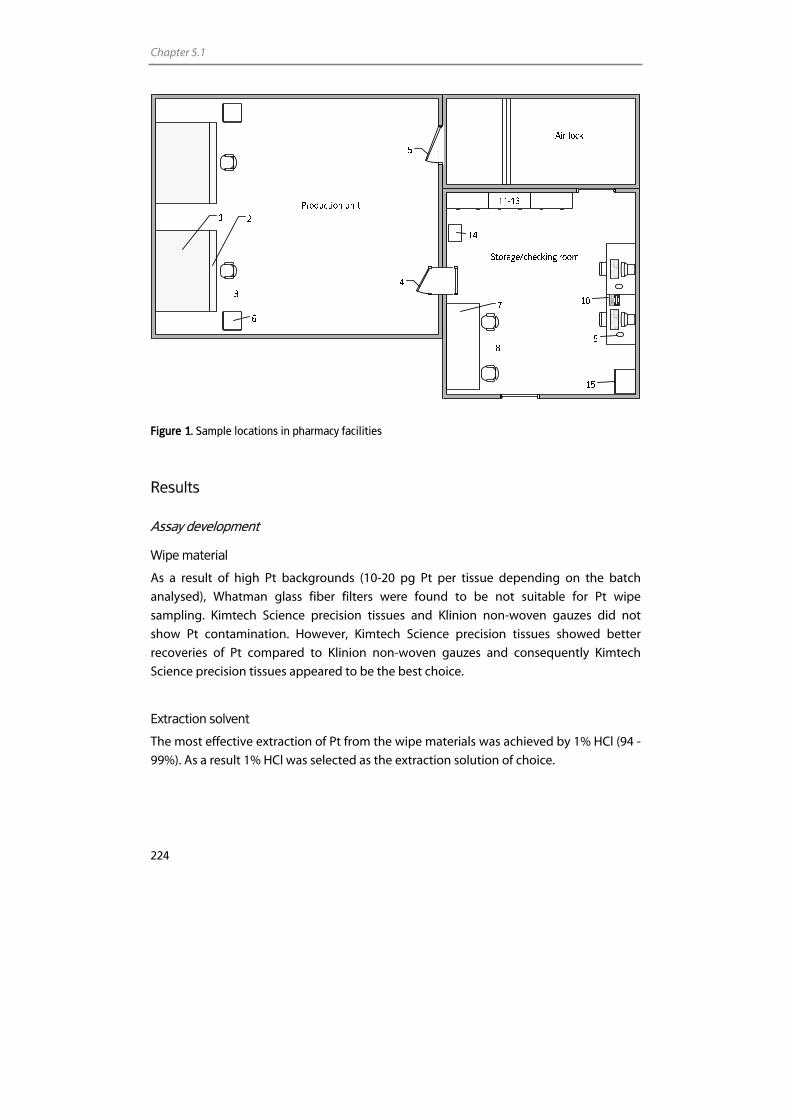
Chapter 5.1
224
Figure 1. Sample locations in pharmacy facilities
Results
Assay development
Wipe material
As a result of high Pt backgrounds (10-20 pg Pt per tissue depending on the batch
analysed), Whatman glass fiber filters were found to be not suitable for Pt wipe
sampling. Kimtech Science precision tissues and Klinion non-woven gauzes did not
show Pt contamination. However, Kimtech Science precision tissues showed better
recoveries of Pt compared to Klinion non-woven gauzes and consequently Kimtech
Science precision tissues appeared to be the best choice.
Extraction solvent
The most effective extraction of Pt from the wipe materials was achieved by 1% HCl (94 -
99%). As a result 1% HCl was selected as the extraction solution of choice.
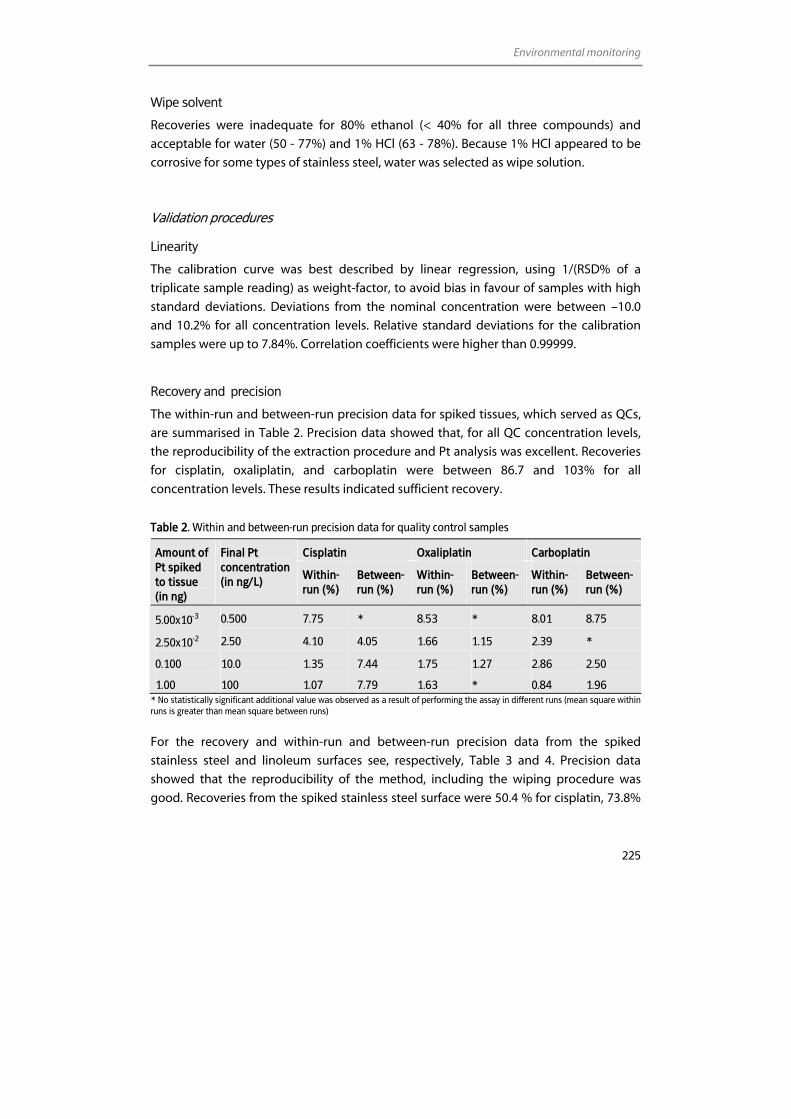
Environmental monitoring
225
Wipe solvent
Recoveries were inadequate for 80% ethanol (< 40% for all three compounds) and
acceptable for water (50 - 77%) and 1% HCl (63 - 78%). Because 1% HCl appeared to be
corrosive for some types of stainless steel, water was selected as wipe solution.
Validation procedures
Linearity
The calibration curve was best described by linear regression, using 1/(RSD% of a
triplicate sample reading) as weight-factor, to avoid bias in favour of samples with high
standard deviations. Deviations from the nominal concentration were between –10.0
and 10.2% for all concentration levels. Relative standard deviations for the calibration
samples were up to 7.84%. Correlation coefficients were higher than 0.99999.
Recovery and precision
The within-run and between-run precision data for spiked tissues, which served as QCs,
are summarised in Table 2. Precision data showed that, for all QC concentration levels,
the reproducibility of the extraction procedure and Pt analysis was excellent. Recoveries
for cisplatin, oxaliplatin, and carboplatin were between 86.7 and 103% for all
concentration levels. These results indicated sufficient recovery.
Table 2. Within and between-run precision data for quality control samples
Cisplatin Oxaliplatin Carboplatin Amount of Pt spiked to tissue (in ng)
Final Pt concentration (in ng/L) Within-
run (%) Between-run (%)
Within-run (%)
Between-run (%)
Within-run (%)
Between-run (%)
5.00x10⁻³ 0.500 7.75 * 8.53 * 8.01 8.75
2.50x10⁻² 2.50 4.10 4.05 1.66 1.15 2.39 *
0.100 10.0 1.35 7.44 1.75 1.27 2.86 2.50
1.00 100 1.07 7.79 1.63 * 0.84 1.96 * No statistically significant additional value was observed as a result of performing the assay in different runs (mean square within runs is greater than mean square between runs)
For the recovery and within-run and between-run precision data from the spiked
stainless steel and linoleum surfaces see, respectively, Table 3 and 4. Precision data
showed that the reproducibility of the method, including the wiping procedure was
good. Recoveries from the spiked stainless steel surface were 50.4 % for cisplatin, 73.8%
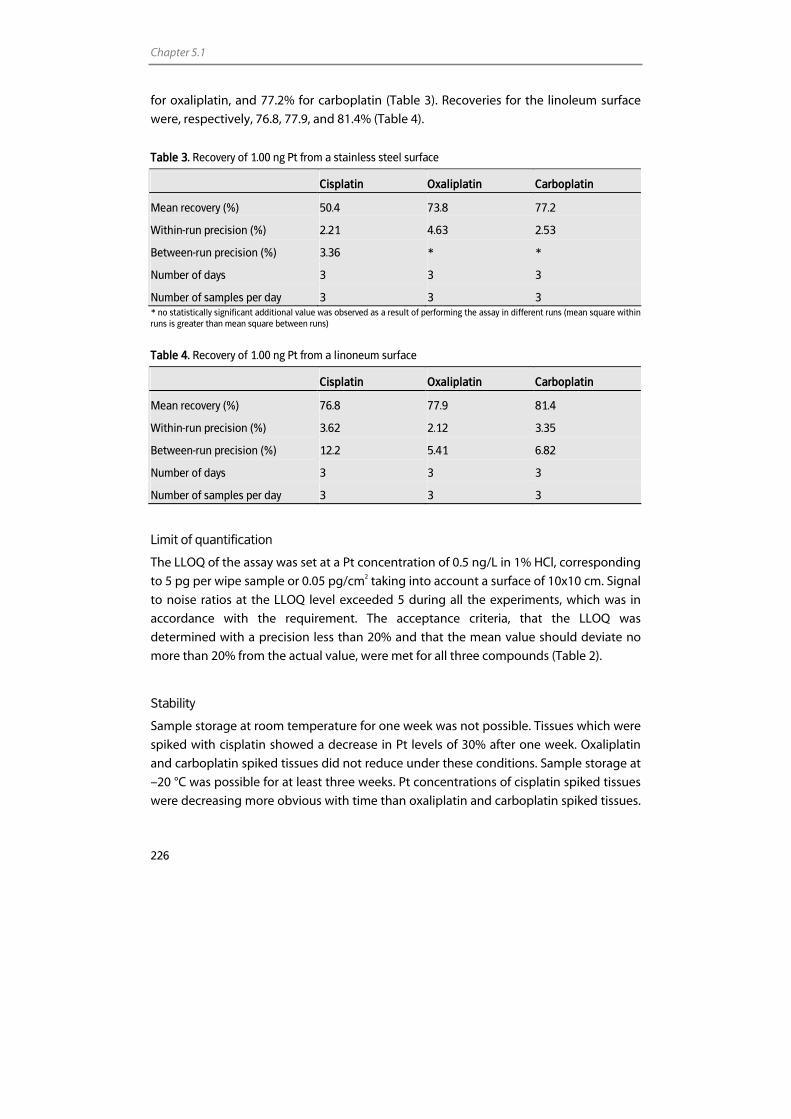
Chapter 5.1
226
for oxaliplatin, and 77.2% for carboplatin (Table 3). Recoveries for the linoleum surface
were, respectively, 76.8, 77.9, and 81.4% (Table 4).
Table 3. Recovery of 1.00 ng Pt from a stainless steel surface
Cisplatin Oxaliplatin Carboplatin
Mean recovery (%) 50.4 73.8 77.2
Within-run precision (%) 2.21 4.63 2.53
Between-run precision (%) 3.36 * *
Number of days 3 3 3
Number of samples per day 3 3 3 * no statistically significant additional value was observed as a result of performing the assay in different runs (mean square within runs is greater than mean square between runs)
Table 4. Recovery of 1.00 ng Pt from a linoneum surface
Cisplatin Oxaliplatin Carboplatin
Mean recovery (%) 76.8 77.9 81.4
Within-run precision (%) 3.62 2.12 3.35
Between-run precision (%) 12.2 5.41 6.82
Number of days 3 3 3
Number of samples per day 3 3 3
Limit of quantification
The LLOQ of the assay was set at a Pt concentration of 0.5 ng/L in 1% HCl, corresponding
to 5 pg per wipe sample or 0.05 pg/cm2 taking into account a surface of 10x10 cm. Signal
to noise ratios at the LLOQ level exceeded 5 during all the experiments, which was in
accordance with the requirement. The acceptance criteria, that the LLOQ was
determined with a precision less than 20% and that the mean value should deviate no
more than 20% from the actual value, were met for all three compounds (Table 2).
Stability
Sample storage at room temperature for one week was not possible. Tissues which were
spiked with cisplatin showed a decrease in Pt levels of 30% after one week. Oxaliplatin
and carboplatin spiked tissues did not reduce under these conditions. Sample storage at
–20 °C was possible for at least three weeks. Pt concentrations of cisplatin spiked tissues
were decreasing more obvious with time than oxaliplatin and carboplatin spiked tissues.
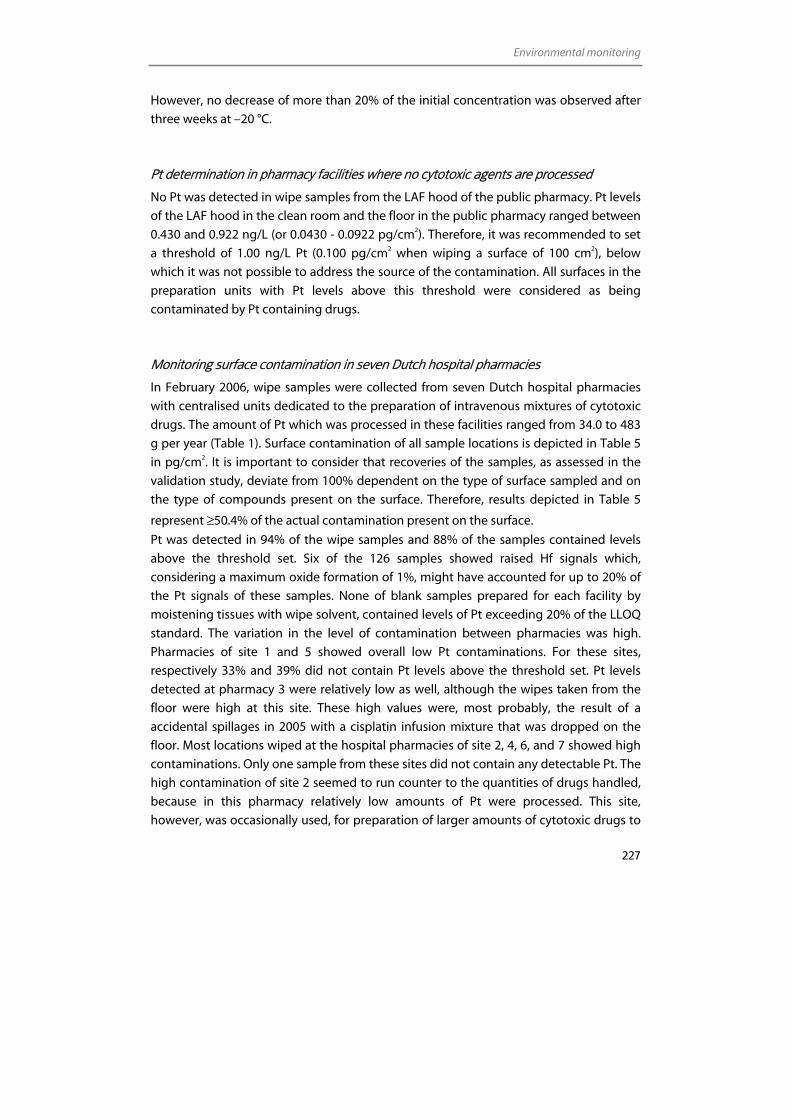
Environmental monitoring
227
However, no decrease of more than 20% of the initial concentration was observed after
three weeks at –20 °C.
Pt determination in pharmacy facilities where no cytotoxic agents are processed
No Pt was detected in wipe samples from the LAF hood of the public pharmacy. Pt levels
of the LAF hood in the clean room and the floor in the public pharmacy ranged between
0.430 and 0.922 ng/L (or 0.0430 - 0.0922 pg/cm2). Therefore, it was recommended to set
a threshold of 1.00 ng/L Pt (0.100 pg/cm2 when wiping a surface of 100 cm2), below
which it was not possible to address the source of the contamination. All surfaces in the
preparation units with Pt levels above this threshold were considered as being
contaminated by Pt containing drugs.
Monitoring surface contamination in seven Dutch hospital pharmacies
In February 2006, wipe samples were collected from seven Dutch hospital pharmacies
with centralised units dedicated to the preparation of intravenous mixtures of cytotoxic
drugs. The amount of Pt which was processed in these facilities ranged from 34.0 to 483
g per year (Table 1). Surface contamination of all sample locations is depicted in Table 5
in pg/cm2. It is important to consider that recoveries of the samples, as assessed in the
validation study, deviate from 100% dependent on the type of surface sampled and on
the type of compounds present on the surface. Therefore, results depicted in Table 5
represent ≥50.4% of the actual contamination present on the surface.
Pt was detected in 94% of the wipe samples and 88% of the samples contained levels
above the threshold set. Six of the 126 samples showed raised Hf signals which,
considering a maximum oxide formation of 1%, might have accounted for up to 20% of
the Pt signals of these samples. None of blank samples prepared for each facility by
moistening tissues with wipe solvent, contained levels of Pt exceeding 20% of the LLOQ
standard. The variation in the level of contamination between pharmacies was high.
Pharmacies of site 1 and 5 showed overall low Pt contaminations. For these sites,
respectively 33% and 39% did not contain Pt levels above the threshold set. Pt levels
detected at pharmacy 3 were relatively low as well, although the wipes taken from the
floor were high at this site. These high values were, most probably, the result of a
accidental spillages in 2005 with a cisplatin infusion mixture that was dropped on the
floor. Most locations wiped at the hospital pharmacies of site 2, 4, 6, and 7 showed high
contaminations. Only one sample from these sites did not contain any detectable Pt. The
high contamination of site 2 seemed to run counter to the quantities of drugs handled,
because in this pharmacy relatively low amounts of Pt were processed. This site,
however, was occasionally used, for preparation of larger amounts of cytotoxic drugs to
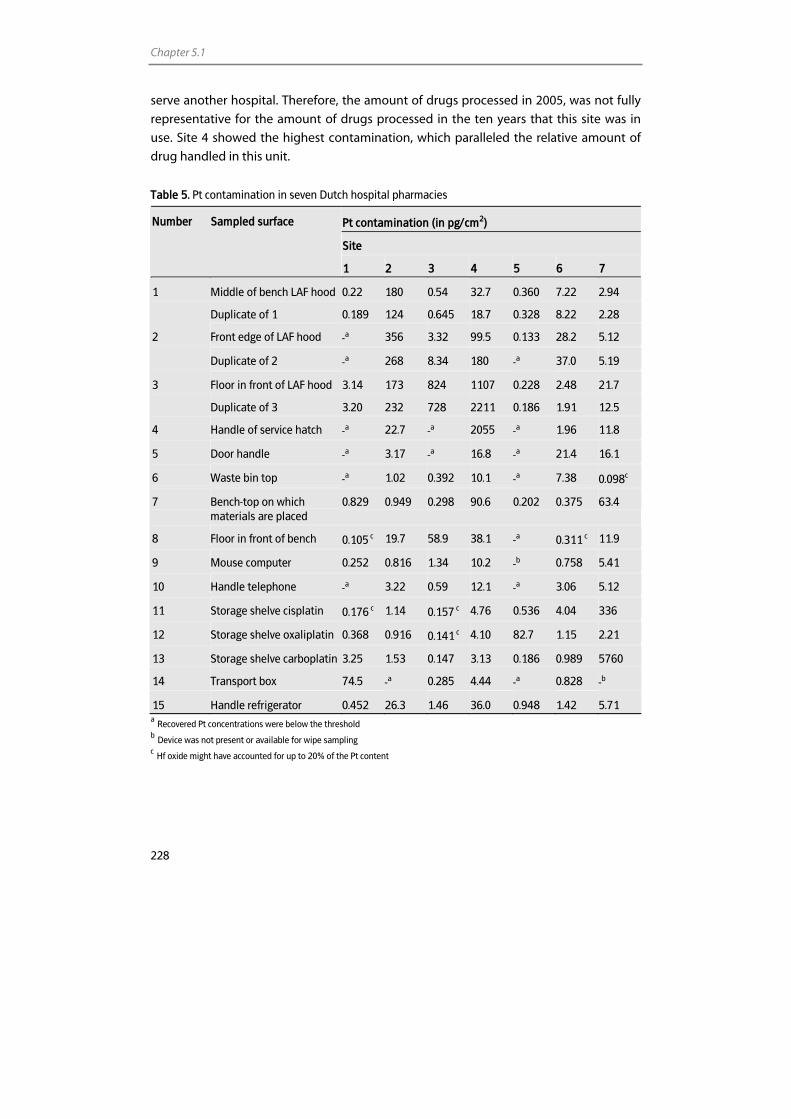
Chapter 5.1
228
serve another hospital. Therefore, the amount of drugs processed in 2005, was not fully
representative for the amount of drugs processed in the ten years that this site was in
use. Site 4 showed the highest contamination, which paralleled the relative amount of
drug handled in this unit.
Table 5. Pt contamination in seven Dutch hospital pharmacies
Pt contamination (in pg/cm2)
Site
Number Sampled surface
1 2 3 4 5 6 7
1 Middle of bench LAF hood 0.22 180 0.54 32.7 0.360 7.22 2.94
Duplicate of 1 0.189 124 0.645 18.7 0.328 8.22 2.28
2 Front edge of LAF hood -a 356 3.32 99.5 0.133 28.2 5.12
Duplicate of 2 -a 268 8.34 180 -a 37.0 5.19
3 Floor in front of LAF hood 3.14 173 824 1107 0.228 2.48 21.7
Duplicate of 3 3.20 232 728 2211 0.186 1.91 12.5
4 Handle of service hatch -a 22.7 -a 2055 -a 1.96 11.8
5 Door handle -a 3.17 -a 16.8 -a 21.4 16.1
6 Waste bin top -a 1.02 0.392 10.1 -a 7.38 0.098c
7 Bench-top on which materials are placed
0.829 0.949 0.298 90.6 0.202 0.375 63.4
8 Floor in front of bench 0.105 c 19.7 58.9 38.1 -a 0.311 c 11.9
9 Mouse computer 0.252 0.816 1.34 10.2 -b 0.758 5.41
10 Handle telephone -a 3.22 0.59 12.1 -a 3.06 5.12
11 Storage shelve cisplatin 0.176 c 1.14 0.157 c 4.76 0.536 4.04 336
12 Storage shelve oxaliplatin 0.368 0.916 0.141 c 4.10 82.7 1.15 2.21
13 Storage shelve carboplatin 3.25 1.53 0.147 3.13 0.186 0.989 5760
14 Transport box 74.5 -a 0.285 4.44 -a 0.828 -b
15 Handle refrigerator 0.452 26.3 1.46 36.0 0.948 1.42 5.71 a Recovered Pt concentrations were below the threshold b Device was not present or available for wipe sampling c Hf oxide might have accounted for up to 20% of the Pt content
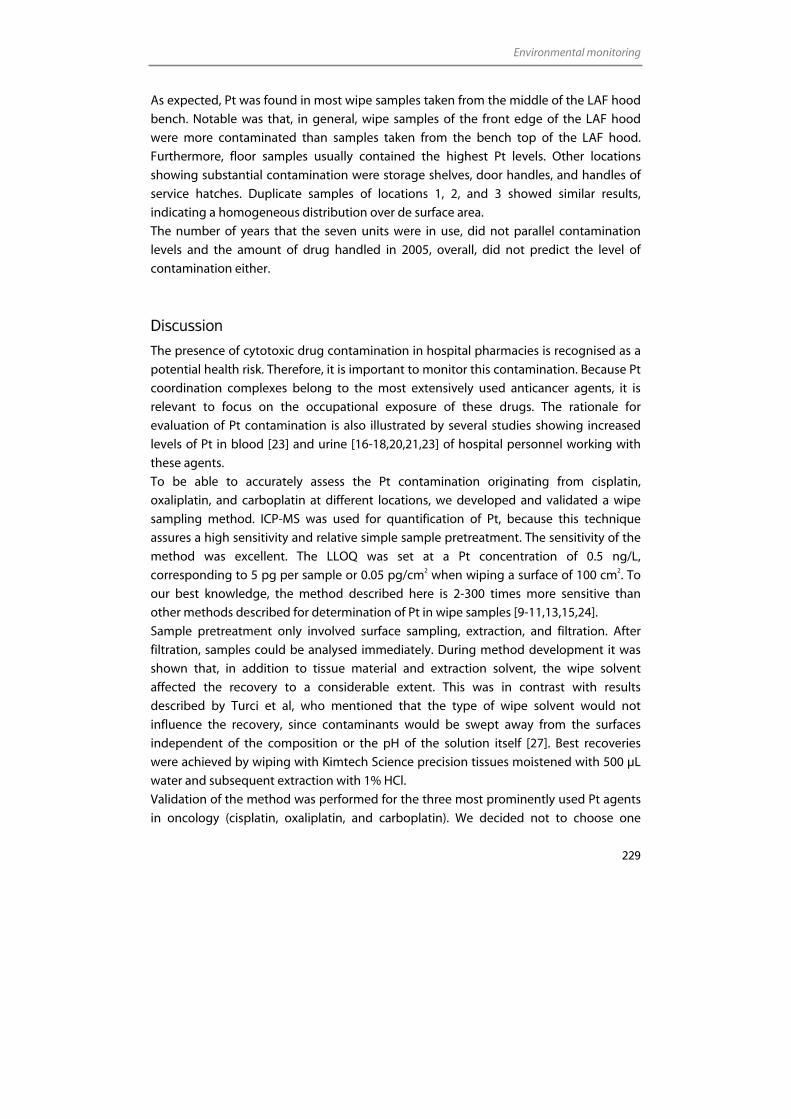
Environmental monitoring
229
As expected, Pt was found in most wipe samples taken from the middle of the LAF hood
bench. Notable was that, in general, wipe samples of the front edge of the LAF hood
were more contaminated than samples taken from the bench top of the LAF hood.
Furthermore, floor samples usually contained the highest Pt levels. Other locations
showing substantial contamination were storage shelves, door handles, and handles of
service hatches. Duplicate samples of locations 1, 2, and 3 showed similar results,
indicating a homogeneous distribution over de surface area.
The number of years that the seven units were in use, did not parallel contamination
levels and the amount of drug handled in 2005, overall, did not predict the level of
contamination either.
Discussion
The presence of cytotoxic drug contamination in hospital pharmacies is recognised as a
potential health risk. Therefore, it is important to monitor this contamination. Because Pt
coordination complexes belong to the most extensively used anticancer agents, it is
relevant to focus on the occupational exposure of these drugs. The rationale for
evaluation of Pt contamination is also illustrated by several studies showing increased
levels of Pt in blood [23] and urine [16-18,20,21,23] of hospital personnel working with
these agents.
To be able to accurately assess the Pt contamination originating from cisplatin,
oxaliplatin, and carboplatin at different locations, we developed and validated a wipe
sampling method. ICP-MS was used for quantification of Pt, because this technique
assures a high sensitivity and relative simple sample pretreatment. The sensitivity of the
method was excellent. The LLOQ was set at a Pt concentration of 0.5 ng/L,
corresponding to 5 pg per sample or 0.05 pg/cm2 when wiping a surface of 100 cm2. To
our best knowledge, the method described here is 2-300 times more sensitive than
other methods described for determination of Pt in wipe samples [9-11,13,15,24].
Sample pretreatment only involved surface sampling, extraction, and filtration. After
filtration, samples could be analysed immediately. During method development it was
shown that, in addition to tissue material and extraction solvent, the wipe solvent
affected the recovery to a considerable extent. This was in contrast with results
described by Turci et al, who mentioned that the type of wipe solvent would not
influence the recovery, since contaminants would be swept away from the surfaces
independent of the composition or the pH of the solution itself [27]. Best recoveries
were achieved by wiping with Kimtech Science precision tissues moistened with 500 µL
water and subsequent extraction with 1% HCl.
Validation of the method was performed for the three most prominently used Pt agents
in oncology (cisplatin, oxaliplatin, and carboplatin). We decided not to choose one
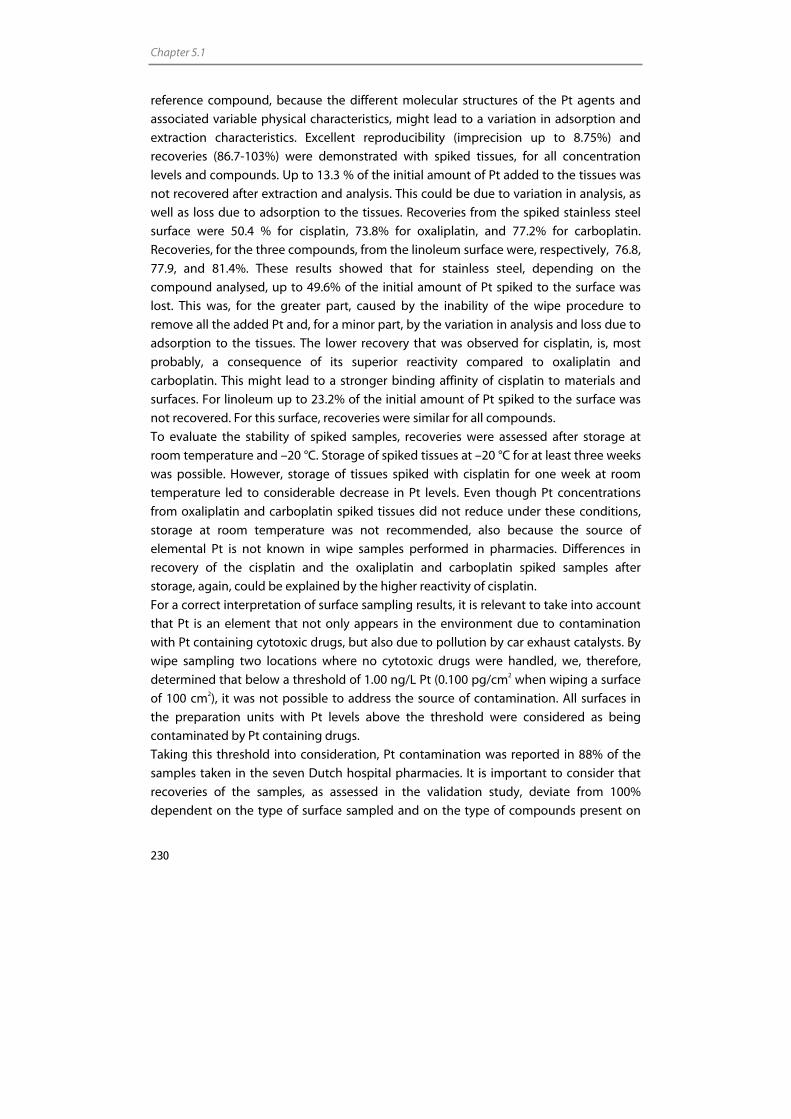
Chapter 5.1
230
reference compound, because the different molecular structures of the Pt agents and
associated variable physical characteristics, might lead to a variation in adsorption and
extraction characteristics. Excellent reproducibility (imprecision up to 8.75%) and
recoveries (86.7-103%) were demonstrated with spiked tissues, for all concentration
levels and compounds. Up to 13.3 % of the initial amount of Pt added to the tissues was
not recovered after extraction and analysis. This could be due to variation in analysis, as
well as loss due to adsorption to the tissues. Recoveries from the spiked stainless steel
surface were 50.4 % for cisplatin, 73.8% for oxaliplatin, and 77.2% for carboplatin.
Recoveries, for the three compounds, from the linoleum surface were, respectively, 76.8,
77.9, and 81.4%. These results showed that for stainless steel, depending on the
compound analysed, up to 49.6% of the initial amount of Pt spiked to the surface was
lost. This was, for the greater part, caused by the inability of the wipe procedure to
remove all the added Pt and, for a minor part, by the variation in analysis and loss due to
adsorption to the tissues. The lower recovery that was observed for cisplatin, is, most
probably, a consequence of its superior reactivity compared to oxaliplatin and
carboplatin. This might lead to a stronger binding affinity of cisplatin to materials and
surfaces. For linoleum up to 23.2% of the initial amount of Pt spiked to the surface was
not recovered. For this surface, recoveries were similar for all compounds.
To evaluate the stability of spiked samples, recoveries were assessed after storage at
room temperature and –20 °C. Storage of spiked tissues at –20 °C for at least three weeks
was possible. However, storage of tissues spiked with cisplatin for one week at room
temperature led to considerable decrease in Pt levels. Even though Pt concentrations
from oxaliplatin and carboplatin spiked tissues did not reduce under these conditions,
storage at room temperature was not recommended, also because the source of
elemental Pt is not known in wipe samples performed in pharmacies. Differences in
recovery of the cisplatin and the oxaliplatin and carboplatin spiked samples after
storage, again, could be explained by the higher reactivity of cisplatin.
For a correct interpretation of surface sampling results, it is relevant to take into account
that Pt is an element that not only appears in the environment due to contamination
with Pt containing cytotoxic drugs, but also due to pollution by car exhaust catalysts. By
wipe sampling two locations where no cytotoxic drugs were handled, we, therefore,
determined that below a threshold of 1.00 ng/L Pt (0.100 pg/cm2 when wiping a surface
of 100 cm2), it was not possible to address the source of contamination. All surfaces in
the preparation units with Pt levels above the threshold were considered as being
contaminated by Pt containing drugs.
Taking this threshold into consideration, Pt contamination was reported in 88% of the
samples taken in the seven Dutch hospital pharmacies. It is important to consider that
recoveries of the samples, as assessed in the validation study, deviate from 100%
dependent on the type of surface sampled and on the type of compounds present on
Environmental monitoring
231
the surface. Therefore, results depicted in Table 5 represent ≥50.4 of the actual
contamination present on the surface.
The results of this study indicate that there is substantial variation in surface
contamination of the pharmacies tested and that the amount of Pt processed in the
pharmacies did not always parallel the level of contamination. The number of
preparations with Pt drugs was, however, not assessed and might also be related to
surface contamination. This suggests that variation in the application of or compliance
with cleaning and working procedures and the incidence of calamities, rather than the
amount of Pt processed, caused variation in surface contamination.
In general, results revealed that the LAF hoods, the floor in front of the LAF hoods, door
handles, and handles of service hatches were often contaminated. This demonstrates
that contamination is often spread throughout the pharmacy. Notable was that wipe
samples of the front edge of the LAF hood were more contaminated than samples from
the bench top of the LAF hood. This is thought to be due to incorrect application of
working procedures or insufficient cleaning.
By taking duplicate wipe samples of the LAF hood, the front edge of the LAF hood, and
the floor, we demonstrated that these locations were overall contaminated and that
contamination did not appear to be spotty as was mentioned by Zeedijk et al [6].
We also investigated storage shelves and, in most pharmacies, considerable Pt
contamination was found. These elevated levels could be a consequence of elevated
levels of Pt on packaging material [13-15]. Contamination of packaging can lead to a
spread of cytotoxic drugs to locations where the drugs are stored or processed.
Therefore, it was not surprising that the storage shelves of Pt agents were contaminated.
Furthermore, it was noticed that in at least one of the hospital pharmacies (at site 4),
secondary packaging and caps of the vials were discarded onto the floor during
preparation, most probably to prevent the packaging from interfering with preparation
activities. This pharmacy indeed showed considerable contamination of the floor.
In our study, surfaces showed Pt contamination of up to 5,760 pg/cm2. The results are in
the same range as findings of some other studies describing surface contamination of Pt
in hospital pharmacies [10,12]. In the study of Leboucher et al, however, no Pt was found
outside the LAF hood, which could be due to the high detection limit of the atomic
absorption spectrometry method used (10 µg/L) [12]. Schmaus et al. performed a study
in 14 hospital pharmacies and all samples tested positive for Pt [10], even though the
LLOQ of their method was eight times higher than of the method described here.
Although not all samples tested positive for Pt in our study, the highest contamination
found (5760 pg/cm2) was comparable to the highest contamination found by Schmaus
et al. (2700 pg/cm2). Mason et al. showed lower contamination levels than found in our
study [11], even though the amount of drug handled in these pharmacies was higher
than in the pharmacies in our study.
Chapter 5.1
232
When comparing the amounts of Pt detected on different locations in this study (up to
0.576 µg per wipe sample) with the Pt content of one vial (between 6.50 and 237 mg Pt),
contamination seems to be relatively low. Furthermore, the extremely sensitive
technique used in this study, leads to a high percentage of positive samples.
Interpretation of these results is rather complicated. It is important to consider that the
total area of the contamination is large and that pharmacy personnel are exposed to the
contamination daily. Hence, for safety precautions, it is recommended to attempt to
achieve the lowest possible contamination. Environmental monitoring therefore, may be
used to monitor and control contamination and thereby evaluate working and cleaning
procedures, rather than to interpret potential health risks.
In general, when a minimal contamination level is desired, the results of this study
demonstrate that cleaning and working procedures do not sufficiently prevent
contamination in most hospitals. This could be due to an inadequate compliance of
personnel with these procedures. Moreover, contamination can spread out
unconsciously by hands or feet of the personnel. It is also likely that cleaning procedures
as applied in the different pharmacies are not fully optimised and validated, leading to
contamination due to sub-optimal cleaning. With respect to the physical properties of
the different cytotoxic drugs, it is recommended to consider cleaning techniques
appropriate for specific agents. As was shown in this study for Pt, for instance, 80%
ethanol did not effectively remove Pt from a stainless steel surface. Although water gave
better recoveries for Pt, it was not capable of removing all of the added Pt from the
stainless steel surface. This illustrates the importance to evaluate several cleaning
procedures for the different cytotoxic agents handled and to optimise a procedure
which does remove all drugs with acceptable recoveries.
Conclusion
We developed and validated an ultrasensitive and reliable ICP-MS method for the
determination of Pt in surface samples. This method was successfully applied in the
evaluation of Pt contamination in the preparation units of seven Dutch hospital
pharmacies. It was demonstrated that pharmacy personnel is at risk to be exposed to Pt,
despite the use of cleaning and safety procedures. As long as the consequences of long-
term exposure are not known, the aim should be to achieve a contamination levels as
low as possible. This study, therefore, highlights the need to further evaluate cleaning
and safety procedures. Wipe sampling can be applied to quantify improvements made
through changes in procedures.
Environmental monitoring
233
References 1. Donner AL. Possible risk of working with antineoplastic drugs in horizontal laminar flow hoods. Am J
Hosp Pharm 1978; 35: 900.
2. Falck K, Grohn P, Sorsa M, Vainio H, Heinonen E, Holsti LR. Mutagenicity in urine of nurses handling cytostatic drugs. Lancet 1979; 1: 1250-1.
3. International Agency for Research on Cancer (IARC). Monographs on the evaluation of the carcinogenic risks of chemicals to humans: overall evaluations of carcinogenicity. Updation of IARC monographs Vols 1-42. Lyon, France. http://www iarc fr 1997.
4. Sessink PJ, Van de Kerkhof MC, Anzion RB, Noordhoek J, Bos RP. Environmental contamination and assessment of exposure to antineoplastic agents by determination of cyclophosphamide in urine of exposed pharmacy technicians: is skin absorption an important exposure route? Arch Environ Health 1994; 49: 165-9.
5. Fransman W, Vermeulen R, Kromhout H. Occupational dermal exposure to cyclophosphamide in Dutch hospitals: a pilot study. Ann Occup Hyg 2004; 48: 237-44.
6. Zeedijk M, Greijdanus B, Steenstra FB, Uges DRA. Monitoring of cytostatics on the hospital ward: Measuring surface contamination of four different cytostatic drugs from one wipe sample. The European Journal of Hospital Pharmacy Science 2005; 11: 18-22.
7. Hedmer M, Georgiadi A, Bremberg ER, Jonsson BA, Eksborg S. Surface contamination of cyclophosphamide packaging and surface contamination with antineoplastic drugs in a hospital pharmacy in Sweden. Ann Occup Hyg 2005; 49: 629-37.
8. Crauste-Manciet S, Sessink PJ, Ferrari S, Jomier JY, Brossard D. Environmental contamination with cytotoxic drugs in healthcare using positive air pressure isolators. Ann Occup Hyg 2005; 49: 619-28.
9. Ziegler E, Mason HJ, Baxter PJ. Occupational exposure to cytotoxic drugs in two UK oncology wards. Occup Environ Med 2002; 59: 608-12.
10. Schmaus G, Schierl R, Funck S. Monitoring surface contamination by antineoplastic drugs using gas chromatography-mass spectrometry and voltammetry. Am J Health Syst Pharm 2002; 59: 956-61.
11. Mason HJ, Blair S, Sams C, Jones K, Garfitt SJ, Cuschieri MJ, Baxter PJ. Exposure to antineoplastic drugs in two UK hospital pharmacy units. Ann Occup Hyg 2005; 49: 603-10.
12. Leboucher G, Serratrice F, Bertholle V, Thore L, Bost M. [Evaluation of platinum contamination of a hazardous drug preparation area in a hospital pharmacy]. Bull Cancer 2002; 89: 949-55.
13. Connor TH, Sessink PJ, Harrison BR, Pretty JR, Peters BG, Alfaro RM, Bilos A, Beckmann G, Bing MR, Anderson LM, Dechristoforo R. Surface contamination of chemotherapy drug vials and evaluation of new vial-cleaning techniques: results of three studies. Am J Health Syst Pharm 2005; 62: 475-84.
14. Nygren O, Gustavsson B, Strom L, Friberg A. Cisplatin contamination observed on the outside of drug vials. Ann Occup Hyg 2002; 46: 555-7.
15. Mason HJ, Morton J, Garfitt SJ, Iqbal S, Jones K. Cytotoxic drug contamination on the outside of vials delivered to a hospital pharmacy. Ann Occup Hyg 2003; 47: 681-5.
16. Schreiber C, Radon K, Pethran A, Schierl R, Hauff K, Grimm CH, Boos KS, Nowak D. Uptake of antineoplastic agents in pharmacy personnel. Part II: study of work-related risk factors. Int Arch Occup Environ Health 2003; 76: 11-6.
17. Pethran A, Schierl R, Hauff K, Grimm CH, Boos KS, Nowak D. Uptake of antineoplastic agents in pharmacy and hospital personnel. Part I: monitoring of urinary concentrations. Int Arch Occup Environ Health 2003; 76: 5-10.
18. Turci R, Sottani C, Ronchi A, Minoia C. Biological monitoring of hospital personnel occupationally exposed to antineoplastic agents. Toxicol Lett 2002; 134: 57-64.
19. Minoia C, Turci R, Sottani C, Schiavi A, Perbellini L, Angeleri S, Draicchio F, Apostoli P. Application of high performance liquid chromatography/tandem mass spectrometry in the environmental and biological monitoring of health care personnel occupationally exposed to cyclophosphamide and ifosfamide. Rapid Commun Mass Spectrom 1998; 12: 1485-93.
20. Ensslin AS, Huber R, Pethran A, Rommelt H, Schierl R, Kulka U, Fruhmann G. Biological monitoring of hospital pharmacy personnel occupationally exposed to cytostatic drugs: urinary excretion and cytogenetics studies. Int Arch Occup Environ Health 1997; 70: 205-8.
21. Ensslin AS, Pethran A, Schierl R, Fruhmann G. Urinary platinum in hospital personnel occupationally exposed to platinum-containing antineoplastic drugs. Int Arch Occup Environ Health 1994; 65: 339-42.

Chapter 5.1
234
22. Ensslin AS, Stoll Y, Pethran A, Pfaller A, Rommelt H, Fruhmann G. Biological monitoring of cyclophosphamide and ifosfamide in urine of hospital personnel occupationally exposed to cytostatic drugs. Occup Environ Med 1994; 51: 229-33.
23. Nygren O, Lundgren C. Determination of platinum in workroom air and in blood and urine from nursing staff attending patients receiving cisplatin chemotherapy. Int Arch Occup Environ Health 1997; 70: 209-14.
24. Raghavan R, Burchett M, Loffredo D, Mulligan JA. Low-level (PPB) determination of cisplatin in cleaning validation (rinse water) samples. II. A high-performance liquid chromatographic method. Drug Dev Ind Pharm 2000; 26: 429-40.
25. Lustig L, Zang S, Michalke B, Schramel P, Beck W. Platinum determination in nutrient plants by inductively coupled plasma mass spectrometry with special respect to the hafnium oxide interference. Fresenius J Anal Chem 1997; 357: 1157-63.
26. Barefoot RR. Determination of platinum at trace levels in environmental and biological samples. Environmental Science & Technology 1997; 31: 309-14.
27. Turci R, Sottani C, Spagnoli G, Minoia C. Biological and environmental monitoring of hospital personnel exposed to antineoplastic agents: a review of analytical methods. J Chromatogr B Analyt Technol Biomed Life Sci 2003; 789: 169-209.


Conclusions and perspectives
238
Conclusions and perspectives
The introduction of inductively coupled plasma mass spectrometry (ICP-MS) in clinical
pharmacological oncology research resulted in new opportunities in the field of
quantitative analysis of metal-based anticancer agents. The technique is highly sensitive
and can be used to study heavy metal levels in a wide range of sample matrices from
biological and environmental origin.
In this thesis, we described the development and validation of methods for the analysis
of platinum (Pt) and ruthenium (Ru) in various biological matrices. The assays were
optimised and validated according to the latest FDA recommendations for bioanalytical
method validation. ICP-MS proved to be applicable for the determination of metal-based
anticancer agents in biological fluids. Furthermore, platinum-DNA (Pt-DNA) adduct
levels could be assessed in peripheral blood mononuclear cells (PBMCs) and tissue. For
the latter, only 1 mg of tissue was needed, which demonstrates the extreme low
detection capability of the method.
The use of ICP-MS greatly enhances the pharmacokinetic window that can be evaluated.
The availability of the sensitive assays described in this thesis offer the opportunity to
investigate research questions concerning the pharmacokinetics, mechanism of action,
efficacy, and safety of metal-based anticancer agents. Furthermore, the assays can be
used to evaluate the efficacy of drug targeting. In addition to pharmacological
applications, ICP-MS can be used to evaluate environmental contamination with heavy
metals.
Investigation of pharmacokinetics of metal-based anticancer agents
Before the introduction of ICP-MS it was only possible to study unbound Pt
pharmacokinetics during or shortly after treatment. The presence of persistent side
effects, however, has led to an increased demand for the investigation of long-term
pharmacokinetics, distribution, and elimination of metal-based drugs. It was frequently
hypothesized that persistent side effects could be a consequence of heavy metal which
was retained in the body after treatment. In the current thesis we investigated the long-
term pharmacokinetics of Pt in patients treated with cisplatin and oxaliplatin (Chapter
4.1). We observed Pt levels in plasma and plasma ultrafiltrate (pUF) to be significantly
elevated up to 75 months after the end of treatment. Remaining Pt levels decreased with
time. Although no Pt-DNA adducts could be detected in PBMCs, it was shown that Pt
species in pUF were still present in a reactive form. It was hypothesized that persistent
side effects might be a consequence of Pt that accumulates in the body and remains
bound to e.g. proteins and DNA. In the investigations described in this thesis, however,
we were not able to establish relationships between plasma Pt levels and persistent Pt
Conclusions and perspectives
239
induced neuropathy (Chapter 4.2). Hence, the clinical consequences of increased post-
treatment Pt levels remain to be established.
Investigation of efficacy and safety of metal-based anticancer agents
The ability of ICP-MS to investigate metal pharmacokinetics in a small volume of
biological fluid and tissue offers the opportunity to perform preclinical longitudinal
efficacy and safety studies in rodents. Due to the low amount of sample needed, animals
need no longer be sacrificed prior to analysis. This, in turn, enables intervention studies
in rodents. The significant side effects induced by metal-based anticancer agents can
possibly be prevented or reduced by the administration of antidotes. Investigations in
the current thesis revealed that sodium thiosulfate (STS) is capable of reducing
neuropathy and Pt accumulation in the body when administered during cisplatin
treatment (Chapter 4). It is plausible that sulfur-containing compounds can also reduce
persistent side effects when administered months after treatment. To realise such
effects, however, the compounds should be capable of removing Pt from both the
cellular and blood compartment. We investigated the effect of STS and other sulfur-
containing compounds on Pt-DNA and Pt-protein binding ex vivo (Chapter 3.2 and 4.1).
The in vivo effects of these and other antidotes can well be investigated in intervention
studies in rodents.
Investigation of mechanism of action of metal-based anticancer agents
Up to now, the mechanism of action of metal-containing anticancer agents is not fully
understood. There still is considerable interest in the investigation of the mechanism of
action of metal-based anticancer agents. Hyphenation of ICP-MS with HPLC creates the
possibility to further investigate the mechanism of action of metal-based anticancer
agents, as ICP-MS can serve as a very sensitive metal selective detector following
separation using e.g. high performance liquid chromatography (HPLC). In addition to the
exploration of the metabolism of metal-containing anticancer agents, the interaction of
the parent compounds and metabolites with endogenous species can be investigated.
Besides the investigation of the different Pt-DNA adducts formed (Chapter 3.2), future
research will concentrate on the separation and investigation of Pt- and Ru-protein
complexes.
Role in drug targeting
To decrease the side effects and increase the toxic effects to the tumour, drug targeting
is an increasingly applied tool. By modifying the pharmaceutical characteristics of an
240
effective anticancer drug, investigators aim to increase the amount of drug which is
directed to the tumour and decrease the side effects.
The potential of ICP-MS to determine metal levels in small biopsy samples such as fine
needle aspirates (Chapter 3.1), creates the opportunity to trace the pharmaceutically
modified drug and to assess tumour metal levels in rodents and patients. Thereby, the
most adequate modification can be selected, leading to optimisation of treatment
schedules and minimisation of side effects.
Environmental monitoring
In addition to the analysis of clinical samples, a method for the analysis of surface
samples to assess contamination of environments where Pt drugs are processed
(Chapter 5) was developed. This method was applied to evaluate surface contamination
in seven hospital pharmacies. In general, the results of this study revealed considerable
contamination, demonstrating that cleaning and working procedures did not sufficiently
prevent contamination in most hospitals. In future studies, cleaning and working
procedures can be optimised using ICP-MS to test the efficiency of the procedures.
Unfortunately, up to now, the consequences of long-term environmental exposure to Pt-
based anticancer agents are not known. It would be useful to assess a contamination
level below which no harmful effects are expected. This can be done by evaluating the
DNA-binding reactivity and the ability to inhibit cell growth of Pt recovered from the
surface samples. Furthermore, it would be interesting to measure Pt in plasma, urine,
and Pt-DNA adducts in PBMCs of hospital personnel to assess whether the Pt
contamination is actually absorbed into the body and whether it is still in the active
form.
In addition to the environmental monitoring of hospital pharmacies, ICP-MS can be
applied in several areas to evaluate heavy metal contamination. Not only samples from
hospitals and (pharmaceutical) industry, but also surface water, road dust, and food are
relevant sources to investigate for contamination with heavy metals such as Pt, arsenic,
cadmium, and mercury. Furthermore, the uptake of heavy metals by human as a
consequence of environmental exposure is of interest. Not only elevated plasma and
urine levels, but also increased tissue and breast milk levels need attention.
In conclusion, the successful application of ICP-MS in oncology has had an enormous
impact on the field of quantitative analysis of metal-based anticancer agents from
biological and environmental samples. The technique offers the opportunity to study
fairly all applications of metal-based anticancer agents, which could be of interest in
oncology.


Summary Samenvatting
244
Summary
After the discovery of the antiproliferative effects of cisplatin, the drug has developed into one of the most frequently used anticancer agents. Unfortunately, the use of cisplatin is hampered by severe side effects and by the resistance of several tumour types. These limitations have led to the development and evaluation of thousands of metal-containing compounds of which only a few have entered clinical trials. Nowadays, the platinum-containing complexes oxaliplatin and carboplatin have found important applications, whereas satraplatin is under consideration for approval. In addition, ruthenium complexes are regarded as promising alternatives for platinum complexes. Research to unravel the pharmacokinetics and –dynamics of metal-based anticancer agents is required to understand the clinical behaviour of the drugs and to further optimise treatment regimens. Accurate and sensitive methods for the quantitative determination of metal-based anticancer agents are indispensable to study these aspects. Therefore, the introduction of inductively coupled plasma mass spectrometry (ICP-MS) in clinical pharmacological oncology research resulted in new opportunities in the field of quantitative analysis of metal-based anticancer agents. This technique is highly sensitive and can be used to study heavy metals in a wide range of sample matrices. The aim of this thesis (Chapter 1.1) was to develop and validate analytical ICP-MS methods for the analysis of metal-based anticancer agents. These methods were applied to answer research questions concerning long-term pharmacokinetics, platinum-induced side effects, the effects of antidotes on platinum-induced side effects, and environmental monitoring. ICP-MS has now become the method of first choice for the quantitative bioanalysis of metal-based anticancer agents as is demonstrated by the large number of publications that have appeared on the subject so far. ICP-MS provides an extremely high sensitivity. Therefore, in addition to the investigation of pharmacokinetics during or shortly after chemotherapy, other research questions, which are of current interest, can be answered. In Chapter 1.2, an overview of the literature available in this field is presented. The focus is on the determination of the total metal concentration in biological samples (plasma, urine, tissue, DNA and protein adducts) and in environmental samples. Furthermore, the speciation of platinum and ruthenium compounds is described. Chapter 2 describes the development and validation of assays for the analysis of
platinum in plasma and plasma ultrafiltrate (pUF) using atomic absorption spectrometry
(AAS) (Chapter 2.1), of platinum in pUF using ICP-MS (Chapter 2.2), and of ruthenium in
plasma, pUF, and urine by ICP-MS (Chapter 2.3). The benefit of the use of ICP-MS
compared to AAS for the analysis of metal-based anticancer agents in biological fluids
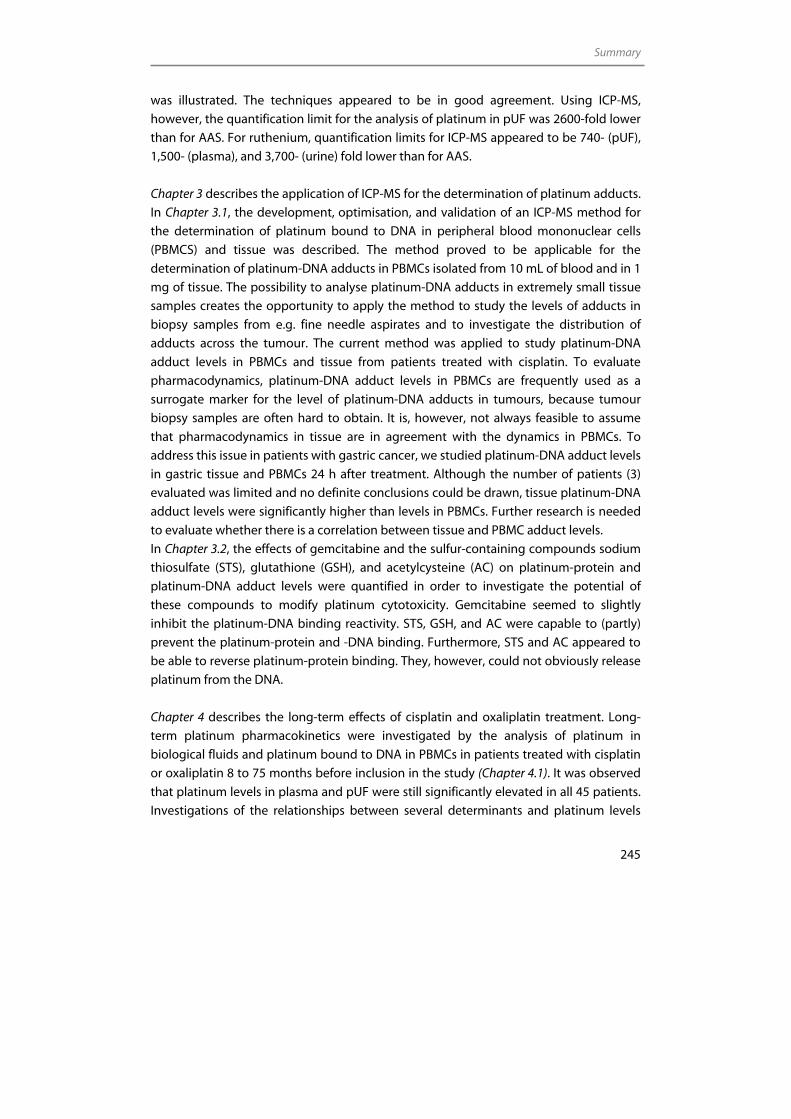
Summary
245
was illustrated. The techniques appeared to be in good agreement. Using ICP-MS,
however, the quantification limit for the analysis of platinum in pUF was 2600-fold lower
than for AAS. For ruthenium, quantification limits for ICP-MS appeared to be 740- (pUF),
1,500- (plasma), and 3,700- (urine) fold lower than for AAS.
Chapter 3 describes the application of ICP-MS for the determination of platinum adducts.
In Chapter 3.1, the development, optimisation, and validation of an ICP-MS method for
the determination of platinum bound to DNA in peripheral blood mononuclear cells
(PBMCS) and tissue was described. The method proved to be applicable for the
determination of platinum-DNA adducts in PBMCs isolated from 10 mL of blood and in 1
mg of tissue. The possibility to analyse platinum-DNA adducts in extremely small tissue
samples creates the opportunity to apply the method to study the levels of adducts in
biopsy samples from e.g. fine needle aspirates and to investigate the distribution of
adducts across the tumour. The current method was applied to study platinum-DNA
adduct levels in PBMCs and tissue from patients treated with cisplatin. To evaluate
pharmacodynamics, platinum-DNA adduct levels in PBMCs are frequently used as a
surrogate marker for the level of platinum-DNA adducts in tumours, because tumour
biopsy samples are often hard to obtain. It is, however, not always feasible to assume
that pharmacodynamics in tissue are in agreement with the dynamics in PBMCs. To
address this issue in patients with gastric cancer, we studied platinum-DNA adduct levels
in gastric tissue and PBMCs 24 h after treatment. Although the number of patients (3)
evaluated was limited and no definite conclusions could be drawn, tissue platinum-DNA
adduct levels were significantly higher than levels in PBMCs. Further research is needed
to evaluate whether there is a correlation between tissue and PBMC adduct levels.
In Chapter 3.2, the effects of gemcitabine and the sulfur-containing compounds sodium
thiosulfate (STS), glutathione (GSH), and acetylcysteine (AC) on platinum-protein and
platinum-DNA adduct levels were quantified in order to investigate the potential of
these compounds to modify platinum cytotoxicity. Gemcitabine seemed to slightly
inhibit the platinum-DNA binding reactivity. STS, GSH, and AC were capable to (partly)
prevent the platinum-protein and -DNA binding. Furthermore, STS and AC appeared to
be able to reverse platinum-protein binding. They, however, could not obviously release
platinum from the DNA.
Chapter 4 describes the long-term effects of cisplatin and oxaliplatin treatment. Long-
term platinum pharmacokinetics were investigated by the analysis of platinum in
biological fluids and platinum bound to DNA in PBMCs in patients treated with cisplatin
or oxaliplatin 8 to 75 months before inclusion in the study (Chapter 4.1). It was observed
that platinum levels in plasma and pUF were still significantly elevated in all 45 patients.
Investigations of the relationships between several determinants and platinum levels
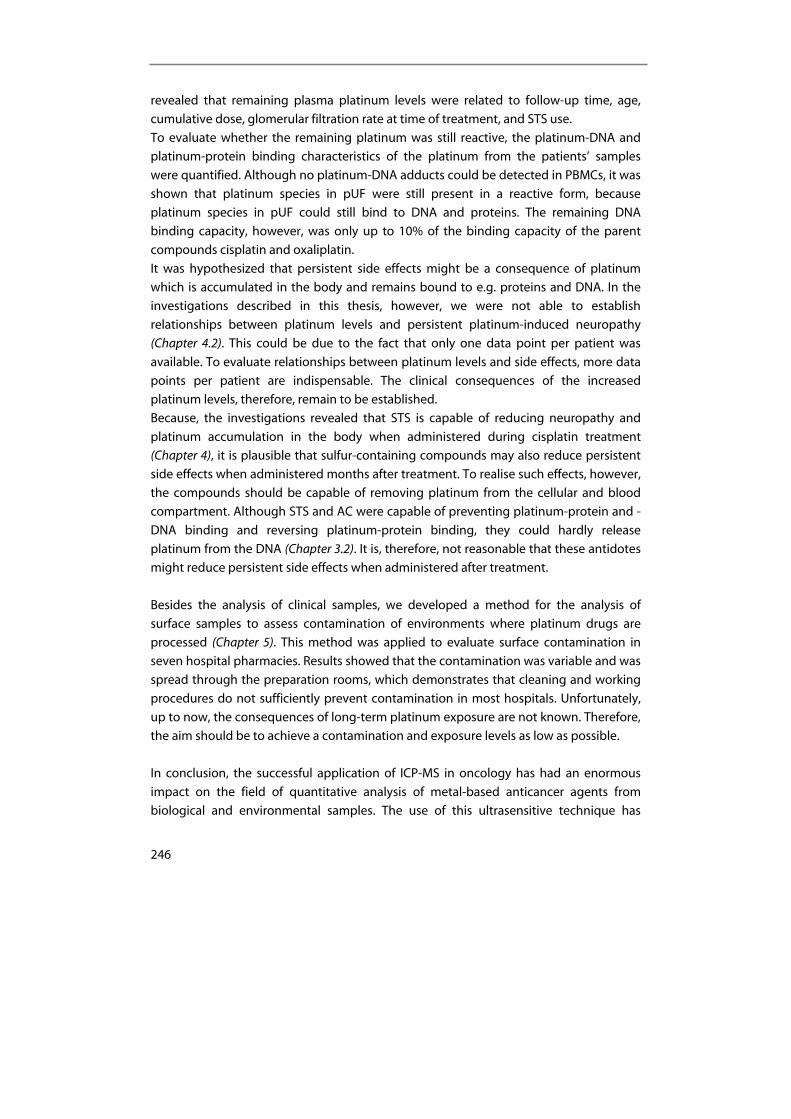
246
revealed that remaining plasma platinum levels were related to follow-up time, age,
cumulative dose, glomerular filtration rate at time of treatment, and STS use.
To evaluate whether the remaining platinum was still reactive, the platinum-DNA and
platinum-protein binding characteristics of the platinum from the patients’ samples
were quantified. Although no platinum-DNA adducts could be detected in PBMCs, it was
shown that platinum species in pUF were still present in a reactive form, because
platinum species in pUF could still bind to DNA and proteins. The remaining DNA
binding capacity, however, was only up to 10% of the binding capacity of the parent
compounds cisplatin and oxaliplatin.
It was hypothesized that persistent side effects might be a consequence of platinum
which is accumulated in the body and remains bound to e.g. proteins and DNA. In the
investigations described in this thesis, however, we were not able to establish
relationships between platinum levels and persistent platinum-induced neuropathy
(Chapter 4.2). This could be due to the fact that only one data point per patient was
available. To evaluate relationships between platinum levels and side effects, more data
points per patient are indispensable. The clinical consequences of the increased
platinum levels, therefore, remain to be established.
Because, the investigations revealed that STS is capable of reducing neuropathy and
platinum accumulation in the body when administered during cisplatin treatment
(Chapter 4), it is plausible that sulfur-containing compounds may also reduce persistent
side effects when administered months after treatment. To realise such effects, however,
the compounds should be capable of removing platinum from the cellular and blood
compartment. Although STS and AC were capable of preventing platinum-protein and -
DNA binding and reversing platinum-protein binding, they could hardly release
platinum from the DNA (Chapter 3.2). It is, therefore, not reasonable that these antidotes
might reduce persistent side effects when administered after treatment.
Besides the analysis of clinical samples, we developed a method for the analysis of
surface samples to assess contamination of environments where platinum drugs are
processed (Chapter 5). This method was applied to evaluate surface contamination in
seven hospital pharmacies. Results showed that the contamination was variable and was
spread through the preparation rooms, which demonstrates that cleaning and working
procedures do not sufficiently prevent contamination in most hospitals. Unfortunately,
up to now, the consequences of long-term platinum exposure are not known. Therefore,
the aim should be to achieve a contamination and exposure levels as low as possible.
In conclusion, the successful application of ICP-MS in oncology has had an enormous
impact on the field of quantitative analysis of metal-based anticancer agents from
biological and environmental samples. The use of this ultrasensitive technique has
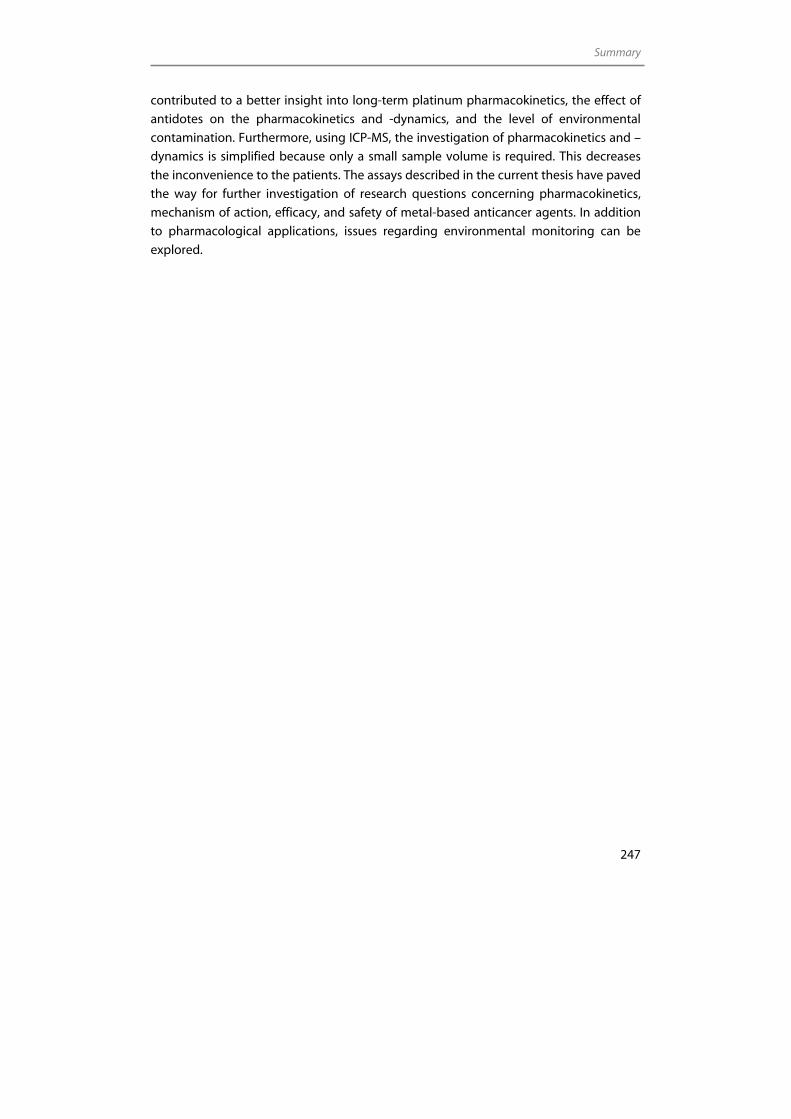
Summary
247
contributed to a better insight into long-term platinum pharmacokinetics, the effect of
antidotes on the pharmacokinetics and -dynamics, and the level of environmental
contamination. Furthermore, using ICP-MS, the investigation of pharmacokinetics and –
dynamics is simplified because only a small sample volume is required. This decreases
the inconvenience to the patients. The assays described in the current thesis have paved
the way for further investigation of research questions concerning pharmacokinetics,
mechanism of action, efficacy, and safety of metal-based anticancer agents. In addition
to pharmacological applications, issues regarding environmental monitoring can be
explored.
248
Samenvatting
Na de ontdekking van de remmende werking van cisplatine op de groei van tumoren, heeft het middel zich ontwikkeld tot een van de meest gebruikte antikankermiddelen. Helaas gaat het gebruik van cisplatine vaak gepaard met ernstige bijwerkingen en zijn verschillende type tumoren resistent tegen het middel. Deze beperkingen hebben er toe geleid dat duizenden metaal bevattende verbindingen zijn ontwikkeld en getest. Van deze verbindingen bleken er slechts enkele geschikt om te worden geïntroduceerd in de kliniek. Tegenwoordig worden naast cisplatine ook de platina-bevattende middelen oxaliplatine en carboplatine in de kliniek toegepast. Een ander middel, satraplatine, wordt momenteel onderzocht op klinische toepasbaarheid. Naast platina-bevattende middelen worden ook ruthenium complexen als mogelijke alternatieven ontwikkeld. Om het klinisch gedrag van metaal-bevattende antikankermiddelen te kunnen begrijpen, is onderzoek naar de farmacokinetiek en –dynamiek vereist. Hierdoor wordt verdere optimalisatie van de behandeling met deze geneesmiddelen mogelijk. Om de farmacokinetiek en –dynamiek te onderzoeken is het van belang dat de hoeveelheid van de metaal-bevattende antikankermiddelen in het lichaam wordt gemeten. Inductief-gekoppelde plasma-massa-spectrometrie (ICP-MS) is een zeer gevoelige methode voor de kwantitatieve bepaling van deze middelen. De doelstelling van het onderzoek in dit proefschrift (Hoofdstuk 1.1) was om kwantitatieve ICP-MS-methoden voor metaal-bevattende antikankermiddelen te ontwikkelen en te valideren. Deze methoden zijn vervolgens toegepast om onderzoeksvragen te beantwoorden met betrekking tot de bijwerkingen en lange-termijn farmacokinetiek van deze middelen. De methoden zijn ook gebruikt voor omgevingsmonitoring en voor onderzoek naar effecten van antidota op platina-geïnduceerde bijwerkingen. ICP-MS is nu de techniek van eerste keuze voor de kwantitatieve bioanalyse van metaal-bevattende antikankermiddelen. De methode is zeer gevoelig en kan daardoor gebruikt worden voor vele klinisch farmacologische onderzoeksvragen. Dit blijkt uit het grote aantal publicaties dat op dit gebied is verschenen. In Hoofdstuk 1.2 wordt een overzicht van deze literatuur gepresenteerd. Het hoofdstuk richt zich op de bepaling van de totale hoeveelheid platina en ruthenium in humane biologische monsters (plasma, urine, weefsel en DNA- en eiwitadducten) en omgevingsmonsters. Daarnaast wordt de combinatie van scheidingstechnieken met ICP-MS beschreven. Ontledings- en reactieproducten kunnen van elkaar gescheiden worden en de hoeveelheid metaal in de gescheiden producten kan vervolgens met ICP-MS worden bepaald. Hoofdstuk 2 beschrijft de ontwikkeling en validatie van bepalingsmethoden voor de bepaling van platina in plasma en plasma-ultrafiltraat door middel van atomaire
Samenvatting
249
absorptiespectrometrie (AAS) (Hoofdstuk 2.1), van platina in plasma-ultrafiltraat met behulp van ICP-MS (Hoofdstuk 2.2) en van ruthenium in plasma, plasma-ultrafiltraat en urine met ICP-MS (Hoofdstuk 2.3). Met de ICP-MS methoden werden vele lagere bepalingslimieten bereikt dan met AAS. Voor de bepaling van platina in plasma-ultrafiltraat werd met ICP-MS een bepalingslimiet bereikt die 2600 maal lager is dan met AAS. Voor de bepaling van ruthenium in plasma-ultrafiltraat, plasma en urine waren de bepalingslimieten behaald met ICP-MS respectievelijk zelfs 740, 1500 en 3700 keer lager dan gebruikelijk bij AAS. Door de lage bepalingslimieten kan zowel de farmacokinetiek tijdens de behandeling worden onderzocht, als ook de farmacokinetiek tot jaren na het stoppen van de behandeling. Hoofdstuk 3 beschrijft de toepassing van ICP-MS voor de bepaling van platina-adducten. In Hoofdstuk 3.1 wordt de ontwikkeling, optimalisatie en validatie van een ICP-MS methode beschreven voor de bepaling van de hoeveelheid platina gebonden aan DNA in witte bloedcellen en weefsel. De methode bleek toepasbaar voor de bepaling van platina-DNA-adducten in witte bloedcellen geïsoleerd uit 10 mL bloed en van platina-DNA-adducten in slechts 1 mg weefsel. De mogelijkheid deze adducten te bepalen in een zeer geringe hoeveelheid weefsel maakt ook mogelijk om platina gebonden aan DNA te meten in monsters uit bijvoorbeeld een fijne naald biopsie. Hierdoor kan onder andere de verdeling van adducten over de tumor onderzocht worden. De in Hoofdstuk 3.1 beschreven methode is gebruikt voor het bepalen van concentraties van platina gebonden aan DNA in witte bloedcellen en weefsel van patiënten die behandeld werden met cisplatine. Voor het evalueren van de farmacodynamiek van een platina-bevattend middel worden de hoeveelheden platina-DNA-adducten in witte bloedcellen vaak als surrogaatmerker gebruikt voor de hoeveelheden platina-DNA-adducten in tumoren. Dit wordt gedaan omdat tumorweefsel doorgaans moeilijk te verkrijgen is. Het is echter niet vanzelfsprekend dat de farmacodynamiek in weefsel overeenkomt met die in witte bloedcellen. Om dit te onderzoeken werd de hoeveelheid platina gebonden aan DNA in weefsel uit de maag en uit witte bloedcellen van patiënten met maagkanker bepaald 24 uur na de toediening van cisplatine. Hoewel het aantal onderzochte patiënten (3) gering was, waardoor nog geen definitieve conclusies getrokken konden worden, waren de platina-DNA adductconcentraties in weefsel significant hoger dan de concentraties in witte bloedcellen. Verder onderzoek is vereist om na te gaan of er een correlatie bestaat tussen weefsel en wittebloedcel adductconcentraties. In Hoofdstuk 3.2 is het effect van gemcitabine en de zwavel-bevattende middelen natriumthiosulfaat (STS), glutathion (GSH) en acetylcysteïne (AC) op de platina-eiwit- en platina-DNA-binding gekwantificeerd. Dit onderzoek werd verricht om vast te stellen of deze middelen toegepast zouden kunnen worden voor het modificeren van de cytotoxiciteit van platina-bevattende middelen. Gemcitabine remde de platina-DNA-bindingsreactiviteit in geringe mate. STS, GSH en AC voorkwamen, deels, de binding van platina aan eiwit en DNA. Verder bleken STS en AC in staat om platina-gebonden eiwit vrij te maken. Platina werd echter niet van het DNA vrijgemaakt door deze middelen.
250
Hoofdstuk 4 beschrijft het lange-termijneffect van behandeling met cisplatine en oxaliplatine. De lange-termijnfarmacokinetiek van platina werd onderzocht door de meting van platina in plasma, plasma-ultrafiltraat en gebonden aan DNA in witte bloedcellen in patiënten die 8 tot 75 maanden eerder behandeld waren met cisplatine of oxaliplatine. (Hoofdstuk 4.1). Uit het onderzoek bleek dat platina concentraties in plasma en plasma-ultrafiltraat in alle 45 patiënten significant verhoogd waren ten opzichte van controle patiënten. Uit het onderzoek bleek eveneens dat de platinaconcentraties in plasma gerelateerd zijn aan follow-uptijd, leeftijd, cumulatieve dosis, glomerulaire filtratiesnelheid ten tijde van de behandeling en gebruik van STS. Om te bepalen of het resterende platina nog reactief was, zijn de bindingskarakteristieken van het platina aan eiwit en DNA bepaald in patiëntenmonsters. Hoewel er geen platina-DNA-adducten in witte bloedcellen werden gedetecteerd, bleek het platina in plasma-ultrafiltraat nog steeds reactief te zijn. Platina species aanwezig in plasma-ultrafiltraat waren nog steeds in staat om aan DNA en eiwitten te binden. De resterende DNA-bindingscapaciteit was echter maximaal 10% van de bindingscapaciteit van de intacte verbindingen cisplatine en oxaliplatine. Het zou kunnen dat de persistente bijwerkingen van platina een gevolg zijn van het platina dat in het lichaam opgehoopt is en gebonden is aan bijvoorbeeld eiwitten en DNA. In het onderzoek dat beschreven is in dit proefschrift kon echter geen relatie vastgesteld worden tussen platinaconcentraties en persistente, door platina geïnduceerde, neuropathie (Hoofdstuk 4.2). De reden hiervoor zou kunnen zijn dat er enkel één datapunt per patiënt beschikbaar was en dat voor het bepalen van de relatie tussen platinaconcentraties en bijwerkingen meerdere meetpunten noodzakelijk zijn. De klinische consequenties van de verhoogde platinaconcentraties moet daarom nog vastgesteld worden. Onderzoek liet zien dat STS, wanneer toegediend gedurende cisplatine behandeling, platina-geïnduceerde neuropathie reduceert en platina-ophoping in het lichaam vermindert (Hoofdstuk 4). De vraag is of zwavel-bevattende middelen, wanneer ze maanden na behandeling worden gegeven, ook persistente bijwerkingen kunnen reduceren. Om dergelijke effecten te realiseren moeten de middelen in staat zijn om platina uit de cellulaire- en bloedcompartimenten te verwijderen. Hoewel STS en AC de platina-eiwit- en platina-DNA-binding konden voorkomen en tevens platina van eiwit los konden maken, waren ze niet in staat om platina van het DNA te verwijderen (Hoofdstuk 3.2). Daarom is het niet aannemelijk dat deze antidota de bijwerkingen kunnen reduceren wanneer ze na afloop van de behandeling worden toegediend. Naast de bepaling van metaal in klinische monsters, werd een methode ontwikkeld om oppervlaktemonsters (veegproeven) te analyseren. Het doel hiervan was de verontreiniging vast te stellen in de omgeving waar platinamiddelen toedieningsgereed worden gemaakt (Hoofdstuk 5). De methode is gebruikt voor het bepalen van oppervlakte verontreiniging in zeven Nederlandse ziekenhuisapotheken. De resultaten
Samenvatting
251
lieten zien dat de verontreiniging variabel was en dat deze verspreid voorkwam in de bereidingsruimtes. Deze resultaten duiden erop dat de schoonmaak- en werkprocedures in de meeste ziekenhuizen verontreiniging niet in voldoende mate voorkomen. Helaas zijn de gevolgen van lange-termijnblootstelling aan platina tot nu toe onbekend. Daarom wordt geadviseerd om iedere verontreiniging en blootstelling te voorkomen. Concluderend kan gesteld worden dat de succesvolle toepassing van ICP-MS in de oncologie een grote invloed heeft gehad op de kwantitatieve analyse van metaal-bevattende antikankermiddelen. Het gebruik van deze techniek heeft bijgedragen aan een beter inzicht in de lange-termijnfarmacokinetiek, het effect van antidota op de farmacokinetiek en -dynamiek en het niveau van omgevingsverontreiniging. Verder heeft het gebruik van ICP-MS het onderzoeken van de farmacokinetiek en -dynamiek vereenvoudigd omdat slechts een monster van zeer klein volume nodig is. Dit zorgt voor een verminderde belasting van de patiënten. De methoden die beschreven zijn in dit proefschrift hebben het pad geëffend voor verder onderzoek naar de farmacokinetiek, werkingsmechanismen, effectiviteit en veiligheid van metaal-bevattende antikankermiddelen. Naast klinisch-farmacologische toepassingen kunnen kwesties met betrekking tot omgevingsmonitoring worden onderzocht.

Dankwoord Curriculum Vitae
List of Publications
254
Dankwoord
Ben jij één van die lezers die bij het openen van het proefschrift als eerste het
dankwoord leest? Ik doe dat ook altijd. En nu ik zelf op het punt sta een dankwoord te
schrijven vraag ik me af waarom? Het dankwoord staat immers bijna achteraan en wordt
voorafgegaan door pagina’s interessant onderzoek. Misschien omdat het dankwoord
één van de weinige plekken in het proefschrift is waar je iets persoonlijks kunt laten zien
en wellicht is dat waar je naar op zoek bent. Wie is de persoon die het boek tot stand
heeft gebracht en, niet minder belangrijk belangrijk, wie hebben hem of haar daarbij
ondersteund? Het dankwoord laat zien hoe de promovendus de promotie heeft beleefd.
En dat is waar ik nieuwsgierig naar ben als ik een proefschrift van een andere OIO krijg.
Laat ik dus maar meteen antwoord geven op de vraag: hoe heb ik mijn promotie
eigenlijk beleefd? Ik vond het in één woord geweldig! En als ik eerlijk ben, vind ik het
jammer dat het werk bijna gedaan is. Niet alleen omdat het werk ontzettend interessant
was, maar zeker ook om het plezier dat de (werk)omgeving me heeft gegeven. Ik wil
daarom graag een woord van dank richten tot de mensen die op één of andere manier
bij mijn onderzoek betrokken waren.
Allereerst natuurlijk mijn promotores Prof. Dr J.H. Beijnen en Prof. Dr J.H.M. Schellens.
Beste Jos, jij hebt me de kans gegeven om mezelf te ontwikkelen op het gebied van
onderzoek. Ik heb veel geleerd de afgelopen vier jaar. Jij vertelde me bij één van onze
eerste overleggen dat je als OIO de manager bent van je eigen onderzoek. Die
opmerking zit nog in mijn achterhoofd. Ik wil je bedanken voor het vertrouwen dat je
me hebt gegeven, waardoor ik het gevoel had dat ik ook echt de manager kon zijn. Elk
overleg met jou leidde tot nieuwe ideeën, wat me motiveerde om steeds weer een
stapje verder te gaan, ook als het even niet mee zat. Jos, ik ben blij dat ik nog vier jaar in
het Slotervaartziekenhuis zal zijn en dat ik me verder kan gaan ontwikkelen in de
ziekenhuisfarmacie.
Beste Jan, ik wil je bedanken voor je waardevolle klinische blik. Jij hebt ervoor gezorgd
dat we de ICP-MS konden inzetten voor het beantwoorden van klinisch relevante
vragen. Mijn dank hiervoor. Daarnaast ben ik je zeer erkentelijk voor de kritische
beoordeling van mijn manuscripten.
Veel mensen hebben bijgedragen aan het onderzoek dat beschreven staat in dit
proefschrift.
Beste Willem, bedankt voor je inzichten en voor de discussies met betrekking tot de
neuropathie. Ik heb je aandeel in het opzetten van de klinische studie erg gewaardeerd.
Alwin, het laatste jaar van mijn promotie heb jij me erg geholpen. Ik ben blij dat je de
resultaten van de klinische studie met mij wilde bespreken. Je heldere ideeën en de
daaropvolgende nonmem analyses hebben ertoe geleid dat we meer uit de
neurotoxiciteitsstudie hebben kunnen halen dan ik in eerste instantie had gedacht. Ik
ben blij dat ik de komende vier jaar nog meer van je mag leren.
Dankwoord
255
Matthijs, wat vind ik het jammer dat je niet meer in het Slotervaart werkt. Onze
brainstormsessies maakten mij enthousiast. Ik vind je een goede onderzoeker. Ook jij
neemt geen genoegen met dat wat ‘aangenomen’ wordt en je bent nieuwsgierig naar
de achtergrond van de aanname. Ik ben blij dat ik de ICP-MS kennis met je kon delen en
dat je altijd klaar stond om samen te ‘troubleshooten’. De kritische blik waarmee jij mijn
review hebt bekeken, heb ik zeer gewaardeerd. Hilde, de overleggen met jou waren voor
mij verhelderend. Jouw analytisch inzicht heeft me bij een aantal hoofdstukken uit dit
proefschrift zeer geholpen. Dick, hoeveel e-mails hebben wij over en weer gestuurd de
afgelopen jaren? Dank je voor het kritisch meedenken en het uitvoeren van de 32P-
analyses. Michel, ook al zijn de MS analyses uiteindelijk niet in mijn proefschrift terecht
gekomen, ik wil je toch bedanken voor je hulp daarbij.
I would also like to thank Karel, Henk, Peter, Henk, Ueli, Yolande, and Stephen from
Varian. The intensive contact we had during the first two years have greatly enlarged my
knowledge of ICP-MS. Dear Stephen, thank you for our fruitful discussions. It always
surprised me when I received a reply within 12 hours. It is a great pleasure that you will
come all the way from Australia to attend my defence.
De MDL artsen van het AVL en Maria wil ik graag bedanken voor hun hulp bij de
N06DCM studie. Marja, Brigitte, Cecile, Ninja, Harm, Dilsha en Jolanda, bedankt dat jullie
altijd klaarstonden om me te helpen bij de klinische studies. Het priklab en de
verpleegkundigen van 4C wil ik bedanken voor het afnemen van de bloedmonsters. Ik
wil ook de patiënten bedanken die allemaal mee wilden doen met het onderzoek. De
enorme motivatie die de patiënten uitstraalden, heeft mij verrast. De gesprekken
duurden altijd net iets langer dan noodzakelijk en ik heb veel van hun verhalen geleerd.
De ziekenhuisapotheken die deel hebben genomen aan het veegproefonderzoek wil ik
bedanken voor hun bijdrage.
En dan de mensen van het lab waar ik heel wat uurtjes heb doorgebracht. Bedankt voor
jullie gezelligheid. Abadi, dank je voor je interesse en natuurlijk voor het lenen van je
pipetten. Bas, jouw technisch inzicht heeft me vaak vooruit geholpen. Ciska en Caroline,
ik zal geen herrie meer maken met de centrifuges. Roel, we hebben elkaar de laatste
jaren goed in de gaten kunnen houden. Af en toe voelde ik me alsof ik in een vissekom
zat. Heb je me ooit zien zingen in het ICP-MS hok? Ik hoop het niet. Ik vond het leuk dat
je af en toe binnenwandelde om te vragen hoe het ging.
Dan de collega OIOs. Tja, wat kan ik zeggen. Toen ik ging verhuizen had ik het gevoel dat
ik een warm nest moest verlaten. Judith, Marie-Christine (MC) en Annemieke, ik vond het
leuk om in de zonnetempel met jullie op de kamer te zitten. Het was er rustig en
gezellig, een hele goede combinatie. Judith, wij deelden de koude kant van de kamer.
Succes met de laatste loodjes en ik hoop je met de cursussen te zien. MC, jouw harde
werken gaat beloond worden. Nog even en je proefschrift is klaar. Dan is het tijd voor de
volgende uitdaging. En als je zin hebt in thee, je weet me te vinden. Annemieke, ik hoop
256
je nog vaak te spreken de komende jaren. Ook mijn oud-kamergenoten in de
zonnetempel Nathalie en in de onderwereld Monique en Liesbeth; bedankt.
Anthe, ik mis je hier in het Slotervaart. Dank je voor de leuke, relativerende gesprekken.
Binnenkort weer naar de sauna? Ly, jij hebt de gave om bij mensen een lach op het
gezicht te toveren. Ik hoop nog vele (fiets)uurtjes met je door te brengen. En dank je
voor de vele milliliters bloed. Tussen de vele OIO donoren was jij mijn vaste slachtoffer.
Robert, Rob, Ron en Joost, jullie passie voor het onderzoek werkt aanstekelijk. Dank jullie
voor de leuke gesprekken. En Ron, ik vind het fijn dat ik je af en toe lastig mocht vallen
met computervragen. David en Stijn, de uurtjes in het kinetiekhok waren leuk. Ik ben
ervan onder de indruk hoe jullie het samplen weten te managen. David, dank je voor je
hulp bij het afnemen van de bloedmonsters. Corine, succes met de rest van je promotie
en wat daarna mag komen. Het gaat je lukken! Susanne, volg je hart, dan komt het
helemaal goed. Carola, succes met je verdere promotie. Liia, veel plezier met je nieuwe
baan en natuurlijk succes voor 21 februari! Jolanda, je weet me te vinden als je Ru
vragen hebt. Claudia, succes met je onderzoek. Bas, dank je voor het lenen van je scriptie
en veel plezier met je interessante onderzoek. Roos, Maarten, Sander en Nienke, ook al
zitten jullie niet in de keet, het was leuk om jullie af en toe te spreken. Markus, tot in
december.
Marjolein, toen ik net begon kwam ik bij je op de kamer. Terwijl Liesbeth, Monique en jij
al ver in jullie promotie waren, was voor mij alles nieuw. Ik heb veel van jullie geleerd. Nu
ben ik net weer naar je kamer verhuisd, alleen is die kamer dit keer heel wat kleiner en
lijkt het meer op een hok. Ik heb het erg naar mijn zin en vind het leuk om met je samen
te werken. Sabien, ik vond het jammer dat je wegging. Ik heb onze gesprekken erg
gewaardeerd en ik ben blij dat het zo goed bevalt bij Solvay. Tot snel.
Dear Herman, Adile and the other people of the Folkhälsan Research Center, thank you
for introducing me to science. The seven months that Rafaëlla and I spent in Finland,
opened the world of research to me. You made me think about doing a PhD. This thesis
is the result.
Naast het werk was er ook tijd voor ontspanning. Wat is het leven zonder muziek. Sabijn
en Jorden, jullie twee en onze avonden jammen geven mij energie. Ik ben ontzettend
blij dat ik jullie ken. Let’s sing!
Jos en Hanny: Zoals ik al eerder schreef zijn er slechts een aantal plaatsen in het
proefschrift waar je iets persoonlijks mag laten zien. Naast het dankwoord is de omslag
een tweede plek. Jos, ik heb me laten verrassen door jouw ontwerp. Dat was spannend,
maar je hebt mij perfect ‘gelezen’. Je hebt de vier jaar van mijn onderzoek in één
tekening weten te vangen. Persoonlijker had de omslag niet kunnen zijn. Ik ben je
hiervoor heel dankbaar. Hanny, dank je voor dat ik me altijd welkom voel bij jullie.
Lieve paps en mams, ik vind jullie geweldig en ik ben er ontzettend trots op dat ik jullie
dochter ben. Telkens kijk ik er weer naar uit dat we elkaar zien en spreken. Ik heb het
Dankwoord
257
idee dat we elkaar echt leren kennen en dat vind ik speciaal. En mama, het blijft
bijzonder dat we altijd op hetzelfde moment naar de telefoon grijpen om elkaar te
bellen.
Bart en Willem, mijn grote stoere broers. Ik ben trots op jullie en ik vind het leuk dat jullie
in Claudia en Elisabeth twee bijzondere dames hebben gevonden. En Willem, super dat
je Jos bij het digitaal maken van de omslag hebt geholpen.
Marieke, er zijn weinig mensen die me zo blij maken als jij. En ik blijf het stoer vinden
hoe je de mannen aftroeft als je op de mountainbike zit. Binnenkort naar het strand?
Rafaëlla, wat hebben wij veel geweldige dingen gedaan samen de laatste 10 jaar. Ook de
eerste onderzoeksstappen heb ik samen met jou genomen en dat beviel zo goed dat we
beiden verder zijn gegaan met onderzoek. Ondanks dat onze wegen nu iets meer van
elkaar gescheiden zijn dan voorheen, kruisen ze elkaar gelukkig nog vaak. Ik vind het
geweldig dat jij en Marieke als paranimfen achter me willen staan.
Martien, het leven voelt voor mij als een ontdekkingsreis en ik vind het heerlijk om die
met jou te mogen maken. Ik heb zin in het volgende deel van de reis!
Elke
Amsterdam 2007

Curriculum Vitae
259
Curriculum Vitae
Elke Brouwers werd op 8 november 1977 geboren te Helmond. In 1996 behaalde zij het
atheneum diploma aan het Dr Knippenbergcollege in Helmond. Vervolgens studeerde
zij farmacie aan de Universiteit Utrecht. Ter afsluiting van de doctoraal opleiding volgde
zij een wetenschappelijke stage aan het Folkhälsan Research Center in Helsinki. Er
werden fluoro-immunoassays ontwikkeld voor de bepaling van isoflavonoïden in
plasma en urine onder supervisie van Prof. Dr H. Adlercreutz. In 2002 volgde zij een
stage in de Radcliff Infirmary in Oxford waarna zij het apothekersdiploma behaalde. In
2003 begon zij aan het promotieonderzoek dat beschreven is in dit proefschrift, onder
leiding van Prof. Dr J.H.Beijnen en Prof. Dr J.H.M. Schellens
260
List of publications
1. Brouwers EEM, L’homme RFA, Al-Maharik N, Lapcik O, Hampl R, Wahala K, Mikola H,
Adlercreutz H. Time-resolved fluoro-immunoassay for equol in plasma and urine. J
Steroid Biochem Mol Biol 2003; 84(5): 577
2. L’homme RFA, Brouwers EEM, Al-Maharik N, Lapcik O, Hampl R, Wahala K, Mikola H,
Adlercreutz H. Time-resolved fluoro-immunoassay for plasma and urine O-DMA. J
Steroid Biochem Mol Biol 2002; 81(4-5): 353-61
3. Brouwers EEM, Tibben MM, Joerger M, van Tellingen O, Rosing H, Schellens JHM,
Beijnen JH. Determination of oxaliplatin in human plasma and plasma ultrafiltrate
by graphite-furnace atomic-absorption spectrometry. Anal Bioanal Chem. 2005;
382(7): 1484-90.
4. Brouwers EEM, Tibben MM, Rosing H, Hillebrand, MJX, Joerger M, Schellens JHM,
Beijnen JH. Sensitive inductively coupled plasma mass spectrometry assay for the
determination of platinum originating from cisplatin, carboplatin, and oxaliplatin in
human plasma ultrafiltrate. J Mass Spectrom. 2006; 41(9): 1186-94.
5. Brouwers EEM, Huitema ADR, Bakker EN, Douma JW, Schimmel KJM, van Weringh G,
de Wolf PJ, Schellens JHM, Beijnen JH. Monitoring of platinum surface contamination
in seven Dutch hospital pharmacies using inductively coupled plasma mass
spectrometry. Int Arch Occup Environ Health 2007; 80: 689-699
6. Brouwers EEM, Tibben MM, Rosing H, Schellens JHM, Beijnen JH. Determination of
ruthenium originating from the investigational anti-cancer drug NAMI-A in human
plasma ultrafiltrate, plasma, and urine by inductively coupled plasma mass
spectrometry. Rapid Commun Mass Spectrom 2007; 21(9): 1521-1530
7. Brouwers EEM, Tibben MM, Rosing H, Schellens JHM, Beijnen JH. The application of
inductively coupled plasma mass spectrometry in clinical pharmacological oncology
research. Submitted.
8. Brouwers EEM, Tibben MM, Pluim D, Rosing H, Boot H, Cats A, Schellens JHM,
Beijnen JH. Inductively coupled plasma mass spectrometric analysis of the total
amount of platinum-DNA adducts in peripheral blood mononuclear cells and tissue
from patients treated with cisplatin. Submitted.
List of publications
261
9. Brouwers EEM, Huitema ADR, Schellens JHM, Beijnen JH. The effects of sulfur-
containing compounds and gemcitabine on the binding of cisplatin to plasma
proteins and DNA determined by ICP-MS and HPLC-ICP-MS. Submitted.
10. Brouwers EEM, Huitema ADR, Schellens JHM, Beijnen JH. Long-term platinum
retention after treatment with cisplatin and oxaliplatin. Submitted.
11. Brouwers EEM, Huitema ADR, Boogerd W, Schellens JHM, Beijnen JH. Persistent
neuropathy after treatment with cisplatin and oxaliplatin. Submitted.


