265
Sustaining Employment Growth: The Role of Manufacturing and Structural Change Industrial Development Report 2013

Sustaining Employment Growth: The Role of Manufacturing and Structural Change
Industrial Development Report 2013
Industrial Developm
ent Report 2013 Sustaining Em
ployment Grow
th: The Role of Manufacturing and Structural Change
Copyright © 2013 United Nations Industrial Development Organization
The designations employed and the presentation of material in this publication do not imply the expression of any opinion whatsoever on the part of the Secretariat concerning the legal status of any country, territory, city or area, or of its authorities, or concerning the delimitation of its frontiers or boundaries.
Designations such as “developed”, “industrialized” and “developing” are intended for statistical convenience and do not necessarily express a judgment about the state reached by a particular country or area in the develop-ment process.
The mention of firm names or commercial products does not imply endorsement by UNIDO.
Material in this publication may be freely quoted or reprinted, but acknowledgement is requested, together with a copy of the publication containing the quotation or reprint.
Cover photos: iStock.
UNIDO ID/446Sales Number: E.13.II.B.46ISBN: 978-92-1-106451-3eISBN: 978-92-1-056422-9
iii
Contents
xi Foreword xiii Acknowledgements xiv Technical notes and abbreviations xv Glossary
1 Executive summary
Part A The role of manufacturing and structural change
Section 1 Industrial structural change and manufacturing employment
15 Chapter 1 Structural change and employment trends 15 Industrialization, structural change and economic growth 28 Manufacturing growth and employment 34 Notes
37 Chapter 2 Structural transformation and the changing geography of manufacturing employment
38 Shifts in manufacturing employment between regions and countries 46 Shifts in manufacturing employment within countries 53 Notes
55 Chapter 3 Structural change in manufacturing 55 Manufacturing, structural change and economic development: selected country experiences 57 Patterns of structural change and employment generation within manufacturing 68 Employment in manufacturing-related services 70 Effects of time, demographics and geography on manufacturing development 75 Quality of manufacturing employment 79 Notes
Section 2 Drivers of manufacturing structural change and employment generation
82 Chapter 4 Cost and supply-side structural change drivers 83 Wages: important, but not the only driver 84 Skills: an often underrated driver 94 Technology: a dominant driver of structural change
Page
iviv
Co
nt
en
ts
96 Industrial organization: the underlying driver 99 Business environment: a basic driver for structural change 100 Notes
102 Chapter 5 Trade and foreign direct investment as external drivers of structural change
103 Trade as a likely driver of structural change 109 The role of global value chains 113 Impact of trade in manufactures on employment quality 114 Foreign direct investment: a potentially key driver 116 Notes
118 Chapter 6 Structural change and manufacturing employment in a resource-constrained world
119 Industrial greening: an emerging driver 127 Green manufacturing jobs 129 Notes
Section 3 Policy imperatives
132 Chapter 7 Industrial policy 132 Promoting structural change through industrial policy 134 Industrial policy instruments – four main categories 137 Targeting key drivers of structural change 139 Aligning industrial and other policies 141 Getting industrial policy to work – more than emulation required 144 Making the industrial policy process more effective 148 Flexible policy design: experimenting, learning and evaluating 150 Notes
151 Chapter 8 Education and training policies for creating jobs in manufacturing
151 General considerations for skill policies 152 Policy recommendations for skills 158 Notes
159 Chapter 9 International cooperation 159 The trade-off between national policy autonomy and trade liberalization 160 Bilateral investment treaties – protecting and promoting foreign direct investment 163 Private sustainability standards 165 Generating and sharing knowledge 165 Sustainable manufacturing and employment post-2015 166 Notes
Page

v
Co
nt
en
ts
Part B Trends in manufacturing valued added and in manufactured exports
170 Chapter 10 Trends in manufacturing value added 170 Manufacturing in industrializing countries 173 Manufacturing value added by technological category 174 Manufacturing value added by industry sector 178 Manufacturing value added by region 180 Notes
181 Chapter 11 Trends in manufactured exports 181 Global trends 184 Industrializing countries’ role in world manufactured exports 187 Industrializing countries’ manufactured export markets 189 The recovery of global manufactured exports 192 Notes
Annexes 194 1 Correlations between growth of per capita value added and labour productivity 195 2 Labour intensity 196 3 Indicators of industrial performance by economy 204 4 Technological classification of international trade data 205 5 Technological classification of manufacturing value added data 206 6 Indicators of manufacturing value added and exports by industrialization level, region and
income group 214 7 Summary of world trade, by industrialization level, region and income group 220 8 Country and economy groups
227 References
Boxes 16 1.1 Self-reinforcing industrial development 20 1.2 A few methodological issues 29 1.3 Estimating manufacturing jobs 39 2.1 Automotive and textile and apparel industries – a global shift to Asia 50 2.2 The dynamo and the computer 52 2.3 Manufacturing employment growth in India and China 58 3.1 The choice of three countries 59 3.2 Speed of manufacturing transformation 61 3.3 A note on data 62 3.4 A note on income elasticities of value added per capita, employment–population ratio and
labour productivity
Page

vivi
Co
nt
en
ts
Page
75 3.5 Proxying natural resources 76 3.6 Why low wages are the norm for wearing apparel 85 4.1 Wages and productivity in low-income garment-producing countries 86 4.2 Education and economic growth in the Republic of Korea and Pakistan 91 4.3 Tacit knowledge – not embodied in designs or blueprints 92 4.4 Typology of educational attainment structures 95 4.5 Labour-compensating mechanisms of technological change 111 5.1 Value chains development as an effective policy tool for promoting inclusive and sustainable
growth: Malaysia’s palm oil value chain 113 5.2 Research and development and learning-by-doing spillover effects from trade 119 6.1 Green economy and green industry 135 7.1 The Brazilian Development Bank 138 7.2 Fundación Chile 147 7.3 The policy cycle 154 8.1 Involving the private sector in Singapore 155 8.2 Apprenticeship schemes 156 8.3 Targeted voucher programmes and levy schemes 156 8.4 Clustering 157 8.5 Youth unemployment in Tunisia 160 9.1 A few warning lights for foreign direct investment 163 9.2 Corporate social responsibility and industrial restructuring 165 9.3 United Nations Forum on Sustainability Standards
Figures 2 S1 Number of jobs created by manufacturing industry, 1970–2009 19 1.1 GDP composition by sectors, Republic of Korea and Ghana, 1960–2005 21 1.2 GDP composition by income and sector, 1963–2007 21 1.3 GDP composition by income and sector (up to $25,000), 1963–1980 and 1991–2007 22 1.4 GDP composition by income, sector and country group (up to $25,000), 1963–2007 23 1.5 Economic growth and changes in the share of manufacturing value added in GDP, selected
regions and country groups, 1970–2007 24 1.6 Growth rates by sector, 13 long-term fast-growing economies 26 1.7 Relative labour productivity by income and sector, 1991–2010 27 1.8 Relative labour productivity and share in total employment by sector, 14 emerging
economies, 2005 27 1.9 Relative labour productivity and share in total employment by sector, 26 advanced
economies, 2005 29 1.10 Number of jobs created by manufacturing industry, 1970–2009 31 1.11 Number of jobs created by manufacturing industry and manufactured-related services,
1970–2009 32 1.12 Relative labour income and share in total employment by sector, 14 emerging economies, 2005 33 1.13 Relative labour income and share in total employment by sector, 26 advanced economies, 2005 33 1.14 Share of female employment in total employment by sector, 94 countries, 2005

vii
Co
nt
en
ts
Page
38 2.1 Trends in formal manufacturing employment by region, 1970, 1990 and 2010 43 2.2 Main types of services employment in manufacturing production by region, 1970–2009 44 2.3 Trends in net manufactured exports by region, 1970, 1990 and 2011 45 2.4 Trends in manufactured exports by region and technological classification, 1970, 1990
and 2011 46 2.5 Trends of world non-fuel exports by type of good, 1970, 1990 and 2011 46 2.6 Shares in exports of global intermediate goods by region, 1970, 1990 and 2011 47 2.7 Intermediate goods exports and imports by key Asian trading economies, 1970–2011 48 2.8 Urbanization and shares of manufacturing and services in employment by country, 2005 48 2.9 Urbanization and share of manufacturing in employment by country, 2005 49 2.10 Geographical dispersion of GDP and shares of manufacturing and services in employment
by country, 2005 57 3.1 Changes in value added by manufacturing industry, selected countries, 1963 and 1998 58 3.2 Changes in per capita value-added by income and manufacturing industry, the Republic of
Korea, Malaysia and Sri Lanka, 1963–2007 61 3.3 Changes in the shares in manufacturing value added by income and technology group,
1963–2007 61 3.4 Changes in value added per capita by income and manufacturing industry, 1963–2007 62 3.5 Changes in employment by income and manufacturing industry, 1963–2007 62 3.6 Changes in value added per capita by income, low- and lower middle-income countries,
1963–2007 63 3.7 Growth elasticities of value added, employment and labour productivity by income, low-
tech industries, 1963–2007 64 3.8 Growth elasticities of value added, employment and labour productivity by income,
medium-tech industries, 1963–2007 66 3.9 Growth elasticities of value added, employment and labour productivity by income, high-
tech industries, 1963–2007 67 3.10 Changes in growth rates of value added by income and manufacturing industry, 1963–2007 67 3.11 Changes in growth rates of employment by income and manufacturing industry, 1963–2007 68 3.12 Changes in value added and shares in employment by income and manufacturing industry,
1963–2007 68 3.13 Number of jobs required for the production and delivery of textiles and textile products,
1995–2009 69 3.14 Number of jobs required for the production and delivery of medium-tech industry products
in industrialized countries, 1995–2009 69 3.15 Number of jobs required for the production and delivery of high-tech industry products in
industrialized countries, 1995–2009 70 3.16 Shifts in value added and employment development patterns in two industries by income,
selected years, 1971–2009 72 3.17 Changes in value added by income and manufacturing industry, selected years 72 3.18 Changes in employment by income and manufacturing industry, selected years 73 3.19 Changes in value added by income and manufacturing industry, 1963–2007 74 3.20 Changes in employment by income and manufacturing industry, 1963–2007

viiiviii
Co
nt
en
ts
Page
75 3.21 Effects of population density and natural resource endowments on manufacturing value added, 1963–2007
75 3.22 Effects of population density and natural resource endowments on manufacturing employment, 1963–2007
77 3.23 Wages relative to manufacturing average by income group and manufacturing industry, 2006 79 3.24 Female employment share by income group and manufacturing industry, 2005 83 4.1 Drivers of structural change in manufacturing 84 4.2 Share in global manufacturing value added, selected labour-intensive industries, 1990–2009 89 4.3 Education and manufactured exports 92 4.4 Main educational attainment structures 93 4.5 Educational attainment structures and industrial development 95 4.6 Innovation inputs and outputs and their impact on employment 104 5.1 Decomposition of productivity growth by region, 1990–2005 105 5.2 Manufacturing trade openness and structural change index, Asia 106 5.3 Manufacturing trade openness and structural change index, Americas 106 5.4 Manufacturing trade openness and structural change index, Africa 107 5.5 Manufacturing trade openness and structural change index, Europe 110 5.6 Share of intermediate goods in global imports, 1990, 2000 and 2011 114 5.7 Change in wage shares in manufacturing 115 5.8 Merchandise exports as share of world total, selected regions, 1960–2011 119 6.1 Global trends in GDP, population and material use, 1980–2008 120 6.2 Correlation between per capita manufacturing value added and domestic material use, 2008 121 6.3 Decoupling economic activity from resource use and environmental impact 123 6.4 Manufacturing value added per capita and industrial energy intensity at the country level,
2010 125 6.5 Waves of innovation 125 6.6 Decomposition of manufacturing carbon dioxide emissions, 2001–2010 126 6.7 Exports of green and “close-to-green” goods and services as a share of GDP, 2000, 2005 and 2010 170 10.1 Manufacturing value added by development group, 1990–2012 172 10.2 Industrializing countries’ share in world manufacturing value added and GDP, 1990–2012 172 10.3 Share of largest industrializing economies in manufacturing value added for all
industrializing countries, 1992, 2002 and 2012 183 11.1 World manufactured exports by development group, 1992–2011 183 11.2 Technology composition of manufactured exports, 1992–2011 184 11.3 Average change in world market share by technological level, 2006–2011 186 11.4 Share of manufactured exports of developing countries by region, 2000–2011 186 11.5 Largest country share in regional manufactured exports, 2003, 2007 and 2011 188 11.6 Change in regional world market share by region and technological level of manufactured
exports, 2006–2011 188 11.7 Trade patterns between industrialized and industrializing countries, 2006–2011 189 11.8 Manufactured exports between industrializing countries, 1996–2011 190 11.9 Manufactured exports markets by region, 2003, 2007 and 2011 192 11.10 Growth of manufactured exports in selected industrializing countries, 1996–2011

ix
Co
nt
en
ts
Page
Tables 4 S1 Structural change, skill demand and education and training 9 S2 Manufacturing value added in industrializing countries, by industrialization level, region
and income group, 1992, 2002 and 2012 10 S3 World manufactured exports by industrialization level, region and income group, 1997–2011,
selected years 18 1.1 Gross value added in agriculture, industry (including manufacturing) and services as a
share of GDP at current prices, selected countries and regional averages, 1950–2005 25 1.2 Shares of value added and employment by income group and sector, 1991–2010 34 1.3 Female employment share in manufacturing by region, selected periods, 1985–2007 41 2.1 Shares in global formal manufacturing employment by country, 1970, 1990 and 2010 42 2.2 Composition of manufacturing-related services 44 2.3 Net manufacturing exports, 1970, 1990 and 2011 50 2.4 Spatial concentration of employment in the United States, 1970 and 2000 51 2.5 Spatial concentration of employment in producer-related services in the United States,
1970 and 2000 58 3.1 Speed of manufacturing development, the Republic of Korea, Malaysia and Sri Lanka 60 3.2 Classification of manufacturing industries by technology group 71 3.3 Emerging trends of manufacturing industries since 1980 76 3.4 Wage, value added and female employment 87 4.1 Education and labour force participation in the European Union among men and women 88 4.2 Returns to investment in education by level and region 88 4.3 Average returns to investment in university, engineering graduates 90 4.4 Structural change, skill demand and education and training 96 4.5 Average firm size by country income group, selected periods, 1981–2007 104 5.1 Share of manufactured exports by technological classification, 1985 and 1998 108 5.2 Export concentration and export revenue volatility, 2002 and 2008 109 5.3 Coefficients of variation of GDP growth rates in different economy groups, 1997–2007 110 5.4 Effects of $1,000 of Chinese exports to the world, free on board, on total employment by
sector, 2007 111 5.5 World trade to income elasticity, selected years, 1950–2009 116 5.6 Greenfield projects by industry, 2012 129 6.1 Debate on issues of green jobs 171 10.1 Manufacturing value added in industrializing countries, by industrialization level, region
and income group, 1992, 2002 and 2012 173 10.2 Technology composition of manufacturing value added, by industrialization level, region
and income group, selected years, 2002–2011 175 10.3 Share of manufacturing value added within development group, by industry sector, selected
years, 2002–2011 176 10.4 Share of manufacturing value added in industry sectors, by development group, selected
years, 2002–2011 177 10.5 Leading producers in the five fastest growing industry sectors, 2005 and 2011 179 10.6 Manufacturing value added by industrialization level, region and income group, 2007–2012

xx
Co
nt
en
ts
181 11.1 World exports by product category, 2006–2011 182 11.2 World manufactured exports by region and income group, selected years, 1997–2011 185 11.3 Twenty most dynamic manufactured exports, 2007–2011 191 11.4 World manufactured exports by industrialization level, region and income group, 2006–2011 194 A1.1 Growth of per capita value added and labour productivity 196 A3.1 Indicators of industrial performance by economy, 2006 and 2011 204 A4.1 Technology classification of exports, SITC Revision 3 204 A4.2 Technology classification of exports, SITC Revision 1 205 A5.1 Technology classification of manufacturing value added, ISIC Revision 3 205 A5.2 Technology classification of manufacturing value added, ISIC Revision 2 206 A6.1 Manufacturing value added per capita, 2007–2011 207 A6.2 Share of manufacturing value added in GDP, 2007–2011 208 A6.3 Share of manufacturing value added in world manufacturing value added, 2007–2011 209 A6.4 Share of medium- and high-technology activities in manufacturing value added, 2007–2011 210 A6.5 Manufactured exports per capita, 2007–2011 211 A6.6 Share of manufactured exports in total exports, 2007–2011 212 A6.7 Share in world manufactured exports, 2007–2011 213 A6.8 Share of medium- and high-technology activities in manufactured exports, 2007–2011 214 A7.1 Total exports, all commodities, 2007–2011 215 A7.2 Primary exports, 2007–2011 216 A7.3 Resource-based manufactured exports, 2007–2011 217 A7.4 Low-technology manufactured exports, 2007–2011 218 A7.5 Medium-technology manufactured exports, 2007–2011 219 A7.6 High-technology manufactured exports, 2007–2011 220 A8.1 Countries and economies by region 222 A8.2 Countries and economies by industrialization level 224 A8.3 Countries and economies by income 226 A8.4 Countries and economies by income
Page
xi
Foreword
Since the eruption of the financial crisis in 2008, much of the public debate has focused, after decades of silence, on development economics: how to sus-tain growth, create lasting jobs, generate incomes and enable the accumulation of wealth, thus eradicating
the scourge of poverty and preventing social polariza-tion and fragmentation. The rising number of unem-ployed people in industrialized economies, the unrest in the streets of Northern Africa, the increasingly vocal demands from voters in emerging economies and the discussion towards a new international agenda for development, all point in the same direction – at the central role that productive activities and jobs have in the life of individuals and countries.
Yet, despite a legitimate wish for the contrary, jobs simply do not fall like manna from heaven. They arise out of economic development, from private entrepre-neurs and governments generating new businesses and economic activities. Sustained job creation requires structural change, or the ability of an economy to constantly generate new fast-growing activities char-acterized by higher value added and productivity and increasing returns to scale.
Since the industrial revolution, manufacturing has been at the core of structural change, consistently creating higher levels of output and employment, and leading to an unprecedented growth in incomes. The rising incomes led, in turn, to greater demand for manufactured goods and a relative decline in spend-ing on agricultural products. Productivity gains raised demand further as prices of manufactures declined even more relative to those of other goods and ser-vices. Accompanying these changes were major shifts in the labour force and population from agriculture and rural areas, initially into manufacturing and to
urban areas, and later into services. This experience has repeated itself across the globe, wherever countries have achieved a mature stage of economic and social development.
For developing countries aiming to maintain growth while sustaining job creation, manufacturing offers an opportunity not only to rebalance the econ-omy towards higher value-added sectors but also to provide a relatively wide employment base with higher labour productivity. The transition from agriculture to services, especially for low-income countries, offers the opportunity to achieve only the first objective, not the second.
UNIDO’s Industrial Development Report 2013 provides a solid foundation to correctly frame the debate on jobs in the world today. Manufacturing remains an important employer, accounting for around 470 million jobs worldwide in 2009 – or around 16 percent of the world’s workforce of 2.9 bil-lion. Moreover, the report provides a detailed and largely path-breaking account of how structural change has taken place over the last 40 years.
One of the key findings of this report is that countries need to move from lower tech to higher tech sectors, from lower value-added to higher value-added sectors and from lower productivity to higher productivity sectors. The structural change analysis performed for this report indicates that while condi-tions may vary significantly across time and space and technological change may still bring large surprises, the trends of the past are very likely to stretch into the future. There is much to learn from understanding history and what drove it. And there is much to learn by developing countries from countries both slightly – and further – ahead of them.
The report highlights how, nearly 40 years after Member States of UNIDO issued the Lima Declaration at the Second General Conference of the Organization in 1975, in which they expressed their firm conviction of industry’s role as a dynamic

xiixii
For
ew
or
d
instrument of growth essential to the rapid economic and social development of the developing countries, particularly the least developed countries, the under-lying principles have stood the test of time: industri-alization remains an indispensable route to develop-ment. Industry increases productivity and generates income, reducing poverty and providing opportunities for social inclusion. As countries further develop their industries, the motivation to increase value added drives a greater application of science, technology and innovation, encourages more investment in skills and education and provides the resources to meet broader development outcomes.
As the global community embarks on formulat-ing a new development agenda to build on the foun-dation laid by the Millennium Development Goals, the report underscores the need for integrating inclu-sive and sustainable industrial development into this new agenda. This calls for an expansion of productive capacities and a growth of responsible value addition to encourage increased job creation and income gen-eration, while respecting planetary boundaries and ensuring an efficient use of scarce resources. It is only through inclusive and sustainable industrial develop-ment that countries around the world, be they indus-trialized or developing, will be able to achieve the socially equitable and ecologically sustainable eco-nomic growth that generates employment and income, and creates the wealth to achieve wider developmental goals for health, education and human rights.
Structural transformation of the economy lies at the heart of this process, together with conscious and considered measures to encourage economic growth, enhanced productivity and the development of tech-nology, innovation, infrastructure and trade. The report provides ample guidance on how to initiate and
sustain such a process – by exploring the key drivers of structural change and providing practical policy options for governments of countries at different levels of development.
The state can use policy instruments to target key drivers. Education and skills, for example, would be underprovided in a pure market-driven environment as employers have too few incentives to allocate funds for these public goods. Similarly, limited returns on investment, lack of competitive finance and coordina-tion failures make technology and innovation prone to market failures, resulting in underinvestment. Such market failures can be addressed through targeted policy measures to reduce input costs where the mar-ket is unable to provide a reliable supply system of low-cost and high-quality material inputs critical to local industries.
It gives me great pleasure to present this report at this early stage of my tenure as Director General of UNIDO. I am particularly pleased that the report underlines the critical need for international coopera-tion to achieve the structural change and economic growth required to combat poverty, and reaffirm the commitment of my Organization to fulfil its unique mandate in support of this effort. I am grateful to the UNIDO staff and the international experts that joined hands to produce this report, and look forward to seeing it become a key component in the develop-ment debate.
LI YongDirector General, UNIDO
xiii
Acknowledgements
The Industrial Development Report (IDR) 2013 was prepared under the overall guidance of LI Yong, Director General of the United Nations Industrial Development Organization (UNIDO).
IDR 2013 is the result of two years of intense research efforts, fruitful discussions and close col-laboration between the members of a cross-organi-zational team headed by Ludovico Alcorta, Director of the Development Policy, Statistics and Strategic Research Branch. This lengthy and at times arduous endeavour was coordinated by Nobuya Haraguchi, Industrial Research Officer, who played an instru-mental role in the successful completion of the report. The other members of the core team, without whom this report would not have been possible, were Manuel Albaladejo, Amadou Boly, Nicola Cantore, Michele Clara, Frank Hartwich, Philipp Neuerburg, Patrick Nussbaumer, Hedda Oehlberger-Femundsenden, Ascha Pedersen and Natascha Weisert. Many of the concepts introduced and elaborated in the report were initially developed at workshops at UNIDO head-quarters in Vienna in November 2012 and July 2013.
The invaluable contributions and insightful com-ments by international experts greatly enhanced the report’s overall quality. These included Klaus Desmet, Universidad Carlos III; Takahiro Fukunishi, Institute of Developing Economies, Japan External Trade Organization; Bill Gibson, University of Vermont; Martin Halla, Johannes Kepler University Linz; Paul Hesp, independent consultant; Michael Landesmann, Vienna Institute for International Economic Studies; Axel Marx, University of Leuven; Vivianna Prochazka, independent consultant; George Psacharopoulos, formerly London School of Economics and World Bank; Mark Tomlinson, University of Sheffield; Dirk Willem te Velde, Overseas Development Institute; Marco Vivarelli, Università Cattolica del Sacro Cuore; John Weiss, University of Bradford; and Tatsufumi Yamagata, Institute of Developing Economies, Japan External Trade Organization. Deepest gratitude is
also due to Jesus Felipe, Asian Development Bank, and Adam Szirmai, Maastricht University, who sig-nificantly improved several sections of the report. José Antonio Ocampo, Columbia University, super-vised the preparation process and provided critical inputs. Special thanks go to Irmgard Nübler and Moazam Mahmood, and their colleagues from the International Labour Organization, for their generous assistance and contributions.
The final draft benefited from valuable comments by members of the IDR Advisory Board, namely Akmel Prosper Akpa, Mohamed-Lamine Dhaoui, Sarwar Hobohm, Heinz Leuenberger, Wilfried Lütkenhorst and Philippe Scholtes. Comments by Cormac O’Reilly and Shyam Upadhyaya further enriched the report. Profound appreciation is also extended to Taizo Nishikawa, Deputy to the Director General, for the exceptional support he provided.
The authors of the report were supported by a tal-ented team of research assistants including Juergen Amann, Alexander Haider, Ulla Heher, Alejandro Lavopa, Caitlin Logan, Andreas Minichberger, Ruth Pollak, Walliya Premchit, Gorazd Rezonja and Miriam Weiss. A dedicated team of interns including Annagrazia d’Aprile, Vito Cormun, Erika Gyllstroem, Volha Lazuka, Tanguy Osmont and Pierre Rialland also contributed their efforts to this report.
Debby Lee, Fernando Russo and Iguaraya Saavedra, without whom a smooth production pro-cess would have been unthinkable, provided extensive administrative support, and Niki Rodousakis pro-vided copy-editing assistance.
The editors, Jonathan Aspin and Bruce Ross-Larson of Communications Development Incorporated, also deserve merit for fundamentally improving the report’s language, style and struc-ture. Rob Elson, Jack Harlow and Christopher Trott copy-edited and proofread the report. Elaine Wilson was in charge of the design and layout. Diane Broadley designed the cover.

xiv
References to dollars ($) are to US dollars, unless otherwise indicated.
In this report, industry refers to the manufacturing industry and sectors refers to specific manufacturing sectors.
This report defines developed countries or developed economies as the group identified as “high-income OECD countries” by the World Bank and developing countries or developing economies as all other economies. See Annex 8 for a complete list of economies by region, income level, least developed countries and largest develop-ing economy in each region.
Components in tables may not sum precisely to totals shown because of rounding.
BIT Bilateral investment treatyCSR Corporate social responsibilityEKC Environmental Kuznets CurveETC Embodied technological changeEU European UnionFAO Food and Agriculture Organization of
the United NationsFDI Foreign direct investmentFIRE Finance, insurance and real estateGDP Gross domestic productGVC Global value chainICSID International Centre for Settlement of
Investment DisputesICT Information and communications
technologyILO International Labour OrganizationISIC International Standard Industrial
ClassificationITA Industrial and Technological
Advancement IndexITC International Trade CentreMDG Millennium Development Goal
MVA Manufacturing value addedOECD Organisation for Economic
Co-operation and DevelopmentPPP Purchasing power parityR&D Research and developmentSME Small and medium-size enterpriseSOE State-owned enterpriseTVET Technical and vocational education and
trainingUN United NationsUNCTAD United Nations Conference on Trade
and DevelopmentUNDESA United Nations Department of
Economic and Social AffairsUNDP United Nations Development ProgrammeUNEP United Nations Environment ProgrammeUNFSS UN Forum on Sustainability StandardsUNIDO United Nations Industrial Development
OrganizationWIOD World Input-Output DatabaseWTO World Trade Organization
Technical notes and abbreviations

xv
Backward linkage. Input-output production relation between suppliers and purchasers from the view-point of purchasers.
Bilateral investment treaties (BITs). Agreements between two countries to promote and protect investments in each other’s territories.
Capital goods. Goods used in the production of other goods and services.
Commodification. Transformation of goods into undifferentiated products whose prices are increas-ingly determined by greater application of a market mediation characterized as perfect competition.
Corporate social responsibility. Ethical and moral responsibilities that corporations have in addition to their responsibilities to comply with law and regulations.
Decoupling. Weakening or breaking the link between environmental effects and economic activity so that output increases with a less than commensu-rate increase (or with a decrease) in energy con-sumption (Von Weizsäcker 1989; Enevoldsen, Ryelund and Andersen 2007). Absolute decoup-ling in industry is when the decrease in material, energy and pollution intensity is greater than the growth rate in manufacturing (OECD 2002; Spangenberg, Omann and Hinterberger 2002). Relative decoupling is when the growth rate of manufacturing value added is higher than that of industrial energy consumption.
Deindustrialization. Long-term decline in manufac-turing relative to other sectors. Typically measured in terms of a share of manufacturing employment in total employment.
Elasticity. Percent change in one due to 1 percent change in another. For example, the growths of value added, employment and labour productivity as per unit increase in GDP per capita can be meas-ured as percentage change in these variables due to 1 percentage point increase in GDP per capita. Income elasticity of demand is percentage change
in demand due to 1 percentage point change in income.
Externalities. Costs or benefits that accrue to unre-lated third parties. When it is a benefit reaped by third parties, it is called a positive externality. When it is a cost imposed on third parties, it is called a negative externality. Externality is a mar-ket failure that provides rational for industrial pol-icy. Hausmann and Rodrik (2003, 2006) identify three main types of externalities that are particu-larly relevant for new activities to emerge: coordi-nation externalities, as specific new industries or activities require simultaneous, large investments to become profitable; information externalities, as “discovery” of new activities requires an invest-ment whose returns cannot be fully appropriated by the investor; and labour training externalities, as firms regard labour mobility as a disincentive to invest in on-the-job training, thus reducing tech-nological spillovers.
Gross cell product. A measure of geographical con-centration, based on the output per area of 1 degree longitude by 1 degree latitude.
Induced effects. Impact on household spending due to changes in income.
Industrial energy efficiency. The ratio of the useful or desired output of a process to the energy input into a process; for a higher aggregated level (sector, economy or global), the ratio of the amount of eco-nomic activity produced from one unit of energy.
Industrial energy intensity. The amount of energy used to produce one unit of economic activity across all sectors of an economy; related to the inverse of energy efficiency but only at the sectoral, economy or global level.
Industrial policy. Any type of intervention or govern-ment policy that attempts to improve the business environment or to alter the structure of economic activity towards sectors, technologies or tasks that are expected to offer better prospects for economic
Glossary

xvixvi
Glo
ss
ar
y
growth or societal welfare than would occur in the absence of such intervention – that is, in the mar-ket equilibrium (Warwick 2013).
Informal economy. It is part of the economy that is operated outside the purview of government, thus not taxed and included in statistics.
Input-output multiplier effects. Effects leading to an increase in output, which is greater than the amount of initial final demand. For example, demand for 100 vehicles would increase total out-put of the economy greater than the value of 100 vehicles because the demand increases not only the output of direct inputs to vehicle production but also the output of indirect inputs (inputs to sup-pliers, inputs to the suppliers’ suppliers and so on).
Intermediate goods. Goods used as inputs in the pro-duction of other goods and services
Labour intensity. Relative proportion of labour used in production. It is approximated in this report as the number of employment per unit of value added.
Manufacturing-related service / producer-related service. Service activities whose demands arise largely from manufacturing production. Wholesale, retail, transportation services for goods and business services (including, for example, rent-ing services of machinery and equipment, research and development, and computer and related ser-vices) are considered major components of manu-facturing-related services.
Manufacturing value added. See value added.Non-manufacturing industries. Industries that
comprise mining and quarrying, construction and public utilities (electricity, gas and water).
Purchasing power parity (PPP). A concept that determines the relative values of two currencies in terms of purchasing power. PPP-based GDP shows what goods and services produced in one country would cost if they were sold in the United States. Since non-tradable services of similar quality are priced lower in low-income countries than they are in the United States, their PPP-based GDPs usu-ally become higher than their GDPs based on mar-ket exchange rates.
Private return to education. Private rate of returns to education is calculated using after-tax earnings dif-ferentials and only those educational costs actually borne by the student or their family (Amin and Awung 2005).
Process innovation. Innovation that alters the system of production to reduce costs or improve quality.
Product innovation. Innovation that alters the prod-uct mix by creating either genuinely new products or products adapted from existing designs.
Skill-biased technological change. Technological change that does not lead to proportional change in the demand for unskilled and skilled labour but results in greater demand for skilled labour.
Social return to education. Social rates of return are based on before-tax earnings differentials or total earnings and the total resources the society incurred on education (Amin and Awung 2005).
Structural change. Change in the long-term compo-sition and distribution of economic activities. A normative perspective of structural change often emphasizes desirability in the direction of change. For example, Ocampo (2005), Ocampo and Vos (2008) and UNDESA (2006a) define structural change as the ability of an economy to continu-ally generate new dynamic activities characterized by higher productivity and increasing returns to scale.
Technological levels of manufacturing industries. Manufacturing industries can be grouped into three technological categories – low tech, medium tech and high tech. They are based on research and development intensity relative to value added and production, following the technology classification of the Organisation for Economic Co-operation and Development (OECD 2005). In this report high tech and medium-high tech of the OECD classification are combined and called high tech, and medium-low tech industry of the OECD clas-sification is called medium tech.
Total factor productivity. A variable that represents the amount of output not accounted for by the amount of factor inputs, such as labour and capital.
xvii
Glo
ss
ar
y
Unit labour costs. Cost of labour per unit of output. It is calculated as the ratio of labour costs to real output.
Value added. A measure of output net of interme-diate consumption, which includes the value of materials and supplies used in production, fuels and electricity consumed, the cost of industrial
services such as payments for contract and com-mission work and repair and maintenance, com-pensation of employees, operating surplus and consumption of fixed capital. Manufacturing valued added is the contribution of the entire manufacturing sector to GDP (manufacturing net output).


1
Executive summary
Sustaining employment growth: The role of manufacturing and structural change
Industrial structural change and employment
Jobs do not fall like manna from heaven. They arise from the process of economic development and from the efforts of entrepreneurs and governments to gener-ate new enterprises and economic activities. Sustained job creation requires structural change, that is, the ability of an economy to constantly generate new fast-growing activities characterized by higher value added and productivity as well as increasing returns to scale. Manufacturing offers greater opportunities than other sectors to accumulate capital, exploit econ-omies of scale, acquire new technologies and – more fundamentally – foster embodied and disembodied technological change. It is thus the core of economic growth and structural transformation.
Since the industrial revolution, manufactur-ing has driven output and employment, sparked by improvements in mechanization and leading to unprecedented incomes. The higher incomes have led to greater demand for manufactured products and a relative decline in spending on agricultural goods. Productivity gains raised demand further as the prices of manufactures declined even more relative to those of other goods and services. Accompanying these
changes were major labour force and population shifts from agriculture and rural areas into manufacturing and urban areas, and later into services.
The role of manufacturing changes as structural change evolves. At lower incomes the application of low capital-intensive technologies allows for improvements in both productivity and employment. As the capital intensity of technology increases, productivity gains dominate and employment shifts towards manufactur-ing-related and other services. Manufacturing remains an important employer, with around 470 million jobs worldwide in 2009 – or around 16 percent of the world’s workforce of 2.9 billion – a figure far higher than many might expect (Figure S1). Manufacturing must therefore have more than half a billion jobs in 2013.
For developing countries aiming to maintain growth while sustaining job creation, manufacturing offers an opportunity not only to re-balance the econ-omy towards higher value-added sectors but also to provide a relatively wide employment base with higher than average labour productivity. This contrasts with a direct transition from agriculture to services, espe-cially for low-income countries. Services offer the
Key messages• Manufacturing – with around 470 million jobs in 2009, or one in six jobs globally – still matters for employment gen-
eration. In 2013, there likely are more than half billion jobs in manufacturing.
• Manufacturing employment is rising in developing countries and falling in developed countries, but the declines in
developed countries are mitigated by the growth of manufacturing-related services.
• least developed countries have immense potential for industrialization in food and beverages (agroindustry), and
textiles and garments, with good prospects for sustained employment generation and higher productivity.
• Middle-income countries can benefit from entering the basic and fabricated metals industries, which offer a range of
products necessary for investment and are demanded by the more advanced industries and which are facing rapidly
growing international demand.
• developed countries have great possibilities for investing and innovating in high-tech industries and for sustaining
jobs in these industries’ related services.
• Industrialization improves not only the number of jobs but also their quality in all countries.
• Manufacturing concentrates in cities at early stages of development and “suburbanizes” at later stages. Cities thus
remain crucial for industrialization in developing countries.

22
ex
eC
ut
Ive
su
MM
ar
y
“Shifts in the relative shares of industries
go hand in hand with geographical shifts in
the location of people, often driven by trade
opportunity to achieve only the first objective, not the second. Least developed countries, mainly in Africa, have openings in low-tech labour intensive industries like agroindustry, textiles and apparel (see also Lin 2012). Middle income countries could benefit from entering medium-tech industries such as basic and fabricated metals. Although they do not generate large amounts of employment they are high-productivity industries and can generate resources for investment. Their products include steel, bricks, cement, boilers, metallic structures, hand tools and plastics, most of them intermediate goods in high demand by more advanced industries and enjoying growing interna-tional demand. Manufacturing also offers the poten-tial to boost wages and incomes, helping to create a domestic market.
The impact of manufacturing structural change on employment also has a spatial dimension. Shifts in the relative shares of industries go hand in hand with geo-graphical shifts in the location of people, often driven by trade. Historically manufacturing moved from the United Kingdom to Continental Europe and to the
United States and later to Japan. Today it is moving towards East Asia, including the Republic of Korea and mainland China. Yet employment is not equally distributed between emerging and traditional indus-trial powerhouses. And within countries manufac-turing is usually more geographically concentrated in cities during the structural change from agriculture to manufacturing, reflecting agglomeration economies. However, this trend has reversed somewhat in devel-oped economies – which are “suburbanizing” – as ser-vices become more important.
The impact of within-manufacturing structural change – the shift from low-, to medium-, to high-technology industries – on employment varies by type of industry. Low-tech industries produce vast employment opportunities and some possibilities for capital accumulation. Medium- and high-tech indus-tries offer opportunities for capital accumulation but generate less employment than do low-tech industries. High-tech industries offer, in addition, openings for innovation and new knowledge and skill development and thus the capacity to invent new industries and
Figure S1 Number of jobs created by manufacturing industry, 1970–2009
0
100
200
300
400
500
200920052000199519901985198019751970
Empl
oym
ent,
head
coun
t (m
illio
ns)
Informal (extrapolated)InformalManufacturing-related (extrapolated)Manufacturing-related Formal
Note: The total informal jobs before 1995 were extrapolated based on the formal-informal ratio for 1995, because there are a far larger number of missing values in country data before 1995. This made it impossible to estimate the informal employment of individual countries and sum them up to derive total informal jobs before 1995.Source: UNIDO estimate based on ILO (2011a, 2013), UNIDO (2012a) and Timmer (2012).

3
ex
eC
ut
Ive
su
MM
ar
y
“As developing countries move
up the structural change ladder,
manufacturing will continue to contribute
to the quality of employment by
improving wages and by providing wider
opportunities for female employment
restart the structural change cycle. It is these capaci-ties to accumulate capital and to innovate, alongside a growing division of labour of service activities, which produce employment opportunities.
In developed countries, manufacturing remains an engine of growth in that it is the main source of finan-cial and knowledge resources for sustaining growth and (to some extent) for creating jobs. But the bulk
of new jobs are in the services for further developing manufacturing and for producing industrial goods. It is difficult to conceive of these activities as separate from manufacturing. As developing countries move up the structural change ladder, manufacturing will continue to contribute to the quality of employment by improving wages and by providing wider opportu-nities for female employment.
Drivers of structural change in manufacturing
Traditional and emerging driversThe previous section depicted structural change across sectors and within manufacturing industry and the relationship to employment. But what are the drivers of this structural change? And how do they sustain employment through structural change? Certainly the interactions are extremely diverse, complex and non-linear. This section discusses the reasons for structural change in manufacturing.
In principle, structural change in any sector in any country is governed by the conditions of demand and supply for products and services that interact with each other. Supply-side conditions generally include wages, skills, technological change, industrial organization and the overall business environment, which also determine the competitiveness of industry. Demand-side conditions include demand for imports and exports as well as foreign direct investment (FDI). Often, some of these drivers work through both demand and supply.
Wages are both a constraint on and a result of the process of structural transformation. They are
a constraint in that high wages may push investors away from a project, particularly in labour-intensive industries, although most investors do not take invest-ment decisions on wages alone but also look into other factors like productivity, infrastructure, logisti-cal facilities and supplies (cost and availability). Too high wages may prompt a withdrawal of investment, leading to deindustrialization and falling employ-ment, while attractive wages may generate more and new work opportunities. Wages are also a result of the process of structural change – as workers move up to higher value-added industries and raise their produc-tivity, they receive higher salaries.
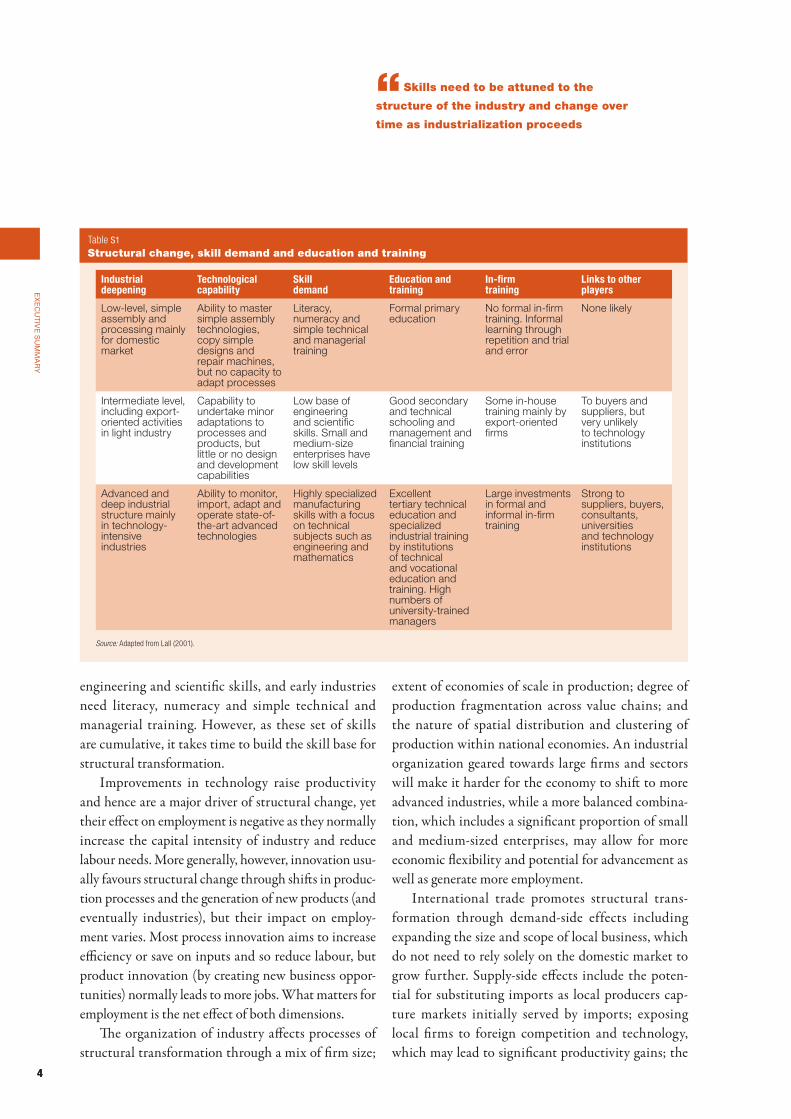
Skills need to be attuned to the structure of the industry and change over time as industrialization proceeds (Table S1). Most sophisticated industrial sec-tors require different types of skills than less advanced ones. Advanced industries require highly special-ized manufacturing skills with a focus on technical subjects such as engineering and mathematics and strong technical and vocational education and train-ing. Intermediate industries require a low base of
Key messages• Costs, as well as technology and demand, remain critical drivers of structural change and industrial development.
• Matching the type of skills to the structure of industry as incomes grow can drive industrial structural change.
• Product innovation results in structural transformation and generates employment through the creation of new busi-
ness opportunities.
• resource efficiency, emerging as a major driver of structural change and industrial development, will be even more
important in the future.
• the impact of the drivers of structural change on sustaining employment depends on the industrial policies adopted.
44
ex
eC
ut
Ive
su
MM
ar
y
“Skills need to be attuned to the
structure of the industry and change over
time as industrialization proceeds
engineering and scientific skills, and early industries need literacy, numeracy and simple technical and managerial training. However, as these set of skills are cumulative, it takes time to build the skill base for structural transformation.
Improvements in technology raise productivity and hence are a major driver of structural change, yet their effect on employment is negative as they normally increase the capital intensity of industry and reduce labour needs. More generally, however, innovation usu-ally favours structural change through shifts in produc-tion processes and the generation of new products (and eventually industries), but their impact on employ-ment varies. Most process innovation aims to increase efficiency or save on inputs and so reduce labour, but product innovation (by creating new business oppor-tunities) normally leads to more jobs. What matters for employment is the net effect of both dimensions.
The organization of industry affects processes of structural transformation through a mix of firm size;
extent of economies of scale in production; degree of production fragmentation across value chains; and the nature of spatial distribution and clustering of production within national economies. An industrial organization geared towards large firms and sectors will make it harder for the economy to shift to more advanced industries, while a more balanced combina-tion, which includes a significant proportion of small and medium-sized enterprises, may allow for more economic flexibility and potential for advancement as well as generate more employment.
International trade promotes structural trans-formation through demand-side effects including expanding the size and scope of local business, which do not need to rely solely on the domestic market to grow further. Supply-side effects include the poten-tial for substituting imports as local producers cap-ture markets initially served by imports; exposing local firms to foreign competition and technology, which may lead to significant productivity gains; the
Industrial deepening
Technological capability
Skill demand
Education and training
In-firm training
Links to other players
Low-level, simple assembly and processing mainly for domestic market
Ability to master simple assembly technologies, copy simple designs and repair machines, but no capacity to adapt processes
Literacy, numeracy and simple technical and managerial training
Formal primary education
No formal in-firm training. Informal learning through repetition and trial and error
None likely
Intermediate level, including export-oriented activities in light industry
Capability to undertake minor adaptations to processes and products, but little or no design and development capabilities
Low base of engineering and scientific skills. Small and medium-size enterprises have low skill levels
Good secondary and technical schooling and management and financial training
Some in-house training mainly by export-oriented firms
To buyers and suppliers, but very unlikely to technology institutions
Advanced and deep industrial structure mainly in technology-intensive industries
Ability to monitor, import, adapt and operate state-of-the-art advanced technologies
Highly specialized manufacturing skills with a focus on technical subjects such as engineering and mathematics
Excellent tertiary technical education and specialized industrial training by institutions of technical and vocational education and training. High numbers of university-trained managers
Large investments in formal and informal in-firm training
Strong to suppliers, buyers, consultants, universities and technology institutions
Source: Adapted from Lall (2001).
Table S1 Structural change, skill demand and education and training

5
ex
eC
ut
Ive
su
MM
ar
y
“Countries need to move from lower- to
higher-tech, from lower value-added to higher
value-added, and from lower-productivity to
higher-productivity sectors, industries and
activities if they want to develop industrially
possibility of capturing valuable externalities and dynamic returns to scale; and by generating opportu-nities for attracting additional FDI. Yet the evidence suggests that the impact of international trade is ambiguous and depends on additional economic and policy conditions.
Global value chains (GVCs) help structural trans-formation by segmenting the production process and facilitating the relocation of production. In produc-ing a final product in one location, there may be little scope for changing the capital–labour ratio, but once it becomes possible to fragment production into a series of stages there will inevitably be some that are more labour intensive than others and, with low transport and communication costs, it may be cost effective to locate these in a low-wage economy. Technologically, participating in value chains makes industrialization “easier and faster” but at the same time locally “less meaningful”, as firms in developing countries can link to international production networks and draw on the technological and marketing prowess of the lead firms in these chains while not making the effort themselves (Baldwin forthcoming). GVCs’ impact on employ-ment tends to be positive, though it also depends on whether local production has been displaced.
FDI influences structural change by encouraging the development of clusters and exploitation of cluster economies (when domestic investment is unavailable). It promotes diversification into new sectors, particu-larly when it is attracted to new high-tech sectors, and through spillover effects, which make local firms more competitive and attract local firms into new activities. FDI does not, however, automatically generate struc-tural change, as spillovers only work if local entrepre-neurs are involved.
Resource constraints have traditionally not been a driver of structural change but, given the polluting impact of industrialization in the past, environmen-tal protection will become a key driver in the future. Further, wasteful production and consumption pat-terns – along with continued soil degradation, defor-estation and overfishing – are already exacerbating water shortages and escalating prices for food, energy
and other commodities. Efficient use of inputs, there-fore, has clear economic advantages, boosting com-petitiveness and generating resources for investing in further growth and structural transformation.
Drivers as necessary conditionsAs said at the start of this report, jobs do not fall like manna from heaven – and neither of course is struc-tural change imposed this way. Yet one of the key themes of this report is that countries need to move from lower- to higher-tech, from lower value-added to higher value-added, and from lower-productivity to higher-productivity sectors, industries and activi-ties if they want to develop industrially. The struc-tural change analysis for this report indicates that while conditions may vary greatly across time and space and that technological change may still throw up huge surprises, the regularities from the past are very likely to stretch into the future. There is much to learn from understanding history and what drove it. And developing countries can learn much from countries that are ahead of them – far ahead or even just slightly.
The impact of drivers on structural change, how-ever, has not been, and will not be, unambiguous. Wages can support – or hinder – employment genera-tion depending on how they are set. The timing of the availability of skills seems to be crucially important to support the emergence of new jobs. Technology sheds labour if it is process oriented but generates labour if it is product oriented. International trade does not always lead to a virtuous circle of structural change and employment, as the contrasting experi-ences of East Asia and Latin America illustrate. A simple examination of each of the drivers will reveal that their impact may go in either direction, which is complicated by the fact that drivers often interact with each other before generating an impact.
The state (alongside the private sector) needs to work hard at ensuring that the drivers have a posi-tive impact on employment generation while trans-forming the economy. Through government policy targeting key drivers, such as education and skills,

66
ex
eC
ut
Ive
su
MM
ar
y
“By promoting positive structural change at
all development stages and by overseeing close
coordination with other policies so that there is
consistency in action, governments can have a
major impact on sustaining employment generation
appropriability and/or international trade, govern-ments can set in motion a virtuous rather than a vicious circle involving structural change. Well-run interventions can promote industrial growth and employment, as confirmed by the results of recent impact evaluations for high-income countries. By pro-moting positive structural change at all development stages and by overseeing close coordination with other policies so that there is consistency in action,
governments can have a major impact on sustaining employment generation. But developing countries should not simply emulate high-income countries, and may well benefit from showing f lexibility in experimenting, learning and evaluating.
Drivers are thus necessary conditions for successful structural change but will require a good set of well-coordinated government policies in order to make industrialization work for employment generation.
National and international industrial policy
Promoting structural changeIndustrial policy – the main objective of which is to “anticipate structural change, facilitating it by remov-ing obstacles and correcting for market failures” (Syrquin 2007) – should seek to promote such change at each stage of development, in four main ways: as a regulator establishing tariffs, fiscal incentives or subsi-dies; as a financier influencing the credit market and allocating public and private financial resources to industrial projects; as a producer participating directly in economic activity through, for example, state enter-prises; and as a consumer guaranteeing a market for strategic industries through public procurement pro-grammes (Peres and Primi 2009).
At an early stage of industrialization (from agri-culture to low-technology manufacturing), indus-trial policy should primarily aim to align agricultural and industrial policies and create or support labour- intensive and resource-based manufacturing with low entry barriers; towards the middle-income stage, by improving manufacturing’s efficiency and productivity
and through diversifying and upgrading the economic structure; and at an advanced stage through technolog-ical innovation, pursuing both differentiation by rais-ing quality and innovation by launching new products and services, including green technology.
Targeting key drivers of structural changeThe state can use policy instruments to target key drivers. Education and skills, for example, would be underprovided in a pure market-driven environment as employers have too few incentives to provide funds for them. Similarly, limited appropriability, lack of competitive finance and coordination failures make technology and innovation prone to market failures, resulting in underinvestment (Martin and Scott 2000). And as a reliable supply system of low-cost and high-quality material inputs is critical to local indus-tries, countries sometimes use policy instruments to reduce input costs.
The targeting of key drivers requires close coordi-nation with other policies – notably on competition,
Key messages• achieving sustained employment generation requires industrial policies to focus on the structural transformation of
the economy.
• the state can promote industrial policy either as a regulator, financier, producer or consumer. It should oversee
close coordination with other policies as they can undermine the objectives of industrial policy if they are misaligned.
• For industrial policy to be effective, the policy-making process is as important as the policy content.
• International cooperation in the areas of labour standards, investment and sustainable economic development tar-
gets after 2015 is key to ensure that industrialization generates much needed high-quality jobs.
7
ex
eC
ut
Ive
su
MM
ar
y
“Coordination is particularly important
because competition and industrial policies
are often viewed as mutually conflicting
trade and FDI, and exchange rates – that play an important complementary role to industrial policy. Failure to ensure synergies may counteract policy objectives. Coordination is particularly important because competition and industrial policies are often viewed as mutually conflicting, as the former typically aims to foster rivalry between firms in an industry (for greater efficiency and economic welfare), while the lat-ter frequently gives a market advantage over competi-tors to favoured domestic sectors or industries.
Coordination among trade and FDI policies helped, for example, former low-income countries such as the Republic of Korea to catch up, and today despite restrictions imposed by bi- and multilateral trade policy agreements, governments still have some space to use trade-related instruments for industrial policy, especially non-tariff barriers (Chang 2003). They can also use export-promotion instruments that support exporters’ access to competitive financing, research and development (R&D) and training.
Measures such as close monitoring of the real exchange rate and keeping it undervalued to support the tradable sector, primarily manufacturing (includ-ing manipulation of the nominal exchange rate), have featured in almost all successful catch-up countries (for example, Rodrik 2008a). They are also crucial in preventing the current account deficit from becoming unsustainable (McCombie and Thirlwall 2004).
Developing skillsMost governments agree that human capital is a cru-cial driver of economic growth. Some of the elements in successful skill policies are: appreciating the com-plexity of industrial skill needs; matching short-term needs and long-term goals; creating skills gradually and sequentially; matching supply and demand; and aligning skill policies with the broader socio-eco-nomic agenda.
At the “hard end”, manufacturing employers are not just looking for technical skills but also for cogni-tive, social and behavioural skills. Some consider team work and problem solving key for blue-collar workers, and critical thinking crucial for white-collar workers
(Bodewig 2012). Many of these soft skills have to be developed at an early age, hence the importance of supporting policies that establish the learning founda-tions of the future workforce. Beyond that stage, the last few decades have seen a strong emphasis on tech-nical and vocational education and training (TVET) to meet the demand for industrial skills. Private sec-tor involvement – through, for example, inter-firm linkages and university–private sector collaboration, including on-the-job training – is crucial because this is the most efficient way to link skills to the labour market (DFID 2011).
Still, lack of financing for high-quality TVET remains a bottleneck, but it remains important to pro-duce training for the informal sector, both to develop that sector and to strengthen the link between the informal and formal sectors, making it easier for workers to move to the latter.
Getting industrial policy to workCarefully chosen and implemented interventions can promote industrial growth and employment, as con-firmed by evidence from the results of impact evalua-tions for high-income countries published in 2010 and 2012. For instance, subsidies to manufacturing firms can increase employment at comparably very low cost per job (Criscuolo et al. 2012). Well-allocated firm-level subsidies can also boost total factor productivity (Aghion et al. 2012), and tariffs that account for the varying skill levels among industries have the potential to boost economic growth (Nunn and Trefler 2010).
These types of studies must be interpreted with great caution, however. First, many were not per-formed thoroughly enough and hence an assessment of their internal validity suggests that causal relation-ships between policy instruments and observable impacts are hard to establish. Second, the findings on the achievements or failures that can be distilled from international experiences cannot easily be generalized because of country heterogeneity.
One upshot, though, is that evidence-based and realistic industrial policy run in a consensual way, which is key for effectiveness, irrespective of the

88
ex
eC
ut
Ive
su
MM
ar
y
“Each country has to go through its own
learning process – combining industrial
policy experimentation with rigorous impact
evaluation to generate an evidence base on
which industrial policy measures work
concrete instruments used. Thus those making such policy should:• Use – do not fight – the political system. A fact of
political life is that no policy will be underwritten unless those in power agree to it.
• Strengthen political leadership. This will set a national transformation agenda that aims, in low-income countries, to create and nurture produc-tive activities or, in middle-income countries, to advance technologically.
• Encourage public–private dialogue. This will help both in designing interventions that draw on expert knowledge in the private sector and in ensuring that all key stakeholders support decisions.
• Boost industrial policy management capabilities. These have to be strengthened considerably among key actors in developing countries in a pragmatic and concentrated way.International experience with policy instruments
can provide interesting lessons, but developing coun-tries are unlikely to succeed with simple emulation of high-income economies because a strategic approach to forming industrial policy has to be tailored to national circumstances. Each country has to go through its own learning process – combining industrial policy experimentation with rigorous impact evaluation to generate an evidence base on which industrial policy measures work, and which do not, in a given context.
Cooperating internationallyInternational cooperation on structural change is required to prevent any “race to the bottom”, where firms in rich countries could be tempted to relocate to low-income countries with lower labour costs, less restrictive labour laws, and weaker monitoring of labour conditions and environmental impacts. At the same time, to address these challenges, national regu-lators need a measure of policy autonomy, a position that may be at odds with international cooperation through trade agreements.
Cooperation is also required for the fairly new area of “private sustainability standards”, which emerged once social activists discovered that reputation was a firm’s tangible asset that they could easily harm. Another key legal instrument for international coop-eration is the bilateral investment treaty, which can allay concerns of expropriation.
As the world examines how to move beyond the Millennium Development Goals after 2015, it can look to build a framework with goals anchored in the three dimensions – economic, social and environ-mental – of sustainable development. Generating new employment is a pivotal global social concern as well as challenge, and the post-2015 agenda offers a new opportunity for states to recouple considerations for sustainable manufacturing and employment with the focus on human development.
Trends in manufacturing valued added and in manufactured exports
Manufacturing value addedThe world’s manufacturing value added (MVA) reached an all-time high of $8,900 billion in 2012 (16.7 percent of global GDP), recovering fully from the sharp contraction of 2008–2009 caused by the global economic and financial crisis. MVA’s share in GDP in industrialized countries fell from 16.4 percent in 1990 to 15.0 percent in 2012, when it rose from 16.5 percent to 21.3 percent in industrializing coun-tries. (See Annex 8 for classification of industrialized and industrializing economies.)
Between 1992 and 2012 global MVA nearly dou-bled, averaging 3 percent annual growth. While indus-trialized countries’ MVA expanded by a mere 1.8 per-cent a year, below their 2.1 percent GDP growth for the period, MVA in industrializing countries rose more than three-fold, at an annual rate of 6.4 per-cent, faster than their 5.0 percent GDP growth rate (Table S2). The outcome was a near-doubling in indus-trializing countries’ share in world MVA, from 18 per-cent in 1992 to 35 percent in 2012 and a mirroring retreat of industrialized countries from the world’s

9
ex
eC
ut
Ive
su
MM
ar
y
“Manufacturing in industrializing countries
is geographically highly concentrated, with
the five leading economies accounting for
70.9 percent of total production in 2012
manufacturing scene, underscoring the structural changes taking place in both groups.
Manufacturing in industrializing countries is geo-graphically highly concentrated, with the five leading economies accounting for 70.9 percent of total produc-tion in 2012, up from 52.7 percent in 1992. The high and sustained MVA growth in China over this period (11.4 percent on average) is behind its emergence as the factory of the world: in 2012, 50 percent of indus-trializing-country manufactured goods was produced in China. Of all other large industrializing-economy
manufacturers, only India (7.4 percent average annual MVA growth) kept pace with China’s expansion. It gained MVA share to become the second leading man-ufacturer among industrializing economies, supersed-ing Mexico and Brazil, which saw their MVA shares fall by more than half from 11.7 percent and 10.5 per-cent in 1992 to 5.7 percent and 4.9 percent in 2012. Turkey’s steady MVA growth (4.5 percent on average a year over 1992–2012) enabled it to preserve its posi-tion as the fifth largest manufacturer among industri-alizing economies.
Manufacturing value added (constant 2005 $ billion)
Share of manufacturing value added (percent)
1992 2002 2012 1992 2002 2012
World 4,960 6,590 8,900 100 100 100
Industrialized economies 4,050 5,070 5,800 82 77 65
Industrializing economies 904 1,520 3,110 18 23 35
By industrialization level
Emerging industrial economies 778 1,340 2,820 86 88 91
Other industrializing economies 111 157 240 12 10 8
Least developed countries 14 22 44 2 1 1
By region
East Asia and the Pacific 267 684 1,810 30 45 58
Excluding China 87 149 253 10 10 8
Europe 92 106 186 10 7 6
Excluding Poland 74 68 97 8 4 3
Latin America and the Caribbean 320 391 517 35 26 17
Excluding Mexico 214 246 340 24 16 11
Middle East and North Africa 96 134 221 11 9 7
Excluding Turkey 49 71 107 5 5 3
South and Central Asia 81 143 294 9 9 9
Excluding India 32 49 89 4 3 3
Sub-Saharan Africa 48 62 84 5 4 3
Excluding South Africa 20 25 37 2 2 1
By income group
High income industrializing 175 273 495 19 18 16
Upper middle income industrializing 57 91 163 6 6 5
Lower middle income industrializing 657 1,140 2,410 73 75 78
Low income industrializing 15 21 41 2 1 1
Source: UNIDO estimate based on UNIDO (2013c).
Table S2 Manufacturing value added in industrializing countries, by industrialization level, region and income group, 1992, 2002 and 2012
1010
ex
eC
ut
Ive
su
MM
ar
y
“World exports grew by 6.4 percent
annually between 2007 and 2011 to reach
$16.7 trillion in 2011, more than 80 percent
of it consisting of manufactured products
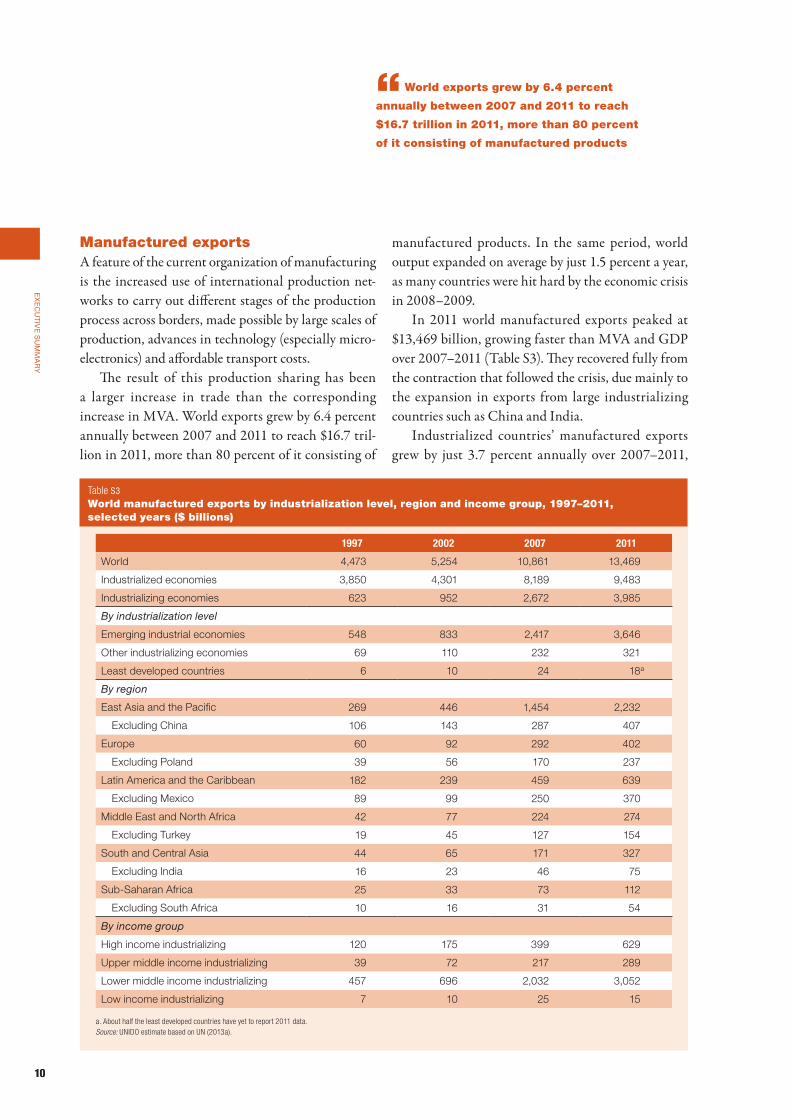
Manufactured exportsA feature of the current organization of manufacturing is the increased use of international production net-works to carry out different stages of the production process across borders, made possible by large scales of production, advances in technology (especially micro-electronics) and affordable transport costs.
The result of this production sharing has been a larger increase in trade than the corresponding increase in MVA. World exports grew by 6.4 percent annually between 2007 and 2011 to reach $16.7 tril-lion in 2011, more than 80 percent of it consisting of
manufactured products. In the same period, world output expanded on average by just 1.5 percent a year, as many countries were hit hard by the economic crisis in 2008–2009.
In 2011 world manufactured exports peaked at $13,469 billion, growing faster than MVA and GDP over 2007–2011 (Table S3). They recovered fully from the contraction that followed the crisis, due mainly to the expansion in exports from large industrializing countries such as China and India.
Industrialized countries’ manufactured exports grew by just 3.7 percent annually over 2007–2011,
1997 2002 2007 2011
World 4,473 5,254 10,861 13,469
Industrialized economies 3,850 4,301 8,189 9,483
Industrializing economies 623 952 2,672 3,985
By industrialization level
Emerging industrial economies 548 833 2,417 3,646
Other industrializing economies 69 110 232 321
Least developed countries 6 10 24 18a
By region
East Asia and the Pacific 269 446 1,454 2,232
Excluding China 106 143 287 407
Europe 60 92 292 402
Excluding Poland 39 56 170 237
Latin America and the Caribbean 182 239 459 639
Excluding Mexico 89 99 250 370
Middle East and North Africa 42 77 224 274
Excluding Turkey 19 45 127 154
South and Central Asia 44 65 171 327
Excluding India 16 23 46 75
Sub-Saharan Africa 25 33 73 112
Excluding South Africa 10 16 31 54
By income group
High income industrializing 120 175 399 629
Upper middle income industrializing 39 72 217 289
Lower middle income industrializing 457 696 2,032 3,052
Low income industrializing 7 10 25 15
a. About half the least developed countries have yet to report 2011 data.Source: UNIDO estimate based on UN (2013a).
Table S3 World manufactured exports by industrialization level, region and income group, 1997–2011, selected years ($ billions)

11
ex
eC
ut
Ive
su
MM
ar
y
“The higher dynamism of industrializing
economies is also reflected in the increase in
their share in world manufactured exports, from
13.9 percent in 1997 to 29.6 percent in 2011
reaching $9,483 billion in 2011, as they struggled to recover from the dip in economic activity brought about by the crisis. In industrializing countries, manu-factured exports grew by 10.5 percent annually over the same period, to a peak of $3,985 billion in 2011.
The higher dynamism of industrializing economies is also reflected in the increase in their share in world manufactured exports, from 13.9 percent in 1997 to 29.6 percent in 2011. It was the emerging economies, including China and 31 other fast-growing, high and higher MVA per capita economies, that accounted
for most of this increase, their world share more than doubling from 12.3 percent in 1997 to 27.1 percent in 2011.
Together, the combined manufactured exports of the largest country in each industrializing region – China, India, Mexico, Poland, South Africa and Turkey – accounted for 67.5 percent of the industrial-izing countries’ total in 2011, up from 59.9 percent in 2002 and 55.1 percent in 1997, confirming the higher dynamism of the larger countries and a worrying wid-ening gap with the smaller economies.


13
Part AThe role of manufacturing and structural change
14
Section 1 Industrial structural change and manufacturing employment
Ever since the industrial revolution, manufactur-ing has been the “engine of growth” for output and employment, sparked by major technological change and mechanization and leading to unprec-edented and sustained long-term economic growth and rising incomes. The higher incomes led to an increase in demand for manufactured products and a relative decline in spending on agricultural goods. Productivity gains raised demand further as prices of manufactures declined even further relative to other goods and services. Accompanying these changes were major labour force and population shifts from agri-culture and rural areas, initially into manufacturing and to urban areas, and later into services. This self-reinforcing industrial development process lasted for decades, if not centuries, as a result of which what have become today’s developed economies generated hun-dreds of millions of jobs in industry.
Indeed, manufacturing still matters greatly for employment today: broadly defined to include formal and informal activities and manufacturing-related
services, it accounted for around 470 million jobs in 2009 – or one out of six jobs on the planet.
In this first section, three chapters look at the ele-ments that make manufacturing an engine of growth. Chapter 1 analyses the trends of structural change (also called structural transformation) over the last 50 years. Chapter 2 then focuses on spatial differences among countries and regions, and within countries. And Chapter 3 looks more closely at structural change in manufacturing itself.
Some key findings are that manufacturing employ-ment is growing in developing countries and decreas-ing in developed countries, though that decline is mitigated by growing manufacturing-related services employment. And while many developing countries have immense potential to industrialize in agroin-dustry, textiles and garments – industries that offer prospects for sustained employment generation and productivity gains – developed countries have great scope for pursuing high-tech innovation and sustain-ing related services jobs.

15
Chapter 1
Structural change and employment trends
This chapter attempts to make sense of the trends of structural change over the last 50 years. Structural change unfolds over time but is best analysed through the structure of countries’ economies with the same income level, even if that is attained at different points in time. The structural change of an economy is not just associated with the growth of that economy, but lies at its very core, because it corresponds to a tran-sition from lower to higher productivity sectors. Up to roughly the income level of advanced economies, one can grasp such a transition by looking at shifts from one sector to another (mainly from agriculture to industry and services), but at higher incomes, aver-age employment-to-output ratios converge and further evidence of structural change can only be seen within sectors.
For developing countries aiming to maintain growth while creating sustainable jobs, manufactur-ing offers an opportunity not only to rebalance the economy towards higher value-added sectors but also to provide a relatively wide employment base with higher labour productivity. This contrasts with a direct transition from agriculture to services, espe-cially for low-income countries, which offers the opportunity to achieve only the first objective, not the second. Manufacturing can be an important absorber of labour while paying above-average wages.
The employment effect of manufacturing is stronger than conventional statistics derived from industry surveys suggest, which usually count only formal sector jobs in firms above a certain size and exclude self-employed and unregistered workers. Nor do those statistics cover manufacturing-related jobs in services, notably those jobs that have been unbundled from manufacturing and that statistically used to be counted in manufacturing but are now in services. At most, the conventional data caught half the total number of jobs directly and indirectly created by man-ufacturing, but when the sector is broadly defined to include formal, informal and manufacturing-related
services, manufacturing worldwide in 2009 provided almost 470 million jobs, employing around 16 per-cent of the world’s workforce of 2.9 billion, a figure far higher than many commentators might expect.
The quality of jobs – wages, conditions of work and rates of female employment – is also an important contribution of manufacturing. The chapter closes with a review of manufacturing’s comparative perfor-mance in these areas.
Industrialization, structural change and economic growth
Industrialization in the long runThe United Kingdom in the 18th century was the first country to develop manufacturing. Only in the early 19th century (after the United Kingdom had already demonstrated significant increases in productivity) did Belgium, France and Switzerland, followed by the United States, enter their own paths of manufacturing development. After this a few other latecomers (notably Germany, Japan and Russia) joined the group of indus-trializing nations, while the developing world (colonies and non-colonies) remained oriented towards primary production (Gerschenkron 1962; Maddison 2007).
This sustained process lasted for decades, even cen-turies, for the United Kingdom (Box 1.1), with data suggesting that manufacturing jobs in factories grew from around 22 percent of total employment in 1841 to more than 35 percent in 1960 (Matthews, Feinstein and Odling-Smee 1982). In the United States – where data can be traced back even further – manufactur-ing employment grew from around 6 percent of total employment in 1800 to around 36 percent in 1960, a period when the population increased 33-fold. Moreover, not only did the rate of employment rise, but its quality in terms of wages, labour conditions and skill levels also improved.
At the start of the 20th century, the world economy was already divided into industrial rich economies and
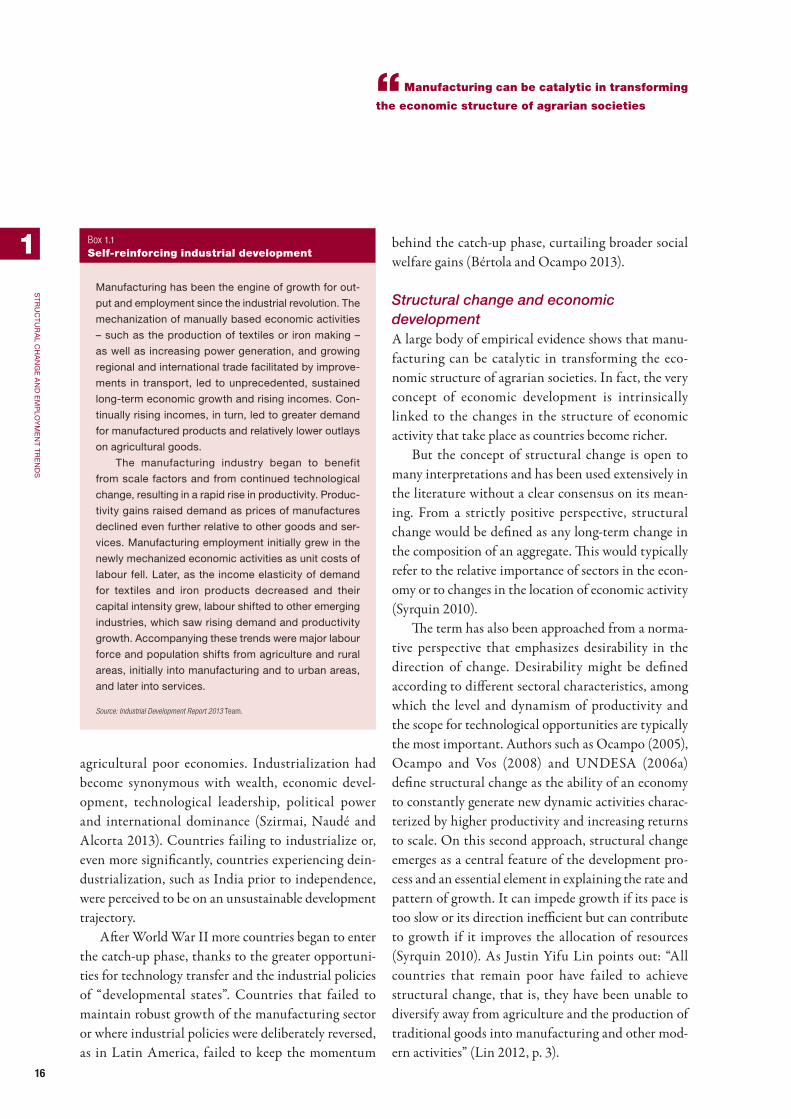
16
1
st
ru
Ct
ur
al C
ha
nG
e a
nd
eM
Plo
yM
en
t tr
en
ds
“Manufacturing can be catalytic in transforming
the economic structure of agrarian societies
agricultural poor economies. Industrialization had become synonymous with wealth, economic devel-opment, technological leadership, political power and international dominance (Szirmai, Naudé and Alcorta 2013). Countries failing to industrialize or, even more significantly, countries experiencing dein-dustrialization, such as India prior to independence, were perceived to be on an unsustainable development trajectory.
After World War II more countries began to enter the catch-up phase, thanks to the greater opportuni-ties for technology transfer and the industrial policies of “developmental states”. Countries that failed to maintain robust growth of the manufacturing sector or where industrial policies were deliberately reversed, as in Latin America, failed to keep the momentum
behind the catch-up phase, curtailing broader social welfare gains (Bértola and Ocampo 2013).
Structural change and economic developmentA large body of empirical evidence shows that manu-facturing can be catalytic in transforming the eco-nomic structure of agrarian societies. In fact, the very concept of economic development is intrinsically linked to the changes in the structure of economic activity that take place as countries become richer.
But the concept of structural change is open to many interpretations and has been used extensively in the literature without a clear consensus on its mean-ing. From a strictly positive perspective, structural change would be defined as any long-term change in the composition of an aggregate. This would typically refer to the relative importance of sectors in the econ-omy or to changes in the location of economic activity (Syrquin 2010).
The term has also been approached from a norma-tive perspective that emphasizes desirability in the direction of change. Desirability might be defined according to different sectoral characteristics, among which the level and dynamism of productivity and the scope for technological opportunities are typically the most important. Authors such as Ocampo (2005), Ocampo and Vos (2008) and UNDESA (2006a) define structural change as the ability of an economy to constantly generate new dynamic activities charac-terized by higher productivity and increasing returns to scale. On this second approach, structural change emerges as a central feature of the development pro-cess and an essential element in explaining the rate and pattern of growth. It can impede growth if its pace is too slow or its direction inefficient but can contribute to growth if it improves the allocation of resources (Syrquin 2010). As Justin Yifu Lin points out: “All countries that remain poor have failed to achieve structural change, that is, they have been unable to diversify away from agriculture and the production of traditional goods into manufacturing and other mod-ern activities” (Lin 2012, p. 3).
Manufacturing has been the engine of growth for out-
put and employment since the industrial revolution. the
mechanization of manually based economic activities
– such as the production of textiles or iron making –
as well as increasing power generation, and growing
regional and international trade facilitated by improve-
ments in transport, led to unprecedented, sustained
long-term economic growth and rising incomes. Con-
tinually rising incomes, in turn, led to greater demand
for manufactured products and relatively lower outlays
on agricultural goods.
the manufacturing industry began to benefit
from scale factors and from continued technological
change, resulting in a rapid rise in productivity. Produc-
tivity gains raised demand as prices of manufactures
declined even further relative to other goods and ser-
vices. Manufacturing employment initially grew in the
newly mechanized economic activities as unit costs of
labour fell. later, as the income elasticity of demand
for textiles and iron products decreased and their
capital intensity grew, labour shifted to other emerging
industries, which saw rising demand and productivity
growth. accompanying these trends were major labour
force and population shifts from agriculture and rural
areas, initially into manufacturing and to urban areas,
and later into services.
Source: Industrial Development Report 2013 Team.
Box 1.1 Self-reinforcing industrial development

17
1
st
ru
Ct
ur
al C
ha
nG
e a
nd
eM
Plo
yM
en
t tr
en
ds
“All countries that remain poor have been
unable to diversify away from agriculture
and the production of traditional goods into
manufacturing and other modern activities
In the rest of this subsection we will stick to the first, positive definition and analyse the patterns of the last half century, looking exclusively at the chang-ing contribution to gross domestic product (GDP) of the major sectors: agriculture, non-manufacturing industries,1 manufacturing industries and services. In the next subsection we will focus on manufacturing’s role in economic development, and therefore interpret structural change from the normative perspective, as the reallocation of resources from low-productivity activities towards manufacturing.
A first approach is to analyse the changing impor-tance of these four sectors’ shares in GDP at different points in time for different countries (Table 1.1).
The last two rows provide a general impression of the main trends of structural change over the last half century in 68 developing and 21 advanced economies.
In 1950 almost 40 percent of developing countries’ GDP originated in agriculture and only 12 percent in manufacturing. Fifty-five years later the share of agri-culture had dropped to just 16 percent of GDP. In the interim, manufacturing industries had first increased their share in GDP (peaking at around 17 percent in the early 1980s) but that share later fell. Throughout these years services showed a steady increase, gaining more than 10 percentage points.
In contrast, in 1950 advanced economies were already based heavily on manufacturing (at almost 30 percent of GDP) and agriculture accounted for only a minor share (16 percent). These economies, too, became much more services oriented, but manufactur-ing showed a steady decline and by 2005 it had almost the same share as in developing countries.
One feature that stands out in Table 1.1 is the wide variety of patterns, even within developing countries. At mid-century in China, Indonesia, the Republic of Korea, Malaysia and Thailand, for example, agricul-ture accounted for at least 40 percent of GDP, and manufacturing for 14 percent at most. Fifty-five years later, agriculture accounted for only 3–13 percent of GDP and manufacturing for more than 25 per-cent, underlining the huge shift from agriculture to manufacturing.
Other developing countries took a different path. In the largest Latin American economies – Argentina, Brazil and Mexico – the structure shifted from agri-culture towards services (and to a lesser extent, non-manufacturing industries). Taking the period’s end points, manufacturing’s share remained unchanged, but throughout the period it showed an inverted U shape (Tregenna 2013).
This difference is seen in two developing econo-mies that in 1960 had the same GDP per capita: the Republic of Korea and Ghana (Figure 1.1). In 1960 their structures were quite similar (the main differ-ence was that manufacturing’s share in the Republic of Korea was 5 points higher than in Ghana, and agri-culture’s share was 6 points lower).
Forty-five years later, these structures had changed radically. The Republic of Korea had transformed its structure, heavily reducing agriculture’s share by increasing that of manufacturing, but in Ghana agri-culture remained the largest sector. Tellingly, and in line with a more normative understanding of struc-tural change, the economic performance of the two countries was radically different, such that in 2005 Ghana’s GDP per capita was only a tenth of that of the Republic of Korea. The country that changed the structure of its economy saw far stronger GDP per capita growth than the one that did not.
The above suggests two conclusions. First, any average across a heterogeneous sample of observations (such as resource-rich countries, small countries, large countries or regional groups) lends itself to identifying a pattern over time that is not particularly representa-tive of any single country’s performance. Second, and more significant, the degree of heterogeneity inside the sample may become even greater as time passes, precisely as an outcome of structural change.
It is therefore instructive to look at how structural change takes place by looking at the changing impor-tance of sectors at different incomes instead of differ-ent moments in time. The approach now proposed in this subsection provides a way to visualize structural change by controlling for important features that shape differently the pattern of structural change of
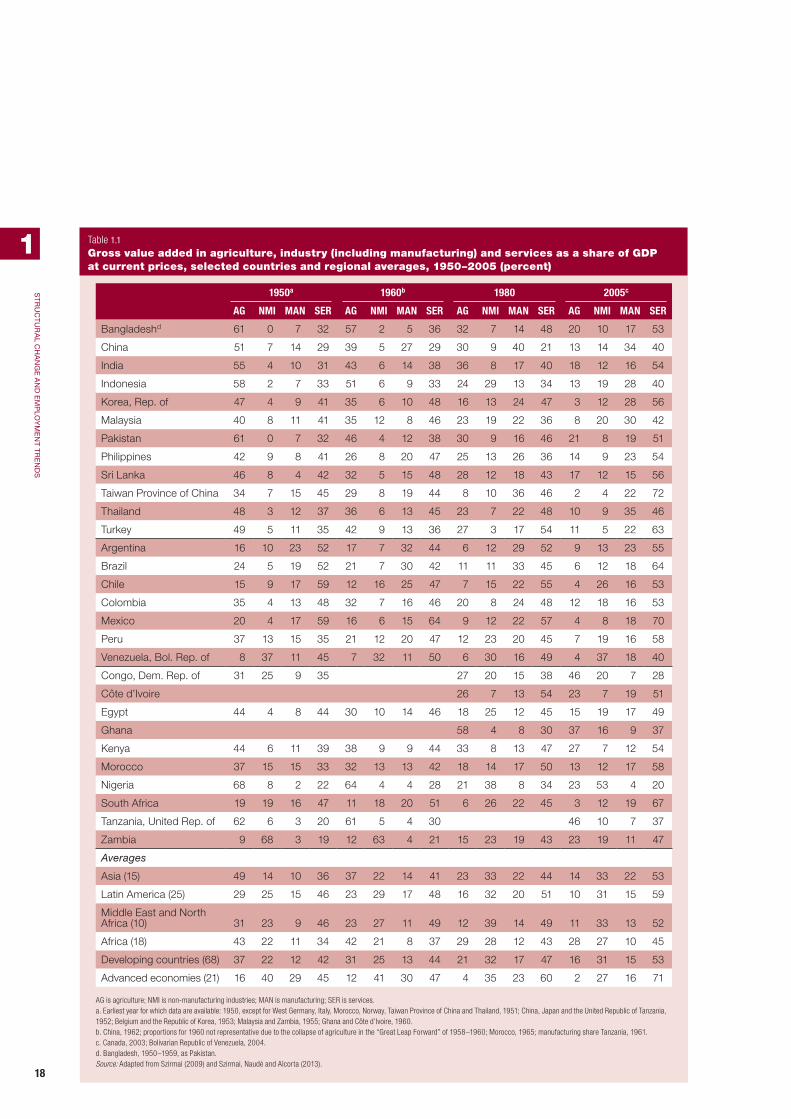
18
1
st
ru
Ct
ur
al C
ha
nG
e a
nd
eM
Plo
yM
en
t tr
en
ds
1950a 1960b 1980 2005c
AG NMI MAN SER AG NMI MAN SER AG NMI MAN SER AG NMI MAN SER
Bangladeshd 61 0 7 32 57 2 5 36 32 7 14 48 20 10 17 53
China 51 7 14 29 39 5 27 29 30 9 40 21 13 14 34 40
India 55 4 10 31 43 6 14 38 36 8 17 40 18 12 16 54
Indonesia 58 2 7 33 51 6 9 33 24 29 13 34 13 19 28 40
Korea, Rep. of 47 4 9 41 35 6 10 48 16 13 24 47 3 12 28 56
Malaysia 40 8 11 41 35 12 8 46 23 19 22 36 8 20 30 42
Pakistan 61 0 7 32 46 4 12 38 30 9 16 46 21 8 19 51
Philippines 42 9 8 41 26 8 20 47 25 13 26 36 14 9 23 54
Sri Lanka 46 8 4 42 32 5 15 48 28 12 18 43 17 12 15 56
Taiwan Province of China 34 7 15 45 29 8 19 44 8 10 36 46 2 4 22 72
Thailand 48 3 12 37 36 6 13 45 23 7 22 48 10 9 35 46
Turkey 49 5 11 35 42 9 13 36 27 3 17 54 11 5 22 63
Argentina 16 10 23 52 17 7 32 44 6 12 29 52 9 13 23 55
Brazil 24 5 19 52 21 7 30 42 11 11 33 45 6 12 18 64
Chile 15 9 17 59 12 16 25 47 7 15 22 55 4 26 16 53
Colombia 35 4 13 48 32 7 16 46 20 8 24 48 12 18 16 53
Mexico 20 4 17 59 16 6 15 64 9 12 22 57 4 8 18 70
Peru 37 13 15 35 21 12 20 47 12 23 20 45 7 19 16 58
Venezuela, Bol. Rep. of 8 37 11 45 7 32 11 50 6 30 16 49 4 37 18 40
Congo, Dem. Rep. of 31 25 9 35 27 20 15 38 46 20 7 28
Côte d’Ivoire 26 7 13 54 23 7 19 51
Egypt 44 4 8 44 30 10 14 46 18 25 12 45 15 19 17 49
Ghana 58 4 8 30 37 16 9 37
Kenya 44 6 11 39 38 9 9 44 33 8 13 47 27 7 12 54
Morocco 37 15 15 33 32 13 13 42 18 14 17 50 13 12 17 58
Nigeria 68 8 2 22 64 4 4 28 21 38 8 34 23 53 4 20
South Africa 19 19 16 47 11 18 20 51 6 26 22 45 3 12 19 67
Tanzania, United Rep. of 62 6 3 20 61 5 4 30 46 10 7 37
Zambia 9 68 3 19 12 63 4 21 15 23 19 43 23 19 11 47
Averages
Asia (15) 49 14 10 36 37 22 14 41 23 33 22 44 14 33 22 53
Latin America (25) 29 25 15 46 23 29 17 48 16 32 20 51 10 31 15 59
Middle East and North Africa (10) 31 23 9 46 23 27 11 49 12 39 14 49 11 33 13 52
Africa (18) 43 22 11 34 42 21 8 37 29 28 12 43 28 27 10 45
Developing countries (68) 37 22 12 42 31 25 13 44 21 32 17 47 16 31 15 53
Advanced economies (21) 16 40 29 45 12 41 30 47 4 35 23 60 2 27 16 71
AG is agriculture; NMI is non-manufacturing industries; MAN is manufacturing; SER is services.a. Earliest year for which data are available: 1950, except for West Germany, Italy, Morocco, Norway, Taiwan Province of China and Thailand, 1951; China, Japan and the United Republic of Tanzania, 1952; Belgium and the Republic of Korea, 1953; Malaysia and Zambia, 1955; Ghana and Côte d’Ivoire, 1960.b. China, 1962; proportions for 1960 not representative due to the collapse of agriculture in the “Great Leap Forward” of 1958–1960; Morocco, 1965; manufacturing share Tanzania, 1961.c. Canada, 2003; Bolivarian Republic of Venezuela, 2004.d. Bangladesh, 1950–1959, as Pakistan.Source: Adapted from Szirmai (2009) and Szirmai, Naudé and Alcorta (2013).
Table 1.1 Gross value added in agriculture, industry (including manufacturing) and services as a share of GDP at current prices, selected countries and regional averages, 1950–2005 (percent)

19
1
st
ru
Ct
ur
al C
ha
nG
e a
nd
eM
Plo
yM
en
t tr
en
ds
“As incomes rise, even in the initial stages
of development, manufacturing and services’
share keeps growing and agriculture’s declines
countries as they become richer. A complementary view to the more traditional analysis of structural change over time, it has the advantage of provid-ing a unique picture to illustrate the general pattern of structural change, without averaging the impor-tant differences in structure that arise from different incomes and two country-specific characteristics (nat-ural resources and population).
This approach pools countries together not accord-ing to any prior definition of development (such as advanced versus developing) but according to their income at any point in time (Box 1.2). Structural change can then be seen as the set of transformations that takes place as countries become richer, regardless of the time it occurred and its speed. With our previ-ous example, the Republic of Korea and Ghana would be pooled together in 1960 (when they had similar incomes and economic structure) but not in 2005
(with a 10-fold difference in GDP per capita and dis-similar structures).
At very low incomes (for some countries in the sample a contemporary feature, for others a feature of the early 1960s), agriculture accounts for a relatively high share of GDP, typically larger than manufactur-ing and non-manufacturing industries together. This situation is reversed as income grows: manufactur-ing starts gaining ground and reaches a peak of about 20 percent of GDP at roughly $14,000.2 In other words economic development is associated with a near tripling of the share of manufacturing in the economy, largely at the expense of agriculture, whose share shrinks dramatically (Figure 1.2).
After the peak the share of manufacturing starts declining and at very high incomes is comparable to earlier stages of development (describing an inverted U shape). As incomes rise, even in the initial stages of development, services’ share keeps growing and agriculture’s declines. Non-manufacturing indus-tries show a sharp increase at very low incomes, but after peaking at around $4,000 they maintain a sta-ble share. Overall, the graph does not display signifi-cant changes at higher incomes or for high-income countries.
A key point is that structural change viewed at such an aggregate level with only sectors masks important features of what happens inside each sector (manufac-turing is discussed in Chapter 3), including important breaks and heterogeneities within the timespan and sample of countries considered. Regression results reveal significant time breaks over 1963–2007 and the significance of population size and natural resources on the patterns of structural change (Chapter 3). The masking of these features should not be read as invali-dating the underlying econometric analysis, but their omission from the analysis would. The above figure depicts a pattern with all else being equal – if time, population size and resource endowments are kept constant. The following figures depict what happens when they are not.
To begin with, according to our econometric results, the following periods seem to have shown a
Figure 1.1 GDP composition by sectors, Republic of Korea and Ghana, 1960–2005
Perc
ent
GDP per capita, 2005 PPP$
Services Non-manufacturing industriesAgriculture Manufacturing
Perc
ent
GDP per capita, 2005 PPP$
0
25
50
75
100
0
25
50
75
100
Republic of Korea
Ghana
2005200019951990198519801975197019651960
2005200019951990198519801975197019651960
Source: Adapted from Szirmai (2009) and Szirmai, Naudé and Alcorta (2013).
20
1
st
ru
Ct
ur
al C
ha
nG
e a
nd
eM
Plo
yM
en
t tr
en
ds
“The patterns of structural change
significantly shifted twice in the 1980s but
seem to have remained statistically stable
for the 20 years before and after that
significantly different pattern of structural change across incomes: 1963–1980, 1981–1990 and 1991–2007. In other words the patterns of structural change significantly shifted twice in the 1980s but seem to have remained statistically stable for the 20 years before and after that. Readers familiar with global eco-nomic trends will not be surprised by such a conclu-sion, as many of the features of economic globalization picked up strongly in that decade.3
For the exposition’s sake, we show only the figures for the two end points, 1963–1980 and 1991–2007, and we focus on incomes up to $25,000, as that allows us to concentrate on the earlier, more interesting, part of the graph.
Most important for this chapter, the patterns in the two periods in Figure 1.3 are strikingly in line with that in Figure 1.2: structural change remained a
process with broadly comparable features – with slight differences. In the earlier period (1963–1980) manu-facturing reached its peak at a lower per capita income than in the second period (1991–2007), at $14,000 instead of $16,000. Moreover, manufacturing’s share at this earlier period peak was much higher, at 24 per-cent of GDP instead of 20 percent. But looking at the lowest incomes (less than $3,000 per capita), indus-trialization seems to set in faster in the more recent period.
Taken together, these elements appear to suggest that, bar the lowest income countries, industrializa-tion has become more elusive in the new interna-tional context, a fact also documented in the litera-ture (see, for example, Fagerberg and Verspagen 2002 and Szirmai and Verspagen 2010). In addition, the role of manufacturing in a country’s economy seems
the approach used can be challenged on methodological
grounds. First, criticisms might be raised over comparing
different countries at different points in time. second, the
pattern of structural change might itself change over time,
especially over half a century. Finally, pooling together
countries that are extremely heterogeneous by popula-
tion size and natural endowments might draw a mislead-
ing picture in which important characteristics that shape a
country’s structure are averaged, ruling out the possibil-
ity of seeing the detail of structural change within each
sector.
to tackle the first issue, each country’s income at
each point in time is assessed using a measure that strips
out the impact of inflation (constant prices rather than
current prices) and in a manner that enables comparison
across countries where costs of living are very different1
and may reflect short-term distortions in exchange rates
(countries are characterized by income according to their
GdP per capita in 2005 purchasing power parity dollars).
so despite its limits, this approach should minimize the
potential biases of comparing the income of, say, a coun-
try in 1963 and another in 2007.
the second and third issues are more problematic,
and can only be addressed through econometric tech-
niques that allow a statistical test for the significance of
a wide range of variables. In the following analysis, the
sectoral shares of GdP at different incomes are calculated
using regression analysis, which allows for exploring
whether these countries can be pooled together, and
whether there are some time- or country-specific char-
acteristics that should be considered when evaluating
the general patterns of structural change. this approach
allows for studying whether these patterns are stable over
time and across countries with different characteristics.
the analysis is undertaken for a large panel dataset
of 100 countries over 1963–2007, though not all coun-
tries are represented for all years. Fixed effects are intro-
duced to account for the fact that each country enters the
sample several times and that the observations for some
countries (especially high-income ones) are more numer-
ous. For reasons of space, the details on the econometric
approach and main regression results are not presented
here.2 the focus instead is on the resulting charts, which
show each economic sector’s estimated share at different
per capita incomes, and thus the main structural transfor-
mations as countries become richer.
Notes1. largely stemming from differences in the price of non-
tradable goods such as personal services, commerce
and construction.
2. results are available on request.
Source: Industrial Development Report 2013 Team.
Box 1.2 A few methodological issues

21
1
st
ru
Ct
ur
al C
ha
nG
e a
nd
eM
Plo
yM
en
t tr
en
ds
“With natural resource–rich countries, the
importance of manufacturing at any level of
income is lower than in the aggregate picture
to have eroded over the last half century, which is again compatible with the widely held idea of global deindustrialization.
Two other characteristics specific to the countries in the large sample are natural resource endowments and population size. As stressed in the literature, these elements might have an important impact on the pattern of structural change. To study them, we have to split the regression sample to avoid analytical problems. Countries are identified as rich in natural resources based on a proxy variable calculated as the difference between exports and imports of crude natu-ral resource commodities and expressed in per capita terms.4 Countries with at least $4,000 on this meas-ure are defined as rich in natural resources.5 Countries with a population of more than 12 million are classi-fied as large.
Our analysis supports the idea that these particu-lar country characteristics are important. Both natu-ral resource endowments and population size seem to have a significant impact on the transformations that take place in the productive structure as countries become richer (Figure 1.4).
Once more, the patterns are in line with the aggregate picture. Both cases see a shift from agricul-ture towards services and industry at low incomes; later, industry starts declining and services become dominant. The importance of manufacturing and the income level at which the turning point takes place are quite different though.
With natural resource–rich countries, the impor-tance of manufacturing at any level of income is lower than in the aggregate picture. The decline in its share starts at much lower income ($13,000). The impor-tance of non-manufacturing industries is larger. And the maximum is only reached at very high income ($25,000). These trends are in line with a large body of literature that highlights the potential bottlenecks arising from a rich natural resource base, where the economy’s incentives might be biased towards non-manufacturing industries (or agriculture), to manu-facturing’s detriment, leading to a “natural resource curse” or “Dutch disease” (see, for example, Palma 2005).
Large economies show exactly the opposite trend: manufacturing accounts for a much higher share of
Figure 1.2 GDP composition by income and sector, 1963–2007
Perc
ent
GDP per capita, 2005 PPP$
Services Non-manufacturing industriesAgriculture Manufacturing
0
25
50
75
100
40,00030,00020,00010,0000
Manufacturing’s peak
Non-manufacturing industries’ peak
Note: Pooled data for 100 countries.Source: UNIDO estimate based on CIC (2009) and World Bank (2013b).
Figure 1.3 GDP composition by income and sector (up to $25,000), 1963–1980 and 1991–2007
Perc
ent
GDP per capita, 2005 PPP$
Services Non-manufacturing industriesAgriculture Manufacturing
0
25
50
75
100
Perc
ent
GDP per capita, 2005 PPP$
0
25
50
75
100
25,00020,00015,00010,0005,0001,000
25,00020,00015,00010,0005,0001,000
1963–1980
1991–2007
Manufacturing’s peakNon-manufacturing industries’ peak
Manufacturing’s peak
Non-manufacturing industries’ peak
Note: Pooled data for 100 countries.Source: UNIDO estimate based on CIC (2009) and World Bank (2013b).
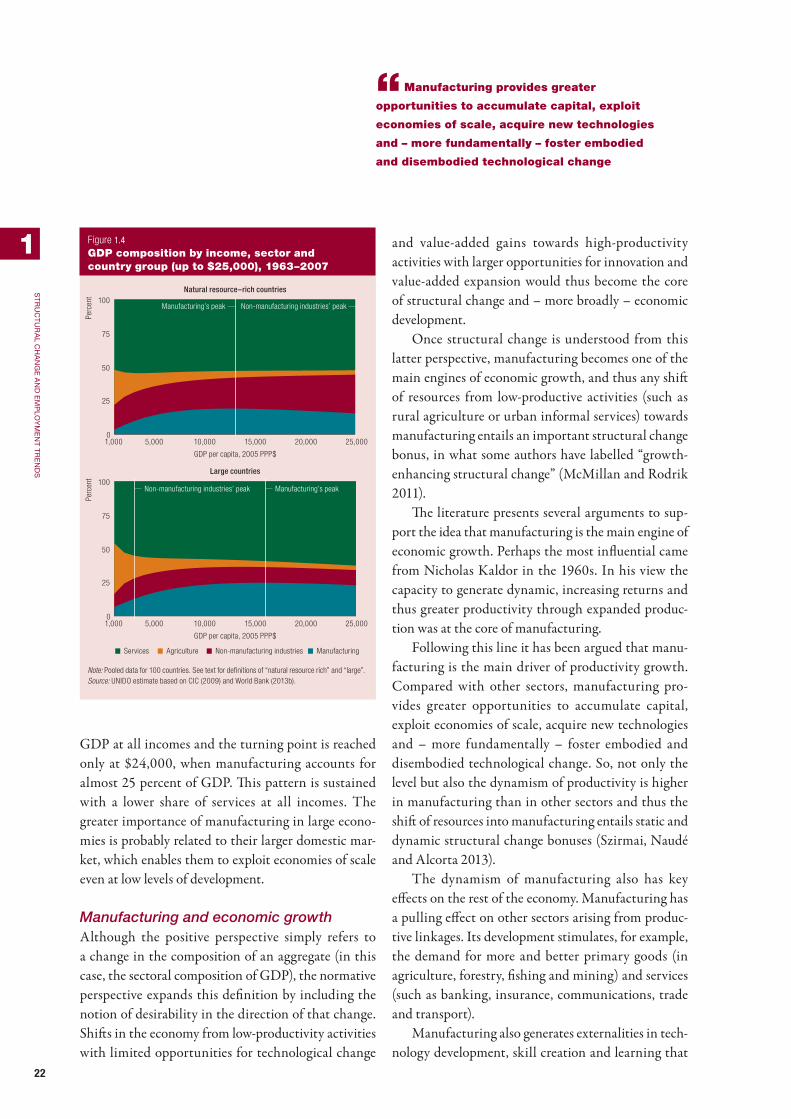
22
1
st
ru
Ct
ur
al C
ha
nG
e a
nd
eM
Plo
yM
en
t tr
en
ds
“Manufacturing provides greater
opportunities to accumulate capital, exploit
economies of scale, acquire new technologies
and – more fundamentally – foster embodied
and disembodied technological change
GDP at all incomes and the turning point is reached only at $24,000, when manufacturing accounts for almost 25 percent of GDP. This pattern is sustained with a lower share of services at all incomes. The greater importance of manufacturing in large econo-mies is probably related to their larger domestic mar-ket, which enables them to exploit economies of scale even at low levels of development.
Manufacturing and economic growthAlthough the positive perspective simply refers to a change in the composition of an aggregate (in this case, the sectoral composition of GDP), the normative perspective expands this definition by including the notion of desirability in the direction of that change. Shifts in the economy from low-productivity activities with limited opportunities for technological change
and value-added gains towards high-productivity activities with larger opportunities for innovation and value-added expansion would thus become the core of structural change and – more broadly – economic development.
Once structural change is understood from this latter perspective, manufacturing becomes one of the main engines of economic growth, and thus any shift of resources from low-productive activities (such as rural agriculture or urban informal services) towards manufacturing entails an important structural change bonus, in what some authors have labelled “growth-enhancing structural change” (McMillan and Rodrik 2011).
The literature presents several arguments to sup-port the idea that manufacturing is the main engine of economic growth. Perhaps the most influential came from Nicholas Kaldor in the 1960s. In his view the capacity to generate dynamic, increasing returns and thus greater productivity through expanded produc-tion was at the core of manufacturing.
Following this line it has been argued that manu-facturing is the main driver of productivity growth. Compared with other sectors, manufacturing pro-vides greater opportunities to accumulate capital, exploit economies of scale, acquire new technologies and – more fundamentally – foster embodied and disembodied technological change. So, not only the level but also the dynamism of productivity is higher in manufacturing than in other sectors and thus the shift of resources into manufacturing entails static and dynamic structural change bonuses (Szirmai, Naudé and Alcorta 2013).
The dynamism of manufacturing also has key effects on the rest of the economy. Manufacturing has a pulling effect on other sectors arising from produc-tive linkages. Its development stimulates, for example, the demand for more and better primary goods (in agriculture, forestry, fishing and mining) and services (such as banking, insurance, communications, trade and transport).
Manufacturing also generates externalities in tech-nology development, skill creation and learning that
Figure 1.4 GDP composition by income, sector and country group (up to $25,000), 1963–2007
Perc
ent
GDP per capita, 2005 PPP$
Services Non-manufacturing industriesAgriculture Manufacturing
0
25
50
75
100
Perc
ent
GDP per capita, 2005 PPP$
0
25
50
75
100
25,00020,00015,00010,0005,0001,000
25,00020,00015,00010,0005,0001,000
Natural resource–rich countries
Large countries
Manufacturing’s peakNon-manufacturing industries’ peak
Manufacturing’s peak Non-manufacturing industries’ peak
Note: Pooled data for 100 countries. See text for definitions of “natural resource rich” and “large”.Source: UNIDO estimate based on CIC (2009) and World Bank (2013b).

23
1
st
ru
Ct
ur
al C
ha
nG
e a
nd
eM
Plo
yM
en
t tr
en
ds
“For developing countries growth
and development are not about pushing
the technology frontier but rather about
changing the structure of production towards
activities with higher productivity
are crucial for competitiveness. For instance, manu-facturing is the main vehicle for technology develop-ment and innovation (Chapter 4), representing today’s hub for technical progress. Empirical evidence shows that manufacturing is the sector receiving by far the most investment in research and development (Lavopa and Szirmai 2012). It is well established that this type of investment has positive externalities that go far beyond the productivity gains achieved in the same sector, contributing widely to productivity growth in other sectors and thus fuelling overall economic growth. Locational externalities (agglomeration effects – Chapter 2) arising through spillovers on the labour market, supplier networks and other areas of knowledge are also more likely to arise from manufac-turing than from other sectors (Weiss 2013).
The above theoretical arguments are backed up by a large body of empirical studies that has dem-onstrated a close positive link between economic growth and structural change towards manufactur-ing. Econometric evidence from 131 developing coun-tries in 2000–2005 suggests that economic growth is correlated with manufacturing value-added growth (UNIDO 2009). A more sophisticated analysis of 89 developed and developing countries in 1950–2005 found that the share of manufacturing is positively related to economic growth and that this effect is more pronounced for poorer countries, confirming the “manufacturing as an engine of growth hypothesis” (Szirmai and Verspagen 2010; Figure 1.5). The find-ings from these authors are in line with those reported by Rodrik (2007), which indicate that growth accel-erations are closely associated with rapid increases in the share of manufactures in total exports or with an increase in the share of manufacturing employment in total employment.
A clear positive correlation is seen between the rate of per capita growth and of the increase in manufac-turing’s share in total GDP. The country groups that achieved the fastest growth during the period are the countries where the shift towards manufacturing has been most intensive. China, the first Asian newly industrialized economies and South-East Asia are
examples. Though for a shorter period (1995–2007), transition economies also seemed to adjust to this pattern: they showed steep increases in their share of manufacturing in GDP while growing very fast. At the other extreme are country groups (mainly in Latin America) that show exactly the opposite trend: they deindustrialized during the period and achieved very modest rates of GDP per capita growth.
The above analysis confirms a pattern familiar to economic thinking and explored in the World Economic and Social Survey 2006 (UNDESA 2006a). For developing countries growth and development are not about pushing the technology frontier but rather about changing the structure of production towards activities with higher productivity. Economies can achieve this type of structural change by absorbing
Figure 1.5 Economic growth and changes in the share of manufacturing value added in GDP, selected regions and country groups, 1970–2007
–1 0 1 2 3 4
Annu
al g
row
th o
f GD
P pe
r cap
ita (p
erce
nt)
Annual change in share of manufacturing value added in GDP (percent)
Eastern Europe(1995–2007)
Commonwealth ofIndependent States
(1995–2007)
Sub-Saharan AfricaLow- to
middle-incomeLatin America
Central Americaand the Caribbean
South-East Asia
China
First-tier newly industrialized economies
South Asia
Middle East and Northern Africa
0
2
4
6
8
Semi-industrialized countries
Note: The values have been calculated as simple average across the countries included in each group. Sub-Saharan Africa: Cameroon, Ethiopia, Kenya, Mozambique, Tanzania, Uganda and Zimbabwe. Central America and the Caribbean: Costa Rica, Dominican Republic, Guatemala and Jamaica. Low- to middle-income Latin America: Bolivia, Ecuador and Peru. Semi-industrialized countries: Argentina, Brazil, Chile, Colombia, Mexico, South Africa, Turkey and the Bolivarian Republic of Venezuela. South Asia: Bangladesh, India, Pakistan and Sri Lanka. South-East Asia: Indonesia, Malaysia, Philippines, Thailand and Viet Nam. First-tier newly industrialized economies: Republic of Korea, Singapore and Taiwan Province of China. Middle East and Northern Africa: Algeria, Egypt, Islamic Republic of Iran, Jordan, Morocco, Saudi Arabia, Tunisia and Yemen. Commonwealth of Independent States: Russian Federation and Ukraine. Eastern Europe: Bulgaria, Czech Republic, Hungary, Poland and Slovakia.Source: Adapted from UNDESA (2006a) based on CIC (2009) and World Bank (2013b).

24
1
st
ru
Ct
ur
al C
ha
nG
e a
nd
eM
Plo
yM
en
t tr
en
ds
“Manufacturing plays a fundamental
role in sustained rapid growth
existing technologies, producing manufacturing goods and services for world markets and rapidly accu-mulating physical and human capital.
Slightly more recent empirical work also suggests that manufacturing plays a fundamental role in sus-tained rapid growth. The Report of the Commission on Growth and Development identified 13 economies that managed to sustain very rapid growth of at least 7 percent for 25 years or more after World War II: Botswana (1960–2005), Brazil (1950–1980), China (1961–2005), Hong Kong SAR China (1960–1997), Indonesia (1966–1997), Japan (1950–1983), the Republic of Korea (1960–2001), Malaysia (1967–1997), Malta (1963–1994), Oman (1960–1999), Singapore (1967–2002), Taiwan Province of China (1965–2002) and Thailand (1960–1997; World Bank 2008).
The sample is remarkably diverse, including coun-tries from all developing regions, some rich in natural resources, others not; some among the most populated
countries in the world, others with a population below 500,000 (World Bank 2008). Yet despite these differ-ences, a striking fact – surprisingly not mentioned in the report – is that all but three were driven by manu-facturing industries (Figure 1.6).6
In 8 of the 13 economies manufacturing shows the fastest growth, implying that this sector has increased its share in total GDP over the period – that is, the economy has shown a structural change towards manufacturing. In Brazil and Malta manufactur-ing and services grew at almost the same rate, and in only Botswana, China and Hong Kong SAR China did manufacturing show slower growth than services. These success stories reinforce the above argument for the key role of manufacturing industries in sustaining growth.
Manufacturing and productivityWe now turn to look in more detail at a particular fea-ture at the core of the special role of manufacturing
Figure 1.6 Growth rates by sector, 13 long-term fast-growing economies
–10
–5
0
5
10
15
ThailandTaiwan Provinceof China
SingaporeOmanMaltaMalaysiaKorea, Rep.JapanIndonesiaHong Kong SARChina
ChinaBrazilBotswana
Gro
wth
(per
cent
)
ServicesAgriculture Manufacturing
Note: Many of the calculations apply to different periods than given in the text for data-consistency reasons: Botswana (1965–2006); Brazil (1950–1980); China (1965–2010); Hong Kong SAR China (1974–1997); Indonesia (1966–1997); Japan (1953–1983); Republic of Korea (1960–2001); Malaysia (1970–1997); Malta (1970–1994); Oman (1988–1999); Singapore (1967–2002); Taiwan Province of China (1965–2002) and Thailand (1960–1997).Source: Adapted from World Bank (2008) based on World Bank (2013b) and Groningen Growth and Development Centre (2013). See Timmer and de Vries (2009) for the underlying methodology of the database.

25
1
st
ru
Ct
ur
al C
ha
nG
e a
nd
eM
Plo
yM
en
t tr
en
ds
“Manufacturing is the engine of growth
because of its larger opportunities for productivity
gains compared with other sectors of the economy
as the engine of growth – its larger opportunities for productivity gains compared with other sectors of the economy. We analyse how the relative productivity of each major sector (here taken to be agriculture, manu-facturing, non-manufacturing industry and services) evolves as countries develop.
Relative productivity is here simply defined as the ratio between the output–labour ratio of each sec-tor and that of the whole economy. This coefficient is obtained by dividing the share of manufactur-ing in GDP by the share of manufacturing in total employment.7
To get figures of this coefficient by income, we esti-mate the average (weighted) shares of each sector in GDP and total employment for all countries and years that fall in that income range (Table 1.2). In the light of the previous evidence showing structural breaks over the last 50 years, we restrict the analysis to the
last two decades.8 Moreover, since our econometric exercise showed that countries with natural resource wealth follow a rather peculiar path of structural change, we excluded from the sample the countries richest in such resources.9 (See Effects of time, demo-graphic and geographical conditions on manufacturing development in Chapter 3.)
Due to space limitations, we show only specific shares in the range of $1,000–$15,000, real purchas-ing power parity (PPP) per capita. Three average shares are also presented for three groups of countries: low and lower middle income, upper middle income and high income.10
Based on the above share values, the ratios in Figure 1.7 have been derived.
The relative nature of the indicators used in Figure 1.7 gives a straightforward rule to determine which is the best direction of structural change at
Value-added share Employment share
$ real PPP per capita AG NMI MAN SER AG NMI MAN SER
Low- and lower middle-income economies 16 14 26 44 50 7 14 29
0–1,000 30 9 13 48 70 2 8 20
1,000–2,000 23 11 22 44 57 7 12 24
2,000–3,000 17 14 24 45 50 7 13 29
3,000–4,000 14 15 28 43 45 8 14 34
4,000–5,000 12 15 29 44 41 8 16 35
5,000–6,000 11 14 30 45 39 8 17 35
Upper middle-income economies 7 14 20 60 23 9 16 53
6,000–7,000 10 15 28 47 35 8 17 40
7,000–8,000 7 12 19 62 24 7 13 55
8,000–9,000 8 13 18 61 23 8 14 56
9,000–1,0000 7 12 18 62 20 9 16 56
1,0000–11,000 7 13 19 62 17 9 17 56
11,000–12,000 5 13 19 63 15 10 18 57
12,000–13,000 6 15 19 60 16 9 19 56
13,000–14,000 6 18 19 57 12 11 18 59
14,000–15,000 5 18 18 59 10 11 18 61
High-income economies 2 9 18 72 4 9 18 69
AG is agriculture; NMI is non-manufacturing industries; MAN is manufacturing; SER is services.Note: Pooled data for 108 countries, excluding natural resource–rich countries.Source: UNIDO estimate based on World Bank (2013b) and Groningen Growth and Development Centre (2013). See Timmer and de Vries (2009) for the underlying methodology of the database.
Table 1.2 Shares of value added and employment by income group and sector, 1991–2010 (percent)

26
1
st
ru
Ct
ur
al C
ha
nG
e a
nd
eM
Plo
yM
en
t tr
en
ds
“Some argue that the “middle-income
trap” is fundamentally a failure to achieve this
sort of structural change within sectors
each level of development. The higher the series, the better the productivity gains: reallocation of resources (labour in this case) from one sector below to another above will lead to aggregate productivity gains.
As expected, non-manufacturing industries show the highest relative productivity at all levels of devel-opment, mainly driven by the high capital intensity of mining and public utilities. But the size of this sector is limited, as is its capacity to absorb labour. In most ranges of income the second-highest relative productivity is achieved by manufacturing industries, especially at GDP per capita of $2,000–$10,000 PPP, which underlines the importance of manufacturing in middle-income economies. And at very low income ($2,000–$4,000 PPP), the relative productivity of manufacturing rises while that of agriculture and services falls, revealing that manufacturing delivers dynamic as well as static productivity gains.11
At initial stages of development, services show extremely high relative productivity, most prob-ably driven by non-market services such as public
administration, health or education. But immediately thereafter, this coefficient drops dramatically, mainly in line with the increase of low-productive services such as wholesale and retail trade and personal ser-vices. Subsequently, the relative productivity of ser-vices converges to the national average.
At high incomes ($17,000 and above) in fact, the relative productivity of the three major sectors (manu-facturing, non-manufacturing industries and services) converge to the national average. At this stage, agricul-ture’s share is already too small for this inter-sectoral structural change to drive productivity, and so struc-tural change within sectors becomes fundamental. The key at this stage is not shifting resources further towards manufacturing but achieving productivity growth within manufacturing (from low- to high-tech industries – Chapters 3 and 4). By the same token structural change within services also becomes a lead-ing driver of productivity growth. (As we see next, development also entails an important structural shift from lower productivity non-tradable services towards higher productivity tradable services.)
Some argue that the “middle-income trap” is fundamentally a failure to achieve this sort of struc-tural change within sectors. Recent evidence sug-gests that countries that have shown rapid growth at low incomes but are unable to move towards more sophisticated industries or services tend to be stuck at middle-income levels and incapable of joining the rich nations (see, for example, Felipe, Abdon and Kumar 2012 and Lee 2013).
This subsection ends with a sectoral comparison of relative labour productivity in which the service aggre-gate is opened further to disentangle – at least partially – its heterogeneity. The service subsectors range from highly productive, tradable information and com-munications technology (ICT) professional services to low-productive, self-subsistence, non-tradable per-sonal services such as street vending. In particular, we distinguish three subgroups in the International Standard Industrial Classification (ISIC) Revision 3: tradable services, non-tradable services and non-mar-ket services.12
Figure 1.7 Relative labour productivity by income and sector, 1991–2010
0 5,000 10,000 15,000 20,000 25,000
Agriculture
Services
Manufacturing
Labo
ur p
rodu
ctiv
ity (i
ndex
, tot
al a
vera
ge =
1)
Income level (2005 PPP$)
0
1
2
3
4Low and
lower middleincome
Upper middle income HIgh income
Non-manufacturing industries
Note: Pooled data for 108 countries, excluding natural resource–rich countries. Total economy average of productivity = 1.Source: UNIDO estimate based on World Bank (2013b) and Groningen Growth and Development Centre (2013). See Timmer and de Vries (2009) for the underlying methodology of the database.

27
1
st
ru
Ct
ur
al C
ha
nG
e a
nd
eM
Plo
yM
en
t tr
en
ds
“Manufacturing manages to combine
high relative productivity with a
strong capacity to absorb labour
But the information needed to analyse the rela-tive productivity at such a disaggregated level within services is unavailable in the data source used so far in this subsection. Therefore, the analysis is restricted to a sub-sample of 40 countries with data from the World Input-Output Database (Timmer 2012). This data-base provides comparable value added and employ-ment data by sector at the ISIC two-digit level for 14 emerging countries and 26 advanced economies.13
Figures 1.8 and 1.9 also indicate the relative size of each sector in the whole economy, which is depicted by the width of each bar and defined by the number of workers of each country.
Figure 1.8 shows that in the 14 emerging econo-mies the service aggregate disguises heterogeneous subsectors. The most productive jobs of the economy are in extremely modern tradable services (mainly finance and professional activities) and – to a lesser extent – in some non-manufacturing industries (typi-cally capital-intensive mining or public utilities). These sectors absorb a small (sometimes negligible) share of workers, however. After these sectors, manufacturing
has the highest relative productivity while employing a substantial number of workers. That is, manufactur-ing manages to combine high relative productivity with a strong capacity to absorb labour. At the other extreme are the largest labour-absorbing sectors, agri-culture and non-tradable services, but they show much lower relative productivity.
In a scenario such as in Figure 1.8, labour shifts from agriculture and non-tradable services towards manufacturing and tradable services will entail a structural change bonus and gains in aggregate pro-ductivity – the core of the structural change pattern described above. As countries develop, however, rela-tive productivity across sectors tends to converge to the national average (see Figure 1.7). The more disag-gregated pattern for the restricted sample of advanced economies confirms this pattern (Figure 1.9).
Differences in relative productivity are now almost negligible, though the ordering of sectors is very simi-lar to that of the 14 emerging countries’. In these advanced economies the share of tradable services in employment increases dramatically, even surpassing
Figure 1.8 Relative labour productivity and share in total employment by sector, 14 emerging economies, 2005
Labo
ur p
rodu
ctiv
ity (i
ndex
, tot
al a
vera
ge =
1)
Share in total employment (percent)
0
1
2
4
3
5
0 25 50 75 100
Tradable servicesNon-manufacturing industriesManufacturingNon-market servicesNon-tradable servicesAgriculture
Note: Weighted averages. Total economy average of productivity = 1.Source: UNIDO estimate based on Timmer (2012).
Figure 1.9 Relative labour productivity and share in total employment by sector, 26 advanced economies, 2005
Labo
ur p
rodu
ctiv
ity (i
ndex
, tot
al a
vera
ge =
1)
Share in total employment (percent)
0
1
2
4
3
5
0 25 50 75 100
Tradable servicesNon-manufacturing industriesManufacturingNon-market servicesNon-tradable servicesAgriculture
Note: Weighted averages. Total economy average of productivity = 1.Source: UNIDO estimate based on Timmer (2012).

28
1
st
ru
Ct
ur
al C
ha
nG
e a
nd
eM
Plo
yM
en
t tr
en
ds
“Manufacturing jobs tend to be more
productive than others, and so tend to be better
paid and to offer better labour conditions
manufacturing in labour absorption. Agriculture accounts for an insignificant share of employment.
It may be easy to grasp intuitively the importance of manufacturing in economic growth and structural change, but the sector’s role in job creation is less straightforward, as will be shown below.
Manufacturing growth and employmentStructural change can be achieved in various ways, but using three themes most commonly explored in the growth-accounting literature, it is seen to be triggered by a shift in labour from the lower to the higher pro-ductivity sector (labour-intensive structural change), by a shift in capital (through an increase in the capi-tal–labour ratio), or by an improvement in overall technology (understood broadly as total factor pro-ductivity) – or a combination of all three. A cursory look at Table 1.2 shows, for example, that the direct absorption of workers by manufacturing is quite limited, as its share in total employment oscillates at 10–20 percent of total employment.
Despite this, manufacturing is still fundamen-tal to the labour market. Manufacturing jobs tend to be more productive than others, and so tend to be better paid and to offer better labour conditions, such as security and employment benefits. This par-ticular feature of manufacturing lies at the heart of the growth-enhancing structural change argument. Further, manufacturing’s strong productive linkages with other sectors lead to a much greater impact on employment creation due to indirect effects. A job in manufacturing is typically associated with more jobs in other sectors.
Beyond that are the “induced effects” – among the most important means for manufacturing to stimulate jobs – broadly defined as the external effects of invest-ment in manufacturing other than productive link-ages. These external effects take place on the demand and supply sides. On the demand side the net increases in incomes received by workers in jobs directly or indi-rectly created through investment in manufacturing are re-spent, generating Keynesian-type multiplier
effects that in turn contribute to higher demand and additional employment. On the supply side, by stimu-lating aggregate growth, especially through knowl-edge spillovers, manufacturing has additional impacts on overall employment creation (Lavopa and Szirmai 2012).
Direct jobs created in manufacturing: formal and informalThis subsection aims to quantify the number of jobs created in manufacturing around the world over the last 40 years, but faces two methodological problems. First, sector-disaggregated employment data are lim-ited, especially in developing countries and over a long period. Second, even when there are data, compara-bility among countries may be affected by different definitions for employment status, type of occupation, coverage and so on. Still, two main sources of informa-tion can be used: industry surveys and general house-hold surveys.
Most countries carry out industry surveys. They typically provide reliable data on the number of man-ufacturing employees working in formal enterprises and over a long period. But depending on country they may well cover only those firms employing at least 5 or 10 workers, and exclude self-employed workers and unregistered employees, thus heavily underestimating the real number of jobs created in manufacturing.
The number of manufacturing jobs can also be estimated from household surveys (or population cen-suses). They generally cover all types of jobs but their data reliability on coverage and international compa-rability, as well as the number of countries using them, are much more patchy. The estimates in this subsec-tion combine both sources to provide a picture as close to reality as possible for manufacturing jobs (Box 1.3; Figure 1.10).
At the beginning of the period the global formal sector in red had around 140 million jobs, and showed a steady increase until the end of the 1980s. After an interruption of five years (between 1990 and 1995) when manufacturing jobs stagnated, the series contin-ued growing up to a peak in 2007, before the global

29
1
st
ru
Ct
ur
al C
ha
nG
e a
nd
eM
Plo
yM
en
t tr
en
ds
“By stimulating aggregate growth, especially
through knowledge spillovers, manufacturing has
additional impacts on overall employment creation
crisis hit. By 2009 formal manufacturing employed more than 201 million workers around the world. Average annual growth in formal jobs was 1 percent over 1970–2009.
The group in shades of blue can be broadly asso-ciated with informal activity, with different shades used to mark the estimates of informal jobs before and after 1995 to emphasize that simple extrapolation
we first calculate, for each year, the number of manufac-
turing jobs according to the unIdo database (unIdo
2012a), which comprises data based on industry surveys
for 166 countries back to the 1960s. the jobs obtained
using this source could be generally described as formal
manufacturing jobs, because they are typically in the for-
mal part of the economy. the estimates are then comple-
mented with data from household surveys and population
censuses, as published in the International labour organ-
ization databases laBorsta (Ilo 2011a) and Ilostat
(Ilo 2013), to calculate a rough estimate of the number of
jobs not captured by the first source.
For every country and year with data, the difference
between the two sources is calculated to give the number
of what may be termed informal manufacturing jobs. yet
this method gives only a very rough approximation of the
true number of informal jobs – by definition very hard to
capture – and refers to a definition of informal that goes
far beyond unregistered jobs. In fact, many of the jobs
captured by this procedure are registered workers in small
enterprises, which are not captured in industrial surveys
as these generally include firms above 10 employees.
Because International labour organization data are
far weaker before 1995, we only estimate informal jobs for
1995–2009. For earlier years we extrapolate back using
the formal–informal ratio for 1995. But even within the
period with more reliable data (1995–2009), more than half
the countries are still missing. In these cases gaps have
been filled using the closest available data (in terms of
formal–informal ratio), either from the same country in a
different year or, if missing, from a different country with
similar characteristics (region or income).
Source: Industrial Development Report 2013 Team.
Box 1.3 Estimating manufacturing jobs
Figure 1.10 Number of jobs created by manufacturing industry, 1970–2009
0
100
200
300
400
500
200920052000199519901985198019751970
Empl
oym
ent,
head
coun
t (m
illio
ns)
Informal (extrapolated)Informal Formal
Note: For calculation method of formal and informal jobs, see Box 1.3.Source: UNIDO estimate based on ILO (2011a, 2013) and UNIDO (2012a).
30
1
st
ru
Ct
ur
al C
ha
nG
e a
nd
eM
Plo
yM
en
t tr
en
ds
“A broader understanding of the
interconnections between manufacturing and
producer services is necessary to fully assess the
impact of manufacturing in employment creation
was used before that year. The estimates suggest that focusing exclusively on formal jobs leaves out a large (and increasing) portion of all jobs created in manu-facturing. In 1995 there were some 130 million infor-mal jobs, at around 40 percent of the total; by 2009 the figure had climbed to 187 million and the share to 48 percent. Jobs in this case involve much more than what a traditional definition of “informal” would contain, because workers not subject to labour legis-lation are included as are those working in small and medium enterprises and the self-employed. The rise of many emerging economies as new hubs in the world production of manufactures (Chapter 2) is an impor-tant factor in this trend.
Taken together, formal and informal manufactur-ing jobs accounted for almost 388 million jobs world-wide in 2009, having grown at an average annual rate of 1.6 percent since 1970.
Manufacturing-related jobs in servicesFailure to capture informal jobs in manufacturing is not the only way by which manufacturing jobs are typically underestimated. Perhaps more important, in view of the global economic transformations of the last few decades, is the unbundling of certain produc-tion processes that statistically used to be included in manufacturing but are now included in services.
In fact, it could be argued that the very distinc-tion between manufacturing and services has become blurred (Manyika et al. 2012). Not only are manufac-turing firms increasingly outsourcing their non-core operations, such as warehousing, transport, human resource management and information technology, but manufactured products are increasingly bundled with a host of services and after-market functions (such as telephone help-lines, extended warranty and repair and retail services). Indeed, the function of services in the manufacturing process has been sorely neglected in historical and contemporary accounts of economic development.
These operations partly reflect the move by com-panies towards a “core competence” model of organi-zation (Prahalad and Hamel 1990). Manufacturing
firms have tended to shed many of their service functions, which became separate entities in their own right and thus appear in the national accounts under “producer services” instead of being previously concealed under “manufacturing” itself. These “out-sourced” service firms co-produce and provide ser-vices for other manufacturing firms, thus improving the efficiency and diffusion of service knowledge to a wider variety of client firms.
A broader understanding of the interconnections between manufacturing and producer services is nec-essary to fully assess the impact of manufacturing in employment creation. With these interactions con-sidered, manufacturing employment becomes more important than often appreciated.
Take the automotive industry. Logistics and ware-housing, once the preserve of the car manufacturers themselves, have been outsourced to such an extent that the manufacturers now fully depend on a wide array of third-party service firms. These companies provide the support to distribute parts and warehouse components, transport parts and finished products to the international market, and cope with changes in production such as just-in-time manufacturing. And this is before the burgeoning business of advanced car sales operations, which provides after-market services ranging from repair to maintenance and to purchase finance, is taken into account.
The following section attempts to quantify the type of manufacturing-related jobs in services just described. Once again, the accuracy of estimates depends heavily on data availability. Precise estimates would demand industry- and country-specific case studies, which go far beyond the scope of this report. Instead, a more pragmatic approach is used, though undoubtedly less exact and based on input-output tables at country level. In particular, the proportion of inputs going to manufacturing industries from different service activi-ties are used to calculate the share of employment in these activities that could be regarded as manufactur-ing-related jobs. For instance, if 20 percent of the busi-ness service industry’s output goes to manufacturing, 20 percent of that industry’s employment is computed

31
1
st
ru
Ct
ur
al C
ha
nG
e a
nd
eM
Plo
yM
en
t tr
en
ds
“Any assessment of the scale of
manufacturing’s employment creation
based purely on data from industry surveys
will heavily undercount the true size
as manufacturing related, thus excluding any indirect job creation due to multiplier effects.14
For the transport and wholesale industries, we included both the proportion of their services due to manufacturing and their services due to receipt of manufacturing inputs in calculating their manufac-turing-related employment (for example, transport in delivering natural resource commodities to manu-facturing as well as delivering manufacturing goods to retailers) because these services depend highly on manufacturing activities.
The proportion of inputs used to calculate the manufacturing-related jobs in services is taken from the World Input-Output Database, which provides detailed input-output data for 40 countries from six regions between 1995 and 2009 (Timmer 2012).15 Based on this source we estimated the number of manufacturing-related jobs created for each direct job in manufacturing, by country and region. We then applied the regional ratios to the total formal manu-facturing jobs by region from the UNIDO database (UNIDO 2012a) and obtained figures for the total number of manufacturing-related jobs in services. We
summed the regional figures to obtain the global total. Since the data from this source are only from 1995, for previous years (as previously) we extrapolated back, applying the ratio of formal jobs to manufacturing-related jobs of 1995 to the total formal jobs between 1970 and 1994 (Figure 1.11).
In 1995 manufacturing-related jobs in services employed 73 million workers. Over 1995–2009 these jobs grew much faster than those in direct formal manufacturing (reflecting the outsourcing approaches discussed above) reaching 95 million by 2009.
Thus manufacturing – broadly defined to include formal, informal and manufacturing-related services– offered almost 470 million jobs in 2009, employ-ing around 16 percent of the world’s workforce of 2.9 billion (477 million in the peak year of 2007 over 1995–2009).16
One key message from this exercise is that any assessment of the scale of manufacturing’s employ-ment creation based purely on data from indus-try surveys will heavily undercount the true size. Employment data from this type of source represent, at best, half the total number of jobs directly and
Figure 1.11 Number of jobs created by manufacturing industry and manufactured-related services, 1970–2009
0
100
200
300
400
500
200920052000199519901985198019751970
Empl
oym
ent,
head
coun
t (m
illio
ns)
Informal (extrapolated)InformalManufacturing-related (extrapolated)Manufacturing-related Formal
Note: For calculation method of formal and informal jobs, see Box 1.3.Source: UNIDO estimate based on ILO (2011a, 2013), UNIDO (2012a) and Timmer (2012).

32
1
st
ru
Ct
ur
al C
ha
nG
e a
nd
eM
Plo
yM
en
t tr
en
ds
“Manufacturing is also important for absorbing
workers with modest skills and providing them with
stable jobs and good benefits – as the sector where
the world’s middle classes take shape and grow
indirectly created by manufacturing (and see Regional shifts in manufacturing-related services in Chapter 2 and Manufacturing-related services employment in Chapter 3).
Scattered evidence gathered in Lavopa and Szirmai (2012) suggests that manufacturing is the sector with much stronger linkages and much larger employment multipliers in an economy: for every job created in manufacturing, their evidence points to two or three created outside manufacturing. This is much higher than our estimates on manufacturing-related jobs in services, because we intentionally calculated them more conservatively: they include only certain sectors, do not include second- or third-round effects (input-output multiplier effects) and do not include income-induced effects.
We can thus conclude that the real impact of man-ufacturing on employment creation is much higher than portrayed in Figure 1.11.
Quality of jobsManufacturing jobs possess some characteristics that make them more desirable than other types of employment, including higher productivity from a macroeconomic viewpoint and higher wages, bet-ter working conditions, more opportunities for skill upgrading and many jobs for women from a social viewpoint.
Higher productivity jobs are normally associ-ated with higher wages. Historical evidence for the advanced economies and the successful newly indus-trialized countries shows that wage gains associated with industrializing structural change have greatly helped pull large sections of the population out of pov-erty (Weiss 2013). Manufacturing is also important for absorbing workers with modest skills and provid-ing them with stable jobs and good benefits – as the sector where “the world’s middle classes take shape and grow” (Rodrik 2011).
Some employment-intensive industries seem par-ticularly well suited for this purpose, such as garment industries in many low-income countries (Fukunishi et al. 2006; Fukunishi 2012; Chapter 4). These
industries provide wages that are generally higher, rural opportunities with low entry barriers for less educated workers (especially females) and a relatively easy promotion to better positions.
Many individuals see manufacturing as a major source of good jobs. Besides offering higher wages, it typically provides better employee benefits and secu-rity than jobs in other sectors and tends to develop higher skills than equivalent jobs in the rest of the economy (Lavopa and Szirmai 2012).17
Returning to the 14 emerging economies discussed above (see Figure 1.8), manufacturing is the largest sector for employment, paying above-average wages (Figure 1.12). Although mean labour incomes are much higher in tradable services, the sector employs only a small portion of the workforce. Non-market services and non-manufacturing industries also pay very good wages, but their capacity to absorb labour is also limited. Non-tradable services and agriculture are the main employers of the economy, but their labour incomes are much lower than in other sectors. Manufacturing thus possesses the advantage of being
Figure 1.12 Relative labour income and share in total employment by sector, 14 emerging economies, 2005
Labo
ur p
rodu
ctiv
ity (i
ndex
, tot
al a
vera
ge =
1)
Share in total employment (percent)
0
1
2
4
3
5
0 25 50 75 100
Tradable servicesNon-manufacturing industriesManufacturingNon-market servicesNon-tradable servicesAgriculture
Note: Weighted averages. Total economy average of income = 1.Source: UNIDO estimate based on Timmer (2012).

33
1
st
ru
Ct
ur
al C
ha
nG
e a
nd
eM
Plo
yM
en
t tr
en
ds
“Manufacturing is an important
source of good jobs for women
at the same time an important absorber of labour while paying above-average wages.
The picture is less clear for the 26 advanced econo-mies. Although manufacturing still pays above- average wages (and is second on relative labour incomes), trad-able services are a larger employer that pays even better wages (Figure 1.13).
These figures stress again the potential benefits (in this case, wages) that arise from the movement of labour from agriculture and non-tradable services into manufacturing, especially at low and lower middle incomes.
Female employment in manufacturingManufacturing industries can foster jobs for women: 33 percent of manufacturing workers are female, a higher share than in agriculture (28 percent) and non-manufacturing industries (9 percent), though lower than in services (47 percent; Figure 1.14). In view of manufacturing’s often better labour conditions, these data suggest that manufacturing is an important source of good jobs for women.
During the 1980s the female share in manufactur-ing rose in all regions (apart from four non-European high-income economies). But from the mid-1990s it started to decline in higher income economies and in the Middle East and North Africa, though it contin-ued growing in the lower middle- and middle-income economies of Latin America and the Caribbean as well as in South Asia (Table 1.3). The share remained constant or declined from the mid-1990s in highly export-oriented manufacturing sectors in East Asia, including the more mature and higher income export-ers (Hong Kong SAR China, the Republic of Korea, Singapore and Taiwan Province of China) as well as followers Indonesia, Malaysia and the Philippines (but not Thailand).18
This East Asian “defeminization”, commented on by many observers, is explained by technologi-cal change as part of an upgrading progress while exporters move into technologically more sophis-ticated and higher value goods. This shift typically requires higher capital–labour ratios and a higher ratio of skilled to unskilled workers. It can be explained either as a response to perceived demand
Figure 1.13 Relative labour income and share in total employment by sector, 26 advanced economies, 2005
Labo
ur p
rodu
ctiv
ity (i
ndex
, tot
al a
vera
ge =
1)
Share in total employment (percent)
0
1
2
4
3
5
0 25 50 75 100
Tradable servicesNon-manufacturing industriesManufacturingNon-market servicesNon-tradable servicesAgriculture
Note: Weighted averages. Total economy average of income = 1.Source: UNIDO estimate based on Timmer (2012).
Figure 1.14 Share of female employment in total employment by sector, 94 countries, 2005
0
10
20
30
40
50
ServicesNon-manufacturingindustries
ManufacturingAgriculture
Shar
e of
fem
ale
empl
oym
ent i
n to
tal e
mpl
oym
ent (
perc
ent)
Source: UNIDO estimate based on ILO (2013) and World Bank (2013a).
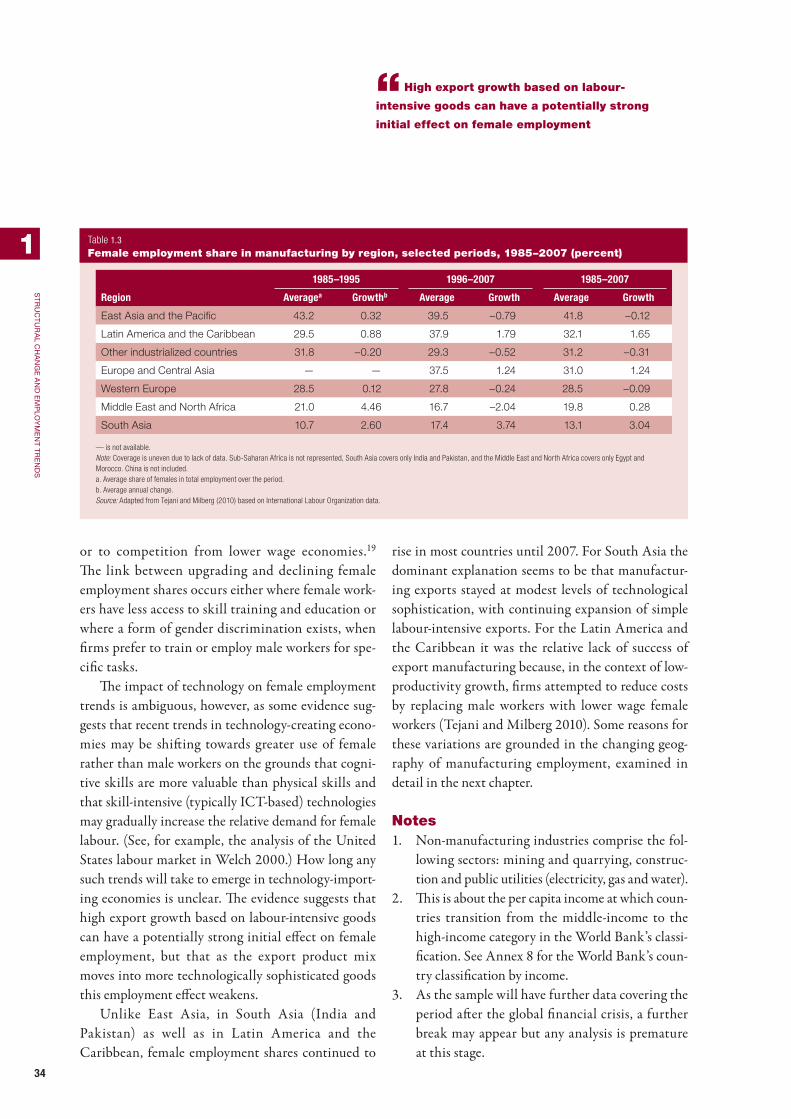
34
1
st
ru
Ct
ur
al C
ha
nG
e a
nd
eM
Plo
yM
en
t tr
en
ds
“High export growth based on labour-
intensive goods can have a potentially strong
initial effect on female employment
or to competition from lower wage economies.19 The link between upgrading and declining female employment shares occurs either where female work-ers have less access to skill training and education or where a form of gender discrimination exists, when firms prefer to train or employ male workers for spe-cific tasks.
The impact of technology on female employment trends is ambiguous, however, as some evidence sug-gests that recent trends in technology-creating econo-mies may be shifting towards greater use of female rather than male workers on the grounds that cogni-tive skills are more valuable than physical skills and that skill-intensive (typically ICT-based) technologies may gradually increase the relative demand for female labour. (See, for example, the analysis of the United States labour market in Welch 2000.) How long any such trends will take to emerge in technology-import-ing economies is unclear. The evidence suggests that high export growth based on labour-intensive goods can have a potentially strong initial effect on female employment, but that as the export product mix moves into more technologically sophisticated goods this employment effect weakens.
Unlike East Asia, in South Asia (India and Pakistan) as well as in Latin America and the Caribbean, female employment shares continued to
rise in most countries until 2007. For South Asia the dominant explanation seems to be that manufactur-ing exports stayed at modest levels of technological sophistication, with continuing expansion of simple labour-intensive exports. For the Latin America and the Caribbean it was the relative lack of success of export manufacturing because, in the context of low-productivity growth, firms attempted to reduce costs by replacing male workers with lower wage female workers (Tejani and Milberg 2010). Some reasons for these variations are grounded in the changing geog-raphy of manufacturing employment, examined in detail in the next chapter.
Notes1. Non-manufacturing industries comprise the fol-
lowing sectors: mining and quarrying, construc-tion and public utilities (electricity, gas and water).
2. This is about the per capita income at which coun-tries transition from the middle-income to the high-income category in the World Bank’s classi-fication. See Annex 8 for the World Bank’s coun-try classification by income.
3. As the sample will have further data covering the period after the global financial crisis, a further break may appear but any analysis is premature at this stage.
1985–1995 1996–2007 1985–2007
Region Averagea Growthb Average Growth Average Growth
East Asia and the Pacific 43.2 0.32 39.5 –0.79 41.8 –0.12
Latin America and the Caribbean 29.5 0.88 37.9 1.79 32.1 1.65
Other industrialized countries 31.8 –0.20 29.3 –0.52 31.2 –0.31
Europe and Central Asia — — 37.5 1.24 31.0 1.24
Western Europe 28.5 0.12 27.8 –0.24 28.5 –0.09
Middle East and North Africa 21.0 4.46 16.7 –2.04 19.8 0.28
South Asia 10.7 2.60 17.4 3.74 13.1 3.04
— is not available.Note: Coverage is uneven due to lack of data. Sub-Saharan Africa is not represented, South Asia covers only India and Pakistan, and the Middle East and North Africa covers only Egypt and Morocco. China is not included.a. Average share of females in total employment over the period.b. Average annual change.Source: Adapted from Tejani and Milberg (2010) based on International Labour Organization data.
Table 1.3 Female employment share in manufacturing by region, selected periods, 1985–2007 (percent)

35
1
st
ru
Ct
ur
al C
ha
nG
e a
nd
eM
Plo
yM
en
t tr
en
ds
4. The commodities included are those categorized under Standard International Trade Classification Revision 1 in code 2 (crude materials, inedible, except fuels), 32 (coal, coke and briquettes), 331 (petroleum, crude and partly refined) and 3411 (gas, natural).
5. Following this procedure 48 countries of our sample were classified as natural resource rich: Afghanistan, Australia, Bahamas, Benin, Bolivia, Burkina Faso, Cambodia, Cameroon, Canada, Central African Republic, Chile, Republic of Congo, Côte d’Ivoire, Denmark, Egypt, Estonia, Ethiopia, The Gambia, Georgia, Guatemala, Haiti, Honduras, Indonesia, Kuwait, Lao People’s Democratic Republic, Latvia, Liberia, Malawi, Mongolia, Mozambique, New Zealand, Nigeria, Norway, Oman, Papua New Guinea, Paraguay, Qatar, Russian Federation, Saudi Arabia, Swaziland, Syrian Arab Republic, United Republic of Tanzania, Trinidad and Tobago, Uganda, United Arab Emirates, Viet Nam, Yemen and Zimbabwe.
6. This figure is an updated version of Figure 1.8 in World Bank (2008, p. 114). The data have been updated using other sources to make the periods of the figure as close as possible to the growth periods defined for each country. On data avail-ability, however, in most cases the periods shown in the figure are shorter (see the figure note).
7. Formally,
where Pty stands for labour productivity, VA for value added and L for labour, the superscript c refers to the country, the subscript i refers to the sector and the subscript T refers to the total econ-omy. VAshc
i and Lshci represent the share of sector i
in total GDP and total employment, respectively. As discussed later, the growth accounting litera-ture identifies several routes to increase produc-tion, labour productivity being only one of them.
8. Further, only countries with adequate statistics on the share of each sector in total GDP and employ-ment were selected, leading to a loss of coverage. For this reason the results from the table should not be compared with those in Figure 1.3, which are also based on a far more refined estimation technique and thus more robust and reliable.
9. Including these countries in the sample does not change the main results. The main difference is that the series on non-manufacturing indus-tries’ relative productivity shows a rather strange peak at $21,000 per capita (mainly reflecting the high productivity in this sector of the major oil exporters).
10. The definition of these groups has been made following the income thresholds defined by the World Bank for 2012 (http://data.worldbank.org/about/country-classifications). The origi-nal thresholds, however, are defined in terms of gross national income per capita at current (Atlas method) dollars. Because our income levels are defined in terms of GDP per capita at constant 2005 PPP values, a correspondence has been done to establish thresholds that deliver the most simi-lar classification of countries as the World Bank’s definition. These thresholds are: low and lower middle income, $6,500 or less; upper middle income, $6,500–$15,000; and high income, more than $15,000.
11. Tradable services: ISIC divisions I (Transport, storage and communications) excluding subsec-tor 60 (Land transport; transport via pipelines), J (Financial intermediation) and K (Real estate, renting and business activities) excluding sub-sector 70 (Real estate activities). Non-tradable services: ISIC divisions G (Wholesale and retail trade), H (Hotels and restaurants), O (Other community, social and personal service activities), P (Private households with employed persons) and subsectors 60 (Land transport; transport via pipelines) and 70 (Real estate activities). Non-market services: ISIC divisions L (Public admin-istration and defence), M (Education), N (Health
RelPty ci = =
Pty ci
Pty cT
=VAshc
i
Lshci
VAci Lc
i
VAcT Lc
T
=VAc
i VAcT
Lci Lc
T

36
1
st
ru
Ct
ur
al C
ha
nG
e a
nd
eM
Plo
yM
en
t tr
en
ds
and social work) and Q (Extra-territorial organi-zations and bodies).
12. For the list of countries classified by income (PPP) see Annex 8.
13. Emerging economies: Brazil, Bulgaria, China, Cyprus, India, Indonesia, Latvia, Lithuania, Malta, Mexico, Romania, Russian Federation, Taiwan Province of China and Turkey. Advanced econo-mies: Australia, Austria, Belgium, Canada, Czech Republic, Germany, Denmark, Estonia, Finland, France, Greece, Hungary, Ireland, Italy, Japan, Republic of Korea, Luxembourg, Netherlands, Poland, Portugal, Slovakia, Slovenia, Spain, Sweden, United Kingdom and United States.
14. The methodology only looks at direct input-output relationship between services and
manufacturing and does not take indirect (Leontief multiplier) effects into account.
15. The 14 emerging and 26 advanced economies listed earlier.
16. Number obtained from World Bank (2013b) for the same sample of countries.
17. Employee benefits include retirement plans, paid holidays and so forth. Security benefits include life insurance and health insurance.
18. The female employment share continued rising (Tejani and Milberg 2010).
19. Tejani and Milberg (2010) show that across their sample, rising capital intensity in manufacturing is associated with a falling female employment share.

37
As countries develop over time, the structure of their economy (and thus employment) changes, as seen in Chapter 1. This chapter looks at the spatial shifts in manufacturing employment between regions and countries, as well as within countries, stemming from the structural transformation or change. With developed countries becoming richer and many less developed countries being lifted out of poverty, recent decades have seen an important shift in the distribu-tion of manufacturing around the globe. Although North America, Industrialized Europe and Japan still account for around 40 percent of global manufactur-ing value added, the rise of value added in East Asia and the Pacific, particularly China, over the last few decades has been dramatic – a shift even more promi-nent than in manufacturing employment (World Bank 2013b; for a list of countries see Annex 8).
Although these trends generally confirm the pre-diction that the share of manufacturing should first rise and then decline with income, other forces such as comparative advantage also affect how quickly or slowly structural change takes place in a given country. Trade and comparative advantage may explain, for example, why some high-income countries such as Germany maintain an important manufacturing sector. The scope of trade in shaping the geographical distribution of manufacturing activity has become more prominent in recent decades with the entry of some important middle-income countries such as China and the Russian Federation into the World Trade Organization, and the increasing fragmentation of the value chain.
As relative productivity is an important driver of specialization and trade, agglomeration economies are important in explaining how manufacturing locates across space. The emergence of some countries like China, the Republic of Korea and Singapore as manu-facturing hubs is related to agglomeration economies at the country level. Yet this type of spatial clustering is usually more prominent within countries, because some forces that encourage geographical concentration are
much stronger at the small geographical scale of regions, cities or towns than at the large geographical scale of countries. Within the United States, for instance, the Midwest used to be an important manufacturing region before turning into a “Rust Belt” and being replaced by other regional clusters, such as China’s eastern sea-board. (Not all of China is becoming a factory; many of its regions remain based on agriculture.)
When looking within countries, manufacturing tends to become geographically more concentrated during the structural change from agriculture to manufacturing, but the trend reverses when services become more important, for two main reasons. First, agriculture is land intensive, but this is less true of manufacturing and even less so of services. So when manufacturing replaces agriculture, manufactur-ing tends to cluster, but when services become more important manufacturing tends to disperse.
Second, the structural change is driven partly by productivity gains and innovation. In the early stages of industrialization, when there are high gains from knowledge clusters, manufacturing concen-trates. Later, as manufacturing matures, those gains become smaller, and it often moves to areas where land is cheaper. For example, in the last half century in advanced economies such as the United States and Western Europe, manufacturing has been relocating to less congested areas, making it geographically more dispersed. In less advanced economies this is less true, and manufacturing continues to have a strong pres-ence in urban areas. There is thus a link between a country’s level of development and the geographical concentration of its manufacturing.
The overall trend of manufacturing to move to less congested areas in advanced economies needs to be qualified in three ways. First, although manufacturing firms are moving out of cities, they are “suburbanizing” rather than “ruralizing”. They still have a strong motive to stay quite close to cities. Second, not all manufac-turing subsectors are moving out of cities – the cost
Chapter 2
Structural transformation and the changing geography of manufacturing employment
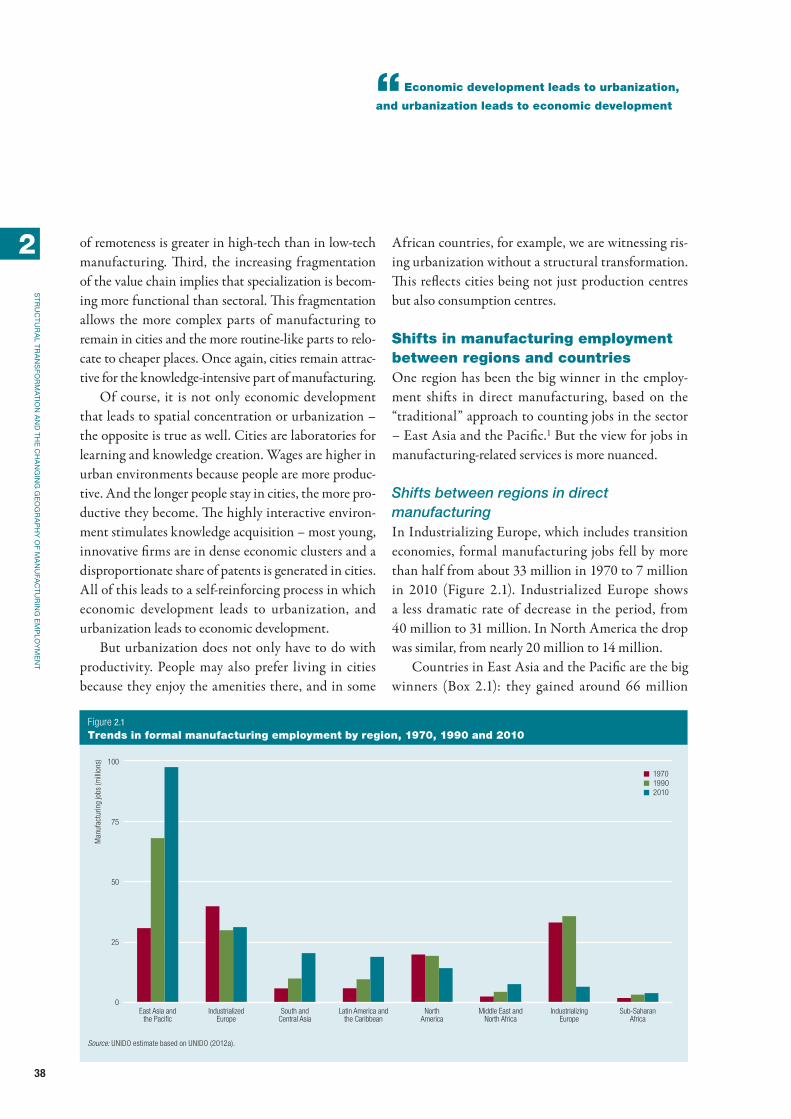
38
st
ru
Ct
ur
al t
ra
ns
For
Ma
tIo
n a
nd
th
e C
ha
nG
InG
Ge
oG
ra
Ph
y o
F Ma
nu
FaC
tu
rIn
G e
MP
loy
Me
nt
2
“Economic development leads to urbanization,
and urbanization leads to economic development
of remoteness is greater in high-tech than in low-tech manufacturing. Third, the increasing fragmentation of the value chain implies that specialization is becom-ing more functional than sectoral. This fragmentation allows the more complex parts of manufacturing to remain in cities and the more routine-like parts to relo-cate to cheaper places. Once again, cities remain attrac-tive for the knowledge-intensive part of manufacturing.
Of course, it is not only economic development that leads to spatial concentration or urbanization – the opposite is true as well. Cities are laboratories for learning and knowledge creation. Wages are higher in urban environments because people are more produc-tive. And the longer people stay in cities, the more pro-ductive they become. The highly interactive environ-ment stimulates knowledge acquisition – most young, innovative firms are in dense economic clusters and a disproportionate share of patents is generated in cities. All of this leads to a self-reinforcing process in which economic development leads to urbanization, and urbanization leads to economic development.
But urbanization does not only have to do with productivity. People may also prefer living in cities because they enjoy the amenities there, and in some
African countries, for example, we are witnessing ris-ing urbanization without a structural transformation. This reflects cities being not just production centres but also consumption centres.
Shifts in manufacturing employment between regions and countriesOne region has been the big winner in the employ-ment shifts in direct manufacturing, based on the “traditional” approach to counting jobs in the sector – East Asia and the Pacific.1 But the view for jobs in manufacturing-related services is more nuanced.
Shifts between regions in direct manufacturingIn Industrializing Europe, which includes transition economies, formal manufacturing jobs fell by more than half from about 33 million in 1970 to 7 million in 2010 (Figure 2.1). Industrialized Europe shows a less dramatic rate of decrease in the period, from 40 million to 31 million. In North America the drop was similar, from nearly 20 million to 14 million.
Countries in East Asia and the Pacific are the big winners (Box 2.1): they gained around 66 million
Figure 2.1 Trends in formal manufacturing employment by region, 1970, 1990 and 2010
Sub-SaharanAfrica
IndustrializingEurope
Middle East andNorth Africa
NorthAmerica
Latin America andthe Caribbean
South andCentral Asia
IndustrializedEurope
East Asia andthe Pacific
Man
ufac
turin
g jo
bs (m
illio
ns)
197019902010
0
25
50
75
100
Source: UNIDO estimate based on UNIDO (2012a).
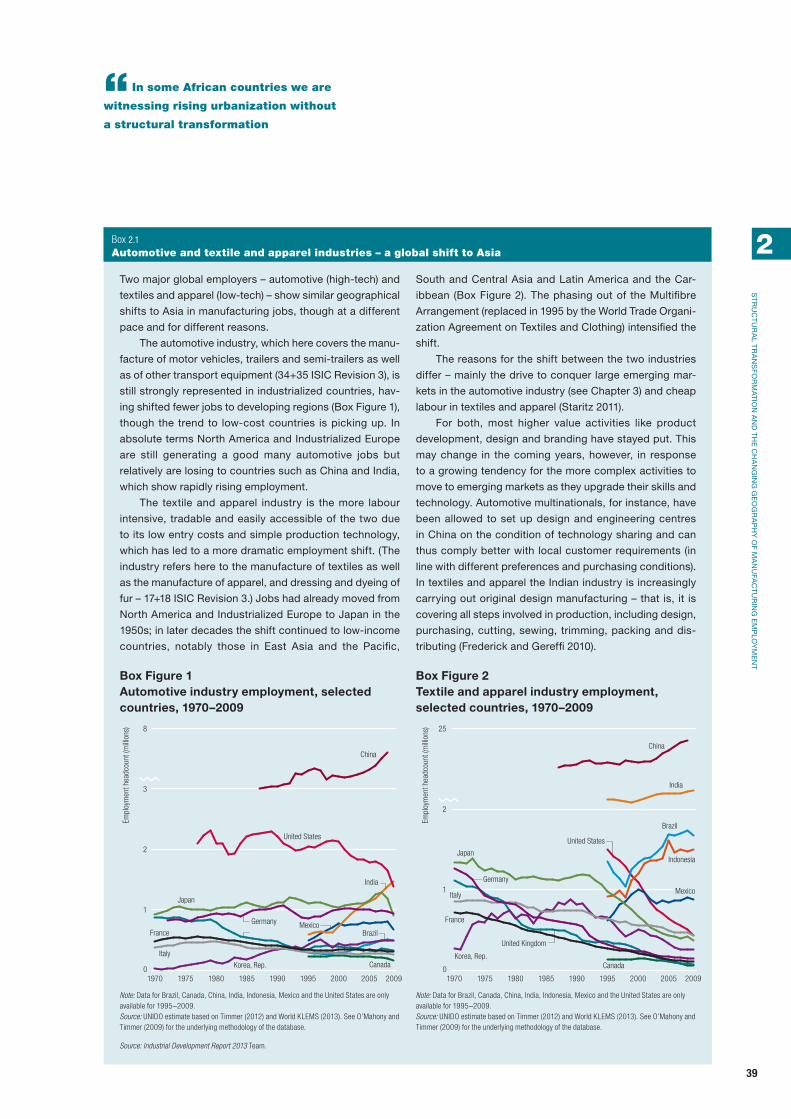
39
st
ru
Ct
ur
al t
ra
ns
For
Ma
tIo
n a
nd
th
e C
ha
nG
InG
Ge
oG
ra
Ph
y o
F Ma
nu
FaC
tu
rIn
G e
MP
loy
Me
nt
2
“In some African countries we are
witnessing rising urbanization without
a structural transformation
two major global employers – automotive (high-tech) and
textiles and apparel (low-tech) – show similar geographical
shifts to asia in manufacturing jobs, though at a different
pace and for different reasons.
the automotive industry, which here covers the manu-
facture of motor vehicles, trailers and semi-trailers as well
as of other transport equipment (34+35 IsIC revision 3), is
still strongly represented in industrialized countries, hav-
ing shifted fewer jobs to developing regions (Box Figure 1),
though the trend to low-cost countries is picking up. In
absolute terms north america and Industrialized europe
are still generating a good many automotive jobs but
relatively are losing to countries such as China and India,
which show rapidly rising employment.
the textile and apparel industry is the more labour
intensive, tradable and easily accessible of the two due
to its low entry costs and simple production technology,
which has led to a more dramatic employment shift. (the
industry refers here to the manufacture of textiles as well
as the manufacture of apparel, and dressing and dyeing of
fur – 17+18 IsIC revision 3.) Jobs had already moved from
north america and Industrialized europe to Japan in the
1950s; in later decades the shift continued to low-income
countries, notably those in east asia and the Pacific,
south and Central asia and latin america and the Car-
ibbean (Box Figure 2). the phasing out of the Multifibre
arrangement (replaced in 1995 by the world trade organi-
zation agreement on textiles and Clothing) intensified the
shift.
the reasons for the shift between the two industries
differ – mainly the drive to conquer large emerging mar-
kets in the automotive industry (see Chapter 3) and cheap
labour in textiles and apparel (staritz 2011).
For both, most higher value activities like product
development, design and branding have stayed put. this
may change in the coming years, however, in response
to a growing tendency for the more complex activities to
move to emerging markets as they upgrade their skills and
technology. automotive multinationals, for instance, have
been allowed to set up design and engineering centres
in China on the condition of technology sharing and can
thus comply better with local customer requirements (in
line with different preferences and purchasing conditions).
In textiles and apparel the Indian industry is increasingly
carrying out original design manufacturing – that is, it is
covering all steps involved in production, including design,
purchasing, cutting, sewing, trimming, packing and dis-
tributing (Frederick and Gereffi 2010).
Box Figure 1 Automotive industry employment, selected countries, 1970–2009
Box Figure 2 Textile and apparel industry employment, selected countries, 1970–2009
200920052000199519901985198019751970
Empl
oym
ent h
eadc
ount
(mill
ions
)
ChinaChina
United StatesUnited States
United Kingdom
Germany
Germany France
France
Italy
Italy
Indonesia
CanadaCanadaKorea, Rep.
Korea, Rep.
Brazil
Japan
Japan
India
India
Brazil
200920052000199519901985198019751970
Empl
oym
ent h
eadc
ount
(mill
ions
)
0
1
2
25
0
1
2
3
8
Mexico
Mexico
Note: Data for Brazil, Canada, China, India, Indonesia, Mexico and the United States are only available for 1995–2009.Source: UNIDO estimate based on Timmer (2012) and World KLEMS (2013). See O’Mahony and Timmer (2009) for the underlying methodology of the database.
Note: Data for Brazil, Canada, China, India, Indonesia, Mexico and the United States are only available for 1995–2009.Source: UNIDO estimate based on Timmer (2012) and World KLEMS (2013). See O’Mahony and Timmer (2009) for the underlying methodology of the database.
Source: Industrial Development Report 2013 Team.
Box 2.1 Automotive and textile and apparel industries – a global shift to Asia

40
st
ru
Ct
ur
al t
ra
ns
For
Ma
tIo
n a
nd
th
e C
ha
nG
InG
Ge
oG
ra
Ph
y o
F Ma
nu
FaC
tu
rIn
G e
MP
loy
Me
nt
2
“The positive impact of manufacturing
on output and employment in services
has increased in recent decades,
especially in industrialized countries
formal manufacturing jobs (from 31 million in 1970 to 97 million in 2010). Jobs in South and Central Asia shot up from around 6 million to 20 million and in Latin America and the Caribbean from 6 million to 19 million.2
Shifts between countries in direct manufacturingThis subsection looks at the data at a more disaggre-gated level. The top 10 countries by share of global for-mal manufacturing jobs accounted for around 70 per-cent of the total throughout the period, though this fairly constant share masks underlying geographical shifts (Table 2.1).
China, which replaced the Soviet Union at the top in 1990 and kept that spot in 2010, increased its share hugely, from 10 percent in 1970 to 34 percent in 2010, for an increase of about 55 million formal jobs. India moved up from eighth in 1970 to third in 2010, nearly doubling its share to 6 percent by adding about 7 mil-lion formal jobs. Brazil, which started at number 13 in 1970, moved into the top five by 2010, having more than doubled its share from 1.5 percent to 4.0 per-cent, and increased jobs by about 5.6 million.3 Other countries moving into the top 10 include Bangladesh, Indonesia and Viet Nam.
In the other direction, France, Germany, Japan, Italy, Poland, the Russian Federation and the United Kingdom fell within or even out of their top 10 slots. The Russian Federation, for example, lost nearly 23 million formal manufacturing jobs between 1991 and 2010 (given the break-up of the Soviet Union any comparison with 1970 would be meaningless), and by 2010 had only around 8 million formal workers in manufacturing. Its global share dropped from 11 per-cent to 4 percent in this period. The United Kingdom lost around 5.7 million formal manufacturing jobs between 1970 and 2010 (its share falling from 6 per-cent to only 1 percent), and Japan gave up 3.6 million (losing half its share, from 8 percent to 4 percent). The losses in France, Germany and Poland were more modest. The United States continued to hold sec-ond position but still lost nearly 5.5 million formal
manufacturing jobs as its share fell by more than half from 13 percent in 1970 to 6 percent in 2010.
Regional shifts in manufacturing-related servicesThe positive impact of manufacturing on output and employment in services has increased in recent decades, especially in industrialized countries. This greater service intensity of manufacturing stems from greater demand for coordination across loca-tions (because of outsourcing, for example) and from changes in technology and organization (Falk and Jarocinska 2010). If we thus take a broader view of manufacturing and include manufacturing-related services, the decline of manufacturing in industrial-ized countries is mitigated somewhat, as will be shown below. Table 2.2 shows that manufacturing-related services have seven subcategories.
Based on the typology of services that identifies their relation to manufacturing, renting of machinery and equipment and other business activities (ISIC: 71–74) – or business services for short – seems to be most closely linked to manufacturing production, fol-lowed by trade, financial intermediation and trans-port and inland transport (ISIC: 51, J, 52, 60) with a medium linkage to manufacturing. Real estate activi-ties, post and telecommunications, other supporting and auxiliary transport activities as well as sale, main-tenance and repair of motor vehicles and motorcycles (ISIC: 70, 63, 64, 50) show a low linkage to manufac-turing, whereas hotels and restaurants as well as air and water transport (ISIC: H, 62, 61) show the lowest linkage.4
Manufacturing-related services still play an impor-tant role in industrialized countries (Figure 2.2): their jobs remained stable at around 32 million dur-ing 1995–2009. Business services especially, such as design, research, engineering, branding, advertising and marketing, are still increasing and mitigate the decline of manufacturing employment in industrial-ized countries. Looking at the share of employment in manufacturing-related services, industrialized econo-mies have increased their share from 24 percent in

41
st
ru
Ct
ur
al t
ra
ns
For
Ma
tIo
n a
nd
th
e C
ha
nG
InG
Ge
oG
ra
Ph
y o
F Ma
nu
FaC
tu
rIn
G e
MP
loy
Me
nt
2
“This greater service intensity of
manufacturing stems from greater demand
for coordination across locations and from
changes in technology and organization
1970
Ranking Country
Manufacturing employment
(millions)
Global share of manufacturing
employment (percent)
World 139.7 100.00
1 Soviet Union 27.1 19.41
2 United States 18.2 13.03
3 China 14.2 10.13
4 Japan 10.9 7.79
5 Germany, Fed. Rep. 8.2 5.87
6 United Kingdom 8.0 5.69
7 France 5.2 3.72
8 India 4.7 3.40
9 Poland 3.5 2.48
10 Italy 3.3 2.35
13 Brazil 2.1 1.48
27 Korea, Rep. of 0.8 0.59
33 Indonesia 0.5 0.35
47 Bangladesh 0.2 0.15
83 Viet Nam 0.04 0.03
1990
Ranking Country
Manufacturing employment
(millions)
Global share of manufacturing
employment (percent)
World 180.3 100.00
1 China 42.4 23.53
2 Soviet Union 30.4 16.83
3 United States 17.5 9.71
4 Japan 11.2 6.20
5 India 7.2 3.98
6 Germany, Fed. Rep. 7.1 3.95
7 United Kingdom 4.8 2.66
8 Brazil 4.2 2.32
9 France 3.1 1.72
10 Poland 3.0 1.67
11 Korea, Rep. of 3.0 1.64
12 Italy 2.8 1.53
13 Indonesia 2.6 1.47
24 Bangladesh 1.0 0.57
60 Viet Nam 0.2 0.12
2010
Ranking Country
Manufacturing employment
(millions)
Global share of manufacturing
employment (percent)
World 200.3 100.00
1 China 68.8 34.34
2 United States 12.7 6.36
3 India 11.8 5.88
4 Russian Federationa 7.8 3.90
5 Brazil 7.7 3.84
6 Japan 7.3 3.63
7 Germany 6.2 3.10
8 Bangladesh 5.1 2.53
9 Viet Nam 4.4 2.20
10 Indonesia 4.2 2.11
11 Italy 3.3 1.66
14 France 2.9 1.45
16 United Kingdom 2.3 1.13
17 Poland 2.0 1.01
27 Korea, Rep. of 1.3 0.64
a. The Russian Federation had 30,352,000 manufacturing jobs in 1991 and was second between China and the United States with a share of 11 percent.Source: UNIDO elaboration based on UNIDO (2012a) and World Bank (2013b).
Table 2.1 Shares in global formal manufacturing employment by country, 1970, 1990 and 2010

42
st
ru
Ct
ur
al t
ra
ns
For
Ma
tIo
n a
nd
th
e C
ha
nG
InG
Ge
oG
ra
Ph
y o
F Ma
nu
FaC
tu
rIn
G e
MP
loy
Me
nt
2
“Regional employment growth patterns in
manufacturing-related services confirm that
manufacturing and manufacturing-related
activities are shifting geographically to Asia
1995 to 29 percent in 2009 (of total manufacturing and manufacturing-related services employment).
Within the same period (1995–2009), the indus-trializing countries show a strong increase from nearly 34 million to around 51 million manufacturing-related services jobs (see Figure 2.2). East Asia and the Pacific, especially China, is the “power region” within the industrializing countries, as their manufacturing-related services jobs increased from nearly 24 million jobs in 1995 to more than 31 million jobs in 2009 (see Figure 2.2). The region showed strong gains in all cat-egories (except financial intermediation), notably in business services and transport. Increasing transport could also be linked to rising intra-regional trade and the increasing participation of regional countries in international production sharing.
Although growth of direct manufacturing employment in Latin America and the Caribbean is not as pronounced as in some other regions, par-ticularly Asia, the growth in manufacturing-related services employment there has been quite dynamic, possibly because it uses such employment more for manufacturing production than other regions (see Figure 2.2). Business services, wholesale, transport and financial intermediation made strong gains dur-ing 1995–2009.
Overall, regional employment growth patterns in manufacturing-related services confirm that manufac-turing and manufacturing-related activities are shift-ing geographically to Asia, particularly to East Asia and the Pacific. At the same time, however, business services in Industrialized Europe and North America have stayed fairly stable, mitigating a little the drop in direct manufacturing jobs in those regions (see Figure 2.2).
Shifts among regions and countries in manufacturing tradeThe evolution of net manufactured exports among regions and over time confirms the broad employment patterns presented above. (The relationship between manufacturing trade and employment is considered in greater detail in Chapter 5.) Over 1970–2011 net manufactured exports of East Asia and the Pacific soared from $2 billion to $653 billion (Figure 2.3). Another region that saw dramatic gains was Industrialized Europe (from $14 billion to $359 bil-lion). But North America saw the balance of its net manufactured exports crash from a positive $4 bil-lion to a $814 billion deficit. Industrializing Europe, Latin America and the Caribbean, the Middle East and North Africa, South and Central Asia and Sub-Saharan Africa also recorded widening net deficits, though less dramatically.
These trends not only reflect structural transfor-mation and changing comparative advantage but also changing trade balances, and so have to be interpreted with caution. Regions that were running increas-ing trade surpluses, such as East Asia and the Pacific, may be increasing net exports in general and not just in manufacturing. Similarly, regions with widening trade deficits may see decreasing net exports across the board.
Changes in the country distribution of manufac-tured exports have been largely led by China, which moved from 12th place in 1990 to the top spot in 2011, vastly increasing its net manufactured exports from nearly $1 billion to $604 billion (Table 2.3). Again, this reflects not only China’s emergence as
Group
Sectors included
World Input-Output
Database
International Standard Industrial
Classification Revision 3
Business services 29, 30 K
Financial intermediation 28 J
Manufacturing 3–16 D
Other services 31–35 L–P
Transport 23–27 I
Wholesale 19–22 G–H
Aggregated service employment 19–35 G–P
Source: Timmer 2012; UNSD 2013.
Table 2.2 Composition of manufacturing-related services

43
st
ru
Ct
ur
al t
ra
ns
For
Ma
tIo
n a
nd
th
e C
ha
nG
InG
Ge
oG
ra
Ph
y o
F Ma
nu
FaC
tu
rIn
G e
MP
loy
Me
nt
2
“Over 1970–2011 net manufactured
exports of East Asia and the Pacific
soared from $2 billion to $653 billion
a manufacturing powerhouse but also its widening trade surplus with the rest of the world.
Strong increases in net manufactured exports are also displayed by Thailand and some high-income countries, such as Germany, Japan and the Republic of Korea, and to a lesser extent by Italy and the Netherlands. These are all countries whose pace of structural change out of manufacturing and into services has been slower than expected given their GDP, probably still retaining some advantage in
manufacturing and thus allowing them to maintain a strong manufacturing export sector. Some of these countries, such as Germany and Japan, have thus suf-fered smaller losses in manufacturing employment than other countries with similar incomes.
Technological composition of net exportsThe composition of net exports by region reiterates the broad global patterns observed so far, and extends to medium- and high-technology products, which seem
Figure 2.2 Main types of services employment in manufacturing production by region, 1970–2009
1970 2009
South and Central Asia1970 2009
Industralized Europe1970 2009
Industralized countries1970 2009
East Asia and the Pacific1970 2009
Industrializing countries
1970 2009
Sub-Saharan Africa1970 2009
Industralizing Europe1970 2009
Middle East and North Africa1970 2009
North America1970 2009
Latin America and the Caribbean
Empl
oym
ent h
eadc
ount
(mill
ions
)Em
ploy
men
t hea
dcou
nt (m
illio
ns)
0
20
40
60
80
0
100
200
300
400Financial intermediationBusiness servicesOther servicesTransportWholesaleManufacturingAggregated service employment (1970–1995, estimated)
Note: Some countries of the former Soviet Union are categorized after 1990 in South and Central Asia and Middle East and North Africa (Tajikistan, Georgia, Kazakhstan and Kyrgyzstan), others in Industrializing Europe (Albania, Latvia, Moldavia, Romania, the Russian Federation and Ukraine) and in Industrialized Europe (Estonia, the Russian Federation and Lithuania), which explains the jump in the corresponding regional graphs. Manufacturing includes formal and informal jobs. (See Box 1.3 in Chapter 1.)Source: UNIDO estimate based on UNIDO (2012a) and Timmer (2012).
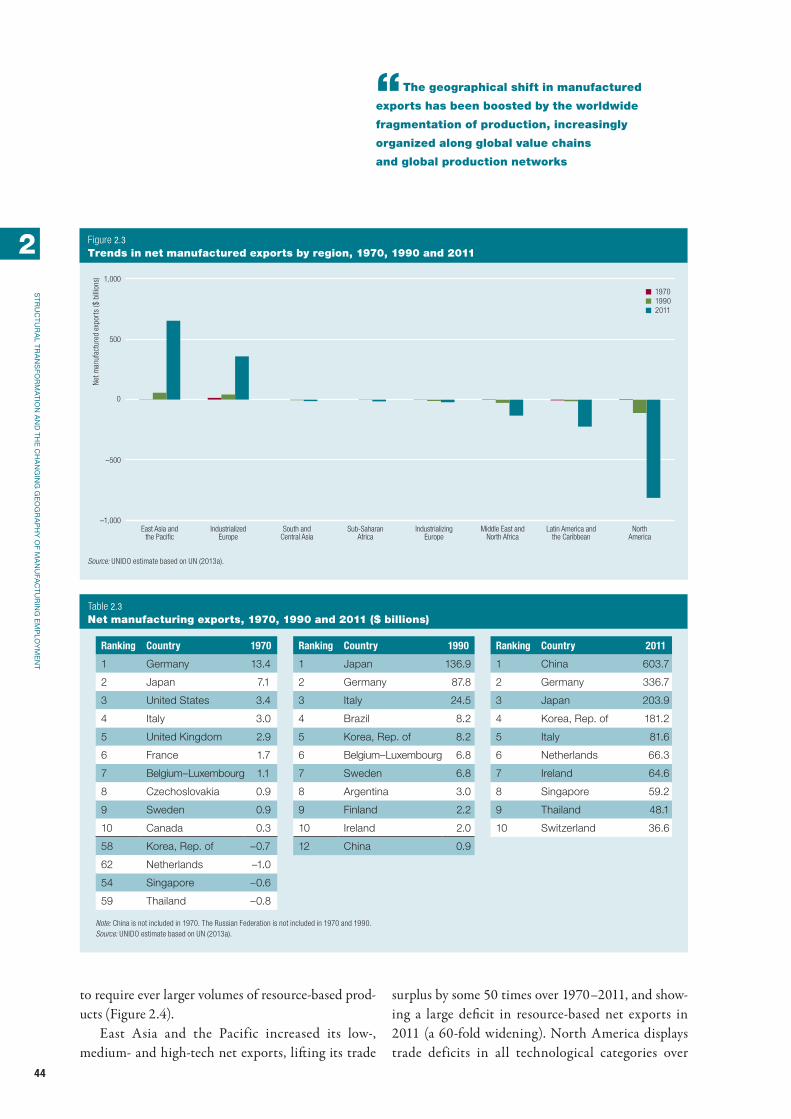
44
st
ru
Ct
ur
al t
ra
ns
For
Ma
tIo
n a
nd
th
e C
ha
nG
InG
Ge
oG
ra
Ph
y o
F Ma
nu
FaC
tu
rIn
G e
MP
loy
Me
nt
2
“The geographical shift in manufactured
exports has been boosted by the worldwide
fragmentation of production, increasingly
organized along global value chains
and global production networks
to require ever larger volumes of resource-based prod-ucts (Figure 2.4).
East Asia and the Pacific increased its low-, medium- and high-tech net exports, lifting its trade
surplus by some 50 times over 1970–2011, and show-ing a large deficit in resource-based net exports in 2011 (a 60-fold widening). North America displays trade deficits in all technological categories over
Figure 2.3 Trends in net manufactured exports by region, 1970, 1990 and 2011
–1,000
–500
0
500
1,000
NorthAmerica
Latin America andthe Caribbean
Middle East andNorth Africa
IndustrializingEurope
Sub-SaharanAfrica
South andCentral Asia
IndustrializedEurope
East Asia andthe Pacific
Net
man
ufac
ture
d ex
port
s ($
bill
ions
)
197019902011
Source: UNIDO estimate based on UN (2013a).
Ranking Country 1970
1 Germany 13.4
2 Japan 7.1
3 United States 3.4
4 Italy 3.0
5 United Kingdom 2.9
6 France 1.7
7 Belgium–Luxembourg 1.1
8 Czechoslovakia 0.9
9 Sweden 0.9
10 Canada 0.3
58 Korea, Rep. of –0.7
62 Netherlands –1.0
54 Singapore –0.6
59 Thailand –0.8
Ranking Country 1990
1 Japan 136.9
2 Germany 87.8
3 Italy 24.5
4 Brazil 8.2
5 Korea, Rep. of 8.2
6 Belgium–Luxembourg 6.8
7 Sweden 6.8
8 Argentina 3.0
9 Finland 2.2
10 Ireland 2.0
12 China 0.9
Ranking Country 2011
1 China 603.7
2 Germany 336.7
3 Japan 203.9
4 Korea, Rep. of 181.2
5 Italy 81.6
6 Netherlands 66.3
7 Ireland 64.6
8 Singapore 59.2
9 Thailand 48.1
10 Switzerland 36.6
Note: China is not included in 1970. The Russian Federation is not included in 1970 and 1990.Source: UNIDO estimate based on UN (2013a).
Table 2.3 Net manufacturing exports, 1970, 1990 and 2011 ($ billions)

45
st
ru
Ct
ur
al t
ra
ns
For
Ma
tIo
n a
nd
th
e C
ha
nG
InG
Ge
oG
ra
Ph
y o
F Ma
nu
FaC
tu
rIn
G e
MP
loy
Me
nt
2
“The rise of global value chains and
the global pattern of production is readily
seen in trade in intermediate goods
the same period, but most in high-tech net exports. Industrialized Europe has the expected picture of a small trade deficit in low-tech net exports in 2011 and a large surplus in resource-based (mainly due to Russia’s high surplus), medium- and high-tech net exports. South and Central Asia in 2011 shows a sur-plus in low-tech net exports and a deficit in resource-based, medium- and high-tech net exports.
Shifts in the global structure of production and trade through global value chainsThe geographical shift in manufactured exports has been boosted by the worldwide fragmentation of pro-duction, increasingly organized along global value chains (GVCs) and global production networks.5
A value chain can be thought of as the “full range of activities that firms and workers do to bring a product
from its conception to its end use and beyond” (Gereffi and Fernandez-Stark 2011, p. 4). Different tasks, such as product design and development, production, and marketing and distribution, are carried out in different countries that, rather than specialize in different final goods, specialize in different tasks or stages of the pro-duction process (Grossman and Rossi-Hansberg 2008).
The rise of GVCs and the global pattern of pro-duction is readily seen in trade in intermediate goods, a widely used indicator of participation in GVCs. Such trade accounted for half of global trade in 2011, reflecting an increase over 1970–2011 from around $152 billion to $6,922 billion, or nearly 10 percent annually (Figure 2.5).
By region the shares of Industrialized Europe and North America declined by 25 percentage points dur-ing 1970–2011 (Figure 2.6). The share of East Asia
Figure 2.4 Trends in manufactured exports by region and technological classification, 1970, 1990 and 2011
Sub-SaharanAfrica
South andCentral
Asia
NorthAmerica
MiddleEast and
North Africa
LatinAmericaand the
Caribbean
Industri-alizingEurope
Industri-alizedEurope
East Asiaand thePacific
Net
exp
orts
($ b
illio
ns)
Resource-based
Net
exp
orts
($ b
illio
ns)
Medium technology
Low technology
High technology
Net
exp
orts
($ b
illio
ns)
Net
exp
orts
($ b
illio
ns)
Sub-SaharanAfrica
South andCentral
Asia
NorthAmerica
MiddleEast and
North Africa
LatinAmericaand the
Caribbean
Industri-alizingEurope
Industri-alizedEurope
East Asiaand thePacific
–400
–200
0
200
400
Sub-SaharanAfrica
South andCentral
Asia
NorthAmerica
MiddleEast and
North Africa
LatinAmericaand the
Caribbean
Industri-alizingEurope
Industri-alizedEurope
East Asiaand thePacific
Sub-SaharanAfrica
South andCentral
Asia
NorthAmerica
MiddleEast and
North Africa
LatinAmericaand the
Caribbean
Industri-alizingEurope
Industri-alizedEurope
East Asiaand thePacific
–400
–200
0
200
400
–400
–200
0
200
400
–400
–200
0
200
400197019902011
Note: China is not included in 1970. The Russian Federation is not included in 1970 and 1990.Source: UNIDO estimate based on UN (2013a).

46
st
ru
Ct
ur
al t
ra
ns
For
Ma
tIo
n a
nd
th
e C
ha
nG
InG
Ge
oG
ra
Ph
y o
F Ma
nu
FaC
tu
rIn
G e
MP
loy
Me
nt
2
“The more pronounced role of Asia
in global manufacturing production and
trade is largely driven by China
and the Pacific increased – reflecting rising manufac-turing capacity and related trade in intermediates – from 13 percent in 1970 to 35 percent in 2011.
The more pronounced role of Asia in global manu-facturing production and trade is largely driven by
China (Figure 2.7). China, the largest exporter and importer of intermediate goods in Asia, shows very high growth rates, far above the regional average, both for exports (with the Republic of Korea) and for imports (with Hong Kong SAR China and India).
Shifts in manufacturing employment within countriesThe structural change leads to shifts in manufacturing activity not only between regions and countries but also within countries.
Structural change and geographical concentrationAccording to Marshall (1920), agglomeration econo-mies have three possible sources. First, information and knowledge are more easily transmitted at short distances. These localized knowledge spillovers make it more attractive for firms to locate close to each other. Second, the geographical concentration of industry generates a localized market for specialized skills. This labour-market pooling gives further incen-tives to firms to locate near each other. Third, the spa-tial clustering of a particular industry creates a mar-ket for specialized suppliers, which in turn increases the productivity of all the cluster’s firms. These three
Figure 2.5 Trends of world non-fuel exports by type of good, 1970, 1990 and 2011
0
2,000
4,000
6,000
8,000
OthersConsumption goods(non-fuel)
Capitalgoods
Intermediategoods
0
5
10
15
20
Expo
rts
($ b
illio
ns) Com
pound annual growth rate (percent)
Exports197019902011
Compound annualgrowth rate
Note: China is not included in 1970. The Russian Federation is not included in 1970 and 1990.Source: Adapted from IDE-JETRO and WTO (2011) and UN (2013a).
Figure 2.6 Shares in exports of global intermediate goods by region, 1970, 1990 and 2011
1970 1990 2011
IndustrializedEurope54.6%
East Asiaand the Pacific
12.5%
North America24.1%
Latin America and theCaribbean 5.5%
South and Central Asia 1.0%
Middle East and North Africa 1.1%Industrializing Europe0.9%
Middle East andNorth Africa 1.2%
Sub-SaharanAfrica 0.2%
Sub-SaharanAfrica 0.1%
IndustrializedEurope55.2%
East Asiaand the Pacific
19.3%
Industralizing Europe 0.8%
Latin Americaand the Caribbean
3.8%
South and Central Asia0.9%
North America18.9%
IndustrializedEurope40.7%
East Asiaand the Pacific
34.7%
Industralizing Europe0.3%
South andCentral Asia 2.3%
Middle East andNorth Africa 2.1%
Sub-Saharan Africa0.04%
NorthAmerica12.7%
Latin Americaand the Caribbean
7.3%
Note: China is not included in 1970. The Russian Federation is not included in 1970 and 1990.Source: Adapted from IDE-JETRO and WTO (2011) and UN (2013a).

47
st
ru
Ct
ur
al t
ra
ns
For
Ma
tIo
n a
nd
th
e C
ha
nG
InG
Ge
oG
ra
Ph
y o
F Ma
nu
FaC
tu
rIn
G e
MP
loy
Me
nt
2
“There is a strong positive correlation
between structural change and urbanization
centripetal forces generally work simultaneously when industries cluster.
During the structural change out of agriculture, manufacturing tends to become geographically more concentrated. In advanced economies services are now replacing manufacturing in urban areas as industrial production plants move out to less congested areas. So to analyse the relation between structural change and geographical concentration in countries, we need to look at manufacturing and services together, because both are associated with increases in urbanization.
Urbanization as proxyWith urbanization as a proxy for geographical con-centration, the relation between the non-agricultural employment share and the degree of urbanization is positive and linear (Figure 2.8).6 On a linear regres-sion the slope is equal to 0.8. This implies that a 1 per-centage point increase in the share of manufacturing and service employment is associated with a 0.8 per-centage point increase in urbanization. Thus, there is a strong positive correlation between structural change and urbanization.
If we focus exclusively on the share of manufactur-ing, the relation with urbanization has an inverted U shape (Figure 2.9). Countries with intermediate levels of manufacturing employment have the high-est urbanization: these correspond to the advanced economies in which the structural change into ser-vices has led to a decrease in the share of manufactur-ing employment. Countries with low or high shares of manufacturing employment are less urbanized, but the effect is not symmetric: the least urbanized have the lowest shares of manufacturing, and are usually the countries still heavily based on agriculture.
Rather than comparing the degree of geographi-cal concentration in different countries at different stages of their structural change, we can also follow a country over time. The prediction is that as a country moves through its first and second transformations, the degree of geographical concentration increases.
Gross cell productA more direct measure than urbanization for geo-graphical concentration comes from the G-Econ research project at Yale University. For a large number
Figure 2.7 Intermediate goods exports and imports by key Asian trading economies, 1970–2011
0
250
500
750
1,000
1,250
IndonesiaMalaysiaThailandSingaporeIndiaKorea,Rep.
JapanChina0
5
10
15
20
25
Expo
rts ($
billi
ons)
Compound annual grow
th rate (percent)
Exports
Compound annualgrowth rate
0
200
400
600
800
1,000
IndonesiaThailandSingaporeIndiaHong KongSAR China
Korea,Rep.
JapanChina0
5
10
15
20
25
Impo
rts ($
billi
ons)
Compound annual grow
th rate (percent)
Imports
Compound annualgrowth rate
Exports
Imports
Source: Adapted from IDE-JETRO and WTO (2011) and UN (2013a).
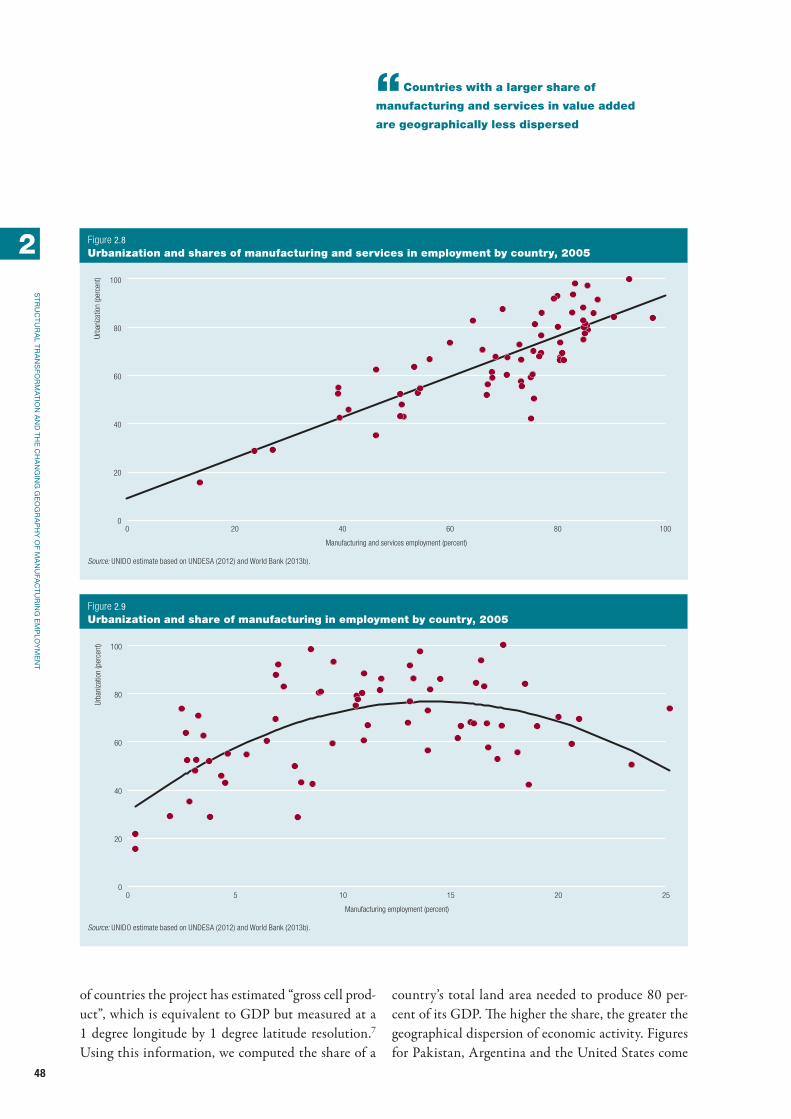
48
st
ru
Ct
ur
al t
ra
ns
For
Ma
tIo
n a
nd
th
e C
ha
nG
InG
Ge
oG
ra
Ph
y o
F Ma
nu
FaC
tu
rIn
G e
MP
loy
Me
nt
2
“Countries with a larger share of
manufacturing and services in value added
are geographically less dispersed
of countries the project has estimated “gross cell prod-uct”, which is equivalent to GDP but measured at a 1 degree longitude by 1 degree latitude resolution.7 Using this information, we computed the share of a
country’s total land area needed to produce 80 per-cent of its GDP. The higher the share, the greater the geographical dispersion of economic activity. Figures for Pakistan, Argentina and the United States come
Figure 2.8 Urbanization and shares of manufacturing and services in employment by country, 2005
0 20 40 60 80 100
Urba
niza
tion
(per
cent
)
Manufacturing and services employment (percent)
0
20
40
60
80
100
Source: UNIDO estimate based on UNDESA (2012) and World Bank (2013b).
Figure 2.9 Urbanization and share of manufacturing in employment by country, 2005
0 5 10 15 20 25
Urba
niza
tion
(per
cent
)
Manufacturing employment (percent)
0
20
40
60
80
100
Source: UNIDO estimate based on UNDESA (2012) and World Bank (2013b).

49
st
ru
Ct
ur
al t
ra
ns
For
Ma
tIo
n a
nd
th
e C
ha
nG
InG
Ge
oG
ra
Ph
y o
F Ma
nu
FaC
tu
rIn
G e
MP
loy
Me
nt
2
“The structural change is thus associated with
greater spatial concentration of economic activity
out at 0.57, 0.43 and 0.14, respectively (meaning that Pakistan, for example, produces 80 percent of its GDP on 57 percent of its land).
Given the evidence on structural change and urbanization presented earlier, we would expect the relation between structural change and geographical dispersion of GDP to be negative, which is indeed the case (Figure 2.10).8 Countries with a larger share of manufacturing and services in value added are geo-graphically less dispersed. The structural change is thus associated with greater spatial concentration of economic activity.
Geographical concentration in different industries
Manufacturing and servicesAs innovation is a particularly important driver of the spatial concentration of economic activity, the tendency towards clustering is stronger in sectors that benefit more from innovation. Recent evidence for the United States, for example, shows that services, which benefit more than manufacturing from information
and communication technologies (ICTs; Hobijn and Jovanovic 2001), have become more concentrated in the past few decades, unlike more mature industries, which have become increasingly dispersed (Table 2.4 and Box 2.2).
For example, in 1970 a county in the United States at the 70th percentile had 81 percent more manufac-turing employment than a county at the 30th percen-tile, but by 2000 this difference had fallen to 74 per-cent, suggesting that manufacturing employment was becoming increasingly dispersed in the United States. But in services the difference between the counties at the 70th and 30th percentiles rose from 29 percent to 52 percent, indicating that services were becoming more concentrated. Thus although manufacturing is still more concentrated than the various service indus-tries, the difference is narrowing (Desmet and Rossi-Hansberg forthcoming).
Producer-related servicesThe increased spatial dispersion of manufacturing is less dramatic when we account for “producer-related services”, such as wholesale, retail, and finance,
Figure 2.10 Geographical dispersion of GDP and shares of manufacturing and services in employment by country, 2005
0 20 40 60 80 100
Disp
ersi
on o
f GDP
(per
cent
)
Manufacturing and services value added (percent)
0.0
0.2
0.4
0.6
0.8
Source: UNIDO estimate based on World Bank (2013b) and Yale University (2011).

50
st
ru
Ct
ur
al t
ra
ns
For
Ma
tIo
n a
nd
th
e C
ha
nG
InG
Ge
oG
ra
Ph
y o
F Ma
nu
FaC
tu
rIn
G e
MP
loy
Me
nt
2
“The incentive to locate in cities and
other high-density locations depends on
the strength of agglomeration economies
and the importance of congestion costs
insurance and real estate (FIRE), which are important partly because of demand from manufacturing. These services included, it is no longer true that all activity
(in the United States at least) is moving to less con-gested areas (Table 2.5).
Manufacturing employment: patterns of dispersionAs economic activity becomes more clustered, land rents increase, giving rise to congestion costs. This caps the size of geographical clusters and cities. The incentive to locate in cities and other high-density locations thus depends on the strength of agglom-eration economies and the importance of congestion costs.
In advanced economies, as seen, agglomeration forces in manufacturing have become weaker, giving an incentive to manufacturing firms to move out of cities to cheaper areas – “suburbanizing”. But in less
1970 2000
Log employment
Difference 70th percentile–30th percentile
Manufacturing 1.81 1.74
Services 1.29 1.52
Standard deviation
Manufacturing 2.05 1.89
Services 1.40 1.52
Source: Bureau of Economic Analysis 2013.
Table 2.4 Spatial concentration of employment in the United States, 1970 and 2000
the title of this box draws on the work of david (1990),
which compared the many similarities between electricity
and ICt. electrification in the early 20th century spawned
important productivity gains and innovation in manufac-
turing, whereas ICt in the late part of the century pro-
portionately benefited services. as the incentive to geo-
graphically cluster is greater in highly innovative sectors,
we would thus expect a tendency towards spatial concen-
tration in manufacturing in the early 20th century and in
services in the late 20th century.
and this is exactly what we do see. For the united
states in 1900–1920 manufacturing’s spatial growth
pattern is almost identical to that of services in recent
decades – and very different from that of manufactur-
ing today (desmet and rossi-hansberg 2009). Focus-
ing on medium-size locations, the upward-sloping curve
for manufacturing in 1900–1920 and for services in
1970–2000 suggests a tendency towards greater geo-
graphical concentration: larger locations grow faster
than smaller locations (Box Figure 1). In more mature
industries, such as manufacturing in 1970–2000, the
incentive to cluster is much weaker. thus we see spatial
dispersion, as larger locations grow more slowly than
smaller locations.
the us wholesale sector exhibits similar behaviour to
that of manufacturing: it is becoming more dispersed. In
contrast, retail and FIre are becoming spatially more con-
centrated. In FIre, a sector closely connected to ICt, the
difference in employment between the county at the 70th
percentile and that at the 30th increased from 38 percent
in 1970 to 48 percent in 2000, indicating an increase in
geographical concentration.
Box Figure 1 Employment growth in US counties by sector, selected periods
Annu
al g
row
th ra
te (p
erce
nt)
Initial employment (log scale)
–5
0
5
10
15
0 5 10 15
Manufacturing, 1900–1920Manufacturing, 1970–2000Finance, insurance and real estate, 1970–2000Retail, 1970–2000Other services, 1970–2000
Source: Desmet and Rossi-Hansberg (2009) based on UVL (2004) and Bureau of Economic Analysis (2013).Source: Industrial Development Report 2013 Team.
Box 2.2 The dynamo and the computer
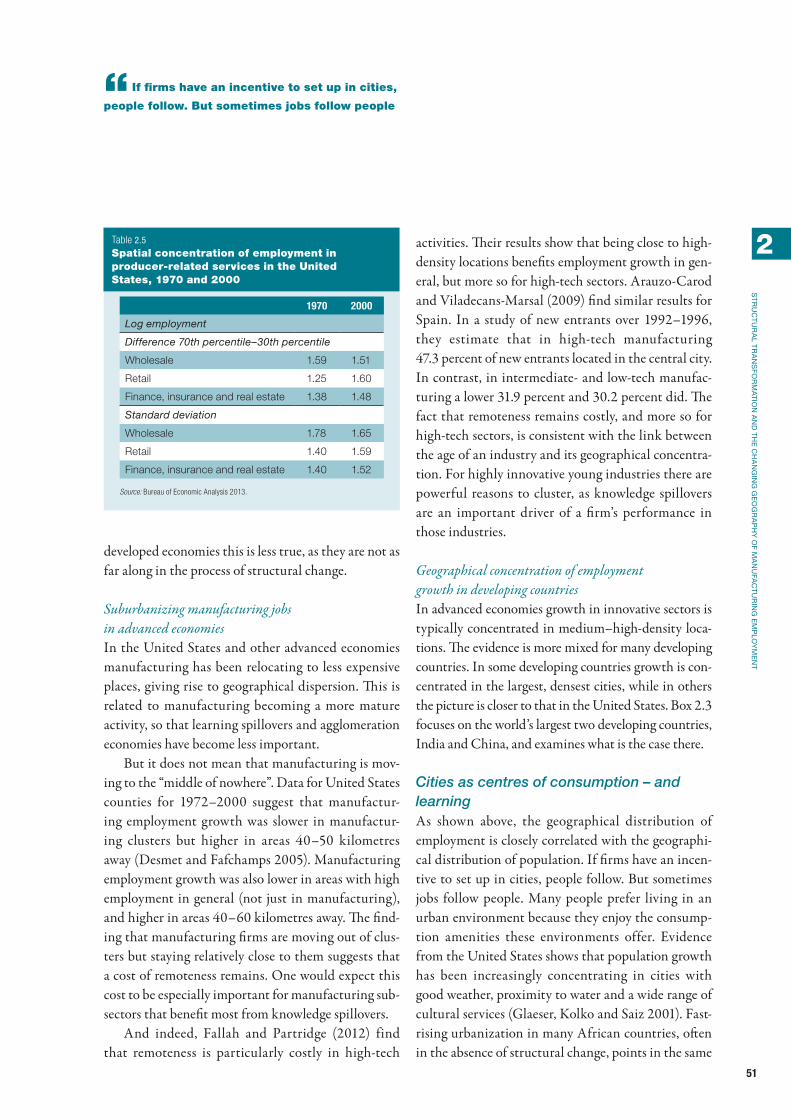
51
st
ru
Ct
ur
al t
ra
ns
For
Ma
tIo
n a
nd
th
e C
ha
nG
InG
Ge
oG
ra
Ph
y o
F Ma
nu
FaC
tu
rIn
G e
MP
loy
Me
nt
2
“If firms have an incentive to set up in cities,
people follow. But sometimes jobs follow people
developed economies this is less true, as they are not as far along in the process of structural change.
Suburbanizing manufacturing jobs in advanced economiesIn the United States and other advanced economies manufacturing has been relocating to less expensive places, giving rise to geographical dispersion. This is related to manufacturing becoming a more mature activity, so that learning spillovers and agglomeration economies have become less important.
But it does not mean that manufacturing is mov-ing to the “middle of nowhere”. Data for United States counties for 1972–2000 suggest that manufactur-ing employment growth was slower in manufactur-ing clusters but higher in areas 40–50 kilometres away (Desmet and Fafchamps 2005). Manufacturing employment growth was also lower in areas with high employment in general (not just in manufacturing), and higher in areas 40–60 kilometres away. The find-ing that manufacturing firms are moving out of clus-ters but staying relatively close to them suggests that a cost of remoteness remains. One would expect this cost to be especially important for manufacturing sub-sectors that benefit most from knowledge spillovers.
And indeed, Fallah and Partridge (2012) find that remoteness is particularly costly in high-tech
activities. Their results show that being close to high-density locations benefits employment growth in gen-eral, but more so for high-tech sectors. Arauzo-Carod and Viladecans-Marsal (2009) find similar results for Spain. In a study of new entrants over 1992–1996, they estimate that in high-tech manufacturing 47.3 percent of new entrants located in the central city. In contrast, in intermediate- and low-tech manufac-turing a lower 31.9 percent and 30.2 percent did. The fact that remoteness remains costly, and more so for high-tech sectors, is consistent with the link between the age of an industry and its geographical concentra-tion. For highly innovative young industries there are powerful reasons to cluster, as knowledge spillovers are an important driver of a firm’s performance in those industries.
Geographical concentration of employment growth in developing countriesIn advanced economies growth in innovative sectors is typically concentrated in medium–high-density loca-tions. The evidence is more mixed for many developing countries. In some developing countries growth is con-centrated in the largest, densest cities, while in others the picture is closer to that in the United States. Box 2.3 focuses on the world’s largest two developing countries, India and China, and examines what is the case there.
Cities as centres of consumption – and learningAs shown above, the geographical distribution of employment is closely correlated with the geographi-cal distribution of population. If firms have an incen-tive to set up in cities, people follow. But sometimes jobs follow people. Many people prefer living in an urban environment because they enjoy the consump-tion amenities these environments offer. Evidence from the United States shows that population growth has been increasingly concentrating in cities with good weather, proximity to water and a wide range of cultural services (Glaeser, Kolko and Saiz 2001). Fast-rising urbanization in many African countries, often in the absence of structural change, points in the same
1970 2000
Log employment
Difference 70th percentile–30th percentile
Wholesale 1.59 1.51
Retail 1.25 1.60
Finance, insurance and real estate 1.38 1.48
Standard deviation
Wholesale 1.78 1.65
Retail 1.40 1.59
Finance, insurance and real estate 1.40 1.52
Source: Bureau of Economic Analysis 2013.
Table 2.5 Spatial concentration of employment in producer-related services in the United States, 1970 and 2000

52
st
ru
Ct
ur
al t
ra
ns
For
Ma
tIo
n a
nd
th
e C
ha
nG
InG
Ge
oG
ra
Ph
y o
F Ma
nu
FaC
tu
rIn
G e
MP
loy
Me
nt
2
“People may move to cities as an investment
in their future, regarding them as centres of
learning that help them acquire knowledge
direction: cities are consumption centres as well as production centres. If people like to live in cities, firms will follow people, rather than the other way around.
People may also move to cities as an investment in their future, regarding them as centres of learning that help them acquire knowledge. It has long been known
that people in large cities earn more than people in small cities. Those are the standard agglomeration economies: the high density of cities improves the pro-ductivity of firms, implying higher wages.
What is less known is that someone who spends some time in a large city and then moves to a small
For Indian districts, Box Figure 1 plots annual employ-
ment growth in manufacturing between 2000 and 2005 as
a function of initial manufacturing employment density in
2000. although there is much heterogeneity among dis-
tricts, what stands out is that medium-density locations
are predicted to grow less than high-density locations.
some of the densest districts, such as Kolkata, with a
manufacturing employment density of more than 1,000
employees per square kilometre, continue to grow surpris-
ingly fast. this picture differs from what we would expect,
given the us experience when it went through its struc-
tural change out of agriculture.
India’s experience cannot, however, be generalized
to all developing countries. the corresponding chart for
China (Box Figure 2) shows prefecture-level cities and
likewise plots annual employment growth in manufactur-
ing in 2000–2005 as a function of initial manufacturing
employment in 2000. In contrast to India, the highest den-
sity cities grow somewhat more slowly than the medium-
density cities, including shanghai and shantou. these
findings are consistent with au and henderson (2006)
who find that some of the larger prefecture- level cities are
increasingly turning towards services.
what is striking is that when we compare China and
India, agglomeration economies are strongest in China at
an employment density of around 3.5 in log terms (about
30 employees per square kilometre), similar to the employ-
ment density for which agglomeration economies are
weakest in India. In that sense manufacturing in China
looks more like that in the united states in the early 20th
century, but manufacturing in India looks very different.
this suggests that certain barriers are preventing India’s
medium-density locations from growing faster – one may
be poor access to infrastructure.
Box Figure 1 Manufacturing employment growth in India by district, 2000–2005
Box Figure 2 Manufacturing employment growth in China by city, 2000–2005
Annu
al e
mpl
oym
ent g
row
th, 2
000–
2005
(per
cent
)
Number of manufacturing workers per square kilometer, 2000 (logs)
–50
–40
–30
–20
–10
0
10
20
30
Annu
al e
mpl
oym
ent g
row
th, 2
000–
2005
(per
cent
)
Number of manufacturing workers per square kilometer, 2000 (logs)
0 2 4 6 80 2 4 6 8–50
–40
–30
–20
–10
0
10
20
30
Source: Desmet et al. (2013), based on data from the National Sample Survey, the Labour Force Survey and the Annual Survey of Industries.
Source: Desmet et al. (2013), based on data from China Statistical Yearbooks.Source: Industrial Development Report 2013 Team.
Box 2.3 Manufacturing employment growth in India and China

53
st
ru
Ct
ur
al t
ra
ns
For
Ma
tIo
n a
nd
th
e C
ha
nG
InG
Ge
oG
ra
Ph
y o
F Ma
nu
FaC
tu
rIn
G e
MP
loy
Me
nt
2
“Despite the many problems associated
with cities, such as congestion and
pollution, there are powerful reasons for
people to continue flocking to them
city also earns more than someone similar who did not spend time in a large city. This suggests that big cities allow workers to accumulate valuable experience and knowledge that they can take with them when they move away (Glaeser and Mare 2001). In principle this could simply be due to positive sorting: larger cities may attract workers who are already more productive in the first place.
De la Roca and Puga (2012), however, by following workers over their life time, control for such sorting and still find a positive effect of large cities on learn-ing. In a study of Spain they show that someone who has spent 10 years working in Madrid (the country’s largest city) and then moves to Santiago (the coun-try’s median city by size) continues to earn on aver-age 13 percent more for the rest of their working life than someone who never left Santiago. A similar find-ing holds for someone who spends 10 years in Seville (one of the country’s medium–large cities) rather than Madrid, and then moves to Santiago, although as expected the effect is smaller.
Whatever the reason – whether firms are look-ing for knowledge spillovers in dense urban environ-ments, whether people are attracted by urban ameni-ties, or whether workers go to large cities in search of experience and learning – urbanization is continuing, with more and more mega-cities appearing around the world.
Many policy-makers wonder whether these mega-cities are becoming too large, yet evidence from Au and Henderson (2006) and Desmet and Rossi-Hansberg (2013) point to the contrary. In China, for example, there may be further welfare gains from hav-ing more spatial concentration of economic activity in large cities. So, despite the many problems associated with cities, such as congestion and pollution, there are powerful reasons for people to continue flocking to them.
Notes1. For datasets used see Chapter 1.2. Looking at regional informal manufactur-
ing employment data for 1995–2009, we can
observe similar patterns for formal manufactur-ing employment, except in Industrialized Europe. While this region was characterized by a slight increase of formal manufacturing jobs over 1990–2010, the informal jobs decreased slightly over 1995–2009. Among the top three rankings of informal manufacturing employment, East Asia and the Pacific holds first position in 2009 with 59.8 million informal manufacturing jobs, fol-lowed by South and Central Asia with 56.7 mil-lion and Latin America and the Caribbean with 40.3 million.
3. Brazil almost doubled its formal manufacturing jobs over 1990–2010. This sharp rise could be a result of two subsequent reclassifications from ISIC Rev. 2 to ISIC Rev. 3 (1990–1995) and from ISIC Rev. 4 to ISIC Rev. 3 (2008–2010). Between 1996 and 2007 the employment figures were reported in ISIC Rev. 3. Further, the number of establishments reporting relevant figures rose from 6,094,000 in 1990 to 29,368,000 in 2010 establishments.
4. The thresholds are established based on the aver-age backward linkage coefficient calculated using input-output techniques on the World Input-Output Database (Timmer 2012). The thresh-olds are the following: high-coefficients – higher than 0.1; medium – between 0.05 and 0.1; low – between 0.01 and 0.05; and very low – coeffi-cients lower than 0.01.
5. In line with Shepherd and Stone (2013, p. 4), “the concept of GVCs is closely related to those of global production networks”. The main dif-ference is that the GVC concept is inherently non-linear, as it is based on complex network interactions.
6. Urbanization measures the share of the popula-tion living in urban areas. The positive correla-tion between non-agricultural employment and urbanization may be partly driven by the defini-tion of urbanization, which in some countries is related to the relative absence of primary sec-tor employment. For a complete definition of

54
st
ru
Ct
ur
al t
ra
ns
For
Ma
tIo
n a
nd
th
e C
ha
nG
InG
Ge
oG
ra
Ph
y o
F Ma
nu
FaC
tu
rIn
G e
MP
loy
Me
nt
2 urbanization in the different countries of the United Nations dataset, see UNDESA (2012).
7. 1 degree latitude is just around 111 kilometres; 1 degree longitude varies: it is close to 111 kilome-tres at the equator and 0 kilometre at the poles.
8. The data on the share of manufacturing and services in value added come from the World
Development Indicators (World Bank 2013b). To maximize the number of countries, the data on the geographical dispersion of GDP are for 1990 and the data on value added for 2000, but because the geographical dispersion changes only gradually, the results are unlikely to be affected significantly.
55
Building on the discussion of the overall economic structural change in the previous chapters, this chapter illustrates structural change within manufacturing in detail. It shows that at relatively low incomes manufac-turing value added, productivity and employment tend to grow fast. Then, as countries achieve higher incomes, manufacturing employment slows because its major sources (labour-intensive, low-tech industries) start curtailing employment. This slowdown and eventual decline in employment usually occur while manufac-turing value added and productivity keeps increasing.
At an advanced stage of industrialization, indus-tries with a higher technological level grow faster than others, and some of them could sustain their fast growth of value added even at very high GDP per cap-ita. But such industries with high growth potential are usually more capital and technology intensive, and in terms of employment each one of those industries will create a fraction of the jobs of a labour-intensive indus-try. Unlike value added, most manufacturing indus-tries start reducing employment before the economy reaches $25,000 GDP per capita (at 2005 purchasing power parity dollars).
Still, as countries develop, manufacturing’s poten-tial to create employment in manufacturing-related services increases. Thus even in industrialized coun-tries, manufacturing makes a bigger contribution to employment than the direct manufacturing statistics might indicate. Most of those service jobs pay wages comparable to those in manufacturing.
Although this relationship between income and manufacturing structure has some elements of univer-sality since countries more or less follow a similar path of structural change as income rises, comparable to structural change for the whole economy (Chapter 1), country-specific conditions are important: geographi-cal and demographic conditions give countries natu-ral advantages or disadvantages in developing certain industries (Katz 2000). There is also space for coun-tries to shape the structure autonomously, which is
why history, culture and policy also matter to a coun-try’s development (Lin and Chang 2009).
Three labour-intensive industries – wearing apparel, textiles, and food and beverages – are particularly important for industrialization to take off. They create a large number of formal, better paid jobs in manufac-turing, absorbing the unemployed and underemployed rural workforce from less productive activities. Later, the manufacturing structure needs to be continually upgraded, and if that is successful, entry into more tech-nology- and knowledge-intensive industries could both compensate for the decline in jobs in labour-intensive industries and enhance the quality of manufacturing jobs. Medium-tech industries perform a bridging role for industrialization: although their employment gen-eration capacity is not as large as labour-intensive indus-tries, they are crucial for generating investment goods and funds for further industrial upgrading. While each higher tech industry does not usually create as many jobs as a labour-intensive one, the successful devel-opment of the multiple higher tech industries could enhance the skills, technology and knowledge base of a country’s manufacturing sector, leading to higher man-ufacturing productivity and wages.
Manufacturing development in low- and middle-income countries could also improve women’s social and economic status as labour-intensive manufactur-ing industries often employ more female than male workers. But their continuing concentration in these industries works against the sustained gains in wom-en’s economic welfare when manufacturing becomes more technology intensive.
Manufacturing, structural change and economic development: selected country experiences
Shifts in manufacturing and economic growthFour country examples illustrate the relationship between the changes in manufacturing structure
Chapter 3
Structural change in manufacturing

56
st
ru
Ct
ur
al C
ha
nG
e In
Ma
nu
FaC
tu
rIn
G
3
“The speed of exploiting the advantage in
existing industries and laying the foundation
for emerging industries through investment
becomes key for fast economic growth
and economic development. The value added and employment data are available at the manufactur-ing subsector level for 1963 and 1998 for four coun-tries from different regions – Colombia, Hungary, Kenya and the Republic of Korea. In 1963 the GDP per capita of Kenya and the Republic of Korea were about the same and the lowest among the four. Hungary and Colombia had 3.7 times and 1.7 times higher GDP per capita than the other two, respectively.
After 35 years the country that changed its struc-ture the most also increased its GDP per capita the most: the Republic of Korea completely transformed its manufacturing structure from low- to high-tech industries and increased GDP per capita eight times, transforming itself from one of the poorest to the richest of the four (Figure 3.1). Over the same period Kenya did not change its manufacturing structure much – nor its GDP per capita.
Hungary already had fairly high value-added shares in low/medium and high-tech industries as well as a high GDP per capita in 1963 (see Figure 3.1). Over the 35 years it further increased the share of higher tech industries but not to the same degree as the Republic of Korea, and experi-enced a slower increase in GDP per capita. Finally, Colombia increased the shares of some medium-tech industries and chemicals but not the shares of other high-tech industries, and it only doubled its GDP per capita.
While country-specific conditions might make a difference as to which industries within different tech-nology groups develop more than others, such differ-ences do not seem to override the relationship between the shift in the overall manufacturing structure and economic development.
The speed of developmentIf the transformation of the manufacturing structure has a strong association with a country’s economic development, the speed of exploiting the advantage in existing industries and laying the foundation for emerging industries through investment becomes key
for fast economic growth. To illustrate, Figure 3.2 shows the estimated development patterns of indus-tries in value added per capita (food and beverages, wearing apparel, basic metals, and electrical machin-ery and apparatus) and the actual development paths of the Republic of Korea, Malaysia and Sri Lanka (Box 3.1).
The three countries have advantages in different industries that reflect their stage of development. Sri Lanka’s is in relatively labour-intensive industries, such as food and beverages and wearing apparel, and thus rapid growth in these industries is foreseen. Malaysia has already lost its advantage in these indus-tries, but can still expect continuing growth for some time in basic metals as well as long-term growth in electrical machinery and apparatus. The Republic of Korea has already lost, or is about to lose, its advan-tage in basic metals, but should keep its advantage in electrical machinery and apparatus for the foreseeable future.
Despite similar development trajectories, the speeds at which these three countries have exploited their advantages – and thus increased their income and, possibly, shifted their advantage from one indus-try to another – differ (Table 3.1). All four industries developed much faster in the Republic of Korea than in Malaysia even during a similar stage of economic development: in wearing apparel around 20 times faster, and in basic metals and in electrical machinery and apparatus about 10 times faster. Sri Lanka’s indus-tries lagged behind Malaysia’s, apart from wearing apparel.
Productivity increases are crucial in accelerat-ing development. The higher the growth of labour productivity, the faster a country moves along the development trajectories (Haraguchi 2012; Annex 1). Productivity growth is especially important in explaining the speed of transformation of high-tech industries; productivity and other factors, such as wages, may be associated with the growth of low-tech industries (Chapter 4).
The Republic of Korea has experienced a fast manufacturing transformation in pursuit of raising

57
st
ru
Ct
ur
al C
ha
nG
e In
Ma
nu
FaC
tu
rIn
G
3
“The higher the growth of labour
productivity, the faster a country moves
along the development trajectories
living standards, and was much – perhaps two or three times – faster than the advanced countries that preceded it (Box 3.2). Stagnant countries, conversely, may stay with the same structure and income for decades.
Patterns of structural change and employment generation within manufacturingGiven the important relationship between manu-facturing structural transformation and economic
Figure 3.1 Changes in value added by manufacturing industry, selected countries, 1963 and 1998
Republic of Korea
Motor vehicles
Precision instruments
Electrical machineryand apparatus
Machinery and equipment
Chemicals
Fabricated metals
Basic metals
Non-metallic minerals
Rubber and plastic
Coke and refined petroleum
Printing and publishing
Paper
Furniture, notelsewhere classified
Wood products
Wearing apparel
Textiles
Tobacco
Food and beverages
Percent
0 10 20 30
19631998
Kenya
Motor vehicles
Precision instruments
Electrical machineryand apparatus
Machinery and equipment
Chemicals
Fabricated metals
Basic metals
Non-metallic minerals
Rubber and plastic
Coke and refined petroleum
Printing and publishing
Paper
Furniture, notelsewhere classified
Wood products
Wearing apparel
Textiles
Tobacco
Food and beverages
Percent
0 10 20 504030
Hungary
Motor vehicles
Precision instruments
Electrical machineryand apparatus
Machinery and equipment
Chemicals
Fabricated metals
Basic metals
Non-metallic minerals
Rubber and plastic
Coke and refined petroleum
Printing and publishing
Paper
Furniture, notelsewhere classified
Wood products
Wearing apparel
Textiles
Tobacco
Food and beverages
Percent
0 10 20 30
Colombia
Motor vehicles
Precision instruments
Electrical machineryand apparatus
Machinery and equipment
Chemicals
Fabricated metals
Basic metals
Non-metallic minerals
Rubber and plastic
Coke and refined petroleum
Printing and publishing
Paper
Furniture, notelsewhere classified
Wood products
Wearing apparel
Textiles
Tobacco
Food and beverages
Percent
0 10 20 30
Note: The names of the low-, medium- and high-tech industries are in red, green and blue, respectively. Constant GDP per capita, PPP, in 1963 and 1998, respectively: Republic of Korea $1,940 and $15,586; Kenya: $1,835 and $1,918; Hungary: $7,030 (estimated) and $11,826; and Colombia: $3,323 and $6,837.Source: UNIDO estimate based on CIC (2009) and UNIDO (2012a).

58
st
ru
Ct
ur
al C
ha
nG
e In
Ma
nu
FaC
tu
rIn
G
3
“Of three main factors shaping manufacturing
development – a country’s stage of development,
its given geographical and demographic conditions
and its autonomously created conditions – the
first usually has the strongest influence
development indicated by the above four country experiences, this subsection presents the general pat-terns of manufacturing development and structural transformation. Of three main factors shaping man-ufacturing development – a country’s stage of devel-opment (proxied by income), its given geographical and demographic conditions and its autonomously
created conditions – the first usually has the strongest influence. Thus in this subsection we discuss general patterns of this development based on income to see how industries evolve and how manufacturing’s struc-ture changes as a country develops. Then in the next
Figure 3.2 Changes in per capita value-added by income and manufacturing industry, the Republic of Korea, Malaysia and Sri Lanka, 1963–2007
Valu
e ad
ded
per c
apita
, $ (l
og s
cale
)
Food and beverages
Valu
e ad
ded
per c
apita
, $ (l
og s
cale
) Basic metals
Wearing apparel
Electrical machinery and apparatus
Valu
e ad
ded
per c
apita
, $ (l
og s
cale
)Va
lue
adde
d pe
r cap
ita, $
(log
sca
le)
0
1
20
400
8,000
0
1
20
400
8,000
0
1
20
400
8,000
0
1
20
400
8,000
GDP per capita, 2005 PPP$ (log scale) GDP per capita, 2005 PPP$ (log scale)
GDP per capita, 2005 PPP$ (log scale)GDP per capita, 2005 PPP$ (log scale)
0 400 1,000 3,000 8,000 22,000 60,0000 400 1,000 3,000 8,000 22,000 60,000
MalaysiaRepublic of KoreaSri LankaEstimated pattern
0 400 1,000 3,000 8,000 22,000 60,0000 400 1,000 3,000 8,000 22,000 60,000
Note: Data and estimation method are explained in Box 3.3.Source: UNIDO estimate based on CIC (2009) and UNIDO (2012a).
the republic of Korea, Malaysia and sri lanka were
selected because all three belong to the same group of
large countries and have relatively long time-series data,
allowing us to investigate their development trajectories.
they also have an overlapping range of GdP per capita,
letting us compare average annual growth of per capita
value added at similar development stages.
Source: Industrial Development Report 2013 Team.
Box 3.1 The choice of three countries
IndustryKorea, Rep. of Malaysia Sri Lanka
Food and beverages 4.74 1.46 0.64
Wearing apparel 13.37 0.66 1.43
Basic metals 3.62 0.38 0.03
Electrical machinery and apparatus 7.53 0.78 0.10
Note: The speed is expressed as an increase in value added per capita over the range of GDP per capita, PPP, from $3,000 to $4,500 divided by the number of years taken. This range was selected because the countries overlap in this range in UNIDO (2012a).Source: UNIDO estimate based on CIC (2009) and UNIDO (2012a).
Table 3.1 Speed of manufacturing development, the Republic of Korea, Malaysia and Sri Lanka
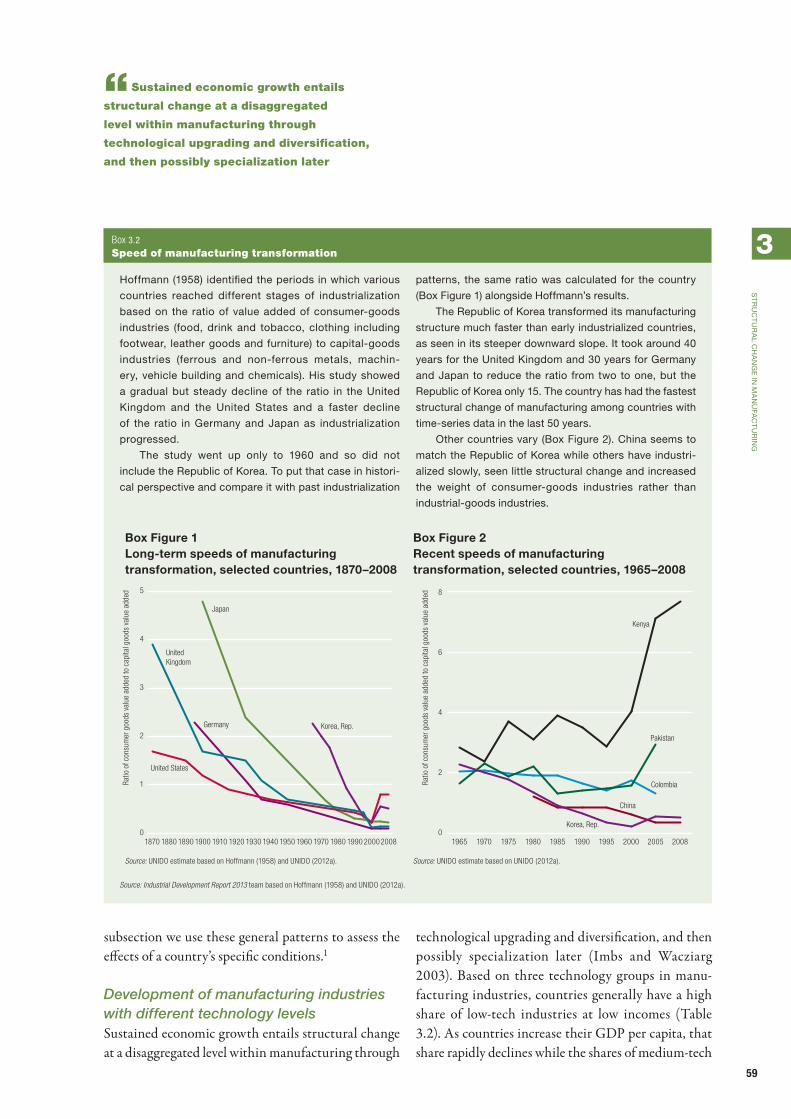
59
st
ru
Ct
ur
al C
ha
nG
e In
Ma
nu
FaC
tu
rIn
G
3
“Sustained economic growth entails
structural change at a disaggregated
level within manufacturing through
technological upgrading and diversification,
and then possibly specialization later
subsection we use these general patterns to assess the effects of a country’s specific conditions.1
Development of manufacturing industries with different technology levelsSustained economic growth entails structural change at a disaggregated level within manufacturing through
technological upgrading and diversification, and then possibly specialization later (Imbs and Wacziarg 2003). Based on three technology groups in manu-facturing industries, countries generally have a high share of low-tech industries at low incomes (Table 3.2). As countries increase their GDP per capita, that share rapidly declines while the shares of medium-tech
hoffmann (1958) identified the periods in which various
countries reached different stages of industrialization
based on the ratio of value added of consumer-goods
industries (food, drink and tobacco, clothing including
footwear, leather goods and furniture) to capital-goods
industries (ferrous and non-ferrous metals, machin-
ery, vehicle building and chemicals). his study showed
a gradual but steady decline of the ratio in the united
Kingdom and the united states and a faster decline
of the ratio in Germany and Japan as industrialization
progressed.
the study went up only to 1960 and so did not
include the republic of Korea. to put that case in histori-
cal perspective and compare it with past industrialization
patterns, the same ratio was calculated for the country
(Box Figure 1) alongside hoffmann’s results.
the republic of Korea transformed its manufacturing
structure much faster than early industrialized countries,
as seen in its steeper downward slope. It took around 40
years for the united Kingdom and 30 years for Germany
and Japan to reduce the ratio from two to one, but the
republic of Korea only 15. the country has had the fastest
structural change of manufacturing among countries with
time-series data in the last 50 years.
other countries vary (Box Figure 2). China seems to
match the republic of Korea while others have industri-
alized slowly, seen little structural change and increased
the weight of consumer-goods industries rather than
industrial- goods industries.
Box Figure 1 Long-term speeds of manufacturing transformation, selected countries, 1870–2008
Box Figure 2 Recent speeds of manufacturing transformation, selected countries, 1965–2008
200820001990198019701960195019401930192019101900189018801870 2008200520001995199019851980197519701965
Ratio
of c
onsu
mer
goo
ds v
alue
add
ed to
cap
ital g
oods
val
ue a
dded
United States
Korea, Rep.
China
Pakistan
Kenya
Colombia
United Kingdom
Korea, Rep.Germany
Japan
Ratio
of c
onsu
mer
goo
ds v
alue
add
ed to
cap
ital g
oods
val
ue a
dded
0
1
2
3
4
5
0
2
4
6
8
Source: UNIDO estimate based on Hoffmann (1958) and UNIDO (2012a). Source: UNIDO estimate based on UNIDO (2012a).
Source: Industrial Development Report 2013 team based on Hoffmann (1958) and UNIDO (2012a).
Box 3.2 Speed of manufacturing transformation

60
st
ru
Ct
ur
al C
ha
nG
e In
Ma
nu
FaC
tu
rIn
G
3
“As countries increase their GDP per
capita, the share of low-tech industries at low
incomes rapidly declines while the shares of
medium-tech and high-tech groups increase
(mostly capital-intensive, resource-processing indus-try) and high-tech (mostly capital- and technology-intensive industry) groups increase (Figure 3.3). Although the medium-tech industries have a higher value-added share than high-tech industries at low income, the share of the former increases only slowly and hits the peak before reaching $20,000 GDP per capita. Then, only high-tech industries increase the value-added share at the expense of the shares of low- and medium-tech industries.
To investigate the details of manufacturing develop-ment underlying the above structural change, the fol-lowing analysis looks at the changes in the levels of the development of 10 out of 18 manufacturing industries at
the two-digit level of International Standard Industrial Classification Revision 3 (Box 3.3). For this analysis, value added per capita and employment–population ratio are used because, unlike shares, they are not influ-enced by the ups and downs of other industries and so are better able to expose industrial characteristics (such as growth rates).2 The 10 industries are representative of manufacturing as a whole, comprising industries of different technological content and stages of develop-ment. The 10 industries usually account for more than 75 percent of value added and employment in manufac-turing. They include three low-tech, three medium-tech and four high-tech industries with different degrees of labour intensity (Annex 2).
International Standard Industrial Classification full description
Abbreviation used in this report
International Standard Industrial
Classification code Revision 3
Technology group
Food and beverages Food and beverages 15 Low tech
Tobacco products Tobacco 16 Low tech
Textiles Textiles 17 Low tech
Wearing apparel, fur, leather products and footwear Wearing apparel 18 and 19 Low tech
Wood products (excluding furniture) Wood products 20 Low tech
Paper and paper products Paper 21 Low tech
Printing and publishing Printing and publishing 22 Low tech
Furniture; manufacturing, not elsewhere classified Furniture, not elsewhere classified
36 Low tech
Coke, refined petroleum products and nuclear fuel Coke and refined petroleum 23 Medium tech
Rubber and plastic products Rubber and plastic 25 Medium tech
Non-metallic mineral products Non-metallic minerals 26 Medium tech
Basic metals Basic metals 27 Medium tech
Fabricated metal products Fabricated metals 28 Medium tech
Chemicals and chemical products Chemicals 24 High tech
Machinery and equipment, not elsewhere classified; office, accounting and computing machinery
Machinery and equipment 29 and 30 High tech
Electrical machinery and apparatus; radio, television and communication equipment
Electrical machinery and apparatus
31 and 32 High tech
Medical, precision and optical instruments Precision instruments 33 High tech
Motor vehicles, trailers, semi-trailers and other transport equipment
Motor vehicles 34 and 35 High tech
Note: Shaded rows represent the manufacturing industries analysed. The three groups follow the technology classification of the Organisation for Economic Co-operation and Development (OECD) based on research and development (R&D) intensity relative to value added and gross production statistics. The OECD classifies manufacturing industries into four categories of high-tech, medium-high-tech, medium-low-tech and low-tech industries. In this report high-tech and medium-high-tech industries are combined and called high-tech industries, and medium-low-tech industry is called medium-tech industry. The classification reflects the average R&D intensity of industries, so there might be products of different R&D intensity in each technology category.Source: UNIDO estimate based on UNIDO (2012a).
Table 3.2 Classification of manufacturing industries by technology group

61
st
ru
Ct
ur
al C
ha
nG
e In
Ma
nu
FaC
tu
rIn
G
3
“Manufacturing employment does not
show continuous growth: it displays a rapid
surge at low and lower middle incomes, but
at high incomes no manufacturing industries
are likely to sustain employment growth
The following estimated patterns show how man-ufacturing industries with different levels of technol-ogy emerge as countries’ GDP per capita increases. The patterns for value added and for manufacturing employment differ (Figures 3.4 and 3.5). For value added, many manufacturing industries continue
to grow at high incomes, and some accelerate their growth. But manufacturing employment does not show continuous growth: it displays a rapid surge at low and lower middle incomes, but at high incomes no manufacturing industries are likely to sustain employ-ment growth.
Figure 3.3 Changes in the shares in manufacturing value added by income and technology group, 1963–2007
0 10,000 20,000 30,000 40,0000.00
0.25
0.50
0.75
Shar
e in
tota
l val
ue a
dded
(per
cent
)
GDP per capita, 2005 PPP$
Low technology
Low andlower middle income
Upper middle income
HIgh income
Medium technology
High technology
Source: UNIDO estimate based on CIC (2009) and UNIDO (2012a).
ManufacturingMost figures in this chapter have been produced based
on the unIdo Industry statistics database at the Inter-
national standard Industrial Classification (IsIC) revision
3 for the estimations of manufacturing development pat-
terns (unIdo 2012a). the dataset has unbalanced data on
employment and value added for 23 manufacturing indus-
tries at the IsIC two-digit level for 1963–2007.
the 23 industries were consolidated into 18 industries
because many countries reported some of the industries
together – often grouping IsIC 18 and 19; 29 and 30; 31
and 32; and 34 and 35. to make the structural change
analysis consistent and reliable, these pairs were com-
bined and indicated by the first industry of each pair (such
as 18 for the combined 18 and 19) for the combined indus-
try throughout this chapter.
the maximum number of 74 countries for value added
and 95 countries for employment are included for the
estimations. the Index of Industrial Production is used to
approximate real value added per capita, and fixed effects
are applied to the regression analysis.
Income groupsthe income levels that divide countries into low and lower
middle, upper middle and high income are based on the
definition in Chapter 1.
Source: Industrial Development Report 2013 Team.
Box 3.3 A note on data
Figure 3.4 Changes in value added per capita by income and manufacturing industry, 1963–2007
0 10,000 20,000 30,000 40,0000
200
400
600
Valu
e ad
ded
per c
apita
, $
GDP per capita, 2005 PPP$
Low andlower middle income
Upper middle income
HIgh income
Textiles
Non-metallic minerals
Fabricated metals
Motor vehiclesBasic metals
Machinery and equipment
Electricalmachinery
and apparatus
Chemicals
Food and beverages
Wearing apparel
Note: Pooled data for 74 countries.Source: UNIDO estimate based on CIC (2009) and UNIDO (2012a).
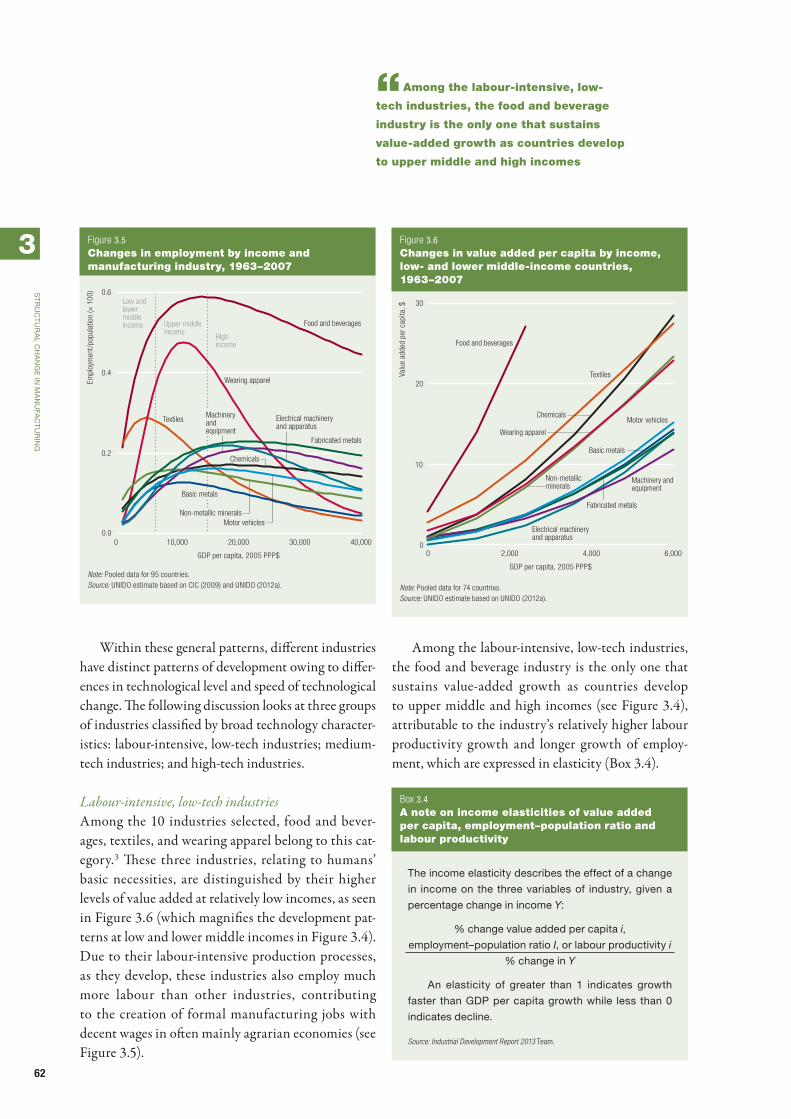
62
st
ru
Ct
ur
al C
ha
nG
e In
Ma
nu
FaC
tu
rIn
G
3
“Among the labour-intensive, low-
tech industries, the food and beverage
industry is the only one that sustains
value-added growth as countries develop
to upper middle and high incomes
Within these general patterns, different industries have distinct patterns of development owing to differ-ences in technological level and speed of technological change. The following discussion looks at three groups of industries classified by broad technology character-istics: labour-intensive, low-tech industries; medium-tech industries; and high-tech industries.
Labour-intensive, low-tech industriesAmong the 10 industries selected, food and bever-ages, textiles, and wearing apparel belong to this cat-egory.3 These three industries, relating to humans’ basic necessities, are distinguished by their higher levels of value added at relatively low incomes, as seen in Figure 3.6 (which magnifies the development pat-terns at low and lower middle incomes in Figure 3.4). Due to their labour-intensive production processes, as they develop, these industries also employ much more labour than other industries, contributing to the creation of formal manufacturing jobs with decent wages in often mainly agrarian economies (see Figure 3.5).
Among the labour-intensive, low-tech industries, the food and beverage industry is the only one that sustains value-added growth as countries develop to upper middle and high incomes (see Figure 3.4), attributable to the industry’s relatively higher labour productivity growth and longer growth of employ-ment, which are expressed in elasticity (Box 3.4).
Figure 3.5 Changes in employment by income and manufacturing industry, 1963–2007
0 10,000 20,000 30,000 40,0000.0
0.2
0.4
0.6
Empl
oym
ent/
popu
latio
n (×
100
)
GDP per capita, 2005 PPP$
Wearing apparel
Textiles
Fabricated metals
Electrical machineryand apparatus
Food and beverages
Chemicals
Low andlower middle income Upper middle
incomeHIgh income
Motor vehicles
Machineryandequipment
Basic metals
Non-metallic minerals
Note: Pooled data for 95 countries.Source: UNIDO estimate based on CIC (2009) and UNIDO (2012a).
Figure 3.6 Changes in value added per capita by income, low- and lower middle-income countries, 1963–2007
0 2,000 4,000 6,0000
10
20
30
Valu
e ad
ded
per c
apita
, $
GDP per capita, 2005 PPP$
Wearing apparel
Non-metallicminerals
Textiles
Fabricated metals
Electrical machineryand apparatus
Food and beverages
Chemicals
Basic metals
Motor vehicles
Machinery andequipment
Note: Pooled data for 74 countries.Source: UNIDO estimate based on UNIDO (2012a).
the income elasticity describes the effect of a change
in income on the three variables of industry, given a
percentage change in income Y:
% change value added per capita i,
employment–population ratio I, or labour productivity i
% change in Y
an elasticity of greater than 1 indicates growth
faster than GdP per capita growth while less than 0
indicates decline.
Source: Industrial Development Report 2013 Team.
Box 3.4 A note on income elasticities of value added per capita, employment–population ratio and labour productivity

63
st
ru
Ct
ur
al C
ha
nG
e In
Ma
nu
FaC
tu
rIn
G
3
“Labour-intensive industries seem to
be crucial in sustaining employment at
low incomes and are the main reason for
manufacturing’s overall role in employment
generation at early stages of structural change
The food and beverage industry retains a decent level of labour productivity growth and shows a slower decline in employment than textiles and wear-ing apparel, helping maintain high value added and employment across all incomes (Figure 3.7).
Textiles and wearing apparel both reduce value added and employment as countries move into upper middle and high incomes, but the industries differ in their ability to substitute capital for labour. The textile industry can prolong the growth of value added after it starts reducing employment due to its greater ability to substitute capital for labour, as seen in a higher elastic-ity of labour productivity than in wearing apparel (see Figure 3.7). In contrast, low-wage labour is the key fac-tor input for production in wearing apparel, where the growth rates of employment and value added decline almost in parallel, indicating limited room for the industry to substitute capital for labour. This charac-teristic implies that once countries lose the labour-cost
advantage, they tend to lose competitiveness in wear-ing apparel quite fast, though labour costs are not always the sole determinant of cost competitiveness (see Box 4.1 in Chapter 4).
Labour-intensive industries thus seem to be cru-cial in sustaining employment at low incomes and are the main reason for manufacturing’s overall role in employment generation at early stages of structural change. As the population begins shifting from agri-culture, setting up labour-intensive industries may be the only option to absorb productively the many people seeking jobs. There are also opportunities for capital accumulation, and these are largely restricted to food and beverages and to textiles.
Labour-intensive, low-tech industries provide significant opportunities for entry in low- and lower middle-income countries. African economies, as well as some Asian economies, can use these industries as a stepping stone towards industrialization. In addition
Figure 3.7 Growth elasticities of value added, employment and labour productivity by income, low-tech industries, 1963–2007
Gro
wth
ela
stic
ity
Food and beverages
Gro
wth
ela
stic
ity
Wearing apparel
Textiles
Gro
wth
ela
stic
ity
Value added
Value added
Value added
Employment
Employment
Employment
Labour productivity
Labour productivity
Labour productivity
–1.0
0.0
1.0
2.0
–3.0
–1.0
–2.0
0.0
1.0
2.0
–4.0
–2.0
0.0
2.0
0 10,000 20,000 30,000 40,000 0 10,000 20,000 30,000 40,000
GDP per capita, 2005 PPP$
GDP per capita, 2005 PPP$ GDP per capita, 2005 PPP$
0 10,000 20,000 30,000 40,000
Source: UNIDO estimate based on CIC (2009) and UNIDO (2012a).
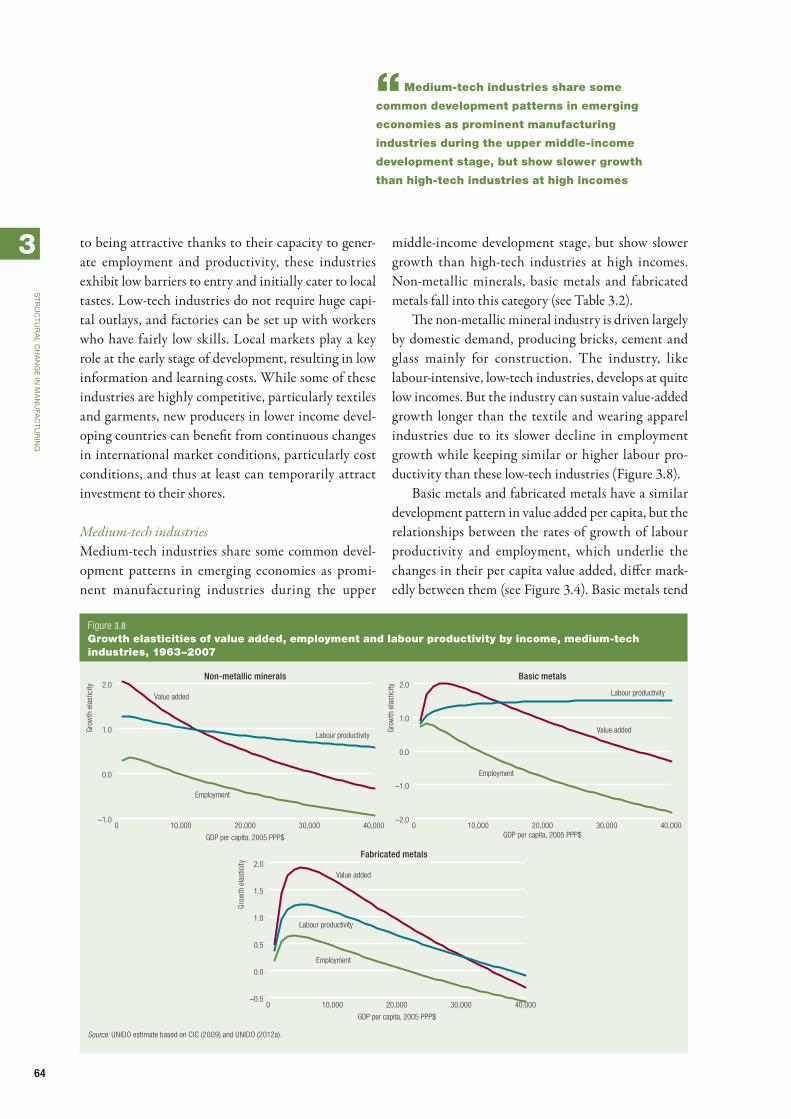
64
st
ru
Ct
ur
al C
ha
nG
e In
Ma
nu
FaC
tu
rIn
G
3
“Medium-tech industries share some
common development patterns in emerging
economies as prominent manufacturing
industries during the upper middle-income
development stage, but show slower growth
than high-tech industries at high incomes
to being attractive thanks to their capacity to gener-ate employment and productivity, these industries exhibit low barriers to entry and initially cater to local tastes. Low-tech industries do not require huge capi-tal outlays, and factories can be set up with workers who have fairly low skills. Local markets play a key role at the early stage of development, resulting in low information and learning costs. While some of these industries are highly competitive, particularly textiles and garments, new producers in lower income devel-oping countries can benefit from continuous changes in international market conditions, particularly cost conditions, and thus at least can temporarily attract investment to their shores.
Medium-tech industriesMedium-tech industries share some common devel-opment patterns in emerging economies as promi-nent manufacturing industries during the upper
middle-income development stage, but show slower growth than high-tech industries at high incomes. Non-metallic minerals, basic metals and fabricated metals fall into this category (see Table 3.2).
The non-metallic mineral industry is driven largely by domestic demand, producing bricks, cement and glass mainly for construction. The industry, like labour-intensive, low-tech industries, develops at quite low incomes. But the industry can sustain value-added growth longer than the textile and wearing apparel industries due to its slower decline in employment growth while keeping similar or higher labour pro-ductivity than these low-tech industries (Figure 3.8).
Basic metals and fabricated metals have a similar development pattern in value added per capita, but the relationships between the rates of growth of labour productivity and employment, which underlie the changes in their per capita value added, differ mark-edly between them (see Figure 3.4). Basic metals tend
Figure 3.8 Growth elasticities of value added, employment and labour productivity by income, medium-tech industries, 1963–2007
Gro
wth
ela
stic
ity
Non-metallic minerals
Gro
wth
ela
stic
ity
Fabricated metals
Basic metals
Gro
wth
ela
stic
ity
Value added
Value added
Value added
Employment
Employment
Employment
Labour productivity
Labour productivity
Labour productivity
–1.0
0.0
1.0
2.0
–2.0
–1.0
0.0
1.0
2.0
0 10,000 20,000 30,000 40,000–0.5
0.0
0.5
1.0
1.5
2.0
0 10,000 20,000 30,000 40,000 0 10,000 20,000 30,000 40,000
GDP per capita, 2005 PPP$
GDP per capita, 2005 PPP$ GDP per capita, 2005 PPP$
Source: UNIDO estimate based on CIC (2009) and UNIDO (2012a).
65
st
ru
Ct
ur
al C
ha
nG
e In
Ma
nu
FaC
tu
rIn
G
3
“High-tech industries emerge at a fairly
late stage of development and make a major
contribution to manufacturing value added, usually
after countries reach an upper middle-income level
to see a fairly rapid decline in employment growth, but the rapid increase in labour productivity helps sustain the growth of value added (see Figure 3.8). The fabri-cated metal industry decreases both the rate of labour productivity and the employment growth rate, but the slower decline of the latter prolongs the growth of industry’s value added (see Figure 3.8).
Thus, while both industries produce metals, the basic metal industry as it develops employs a much more capital-intensive production process, which leads to higher labour productivity. The fabricated metal industry seems to be located further downstream in the production value chain linking material and prod-uct producers, which involves more customization and less-automated production processes.
Medium-tech industries offer investment poten-tial for middle- and upper middle-income developing countries. Although they do not generate significant employment, they are high-productivity industries and can generate resources for investment. Further, their products include steel, bricks, cement, boilers, metallic structures, hand tools and plastics, most of which are intermediate goods in high demand by more advanced industries. Global markets for industrial inputs are growing fast, underpinned by the demand of emerging industrial powerhouses in East Asia, so these industries can also become important sources of foreign exchange.
High-tech industriesChemical products, machinery and equipment, elec-trical machinery and apparatus, and motor vehicles are classified as high-tech industries.4 Except for chemical products, they emerge at a fairly late stage of develop-ment and make a major contribution to manufactur-ing value added, usually after countries reach an upper middle-income level. Their contribution to manufac-turing value added is much more significant than it is to manufacturing employment because any of these high-tech industries are unlikely to reach the peak employment level of the three above labour-intensive industries – food and beverages, textiles and wearing apparel. Chemicals, machinery and equipment, and
electrical machinery and apparatus are often the only ones that can sustain growth faster than GDP per cap-ita growth at high incomes.
These three industries have fast growth of value added (elasticity greater than 1) over a wide range of incomes, mainly due to their rapid increase in labour productivity growth from upper middle incomes (Figure 3.9). Electrical machinery and apparatus and to a lesser extent machinery and equipment seem to undergo considerable technological change. These industries have an extensive expansion stage at lower middle-incomes, where increasing their employment growth rates is the key contributing factor to their value added growth. Then, from the upper middle-income stage, development is based more on rising labour productivity, which sustains the fast growth of value added during the slowdown of employment growth (and later even a reduction of the labour force).
The chemicals industry seems to share the charac-teristics of domestic-oriented industries, such as food and beverages, non-metallic minerals, machinery and equipment, and electrical machinery and apparatus. Although it belongs to the high-tech group, it often emerges at an earlier stage of a country’s development due to demand for soap and basic chemical products such as colouring matters and tanning agents. Further, like the two domestic-oriented industries, it reduces its level of employment very slowly after reaching the peak. But at high incomes chemicals can increase value added rapidly through fast growth of labour pro-ductivity, similar to machinery and equipment and to electrical machinery and apparatus. These mixed char-acteristics of the chemical industry seem to reflect the fact that it includes the production of a broad range of products with diverse technological content.
Finally, the motor vehicle industry is one of a few industries that show markedly different patterns of development between large and small countries (see Figure 3.9). For this reason the development charac-teristics of the industry are introduced in the subsec-tion Country size below, which discusses the impact of that variable on manufacturing development.

66
st
ru
Ct
ur
al C
ha
nG
e In
Ma
nu
FaC
tu
rIn
G
3
“Employment growth takes place over a
narrower range of income in all manufacturing
industries compared with value-added growth
High-tech industries perform a less important role in sustaining employment at higher incomes, as they only partly compensate for job losses in labour-intensive industries. But they are critical for capital accumulation, skill development and improving the knowledge base of countries – and thus for improving productivity and, as will be seen, wages.
Changing elasticities of value added and employmentThis subsection compares changes in the elasticities of value added and employment as real GDP per capita increases across industries (Figures 3.10 and 3.11). As in the development patterns of low-tech industries, economies generally experience fast growth of value added before reaching a high income. Among the three low-tech industries here, only food and bever-ages sustain growth over a long period, though it falls slowly. In contrast, the value added of textiles and
wearing apparel declines relatively soon after the end of their fast-growth periods, and faster than in other industries.
Medium-tech industries maintain fast growth over a wider income range than low-tech industries. They also have a longer slow-growth range before decline (shown in orange in Figure 3.10), indicating that their growth rates decrease much more gradually than those of textiles and wearing apparel. Among the three tech-nology groups, high-tech industries grow fast over the longest income range. Chemicals especially, as well as machinery and equipment, and electrical machinery and apparatus, sustain their growth up to very high incomes, and are unlikely to experience a decline of value added before reaching $40,000 GDP per capita.
Employment growth takes place over a narrower range of income in all manufacturing industries com-pared with value-added growth (see Figure 3.11). Industries that start with a relatively high level of
Figure 3.9 Growth elasticities of value added, employment and labour productivity by income, high-tech industries, 1963–2007
0 10,000 20,000 30,000 40,000
Gro
wth
ela
stic
ity
Chemicals
Gro
wth
ela
stic
ity
Electrical machinery and apparatus
Machinery and equipment
Motor vehicles
Gro
wth
ela
stic
ityG
row
th e
last
icity
Value added
Value addedValue added
Value added
Employment
EmploymentEmployment
Employment
Labour productivityLabour productivity
Labour productivity
Labour productivity
–0.5
0.0
0.5
1.0
1.5
2.0
0 10,000 20,000 30,000 40,000–1.0
–0.5
0.0
0.5
1.0
2.0
0 10,000 20,000 30,000 40,000–1.0
–0.5
0.0
0.5
1.0
2.0
0 10,000 20,000 30,000 40,000–2.0
–1.0
0.0
1.0
2.0
3.0
GDP per capita, 2005 PPP$ GDP per capita, 2005 PPP$
GDP per capita, 2005 PPP$GDP per capita, 2005 PPP$
Source: UNIDO estimate based on CIC (2009) and UNIDO (2012a).

67
st
ru
Ct
ur
al C
ha
nG
e In
Ma
nu
FaC
tu
rIn
G
3
“Food and beverages and textiles are the
two major industries for both employment
and value added at low incomes. The
trajectories of the two industries diverge,
however, as countries industrialize
employment, such as food and beverages, textiles, non-metallic minerals and chemicals, see little fast growth in employment as they develop. At low incomes, wear-ing apparel can increase employment significantly, but once growth starts slowing, it does so sharply and starts declining within a short income range. Some high-tech industries, such as machinery and equip-ment and electrical machinery and apparatus, can con-tinue fast employment growth after reaching an upper middle income, but they also slow their employment growth significantly, usually before hitting $15,000 GDP per capita, and nearly all manufacturing indus-tries reduce their levels of employment at very high incomes of above $25,000 GDP per capita.
Figure 3.12 illustrates manufacturing structural change by showing how the shares of employment and value added in the manufacturing total for each industry change as country incomes rise. Food and beverages and textiles are the two major industries for
both employment and value added at low incomes. The trajectories of the two industries diverge, however, as countries industrialize. Although textiles reduce both the value added and employment shares continu-ously (as seen in the movement of arrows towards the bottom left corner), food and beverages increase the share of employment at higher incomes after an initial decline, though the value-added share keeps declining. This U shape for food and beverages is mainly due to the rapid decline and then increase in the employment share.
For long-term manufacturing development, key industries for value added, besides food and beverages, are machinery and equipment, chemicals, and electri-cal machinery and apparatus – and for employment, machinery and equipment, fabricated metals, and rub-ber and plastic. Machinery and equipment similarly increases both value-added and employment shares as countries develop, reflected by its 45-degree line.
Figure 3.11 Changes in growth rates of employment by income and manufacturing industry, 1963–2007
Motor vehicles
Electrical machineryand apparatus
Machinery and equipment
Chemicals
Fabricated metals
Basic metals
Non-metallic minerals
Wearing apparel
Textiles
Food and beverages
GDP per capita, 2005 PPP$
0 20,00010,000 30,000 40,000
Very fast growth (more than 2.0)Fast growth (1.0–1.9)Slow growth (0.0–0.9)Decline (less than 0.0)
Note: The numbers in the legend indicate elasticity. The names of the low-, medium- and high-tech industries are in red, green and blue, respectively.Source: UNIDO estimate based on CIC (2009) and UNIDO (2012a).
Figure 3.10 Changes in growth rates of value added by income and manufacturing industry, 1963–2007
Motor vehicles
Electrical machineryand apparatus
Machinery and equipment
Chemicals
Fabricated metals
Basic metals
Non-metallic minerals
Wearing apparel
Textiles
Food and beverages
GDP per capita, 2005 PPP$
0 20,00010,000 30,000 40,000
Very fast growth (more than 2.0)Fast growth (1.0–1.9)Slow growth (0.0–0.9)Decline (less than 0.0)
Note: The numbers in the legend indicate elasticity. The names of the low-, medium- and high-tech industries are in red, green and blue, respectively.Source: UNIDO estimate based on CIC (2009) and UNIDO (2012a).

68
st
ru
Ct
ur
al C
ha
nG
e In
Ma
nu
FaC
tu
rIn
G
3
“Medium-tech industries generate a
higher proportion of manufacturing-related
services jobs relative to manufacturing jobs
Employment in manufacturing-related servicesThe development impact of manufacturing is not confined to value added and employment within the
sector. This subsection examines how different service industries depend on the demands of manufactur-ing industries, and how these relationships change as countries develop.5
Labour-intensive, low-tech industries such as tex-tiles and wearing apparel generate a large number of jobs in countries at low incomes, but such employment generates fewer related services jobs (Figure 3.13). In industrialized countries textiles and wearing apparel are steadily cutting manufacturing and related ser-vices employment.
Although medium- and high-tech industries do not generate as many jobs as low-tech industries, their contributions to creating related services jobs are much higher. Figure 3.14 shows that medium-tech industries such as non-metallic minerals and basic and fabricated metals generate a higher proportion of manufacturing-related services jobs relative to manu-facturing jobs. Increases in manufacturing-related services employment often compensate (or more than compensate) for the reduction in manufacturing jobs.
Countries at high incomes could sustain fast growth of some high-tech industries, such as chemicals and motor vehicles (for large countries; Figure 3.15). These industries also make significant contributions
Figure 3.12 Changes in value added and shares in employment by income and manufacturing industry, 1963–2007
0
2
5
10
20
Shar
e of
em
ploy
men
t in
tota
l man
ufac
turin
g em
ploy
men
t (pe
rcen
t)
Share of value added in total manufacturing value added (percent)
–2 0 2 5 10 20
Wearing apparel
Textiles
Non-metallicminerals
Fabricated metals
Electricalmachinery
and apparatus
Chemicals
Basic metals
Machinery andequipment
Food andbeverages
Motor vehicles
Source: UNIDO estimate based on UNIDO (2012a).
Figure 3.13 Number of jobs required for the production and delivery of textiles and textile products, 1995–2009
Empl
oym
ent h
eadc
ount
(mill
ions
)
Financial intermediationOther servicesBusiness servicesTransportWholesaleManufacturing
0
20
40
60Industrialized countriesIndustrializing countries
1995 2000 2005 20091995 2000 2005 20090
4
8
12
Note: Manufacturing employment here comprises only formal employment.Source: UNIDO estimate based on Timmer (2012).

69
st
ru
Ct
ur
al C
ha
nG
e In
Ma
nu
FaC
tu
rIn
G
3
“Increases in manufacturing-related
services employment often compensate
(or more than compensate) for the
reduction in manufacturing jobs
to manufacturing-related services employment, espe-cially business services.
Thus, if we take employment in manufacturing-related services into account, manufacturing’s con-tribution to job creation is more sustained than Figure 3.5 suggests. Although the decline in labour-intensive, low-tech industries reduces manufacturing
jobs as countries reach high incomes, medium- and high-tech industries, especially those sustaining value-added growth at high incomes, create a relatively high proportion of jobs in manufacturing-related services. These contributions are important not only for mak-ing up for declining manufacturing jobs but also for generating modern service jobs, which are likely to
Figure 3.14 Number of jobs required for the production and delivery of medium-tech industry products in industrialized countries, 1995–2009
Empl
oym
ent h
eadc
ount
(mill
ions
)
0
10
5
15
20Rubber and plasticBasic and fabricated metals
1995 2000 2005 20091995 2000 2005 2009
Financial intermediationOther servicesBusiness servicesTransportWholesaleManufacturing
0
2
6
4
8
Note: Manufacturing employment here comprises only formal employment.Source: UNIDO estimate based on Timmer (2012).
Figure 3.15 Number of jobs required for the production and delivery of high-tech industry products in industrialized countries, 1995–2009
Empl
oym
ent h
eadc
ount
(mill
ions
)
Financial intermediationOther servicesBusiness servicesTransportWholesaleManufacturing
0
10
5
15Motor vehiclesChemicals
1995 2000 2005 20091995 2000 2005 20090
5
10
15
Note: Manufacturing employment here comprises only formal employment.Source: UNIDO estimate based on Timmer (2012).

70
st
ru
Ct
ur
al C
ha
nG
e In
Ma
nu
FaC
tu
rIn
G
3
“Manufacturing structural change
offers employment opportunities for high-
income countries as they transit from
high-tech manufacturing production to
manufacturing-related services
play a crucial role in linking high-tech manufactur-ing industries with innovative service activities that support growth of increasingly service-oriented high-income countries.
Beyond service employment directly dependent on manufacturing production, employment is generated throughout the production chain due to backward linkages and multiplier effects of production. If these full production effects are included, manufacturing-related employment increases a further 10–30 percent.
In short, manufacturing structural change offers employment opportunities for high-income countries as they transit from high-tech manufacturing produc-tion to manufacturing-related services. Developed countries aiming to increase value added while gener-ating employment may thus find it optimal to focus on innovation and marketing, if they are not doing so already, to compensate partly or fully for the loss of such production jobs.
Effects of time, demographics and geography on manufacturing development
Changing characteristics in individual manufacturing industries over timeThe broad pattern of industrialization by income (as in Figure 3.3) is unlikely to change drastically in future
and if at all only slowly, taking historical studies as evi-dence (see, for example, Chenery and Syrquin 1975, Clark 1957, Hoffmann 1958, and Kuznets 1966). But individual manufacturing industries do change their characteristics over the years.
For example, the value added pattern of the tex-tile industry has shifted downward over the years, in contrast to the employment pattern of the rub-ber and plastic industry for small countries (Figure 3.16).6 This means that rubber and plastics can generate more employment for a country at the same income as 10 years previously. This shift adds a dynamic element to the analysis, allowing us to assess how technology, demand and other factors that evolve over time change the course of manufac-turing development.
To identify the emerging characteristics of the 18 manufacturing industries in Table 3.2, the trends of both the levels of value added and employment have been studied for each industry since 1980. The results are categorized under five headings (Table 3.3).
The results show that a large number of industries are increasing their capital intensity.7 The seven indus-tries intensifying capital use have added value with-out increasing or even while decreasing employment. This is an industry-wide trend, so it characterizes the situation of those industries across countries at dif-ferent incomes. The results seem to point to rising
Figure 3.16 Shifts in value added and employment development patterns in two industries by income, selected years, 1971–2009
Valu
e ad
ded
per c
apita
, $
Textiles Rubber and plastics
Empl
oym
ent/
popu
latio
n (×
100
)
0.0
0.5
1.0
1.5
2.0
0 10,000 20,000 30,000 40,000 0 10,000 20,000 30,000 40,0000
2,000
4,000
6,000
8,000
1971–1980 1991–20001981–1990 2001–2009
GDP per capita, 2005 PPP$ GDP per capita, 2005 PPP$
Source: UNIDO estimate based on CIC (2009) and UNIDO (2012a).

71
st
ru
Ct
ur
al C
ha
nG
e In
Ma
nu
FaC
tu
rIn
G
3
“Many medium- and high-tech industries
have become capital intensive since the 1980s,
increasing value added without adding much labour
mechanization and standardization of production processes in many medium- and high-tech industries.
Only two industries, rubber and plastics and fur-niture, are increasing employment (the former, value added as well). Tobacco and textiles are declining industries as they have been reducing value added and employment, though this does not necessarily imply that their output volume or demand for their prod-ucts has been decreasing in absolute terms, as produc-tion volume may still rise alongside a declining price trend.
Finally, food and beverages have been remark-ably stable (and in fact is one of the key industries for both value added and employment in countries across different incomes and different geographical and demographic conditions). This stability no doubt stems from the nature of its products, which serve the basic needs of human beings in differentiated national markets.
Thus many medium- and high-tech industries have become capital intensive since the 1980s, increasing value added without adding much labour.
Changes in manufacturing structure over timeAs individual manufacturing industries change their characteristics over the years, the industries’ relative importance and the structure of manufacturing also evolves. This subsection discusses how the devel-opment potential of manufacturing industries has changed since the 1960s.8
In the 1960s and 2000s in value-added terms, high-tech industries developed more than medium-tech industries, which reached higher levels of devel-opment than low-tech textiles and wearing apparel (Figure 3.17). Divergence tends to occur in the upper middle-income stage when high-, medium- and low-tech industries start experiencing faster, slower and negative growth, respectively. But in the 2000s the development potential of high-tech industries is much higher than in the 1960s, while there are not notice-able differences in the development patterns of low-tech and medium-tech industries. Among high-tech industries, chemicals and electrical machinery and apparatus have greatly increased their development potential relative to other industries, by increasing per capita value added and accelerating their growth rates.
Employment patterns have changed less than value added between the two periods (Figure 3.18). Among low-tech industries, employment in textiles has been markedly lower in recent years while food and bev-erages and wearing apparel slightly increased and decreased, respectively, their potential for job creation. Another difference in employment patterns between the 1960s and the 2000s is the slower decline of employment in high-tech industries at high incomes: they now have greater ability to keep employment over a wider range of incomes.
Effects of country size, population density and natural resource endowmentIncome is usually the most influential determinant of manufacturing structure, as seen, but countries with different geographical and demographic conditions, history and policies – country-specific attributes – may pull away from its influence somewhat. For exam-ple, the endowment of abundant natural resources
Emerging trend Industry
Rising Rubber and plastic
Declining TobaccoTextiles
Intensifying capital use PaperChemicalsNon-metallic mineralsBasic metalsFabricated metalsElectrical machinery and
apparatusMotor vehicles
Intensifying labour use Furniture
Stable Food and beverages
Note: When value added and employment show a statistically significant increase in all three decades since 1980, the industry is classified as “Rising”. When an industry constantly sees declines in both variables, it is “Declining”. If an industry increases value added while decreasing (or at least not increasing) employment, it is “Intensifying capital use”. When there is evidence of an increase in employment and a decrease or no change in value added, it is “Intensifying labour use”. If there is no significant change in value added and employment, it is “Stable”. Industries exhibiting ambiguous trends are excluded; they are wearing apparel, wood products, printing and publishing, coke and refined petroleum, machinery and equipment, and precision instruments.Source: UNIDO estimate based on CIC (2009) and UNIDO (2012a).
Table 3.3 Emerging trends of manufacturing industries since 1980

72
st
ru
Ct
ur
al C
ha
nG
e In
Ma
nu
FaC
tu
rIn
G
3
“A country’s population size tends
to have overarching influence on
economic structural change
normally works against manufacturing development, holding other conditions constant (Haraguchi and Rezonja 2011; UNIDO 2012c).
This subsection looks at how demographic conditions – over which the government does not have much control in the short to medium term
Figure 3.17 Changes in value added by income and manufacturing industry, selected years
0 10,000 20,000 30,000 40,0000
200
400
600
Machinery andequipment
Low andlower middle income
Upper middle income
HIgh income
Valu
e ad
ded
per c
apita
, $
GDP per capita, 2005 PPP$
Wearing apparelTextiles
Chemicals
Basic metals
Fabricated metals
Non-metallic minerals
Motorvehicles
Food and beverages
Electricalmachinery and
apparatus
Low andlower middle income
Upper middle income
HIgh income
0 10,000 20,000 30,000 40,0000
200
400
600
Valu
e ad
ded
per c
apita
, $
GDP per capita, 2005 PPP$
Wearing apparelTextiles
Non-metallic minerals
Fabricated metals
Electrical machineryand apparatus
Chemicals
Basic metals
Machinery andequipment
Food and beverages
Motor vehicles
1960s 2000s
Source: UNIDO estimate based on CIC (2009) and UNIDO (2012a).
Figure 3.18 Changes in employment by income and manufacturing industry, selected years
0 10,000 20,000 30,000 40,0000.0
0.2
0.4
0.6
Empl
oym
ent/
popu
latio
n (×
100
)
GDP per capita, 2005 PPP$
Wearing apparel
Textiles
Food and beverages
Chemicals
Low andlower middle income
Upper middle income
HIgh income
Basic metals
Motor vehicles
Fabricated metals
Electrical machineryand apparatus
Non-metallic minerals
Machinery andequipment
0 10,000 20,000 30,000 40,0000.0
0.2
0.4
0.6
Empl
oym
ent/
popu
latio
n (×
100
)
GDP per capita, 2005 PPP$
Food and beverages
Chemicals
Low andlower middle income
Upper middle income
HIgh income
Basic metals
Motor vehiclesNon-metallic minerals
Machinery andequipment
Textiles
Wearing apparel
Fabricated metals
Electrical machineryand apparatus
1960s 2000s
Source: UNIDO estimate based on CIC (2009) and UNIDO (2012a).

73
st
ru
Ct
ur
al C
ha
nG
e In
Ma
nu
FaC
tu
rIn
G
3
“Exports of resource commodities often lead
to currency appreciation and make tradable
manufacturing products less competitive
– and geographical conditions affect manufacturing structure. It shows that a country’s population size – based on the maximum likelihood test for identifying structural breaks, large countries are defined as hav-ing more than 20 million people, and small countries fewer than that – tends to have overarching influence on economic structural change (Chenery and Taylor 1968).
Densely populated countries, owing to a nega-tive association with availability of mineral wealth, arable land and other natural endowments per head, are likely to specialize more in manufacturing and in less resource-intensive manufacturing industries. Such countries may also draw advantages from lower transport and coordination costs (Keesing and Sherk 1971). Exports of resource commodities often lead to currency appreciation and make tradable manufactur-ing products less competitive.
Country sizeChapter 1 showed that a larger population is generally conducive to manufacturing development. Figure 3.19
confirms that small countries generally have lower value added in manufacturing than large countries. There are also differences in structural change within manufacturing between large and small countries. Large countries, at higher incomes, tend to have a divergent pattern of thriving and other industries, while in small countries, growth in most manufactur-ing industries slows at higher incomes. By industry, small countries are likely to develop food and bever-ages much earlier than large countries, but that indus-try’s growth in those countries is not as sustainable as in large countries: growth in food and beverages starts slowing at around $10,000 GDP per capita and con-tinues to slow, or even decline, at higher incomes.
Another difference is in motor vehicles. In large countries it is one of the key industries leading indus-trialization from an upper middle-income stage. (Other key industries are electrical machinery and apparatus, chemicals, machinery and equipment, and food and beverages.) In small countries the industry’s development prospects are limited. The difference may stem from a lack of the economies of
Figure 3.19 Changes in value added by income and manufacturing industry, 1963–2007
Small countries
Low andlower middle income
Upper middle income
HIgh income
0 10,000 20,000 30,000 40,0000
200
400
600
Valu
e ad
ded
per c
apita
, $
GDP per capita, 2005 PPP$
Non-metallic minerals
Basic metals
Fabricated metals
Textiles
Electrical machinery and apparatus
Chemicals
Food andbeverages
Machinery and equipment
Motor vehicles
Wearing apparel
0 10,000 20,000 30,000 40,0000
200
400
600
Machinery andequipment
Low andlower middle income
Upper middle income
HIgh income
Valu
e ad
ded
per c
apita
, $
GDP per capita, 2005 PPP$
Wearing apparelTextiles
Chemicals
Basic metals
Fabricated metals
Non-metallic minerals
Motor vehicles
Electrical machineryand apparatus
Food and beverages
Large countries
Source: UNIDO estimate based on CIC (2009) and UNIDO (2012a).
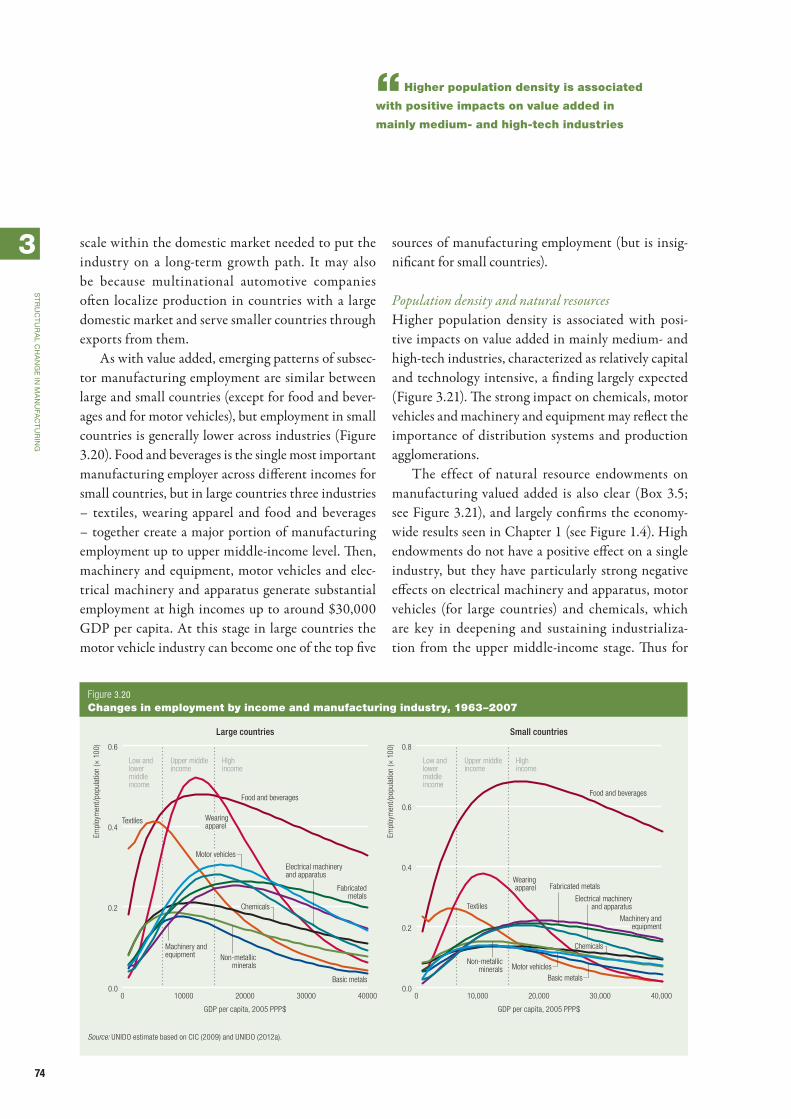
74
st
ru
Ct
ur
al C
ha
nG
e In
Ma
nu
FaC
tu
rIn
G
3
“Higher population density is associated
with positive impacts on value added in
mainly medium- and high-tech industries
scale within the domestic market needed to put the industry on a long-term growth path. It may also be because multinational automotive companies often localize production in countries with a large domestic market and serve smaller countries through exports from them.
As with value added, emerging patterns of subsec-tor manufacturing employment are similar between large and small countries (except for food and bever-ages and for motor vehicles), but employment in small countries is generally lower across industries (Figure 3.20). Food and beverages is the single most important manufacturing employer across different incomes for small countries, but in large countries three industries – textiles, wearing apparel and food and beverages – together create a major portion of manufacturing employment up to upper middle-income level. Then, machinery and equipment, motor vehicles and elec-trical machinery and apparatus generate substantial employment at high incomes up to around $30,000 GDP per capita. At this stage in large countries the motor vehicle industry can become one of the top five
sources of manufacturing employment (but is insig-nificant for small countries).
Population density and natural resourcesHigher population density is associated with posi-tive impacts on value added in mainly medium- and high-tech industries, characterized as relatively capital and technology intensive, a finding largely expected (Figure 3.21). The strong impact on chemicals, motor vehicles and machinery and equipment may reflect the importance of distribution systems and production agglomerations.
The effect of natural resource endowments on manufacturing valued added is also clear (Box 3.5; see Figure 3.21), and largely confirms the economy-wide results seen in Chapter 1 (see Figure 1.4). High endowments do not have a positive effect on a single industry, but they have particularly strong negative effects on electrical machinery and apparatus, motor vehicles (for large countries) and chemicals, which are key in deepening and sustaining industrializa-tion from the upper middle-income stage. Thus for
Figure 3.20 Changes in employment by income and manufacturing industry, 1963–2007
0 10000 20000 30000 400000.0
0.2
0.4
0.6
Low andlower middle income
Upper middle income
HIgh income
0 10,000 20,000 30,000 40,0000.0
0.2
0.4
0.6
0.8
Low andlower middle income
Upper middle income
HIgh income
Empl
oym
ent/
popu
latio
n (×
100
)
GDP per capita, 2005 PPP$
Wearingapparel
Textiles
Chemicals
Non-metallicminerals
Machinery andequipment
Electrical machineryand apparatus
Food and beverages
Fabricatedmetals
Empl
oym
ent/
popu
latio
n (×
100
)
GDP per capita, 2005 PPP$
Wearingapparel
Textiles
Chemicals
Basic metals
Non-metallicminerals
Electrical machineryand apparatus
Food and beverages
Machinery andequipment
Fabricated metals
Motor vehicles
Small countriesLarge countries
Motor vehicles
Basic metals
Source: UNIDO estimate based on CIC (2009) and UNIDO (2012a).

75
st
ru
Ct
ur
al C
ha
nG
e In
Ma
nu
FaC
tu
rIn
G
3
“Natural resource endowments have positive
effects on several industries, primarily intensive
users of such resources in production
long-term manufacturing development, countries with abundant natural resources need prudent insti-tutions to manage revenues from resource exports so as to avoid undue currency appreciation and under-investment in physical and human capital.
On the employment side, population den-sity has favourable effects on many industries, but tends to undermine the development of wood prod-ucts. Natural resource endowments, unlike value added, have positive effects on several industries,
primarily intensive users of such resources in produc-tion (Figure 3.22).
Quality of manufacturing employmentManufacturing’s contribution to employment can-not be fully assessed unless one also considers qualita-tive aspects, particularly, wages and aspects of female employment.
Manufacturing generally offers a competitive wage relative to the whole economy’s average (see Figures 1.12 and 1.13 in Chapter 1). But wages between industries vary, making employment in some more favourable than others for poverty reduction, better living stand-ards and a country’s economic development in general.
An analysis of 63 countries (based on 2009 data for 47 countries, 2008 data for 13 and 2007 data for 3)
a proxy variable for natural resource endowment
was calculated as the difference between exports
and imports of crude natural resource commodities
and expressed in per capita term. the commodities
included are those categorized under sItC revision 1
in code 2 (crude materials, inedible, except fuels), 32
(coal, coke and briquettes), 331 (petroleum, crude and
partly refined) and 3411 (gas, natural).
Source: Industrial Development Report 2013 Team.
Box 3.5 Proxying natural resources
High population density
High resource endowments
Strongly positive Strongly positive
Mar
gina
l eff
ect
Posi
tive
ChemicalsMotor vehiclesNon-metallic mineralsMachinery and
equipmentRubber and plasticTobacco
Nega
tive
Wearing apparelBasic metalsPaperTextilesWood productsPrecision instrumentsFurniture, not
elsewhere classified
Coke and refined petroleum
Non-metallic mineralsPrinting and publishingRubber and plasticChemicalsFood and beveragesMotor vehiclesElectrical machinery
and apparatus
Strongly negative Strongly negative
Note: Only industries with statistically significant results at the 90 percent confidence level are shown.Source: UNIDO estimate based on UNIDO (2012a).
Figure 3.21 Effects of population density and natural resource endowments on manufacturing value added, 1963–2007
High population density
High resource endowments
Strongly positive Strongly positive
Mar
gina
l eff
ect Po
sitiv
e
Machinery and equipment
Basic metalsPrecision instrumentsPaperWearing apparelChemicalsElectrical machinery
and apparatusNon-metallic mineralsTextilesRubber and plasticFurniture, not
elsewhere classifiedMotor vehiclesCoke and refined
petroleumFabricated metalsFood and beverages
Precision instrumentsWearing apparelWood productsBasic metalsFurniture, not
elsewhere classifiedNon-metallic minerals
Nega
tive
Wood products
Rubber and plasticFabricated metalsElectrical machinery
and apparatusMachinery and
equipmentCoke and refined
petroleum
Strongly negative Strongly negative
Note: Only industries with statistically significant results at the 90 percent confidence level are shown.Source: UNIDO estimate based on UNIDO (2012a).
Figure 3.22 Effects of population density and natural resource endowments on manufacturing employment, 1963–2007
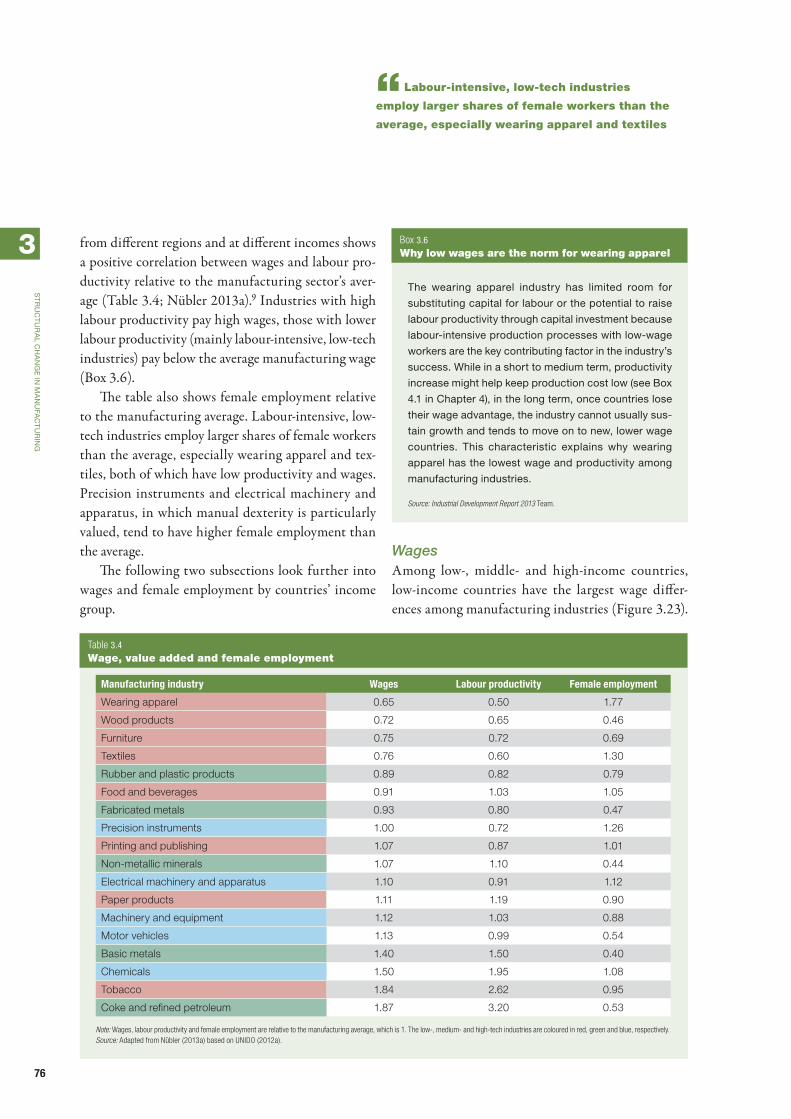
76
st
ru
Ct
ur
al C
ha
nG
e In
Ma
nu
FaC
tu
rIn
G
3
“Labour-intensive, low-tech industries
employ larger shares of female workers than the
average, especially wearing apparel and textiles
from different regions and at different incomes shows a positive correlation between wages and labour pro-ductivity relative to the manufacturing sector’s aver-age (Table 3.4; Nübler 2013a).9 Industries with high labour productivity pay high wages, those with lower labour productivity (mainly labour-intensive, low-tech industries) pay below the average manufacturing wage (Box 3.6).
The table also shows female employment relative to the manufacturing average. Labour-intensive, low-tech industries employ larger shares of female workers than the average, especially wearing apparel and tex-tiles, both of which have low productivity and wages. Precision instruments and electrical machinery and apparatus, in which manual dexterity is particularly valued, tend to have higher female employment than the average.
The following two subsections look further into wages and female employment by countries’ income group.
WagesAmong low-, middle- and high-income countries, low-income countries have the largest wage differ-ences among manufacturing industries (Figure 3.23).
Manufacturing industry Wages Labour productivity Female employment
Wearing apparel 0.65 0.50 1.77
Wood products 0.72 0.65 0.46
Furniture 0.75 0.72 0.69
Textiles 0.76 0.60 1.30
Rubber and plastic products 0.89 0.82 0.79
Food and beverages 0.91 1.03 1.05
Fabricated metals 0.93 0.80 0.47
Precision instruments 1.00 0.72 1.26
Printing and publishing 1.07 0.87 1.01
Non-metallic minerals 1.07 1.10 0.44
Electrical machinery and apparatus 1.10 0.91 1.12
Paper products 1.11 1.19 0.90
Machinery and equipment 1.12 1.03 0.88
Motor vehicles 1.13 0.99 0.54
Basic metals 1.40 1.50 0.40
Chemicals 1.50 1.95 1.08
Tobacco 1.84 2.62 0.95
Coke and refined petroleum 1.87 3.20 0.53
Note: Wages, labour productivity and female employment are relative to the manufacturing average, which is 1. The low-, medium- and high-tech industries are coloured in red, green and blue, respectively.Source: Adapted from Nübler (2013a) based on UNIDO (2012a).
Table 3.4 Wage, value added and female employment
the wearing apparel industry has limited room for
substituting capital for labour or the potential to raise
labour productivity through capital investment because
labour-intensive production processes with low-wage
workers are the key contributing factor in the industry’s
success. while in a short to medium term, productivity
increase might help keep production cost low (see Box
4.1 in Chapter 4), in the long term, once countries lose
their wage advantage, the industry cannot usually sus-
tain growth and tends to move on to new, lower wage
countries. this characteristic explains why wearing
apparel has the lowest wage and productivity among
manufacturing industries.
Source: Industrial Development Report 2013 Team.
Box 3.6 Why low wages are the norm for wearing apparel

77
st
ru
Ct
ur
al C
ha
nG
e In
Ma
nu
FaC
tu
rIn
G
3
“Low-income countries have the largest wage
differences among manufacturing industries
As textiles and wearing apparel are two of the three largest sources of manufacturing employment for these countries (food and beverages are the other – see Figure 3.5), many people are in low-wage manufac-turing employment there, which coexists with fewer
jobs paying far higher wages than the manufacturing average.
This wage structure does not necessarily work against a country’s development as long as the wages of this majority of manufacturing employment are
Figure 3.23 Wages relative to manufacturing average by income group and manufacturing industry, 2006
Low-income countries
Motor vehicles
Precision instruments
Electrical machineryand apparatus
Machinery and equipment
Chemicals
Fabricated metals
Basic metals
Non-metallic minerals
Rubber and plastic
Coke and refined petroleum
Printing and publishing
Paper
Furniture, notelsewhere classified
Wood products
Wearing apparel
Textiles
Tobacco
Food and beverages
Percent of wage level (relative to manufacturing average of 1)
0 200 400 600
Motor vehicles
Precision instruments
Electrical machineryand apparatus
Machinery and equipment
Chemicals
Fabricated metals
Basic metals
Non-metallic minerals
Rubber and plastic
Coke and refined petroleum
Printing and publishing
Paper
Furniture, notelsewhere classified
Wood products
Wearing apparel
Textiles
Tobacco
Food and beverages
Percent of wage level (relative to manufacturing average of 1)
Motor vehicles
Precision instruments
Electrical machineryand apparatus
Machinery and equipment
Chemicals
Fabricated metals
Basic metals
Non-metallic minerals
Rubber and plastic
Coke and refined petroleum
Printing and publishing
Paper
Furniture, notelsewhere classified
Wood products
Wearing apparel
Textiles
Tobacco
Food and beverages
Middle-income countries
Percent of wage level (relative to manufacturing average of 1)
High-income countries
100
0 50 100 150 200
0 100 200 300
Note: The names of the low-, medium- and high-tech industries are in red, green and blue, respectively.Source: UNIDO estimate based on UNIDO (2012a).

78
st
ru
Ct
ur
al C
ha
nG
e In
Ma
nu
FaC
tu
rIn
G
3
“As countries develop, differences
in wage levels among manufacturing
industries tend to narrow due to the rise
in labour productivity in low-wage jobs
higher than in the main sources of employment – that is, agricultural, subsistence and informal activities. This is usually the case as is often seen in the large internal migration from rural to urban areas during early industrialization. Thus the emergence of low-tech manufacturing industries and the creation of a large number of jobs that require only basic skills can help substantially reduce poverty in countries at this income.
At higher incomes the manufacturing structure shifts from labour intensity to skill intensity, and the weight of medium- and high-tech industries in manufacturing employment grows (see Figure 3.5). While medium- and high-tech industries do not cre-ate as many jobs as food and beverages, textiles and wearing apparel, their wages are usually higher than in those low-tech industries. In addition, as countries develop, differences in wage levels among manufac-turing industries tend to narrow due to the rise in labour productivity in low-wage jobs (see Figure 3.23). Manufacturing employment may thus lose headcount attractiveness as incomes rise, but the sector’s struc-tural change helps raise its wages.
Female employmentEmployment in manufacturing, as in other sectors, is not gender neutral, though data are scarce.10 Due to alleged and actual differences in physical abilities, divergent social norms and expectations for men and women, differences in access to training and education and outright discrimination, some manufacturing sec-tors are feminized, others are not.
Female employment tends to concentrate in low-tech, export-oriented and labour-intensive indus-tries (Figure 3.24). In low-income countries the female share of employment is nearly 50 percent in tobacco, textiles and electrical machinery and appa-ratus. Relative to other country-income groups, these economies often have high female labour force par-ticipation rates – though still lower than male rates – among the various manufacturing industries. This is partly because at an early stage of industrializa-tion, manufacturing industries (regardless of type)
are much more labour intensive than at later stages (Haraguchi 2012).
In low- and middle-income countries food and beverages, textiles and wearing apparel are the major sources of formal manufacturing employment. Women’s participation in that workforce may not be far behind (or is even higher than) men’s participation in textiles and wearing apparel during manufactur-ing’s incipient and take-off stages. Since women tend to allocate their incomes more to food and education than men, manufacturing development has important implications not only for improving women’s eco-nomic and social status but also for alleviating pov-erty (World Bank 2013a). But women have less access than men to high-paying jobs, which are far fewer than labour-intensive manufacturing jobs in low- and middle-income countries but which are found in some medium- and high-tech industries.
Manufacturing in industrialized countries may have been less conducive to improving women’s eco-nomic status than the earlier stage of industrializa-tion. Although higher paying jobs become more avail-able in high-tech industries in countries with high incomes, it seems that women are stuck in industries with lower compensation. Even in the high-tech industry of electrical machinery and apparatus, where women have quite high participation in the low- and middle-income stages of development, they lose out on employment to men (see Figure 3.24). This is prob-ably related to the change in the nature of the industry from relatively labour-intensive, assembly-type activi-ties to more technology- driven activities as countries develop.
Thus regardless of a country’s stage of develop-ment, women’s manufacturing employment is skewed towards labour-intensive jobs, which derive their com-petitiveness from flexibility and cost rather than skills. This tendency might help lift women’s economic sta-tus when a country has few formal manufacturing jobs because in such circumstances labour-intensive manufacturing jobs allow people without skills to get a formal job, which is often superior to the alternative jobs on wages and security.

79
st
ru
Ct
ur
al C
ha
nG
e In
Ma
nu
FaC
tu
rIn
G
3
“Women’s manufacturing employment is
skewed towards labour-intensive jobs, which derive
their competitiveness from flexibility and cost
But as industrialization advances, continuing con-centration of female employment in labour-intensive work is a concern because such work usually pays less than jobs in other manufacturing industries that become more common as countries develop.
Notes1. In this chapter the patterns of structural change
in manufacturing value added and employment are estimated based on the UNIDO Industry Statistics Database Revision 3 (UNIDO 2012a).
Figure 3.24 Female employment share by income group and manufacturing industry, 2005
Low-income countries
Motor vehicles
Precision instruments
Electrical machineryand apparatus
Machinery and equipment
Chemicals
Fabricated metals
Basic metals
Non-metallic minerals
Rubber and plastic
Coke and refined petroleum
Printing and publishing
Paper
Furniture, notelsewhere classified
Wood products
Wearing apparel
Textiles
Tobacco
Food and beverages
Share of female employment in total sector employment (percent)
Motor vehicles
Precision instruments
Electrical machineryand apparatus
Machinery and equipment
Chemicals
Fabricated metals
Basic metals
Non-metallic minerals
Rubber and plastic
Coke and refined petroleum
Printing and publishing
Paper
Furniture, notelsewhere classified
Wood products
Wearing apparel
Textiles
Tobacco
Food and beverages
Middle-income countries
Share of female employment in total sector employment (percent)
High-income countries
0 25 50 75 100
0 25 50 75 1000 25 50 75 100
Note: The names of the low-, medium- and high-tech industries are in red, green and blue, respectively.Source: UNIDO estimate based on UNIDO (2012a).

80
st
ru
Ct
ur
al C
ha
nG
e In
Ma
nu
FaC
tu
rIn
G
3 The database includes unbalanced panel data of 74 countries for value added and 95 countries for employment for 1963–2007. Employment data included in the database are mostly formal employment, including employees of firms with at least 10 employees.
2. Value added per capita of a manufacturing indus-try indicates the development level of the industry in an internationally comparable manner, as GDP per capita does for a country’s economy. For the employment–population ratio, because employ-ment divided by population tends to be a very small number, it is multiplied by 100.
3. There are low-tech industries not considered labour intensive, such as tobacco. As the three low-tech industries included in this section are all labour intensive (Annex 2), they are labelled here labour-intensive, low-tech industries.
4. The motor vehicle industry includes assembly as well as production of parts and accessories.
5. The analysis in this section uses the World Input-Output Database (Timmer 2012). Here manu-facturing-related services employment is defined as employment in the services sector, required for producing and delivering manufacturing products.
6. Value added is proxied by value added per capita and employment by the employment population ratio.
7. Here, this characterization applies to an industry-wide trend as opposed to structural change along income level. The former, industry-wide, trend points to the fact that the same industry across all countries (for example, the basic metals industry, in countries with a GDP per capita of $2,000 and $25,000) has become capital intensive over the last 30 years. The latter case, structural change along income level, differs from this section’s analysis. For example, it refers to the situation in
which the level of an industry’s capital intensity rises as income increases (this is usually the case for all industries, including furniture and wearing apparel).
8. Figure 3.17, which shows the recent pattern of manufacturing development in the 2000s, is quite similar to Figure 3.4, which is based on the data since 1963 because recent data are more avail-able than the data from earlier years in UNIDO (2012a).
9. Nübler (2013a) conducted a regression analysis on the correlation between relative wages and relative value added. The relationship was statistically sig-nificant with R2 of 0.43.
Each of the three indicators was calculated for a particular sector in a particular country by normalizing and making the average value of the entire manufacturing sector 1. Then the value of each sector was calculated as the average of the countries, for which the indicator was calculated for each sector.
10. Employment data by gender at the manufactur-ing subsector level are very limited, so the few countries for which data are available are included in each income group. For Figure 3.24, 2005 is selected to maximize the number of countries while comparing different income groups for the same year. The following countries are in each income group. Low-income countries: Eritrea, Ethiopia, Kyrgyzstan and Tanzania. Middle-income countries: Azerbaijan, Bulgaria, Ecuador, India, Indonesia, Islamic Republic of Iran, Jordan, Kazakhstan, Lithuania, Malaysia, Morocco, the Philippines and Turkey. High-income countries: Croatia, Cyprus, Japan, the Republic of Korea, Malta and Oman. Data for the same sets of coun-tries for 1998 and 2000 show structures of female employment shares in manufacturing largely sim-ilar to the 2005 figures.
81
Section 2 Drivers of manufacturing structural change and employment generation
This section first looks at what drives the structural change and industrial development analysed above. The drivers’ interactions are extremely diverse, com-plex and non-linear but what stands out is that costs, as well as technological and demand conditions, remain crucial. In principle, structural change in any sector in any country is governed by the conditions of demand and supply for products and services that interact with each other. Supply-side conditions gen-erally include wages, skills, technological change, firm size, location of production facilities and the overall business environment, which also determine indus-try’s competitiveness and organization. Demand-side conditions include demand for imports and exports as well as foreign direct investment.
This section then looks at trade. Trade openness is an opportunity – and a threat – for low-income coun-tries because it has not enhanced structural change in all regions. East Asia has become one of the most
important manufacturing production networks, aided by liberalization, while Latin America and Sub-Saharan Africa have been largely left behind. Trade is underpinned by global value chains, and although these value chains may play less of a role in the future, technological upgrading is the best long-term strategy for a country to stay in them.
Finally, one emerging driver that deserves closer analysis is the efficient use of natural resources, both to keep costs down and preserve the environment. The paradigm of continually increasing demand of finite resources must be shifted as the past abundance of rel-atively inexpensive natural resources, such as energy, water, and materials, is coming to an end. Approaches towards this “green structural change” will include adopting industries more technologically advanced and with higher labour and capital productivity. The key thus lies in decoupling natural resource use and environmental impacts from economic activity.
82
Chapter 4
Cost and supply-side structural change drivers
This chapter looks at five main supply-side drivers of structural change in manufacturing: wages, skills, technological change, industrial organization and the overall business environment. Figure 4.1 shows the main supply and external demand drivers discussed in this and the following chapters. The list is by no means exhaustive, and not all the possible combinations of interactions have been included, due to a limited availability of evidence, but some of the key drivers of structural change and their interrelationships are dis-cussed here.
Wages, sometimes considered the most important factor for the supply of manufactured goods, deter-mine the cost of employment and through this the competitiveness of the industry. They also feed back into aggregate demand for manufactured products on the domestic market. Neoclassical theory sug-gests that, other things equal, rising wages cause indi-vidual producers to limit or cut back on employment because they will tend to replace labour by investing in equipment and technology or ceasing production of goods that can no longer be manufactured profitably. The resulting argument is that lower wages stimulate production in manufacturing. But this view does not consider that low wages come with low labour produc-tivity and high wages with higher productivity, which can stimulate increased production. Further, there is now enough evidence to suggest that high labour costs are often compensated for by advantages in infrastruc-ture, logistics, cost and availability of supplies as well as the business environment. Wage costs remain, how-ever, a main element of costs in most activities, and in a few labour-intensive sectors are the main drivers determining overall unit production costs.
Industrial development unfolds according to the labour force’s capacity to develop the appropri-ate skills in manufacturing. Such skills determine the competitiveness of an industrial sector and the structural change that occurs within it. Skills for manufacturing change, and every stage of industrial
development requires its particular skill set. The most sophisticated sectors require a high order of technical skills. But investing in a pool of highly educated uni-versity graduates does not help in a developing country context – it is too early. Over long periods change in manufacturing has been biased towards using more skilled labour, which has widened wage inequality and weakened the relationship between output and employment growth in manufacturing in low- and lower middle-income countries.
Technological change is at the heart of structural change. Technology has important implications for the productivity of industrial processes and thus on the scale and scope of industrial production. Gains in technology raise productivity – and so fewer work-ers (and often fewer other resources) are required to create the same output. A useful distinction can be made between process innovation based on capital investment, which saves labour (machines replace workers), and product innovation based on research and development (R&D), which leads to new and better products and often creates new jobs by extend-ing production to penetrate new markets. So it is far from inevitable that technological change reduces manufacturing employment in total. It will depend on the choices made – and the incentives provided – by society.
Industrial organization is another driver. It cov-ers firm size and economies of scale in production, the way that production is organized across domestic and global value chains and the spatial distribution of production within national economies. For example, smaller firms on the international stage have gener-ated fast employment growth but slower productivity growth, when controlling for other factors like firm age. Fragmentation of the production process along national and global value chains provides incentives for producers to engage in location-specific labour-intensive segments of manufacturing. Agglomeration effects arising from clusters of productive enterprises

83
Co
st a
nd
su
PP
ly-s
Ide
st
ru
Ct
ur
al C
ha
nG
e d
rIv
er
s
4
“Wage costs contribute to structural change
in manufacturing as they determine overall
production costs and competitiveness
are important in improving competitiveness and rais-ing employment, but clusters alone cannot guarantee these gains, which require supportive infrastructure and supplier networks and good managerial capacity.
Finally, there is the business environment, more an underlying condition than a driver. It includes access to energy, water and transport facilities, as well as institutional aspects related to government support, regulations, taxes and corruption, all of which influ-ence production cost. In many countries access to finance is particularly critical, and can become a key constraint to structural change.
But the impact of supply-side drivers on structural change has not been unambiguous. Wages can support employment generation or hinder it depending not only on their level and how they are set but also on the availability of infrastructure. The timing of the provi-sion of the required skills seems to be crucially impor-tant for them to perform a positive role in supporting new job creation. Technology sheds labour if it is pro-cess oriented but generates employment if it is product
oriented. It is the state (alongside the private sector) that needs to work hard to ensure that the drivers sup-port employment generation while transforming the economy (a point taken up further in Chapter 7).
Wages: important, but not the only driverWage costs contribute to structural change in manu-facturing as they determine overall production costs and competitiveness. But the advantage of low wage costs can be offset by low labour productivity or cost disadvantages for infrastructure, input supplies or regulations and taxes affecting the business environ-ment, as well as by macroeconomic problems leading to inflation and an overvalued exchange rate.
A wage advantage is more important in some areas of manufacturing than others depending on the labour intensity of production (Annex 2 lists labour-intensive manufacturing industries).1 Three labour-intensive industries – wearing apparel, textiles, and food and beverages – are particularly important for
Figure 4.1 Drivers of structural change in manufacturing
Employment
Supply of industry goods
Structural change inmanufacturing industries
Structural change inmanufacturing-related services
Demand forindustry goods
Demand for exportsand imports
InvestmentCompetitiveness(combination of
inputs)
Industrialorganization
Businessenvironment
Wages LocationValue chainorganization
Resourceefficiency
TechnologySkills Firm sizeForeign
investment
Source: Industrial Development Report 2013 Team.

84
Co
st a
nd
su
PP
ly-s
Ide
st
ru
Ct
ur
al C
ha
nG
e d
rIv
er
s
4
“Low-wage economies cannot necessarily
compete with China or other low-cost
suppliers simply with wages, even in
simple labour-intensive activities
industrialization to take off (see Patterns of structural change and employment generation within manufac-turing in Chapter 3). Globally, these three industries account for 30 percent of manufacturing value added, but the share varies by income: low-income countries have a 15–20 percent higher share than the global average, and high-income countries a 10–15 percent lower share (Figure 4.2). All country income groups have, however, been reducing their share of labour-intensive industries in manufacturing value added over the last 20 years.
Costs per worker vary hugely around the world but low wages are no guarantee of cost competitiveness even in labour-intensive tradable sectors. There is consider-able evidence that economies with low absolute wages in dollar terms, such as most of Sub-Saharan Africa, are still uncompetitive in many light-manufacturing industries. Producers can stay competitive only if pro-ductivity gains match wage increases, as illustrated by survey data of formal firms in China, Ethiopia, the United Republic of Tanzania, Viet Nam and Zambia
from 2009/10 (Dinh et al. 2012).2 For most products and processes analysed (polo shirts, wooden chairs, leather loafers and wheat processing), the advantage of low wages was offset by lower labour productivity, as well as by higher input and logistics costs, such that for factory-gate costs African firms in all countries could compete with China only on leather goods.
This point is further backed up by Clarke (2012) whose analysis of World Bank Enterprise Surveys since 2006 shows African firms paying wages well below those of East Asian exporting economies. But once one controls for per capita income across coun-tries, wages in Africa are higher than expected rela-tive to those in surveyed firms in economies at similar incomes. Because of the productivity differences, unit labour costs in East Asia (China, Indonesia, Malaysia and the Philippines) are an estimated 20 percent lower than in Africa (Clarke 2012).
These examples confirm that low-wage econo-mies cannot necessarily compete with China or other low-cost suppliers simply with wages, even in simple labour-intensive activities. Instead, industries can be set up and jobs created when unit labour costs are low – and costs of other production factors are favourable. There is scope for policy intervention and infrastruc-ture investment by public and private sectors. Wages are only one piece in the puzzle for where it makes sense to locate (Box 4.1).
Skills: an often underrated driverSkill formation shapes the capacity to produce indus-trial goods competitively. Crucial for industrial develop-ment, it is expected to positively affect economic growth as a whole (DFID 2011; Box 4.2; also see Chapter 8).
Many studies support the argument that edu-cation has a positive impact on economic growth. Bassanini and Scarpetta (2001) and Sianesi and van Reenen (2003) report, for example, that a one-year increase in average education raises per capita income 3–6 percent. Topel (1999), analysing labour produc-tivity, finds that a one-year increase in the average years of schooling of the labour force raises output per worker 5–15 percent. Skill development not only
Figure 4.2 Share in global manufacturing value added, selected labour-intensive industries, 1990–2009
0
10
20
30
40
50
60
2005200019951990
Shar
e in
labo
ur-in
tens
ive
sect
ors
(per
cent
)
High income
Middle income
Low income
Global
2009
Note: The value added share of food and beverages includes tobacco production because these two industries at the International Standard Industrial Classification two-digit level are combined in the data source.Source: UNIDO estimate based on World Bank (2013b).

85
Co
st a
nd
su
PP
ly-s
Ide
st
ru
Ct
ur
al C
ha
nG
e d
rIv
er
s
4
“Manufacturing is a major employer
of engineering graduates
affects individual’s employability, but it also allows him or her to increase wages and helps ensure better job quality and labour conditions (Vandenberghe and Debande 2004). Increased skills are related to higher rates of labour force participation, especially among women (Table 4.1).
Social and private returns to educationA number of studies have calculated returns on invest-ment in education. Psacharopoulos and Patrinos (2004a) found that social returns (which take into account externalities, as other people benefit from knowledge spillovers of an individual’s higher educa-tion) and private returns on investment in education were positive, especially for less developed countries (Table 4.2).3 Their results emphasize that primary education is more important in regions with lower
development, particularly in Sub-Saharan Africa, where the portion of educated people is much lower than in other regions. For countries at higher levels of development the importance of higher levels of educa-tional attainment increases.
Manufacturing is a major employer of engineer-ing graduates. The returns on investment for those who have studied engineering at a university seem to be higher than the average for tertiary education. They seem to be higher in developing than industrialized countries, and the gap is bigger for social than private returns (Table 4.3).
A skilled labour force in manufacturing is also expected to boost international competitiveness. For example, investing in education has a considerable positive effect on the growth of exports (UNIDO 2011a), and a more skilled workforce is generally
a study based on firm-level data from Bangladesh, Cam-
bodia, Kenya and Madagascar for 2002 and 2008 finds
that despite having similarly low wages, the four countries
have very different pathways for increasing productiv-
ity and developing their garment industry (Fukunishi and
yamagata 2013). all low-income countries, they experi-
enced rapid growth in garment exports to developed coun-
tries. the Bangladeshi industry started to grow in the early
1980s, followed by that of Madagascar in the beginning of
1990s, based on investment from Mauritius. the Cambo-
dian industry started exports in the late 1990s underpinned
by a bilateral trade agreement with the united states. the
Kenyan industry saw rapid growth in the early 2000s, trig-
gered by duty-free access to the us market.
wages in each country in 2008 were well below those
in China and in middle-income exporters like Mexico and
turkey, suggesting that wages were driving competitive-
ness. But Bangladesh, Cambodia and Kenya saw sub-
stantial wage increases over 2002–2008, with nominal
wage growth ranging from 36.5 percent to 65.8 percent.
unit costs were broadly similar in Bangladesh, Cambo-
dia and Madagascar, as higher productivity in Cambodia
and Madagascar offset their higher wages than those in
Bangladesh.
Cambodian firms fared particularly well against those
in Bangladesh, achieving steep productivity gains, while
firms in Bangladesh had stagnant productivity. Cambodia
achieved its productivity growth through several channels:
a high rate of firm turnover facilitated the closure of unpro-
ductive firms and the entry of productive companies, and
among those that continued operating, process innovation
and greater educational attainment of workers came into
play. Fukunishi and yamagata found no evidence of prod-
uct upgrading.
Cambodian garment firms thus successfully mitigated
the adverse effect of increased wages on competitive-
ness by lifting productivity, while the Bangladeshi firms
absorbed rising costs by reducing the large profit margin
that they had enjoyed under the Multifibre arrangement
(MFa), which allowed it preferential exports to developed
countries. In Kenya, where wages were higher than in the
other countries, many garment firms closed after the MFa
ended in 2005, suggesting that the country found it hard
to maintain competitiveness with its rising wages.
the overall conclusions are two-fold. First, employ-
ment in the garment industry provides a good income
opportunity for the less educated. even after trade liberali-
zation and the end of the MFa, real wages have increased
and working conditions improved. second, productivity
growth is the key to expanding production and employ-
ment and upgrading job quality, even when wages are
rising.
Source: Fukunishi and Yamagata 2013.
Box 4.1 Wages and productivity in low-income garment-producing countries

86
Co
st a
nd
su
PP
ly-s
Ide
st
ru
Ct
ur
al C
ha
nG
e d
rIv
er
s
4
“A skilled labour force in manufacturing is also
expected to boost international competitiveness
related to a higher share of manufactured exports in total merchandise exports (Figure 4.3).4
Mismatch between skill demand and supplyNearly all labour markets have unemployment and shortages of certain skills at the same time. Such a
mismatch is due to the limited perspective of work-ers on job opportunities, the time lag between basic skill development and employment, and the effects of structural change on employment.
Take India. It has many more university graduates with a degree in arts than the labour market can absorb,
the republic of Korea and Pakistan started with roughly
the same per capita income in 1950. But over 1950–2010
Pakistan’s per capita income in constant prices grew
three-fold, that of the republic of Korea 23-fold. this dis-
crepancy in economic performance has been attributed
largely to the differences in their educational development.
even in 1950 the east asian country had an advantage in
years of schooling, but by 2010 its educational develop-
ment reached nearly 12 years of schooling, equivalent to
the average adult having completed secondary schooling,
whereas Pakistan’s had not yet reached 6 years of school-
ing, a minimum for literacy.
similarly, both Ghana and the republic of Korea had
a GdP per capita of roughly $300 in 1955. By 1990 in
real terms, the republic of Korea’s GdP had increased
to $7,500, while Ghana remained at its 1955 level. a third
of the republic of Korea’s growth was thanks to rapid
increases in educational attainment (Banerji et al. 2010),
during a period in which the country transformed manu-
facturing from a low-tech to a more capital- and technol-
ogy-intensive structure (Box Figure 1).
Manufacturing’s slower structural change reflects
Pakistan’s slower educational development (Box Figure 2).
In 1963 the country had a similar manufacturing structure
to that in the republic of Korea, but in 2006, while Paki-
stan had a more than 50 percent share of manufacturing
value added in low-tech industries, most value added in
the republic of Korea came from high-tech industries.
Box Figure 1 Manufacturing structure in the Republic of Korea, 1963 and 2006
1963
Motor vehicles
Precision instruments
Electrical machineryand apparatus
Machinery and equipment
Chemicals
Fabricated metals
Basic metals
Non-metallic minerals
Rubber and plastic
Coke and refined petroleum
Printing and publishing
Paper
Furniture, notelsewhere classified
Wood products
Wearing apparel
Textiles
Tobacco
Food and beverages
Share of total manufacturing value added (percent)
Motor vehicles
Precision instruments
Electrical machineryand apparatus
Machinery and equipment
Chemicals
Fabricated metals
Basic metals
Non-metallic minerals
Rubber and plastic
Coke and refined petroleum
Printing and publishing
Paper
Furniture, notelsewhere classified
Wood products
Wearing apparel
Textiles
Tobacco
Food and beverages
2006
Share of total manufacturing value added (percent)
0 10 20 300 10 20 30
Note: The names of the low-, medium- and high-tech industries are in red, green and blue, respectively.Source: MIT, POPC and UNIDO 2012.
(continued)
Box 4.2 Education and economic growth in the Republic of Korea and Pakistan

87
Co
st a
nd
su
PP
ly-s
Ide
st
ru
Ct
ur
al C
ha
nG
e d
rIv
er
s
4
“Nearly all labour markets have unemployment
and shortages of certain skills at the same time
and graduates who have studied mechanical engineer-ing and electricity are also mismatched as many do not find work in the industry (Banerji et al. 2010). In
Tunisia half of university graduates in chemistry are mismatched in their jobs, while in Lebanon 40 percent of the workforce is in jobs where they do not use their skills (Almeida, Behrman and Robalino 2012).
Supply of skilled labour may not always match demand for two reasons. First, by the time demand has unfolded, it may be too late for firms to develop them internally in their own workforce. Second, demand is inadequate because firms have not well defined their real needs because of deficiencies in developing innovation strategies. In Tanzania some firms may have the poten-tial to start innovating in manufacturing, but because they have not developed a strategy they fail to hire key staff in certain areas (MIT, POPC and UNIDO 2012).
Changing the nature and delivery of skillsThe skills required for industrial production change with time. When economies undergo the structural
Box Figure 2 Manufacturing structure in Pakistan, 1963 and 2006
1963
Motor vehicles
Precision instruments
Electrical machineryand apparatus
Machinery and equipment
Chemicals
Fabricated metals
Basic metals
Non-metallic minerals
Rubber and plastic
Coke and refined petroleum
Printing and publishing
Paper
Furniture, notelsewhere classified
Wood products
Wearing apparel
Textiles
Tobacco
Food and beverages
Share of total manufacturing value added (percent)
Motor vehicles
Precision instruments
Electrical machineryand apparatus
Machinery and equipment
Chemicals
Fabricated metals
Basic metals
Non-metallic minerals
Rubber and plastic
Coke and refined petroleum
Printing and publishing
Paper
Furniture, notelsewhere classified
Wood products
Wearing apparel
Textiles
Tobacco
Food and beverages
2006
Share of total manufacturing value added (percent)
0 10 3020 50400 10 3020 5040
Note: The names of the low-, medium- and high-tech industries are in red, green and blue, respectively.Source: MIT, POPC and UNIDO 2012.
Source: Industrial Development Report 2013 Team based on MIT, POPC and UNIDO (2012).
Box 4.2 (continued) Education and economic growth in the Republic of Korea and Pakistan
Labour force participation
Education Men Women
Primary or below 52 35
Lower secondary 66 47
Upper secondary 79 64
Post-secondary, non-tertiary 84 73
Tertiary first degree 84 78
Tertiary MA, PhD 88 81
Note: Averages for 21 countries in the European Union.Source: Adapted from table A5.1b from OECD (2013), Education at a Glance 2013: OECD Indicators, OECD Publishing, http://dx.doi.org/10.1787/eag-2013-en
Table 4.1 Education and labour force participation in the European Union among men and women (percent)
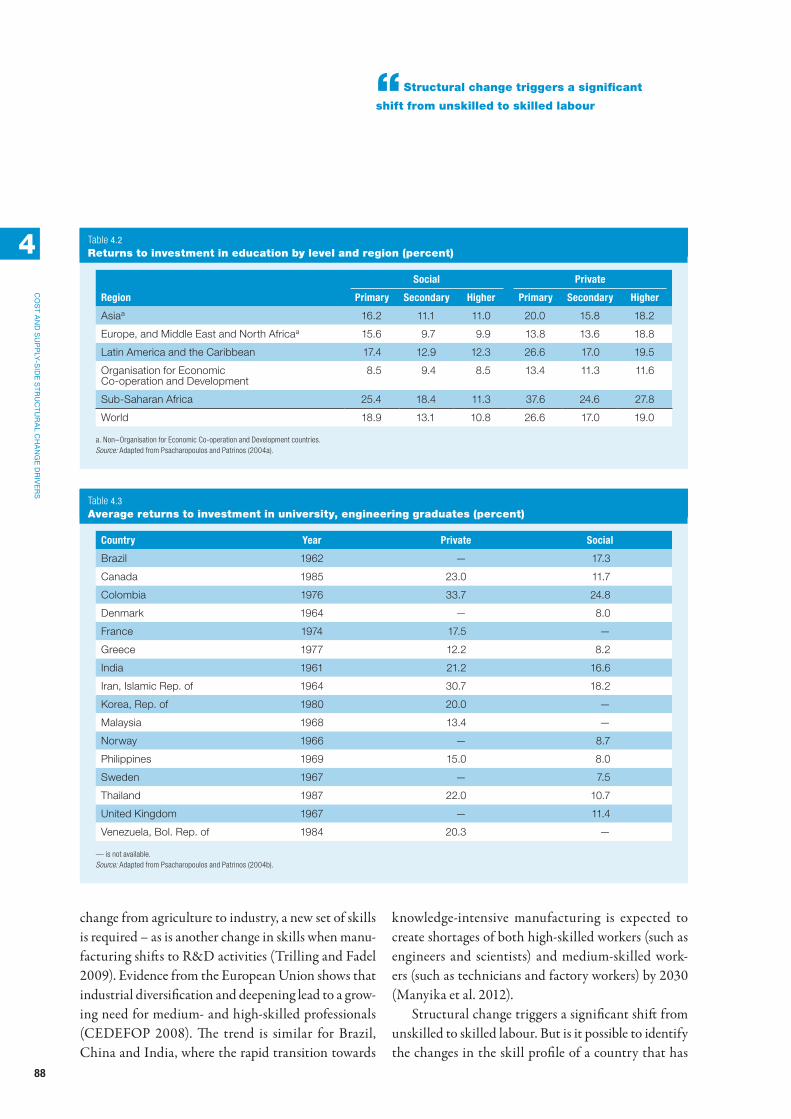
88
Co
st a
nd
su
PP
ly-s
Ide
st
ru
Ct
ur
al C
ha
nG
e d
rIv
er
s
4
“Structural change triggers a significant
shift from unskilled to skilled labour
change from agriculture to industry, a new set of skills is required – as is another change in skills when manu-facturing shifts to R&D activities (Trilling and Fadel 2009). Evidence from the European Union shows that industrial diversification and deepening lead to a grow-ing need for medium- and high-skilled professionals (CEDEFOP 2008). The trend is similar for Brazil, China and India, where the rapid transition towards
knowledge-intensive manufacturing is expected to create shortages of both high-skilled workers (such as engineers and scientists) and medium-skilled work-ers (such as technicians and factory workers) by 2030 (Manyika et al. 2012).
Structural change triggers a significant shift from unskilled to skilled labour. But is it possible to identify the changes in the skill profile of a country that has
Social Private
Region Primary Secondary Higher Primary Secondary Higher
Asiaa 16.2 11.1 11.0 20.0 15.8 18.2
Europe, and Middle East and North Africaa 15.6 9.7 9.9 13.8 13.6 18.8
Latin America and the Caribbean 17.4 12.9 12.3 26.6 17.0 19.5
Organisation for Economic Co-operation and Development
8.5 9.4 8.5 13.4 11.3 11.6
Sub-Saharan Africa 25.4 18.4 11.3 37.6 24.6 27.8
World 18.9 13.1 10.8 26.6 17.0 19.0
a. Non–Organisation for Economic Co-operation and Development countries.Source: Adapted from Psacharopoulos and Patrinos (2004a).
Table 4.2 Returns to investment in education by level and region (percent)
Country Year Private Social
Brazil 1962 — 17.3
Canada 1985 23.0 11.7
Colombia 1976 33.7 24.8
Denmark 1964 — 8.0
France 1974 17.5 —
Greece 1977 12.2 8.2
India 1961 21.2 16.6
Iran, Islamic Rep. of 1964 30.7 18.2
Korea, Rep. of 1980 20.0 —
Malaysia 1968 13.4 —
Norway 1966 — 8.7
Philippines 1969 15.0 8.0
Sweden 1967 — 7.5
Thailand 1987 22.0 10.7
United Kingdom 1967 — 11.4
Venezuela, Bol. Rep. of 1984 20.3 —
— is not available.Source: Adapted from Psacharopoulos and Patrinos (2004b).
Table 4.3 Average returns to investment in university, engineering graduates (percent)
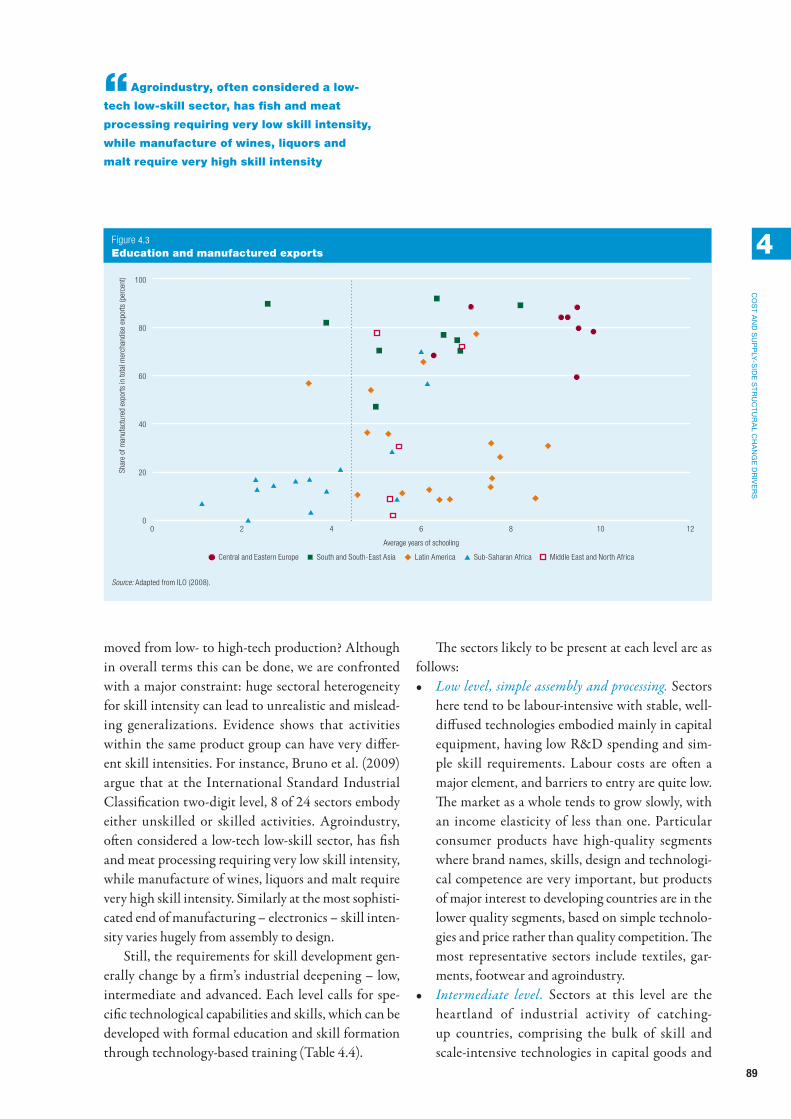
89
Co
st a
nd
su
PP
ly-s
Ide
st
ru
Ct
ur
al C
ha
nG
e d
rIv
er
s
4
“Agroindustry, often considered a low-
tech low-skill sector, has fish and meat
processing requiring very low skill intensity,
while manufacture of wines, liquors and
malt require very high skill intensity
moved from low- to high-tech production? Although in overall terms this can be done, we are confronted with a major constraint: huge sectoral heterogeneity for skill intensity can lead to unrealistic and mislead-ing generalizations. Evidence shows that activities within the same product group can have very differ-ent skill intensities. For instance, Bruno et al. (2009) argue that at the International Standard Industrial Classification two-digit level, 8 of 24 sectors embody either unskilled or skilled activities. Agroindustry, often considered a low-tech low-skill sector, has fish and meat processing requiring very low skill intensity, while manufacture of wines, liquors and malt require very high skill intensity. Similarly at the most sophisti-cated end of manufacturing – electronics – skill inten-sity varies hugely from assembly to design.
Still, the requirements for skill development gen-erally change by a firm’s industrial deepening – low, intermediate and advanced. Each level calls for spe-cific technological capabilities and skills, which can be developed with formal education and skill formation through technology-based training (Table 4.4).
The sectors likely to be present at each level are as follows:• Low level, simple assembly and processing. Sectors
here tend to be labour-intensive with stable, well-diffused technologies embodied mainly in capital equipment, having low R&D spending and sim-ple skill requirements. Labour costs are often a major element, and barriers to entry are quite low. The market as a whole tends to grow slowly, with an income elasticity of less than one. Particular consumer products have high-quality segments where brand names, skills, design and technologi-cal competence are very important, but products of major interest to developing countries are in the lower quality segments, based on simple technolo-gies and price rather than quality competition. The most representative sectors include textiles, gar-ments, footwear and agroindustry.
• Intermediate level. Sectors at this level are the heartland of industrial activity of catching-up countries, comprising the bulk of skill and scale-intensive technologies in capital goods and
Figure 4.3 Education and manufactured exports
0 2 4 6 8 10 12
Shar
e of
man
ufac
ture
d ex
ports
in to
tal m
erch
andi
se e
xpor
ts (p
erce
nt)
Average years of schooling
0
20
40
60
80
100
Central and Eastern Europe South and South-East Asia Latin America Middle East and North AfricaSub-Saharan Africa
Source: Adapted from ILO (2008).
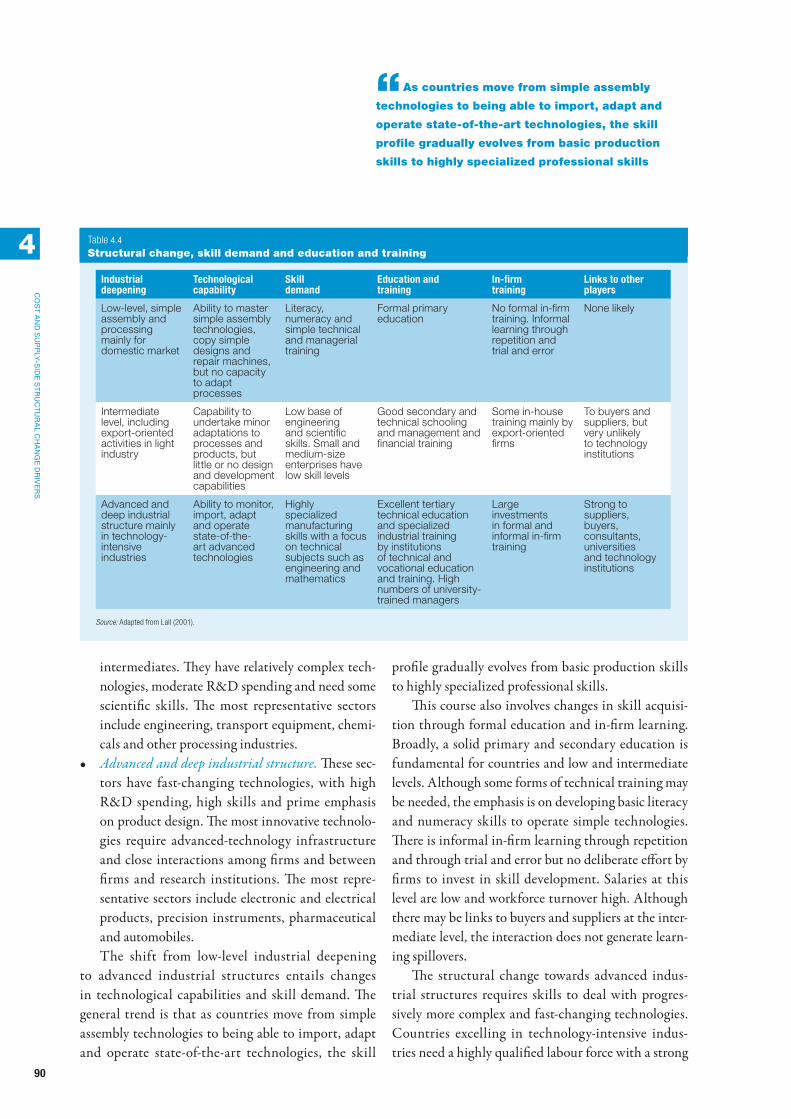
90
Co
st a
nd
su
PP
ly-s
Ide
st
ru
Ct
ur
al C
ha
nG
e d
rIv
er
s
4
“As countries move from simple assembly
technologies to being able to import, adapt and
operate state-of-the-art technologies, the skill
profile gradually evolves from basic production
skills to highly specialized professional skills
intermediates. They have relatively complex tech-nologies, moderate R&D spending and need some scientific skills. The most representative sectors include engineering, transport equipment, chemi-cals and other processing industries.
• Advanced and deep industrial structure. These sec-tors have fast-changing technologies, with high R&D spending, high skills and prime emphasis on product design. The most innovative technolo-gies require advanced-technology infrastructure and close interactions among firms and between firms and research institutions. The most repre-sentative sectors include electronic and electrical products, precision instruments, pharmaceutical and automobiles.The shift from low-level industrial deepening
to advanced industrial structures entails changes in technological capabilities and skill demand. The general trend is that as countries move from simple assembly technologies to being able to import, adapt and operate state-of-the-art technologies, the skill
profile gradually evolves from basic production skills to highly specialized professional skills.
This course also involves changes in skill acquisi-tion through formal education and in-firm learning. Broadly, a solid primary and secondary education is fundamental for countries and low and intermediate levels. Although some forms of technical training may be needed, the emphasis is on developing basic literacy and numeracy skills to operate simple technologies. There is informal in-firm learning through repetition and through trial and error but no deliberate effort by firms to invest in skill development. Salaries at this level are low and workforce turnover high. Although there may be links to buyers and suppliers at the inter-mediate level, the interaction does not generate learn-ing spillovers.
The structural change towards advanced indus-trial structures requires skills to deal with progres-sively more complex and fast-changing technologies. Countries excelling in technology-intensive indus-tries need a highly qualified labour force with a strong
Industrial deepening
Technological capability
Skill demand
Education and training
In-firm training
Links to other players
Low-level, simple assembly and processing mainly for domestic market
Ability to master simple assembly technologies, copy simple designs and repair machines, but no capacity to adapt processes
Literacy, numeracy and simple technical and managerial training
Formal primary education
No formal in-firm training. Informal learning through repetition and trial and error
None likely
Intermediate level, including export-oriented activities in light industry
Capability to undertake minor adaptations to processes and products, but little or no design and development capabilities
Low base of engineering and scientific skills. Small and medium-size enterprises have low skill levels
Good secondary and technical schooling and management and financial training
Some in-house training mainly by export-oriented firms
To buyers and suppliers, but very unlikely to technology institutions
Advanced and deep industrial structure mainly in technology-intensive industries
Ability to monitor, import, adapt and operate state-of-the-art advanced technologies
Highly specialized manufacturing skills with a focus on technical subjects such as engineering and mathematics
Excellent tertiary technical education and specialized industrial training by institutions of technical and vocational education and training. High numbers of university-trained managers
Large investments in formal and informal in-firm training
Strong to suppliers, buyers, consultants, universities and technology institutions
Source: Adapted from Lall (2001).
Table 4.4 Structural change, skill demand and education and training
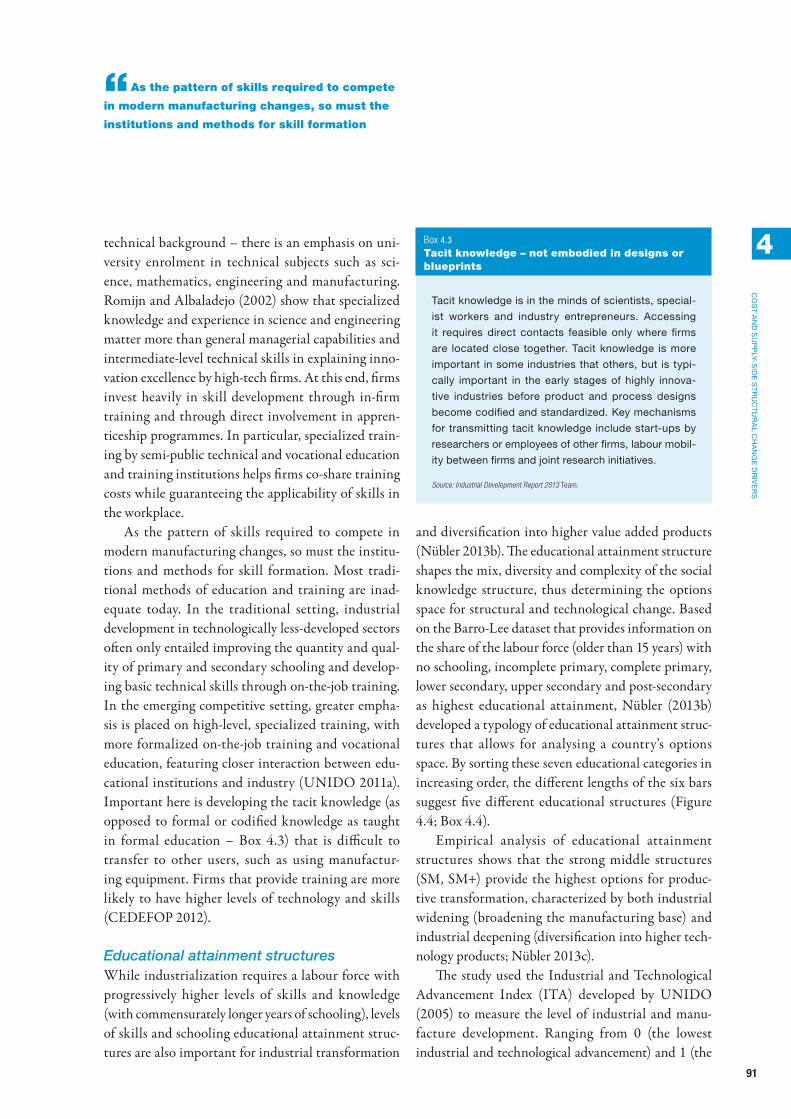
91
Co
st a
nd
su
PP
ly-s
Ide
st
ru
Ct
ur
al C
ha
nG
e d
rIv
er
s
4
“As the pattern of skills required to compete
in modern manufacturing changes, so must the
institutions and methods for skill formation
technical background – there is an emphasis on uni-versity enrolment in technical subjects such as sci-ence, mathematics, engineering and manufacturing. Romijn and Albaladejo (2002) show that specialized knowledge and experience in science and engineering matter more than general managerial capabilities and intermediate-level technical skills in explaining inno-vation excellence by high-tech firms. At this end, firms invest heavily in skill development through in-firm training and through direct involvement in appren-ticeship programmes. In particular, specialized train-ing by semi-public technical and vocational education and training institutions helps firms co-share training costs while guaranteeing the applicability of skills in the workplace.
As the pattern of skills required to compete in modern manufacturing changes, so must the institu-tions and methods for skill formation. Most tradi-tional methods of education and training are inad-equate today. In the traditional setting, industrial development in technologically less-developed sectors often only entailed improving the quantity and qual-ity of primary and secondary schooling and develop-ing basic technical skills through on-the-job training. In the emerging competitive setting, greater empha-sis is placed on high-level, specialized training, with more formalized on-the-job training and vocational education, featuring closer interaction between edu-cational institutions and industry (UNIDO 2011a). Important here is developing the tacit knowledge (as opposed to formal or codified knowledge as taught in formal education – Box 4.3) that is difficult to transfer to other users, such as using manufactur-ing equipment. Firms that provide training are more likely to have higher levels of technology and skills (CEDEFOP 2012).
Educational attainment structuresWhile industrialization requires a labour force with progressively higher levels of skills and knowledge (with commensurately longer years of schooling), levels of skills and schooling educational attainment struc-tures are also important for industrial transformation
and diversification into higher value added products (Nübler 2013b). The educational attainment structure shapes the mix, diversity and complexity of the social knowledge structure, thus determining the options space for structural and technological change. Based on the Barro-Lee dataset that provides information on the share of the labour force (older than 15 years) with no schooling, incomplete primary, complete primary, lower secondary, upper secondary and post-secondary as highest educational attainment, Nübler (2013b) developed a typology of educational attainment struc-tures that allows for analysing a country’s options space. By sorting these seven educational categories in increasing order, the different lengths of the six bars suggest five different educational structures (Figure 4.4; Box 4.4).
Empirical analysis of educational attainment structures shows that the strong middle structures (SM, SM+) provide the highest options for produc-tive transformation, characterized by both industrial widening (broadening the manufacturing base) and industrial deepening (diversification into higher tech-nology products; Nübler 2013c).
The study used the Industrial and Technological Advancement Index (ITA) developed by UNIDO (2005) to measure the level of industrial and manu-facture development. Ranging from 0 (the lowest industrial and technological advancement) and 1 (the
tacit knowledge is in the minds of scientists, special-
ist workers and industry entrepreneurs. accessing
it requires direct contacts feasible only where firms
are located close together. tacit knowledge is more
important in some industries that others, but is typi-
cally important in the early stages of highly innova-
tive industries before product and process designs
become codified and standardized. Key mechanisms
for transmitting tacit knowledge include start-ups by
researchers or employees of other firms, labour mobil-
ity between firms and joint research initiatives.
Source: Industrial Development Report 2013 Team.
Box 4.3 Tacit knowledge – not embodied in designs or blueprints

92
Co
st a
nd
su
PP
ly-s
Ide
st
ru
Ct
ur
al C
ha
nG
e d
rIv
er
s
4
“The educational attainment structure shapes
the mix, diversity and complexity of the social
knowledge structure, thus determining the options
space for structural and technological change
highest), the ITA is a composite index based on the share of manufacturing in total production and exports and share of medium and high technology products in total production and exports. Analysis of educational attainment structures and the ITA shows that countries with strong middle education structures (SM, SM+) achieved ITA levels above 0.3 (Figure 4.5). Countries
with ITA levels below this threshold are mainly small economies and transition countries that have either specialized in the services sector or on resource-based industries. By contrast, missing middle education struc-tures (MM, MM+) define tighter boundaries and lim-ited options for industrial and technological expansion. This is indicated by the lower ITA values of countries
Figure 4.4 Main educational attainment structures
No schoolingPrimary incompletePrimary complete
Lower secondaryUpper secondaryPost secondary
Korea, Rep.(average years of schooling: 10.8)
Poland(average years of schooling: 9.8)
Bolivia(average years of schooling: 5.6)
Egypt(average years of schooling: 5.5)
Tanzania(average years of schooling: 2.7)
Strong middle+Strong middleMissing middleDualL
Note: For definition of educational attainment structures, see Box 4.4. Source: Nübler (2013b) based on Barro and Lee (2000).
L-shape educational structures with the median category
being non-schoolers or (complete and incomplete) pri-
mary education show extremely low shares of upper and
post-secondary education. L+ structures have the shape
of an l-curve but with higher shares of upper and post-
secondary education.
Dual structures may be described as the composition
of distinct education structures of two groups (such as
rural and urban). It shows high levels of non-schoolers and
incomplete primary education, but low shares of primary
(like the l). secondary and post-secondary categories
show a structure more similar to the strong middle struc-
ture – that is, it includes high shares of lower, upper and
post-secondary education.
Missing middle (MM) structures demonstrate high
shares of primary and lower secondary education, very
low shares of upper secondary education and high shares
of post-secondary. MM countries have a bimodal struc-
ture with very low shares of lower and upper secondary
education. MM+ countries show a trimodal structure,
differing from the MM structure, with significantly higher
shares of lower secondary education, but lower shares of
incomplete primary education.
Strong middle (sM) structures take the form of a bell
curve with the median on primary, lower (medium catego-
ries) or upper secondary (high categories) education. as
countries increase levels of average years of schooling,
the median is shifted from primary to lower (sM) to upper
secondary education (sM+).
Source: Nübler (2013b) based on Barro and Lee (2000).
Box 4.4 Typology of educational attainment structures
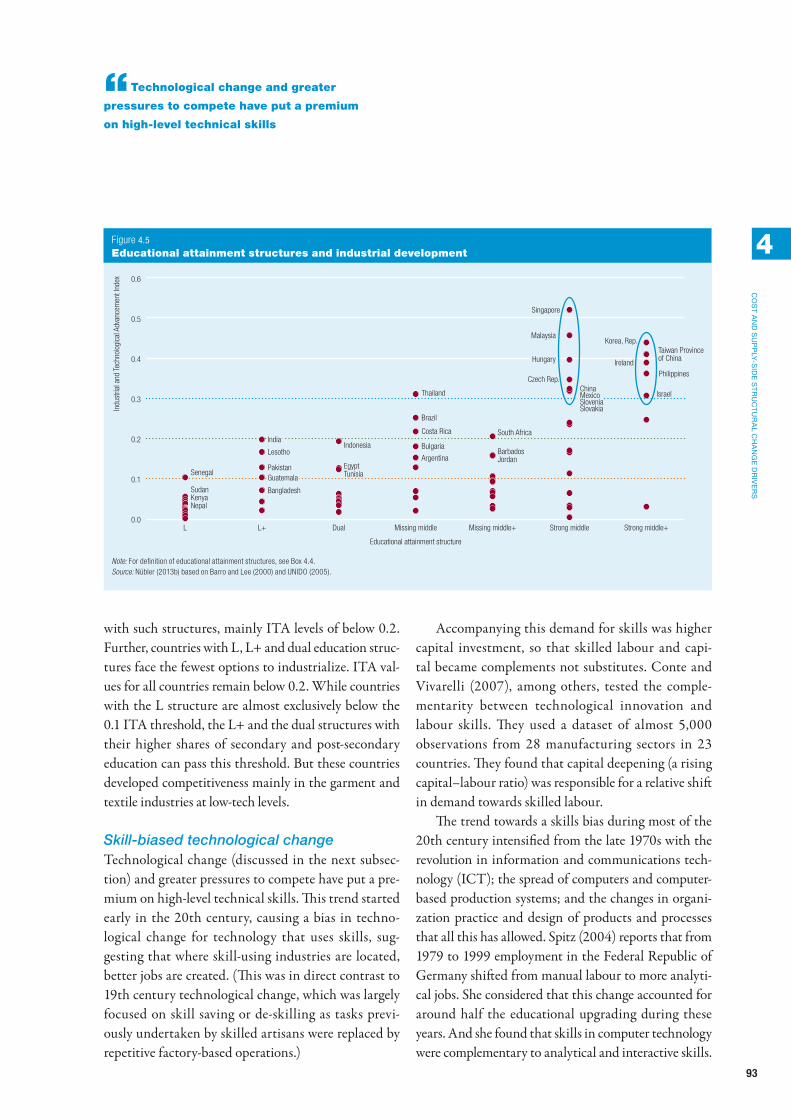
93
Co
st a
nd
su
PP
ly-s
Ide
st
ru
Ct
ur
al C
ha
nG
e d
rIv
er
s
4
“Technological change and greater
pressures to compete have put a premium
on high-level technical skills
with such structures, mainly ITA levels of below 0.2. Further, countries with L, L+ and dual education struc-tures face the fewest options to industrialize. ITA val-ues for all countries remain below 0.2. While countries with the L structure are almost exclusively below the 0.1 ITA threshold, the L+ and the dual structures with their higher shares of secondary and post-secondary education can pass this threshold. But these countries developed competitiveness mainly in the garment and textile industries at low-tech levels.
Skill-biased technological changeTechnological change (discussed in the next subsec-tion) and greater pressures to compete have put a pre-mium on high-level technical skills. This trend started early in the 20th century, causing a bias in techno-logical change for technology that uses skills, sug-gesting that where skill-using industries are located, better jobs are created. (This was in direct contrast to 19th century technological change, which was largely focused on skill saving or de-skilling as tasks previ-ously undertaken by skilled artisans were replaced by repetitive factory-based operations.)
Accompanying this demand for skills was higher capital investment, so that skilled labour and capi-tal became complements not substitutes. Conte and Vivarelli (2007), among others, tested the comple-mentarity between technological innovation and labour skills. They used a dataset of almost 5,000 observations from 28 manufacturing sectors in 23 countries. They found that capital deepening (a rising capital–labour ratio) was responsible for a relative shift in demand towards skilled labour.
The trend towards a skills bias during most of the 20th century intensified from the late 1970s with the revolution in information and communications tech-nology (ICT); the spread of computers and computer-based production systems; and the changes in organi-zation practice and design of products and processes that all this has allowed. Spitz (2004) reports that from 1979 to 1999 employment in the Federal Republic of Germany shifted from manual labour to more analyti-cal jobs. She considered that this change accounted for around half the educational upgrading during these years. And she found that skills in computer technology were complementary to analytical and interactive skills.
Figure 4.5 Educational attainment structures and industrial development
Indu
stria
l and
Tec
hnol
ogic
al A
dvan
cem
ent I
ndex
Educational attainment structure
0.0
0.1
0.2
0.3
0.4
0.5
0.6
L L+ Dual Missing middle Missing middle+ Strong middle Strong middle+
Philippines
Korea, Rep.Taiwan Province of ChinaIreland
Israel
BarbadosJordan
South Africa
Argentina
Bulgaria
Costa Rica
Brazil
Thailand
Indonesia
EgyptTunisia
Czech Rep.
Hungary
Malaysia
Singapore
ChinaMexicoSloveniaSlovakia
SudanKenyaNepal
Bangladesh
Guatemala
India
Lesotho
PakistanSenegal
Note: For definition of educational attainment structures, see Box 4.4. Source: Nübler (2013b) based on Barro and Lee (2000) and UNIDO (2005).

94
Co
st a
nd
su
PP
ly-s
Ide
st
ru
Ct
ur
al C
ha
nG
e d
rIv
er
s
4
“There are two main sources of
innovation – R&D investment and embodied
technological change, where the innovation
is embodied in new equipment
ICT has been described as a “general purpose tech-nology” with pervasive effects across the economy, creating a continual process of technological improve-ment leading to falling costs for users and a continual process of innovation (Bresnahan and Trajtenberg 1995).5 This is the equivalent of the key technological breakthroughs of earlier times like the printing press, steam power and electricity and also reflected in the similar patterns of spatial distribution between manu-facturing in the early 20th century and services in the late 20th century (see Box 2.2 in Chapter 2).
ICT and computerization more widely – in increasing demand for inputs of non-routine cog-nitive and manual tasks and shifting the relative demand for labour – have created a “polarization effect” in the employment structure of higher income economies (Autor, Levy and Murnane 2003). These countries generally show a falling employment share taken by middle-skill and middle-wage occupations, as the adoption of computer-based technologies has increased demand for educated and skilled workers (who can do non-routine abstract tasks) and for low-wage, low-skill workers (who have manual flexibility and adaptability; Acemoglu and Autor 2010).
This skill bias has been explained by the rising sup-ply of skilled workers in the technology-creating econ-omies and may partly account for the fall in real wages of low-skilled workers (Jaumette and Tytell 2007). In developed economies it is now fairly well established that technological change in a skill-biased direction has been a key factor in creating a falling labour share in GDP, as unskilled jobs are replaced by capital. The significance for developing countries – as technology importers – is that the technology transferred to them has been created in response to market conditions in advanced economies.
The effect of such change has been put forward as one of the explanations as to why, unexpectedly, trade liberalization has only rarely been associated with the one of the key predictions of standard trade theory – a rise in relative wages for unskilled labour in low-income countries (Arbache, Dickerson and Green 2004; Robbins 2003). If firms in developing countries
are forced by competition and induced by trade liber-alization to import best-practice technology – where there is little scope for factor substitution – this will raise the demand for skilled labour over unskilled and import a skill bias into the economy.
But skill-biased technological change is not auto-matic in all industries in all developing countries. It did not, for example, occur in the sewing segment in the garment industry in Bangladesh (Fukunishi and Yamagata 2013).
Technology: a dominant driver of structural changeTechnology determines overall output and pro-ductivity as well as labour productivity specifically. Although labour productivity can be improved by using technologies more efficiently over time, trends in its growth are closely linked to how new technology is applied and modified, and to what extent it creates or displaces jobs.
Job creation and destructionMost of the debate on innovation’s impact on job num-bers has focused on higher income economies. There are two main sources of innovation – R&D invest-ment and embodied technological change (ETC), where the innovation is embodied in new equipment. There are also two main types of innovation outputs: product innovation – altering the product mix by creating either genuinely new products or products adapted from existing designs; and process innovation – altering the system of production to reduce costs or improve quality (Figure 4.6).
Although the distinction is not precise, the litera-ture on innovation suggests that only complex prod-uct innovation (delivered mainly by large firms in high-tech sectors) relies on formal R&D, while pro-cess innovation – where it is not so easy to single out pure innovation, diffusion and imitation – is much more related to ETC acquired by investment in new machinery and equipment and by purchasing exter-nal technology incorporated in licences, consultancies and know-how.6 Again generalizing, R&D is most

95
Co
st a
nd
su
PP
ly-s
Ide
st
ru
Ct
ur
al C
ha
nG
e d
rIv
er
s
4
“Product innovation creates jobs through
the emergence of new markets, and process
innovation creates a direct labour-saving effect
crucial in large firms and more advanced sectors, while ETC assumes a dominant role in small and medium-size enterprises (SMEs) and more traditional sectors.
Thus theoretically innovation has two inputs and two outputs, with R&D mainly (but not only) related
to product innovation and ETC mainly (but not only) related to process innovation, with the possibility of some overlap in mixed activities which entail both product and process innovation.
The main implications of the distinction for employment are that product innovation creates jobs through the emergence of new markets, and that pro-cess innovation creates a direct labour-saving effect, mainly related to introducing machines that allow the same output to be produced with fewer workers.
Although the expectation is that developing new markets through product innovation will create new jobs, this has to be balanced against the potential loss of jobs in the sectors producing the displaced prod-ucts. Many process innovations are intended to be labour saving but a number of dynamic “compensating mechanisms” exist that may offset these labour-saving effects in whole or in part, making it difficult to calcu-late the exact net employment outcome of technologi-cal change (Box 4.5).
But none of these mechanisms compensating for the direct displacement effect on jobs is automatic, and to work they require particular conditions to hold. Economic theory has no precise answer for the ultimate employment impact of process innovation.
Figure 4.6 Innovation inputs and outputs and their impact on employment
The two faces of innovation
I
N
N
O
VAT
I
O
N
-
O
U
T
P
U
T
Productinnovation
Processinnovation
Productand processinnovation
Inno
vatio
n ou
tput
s
Jobcreation
Jobdestruction
Inno
vatio
n in
puts
Rese
arch
and
deve
lopm
ent
Embo
died
tech
nolo
gica
l cha
nge
Source: Vivarelli 2013.
Through new machines. the same process innovations
that displace workers in the product industries where the
new machines are introduced create new jobs in the capi-
tal industries where the new machines are produced.
Through decreases in prices. although innovations involve
the displacement of workers, these innovations lead to a
decrease in the unit costs of production, and in a competi-
tive market this effect leads to decreasing prices; in turn,
decreasing prices stimulate new demand for products and
so additional production and employment.
Through new investments. In cases where the competi-
tive convergence is not direct, during the gap between the
decrease in costs – due to technological progress – and
the consequent fall in prices, extra-profits may be accu-
mulated by innovative entrepreneurs. these profits are
invested, creating new output and new jobs.
Through declines in wages. where there is demand for
labour, the direct effect of job-destructive technologies
may be compensated within the labour market. assum-
ing free competition and full substitutability between
labour and capital, technological unemployment implies a
decrease in wages and this should induce a reverse shift
back to more labour-intensive technologies.
Through increases in incomes. trade unions may redis-
tribute part of the innovation rent back to the workforce
and thus a portion of the cost savings due to innovation
can be translated into higher wage income and hence
higher consumption. this increase in demand leads to an
increase in employment, which may compensate for the
initial job losses due to process innovations.
Source: Vivarelli 2013.
Box 4.5 Labour-compensating mechanisms of technological change

96
Co
st a
nd
su
PP
ly-s
Ide
st
ru
Ct
ur
al C
ha
nG
e d
rIv
er
s
4
“Innovators were found to employ a
greater number of unskilled and female
workers than non-innovators
Price and income mechanisms can counterbalance the direct job destruction caused by process innovation, but their effectiveness depends on many parameters such as the degree of competition, demand elasticity and the way business expectations are shaped.
Empirical studies of the innovation–employment links have focused largely on higher income econo-mies and tend to show that product innovations are usually associated with employment growth, while the effect of process innovations is often negative. R&D spending has been shown to have a positive employ-ment effect, principally in high-tech sectors.7 Net employment usually rises with innovation, and gov-ernment support for product development rather than technological change is more likely to lead to employ-ment generation.
Work on a large database created from the World Bank Enterprise Surveys of 2002–2006 and covering more than 26,000 manufacturing establishments in 71 countries confirms the employment–innovation link (Dutz et al. 2011). Firms that introduced a product or process innovation (judged by their own responses in the survey) had employment growth of 2.9 or 2.1 per-centage points, respectively, above that of non-inno-vating firms (controlling for all other factors). Process innovation had a positive employment effect overall, but not for the largest enterprises (more than 200 workers). Product innovation had a positive employ-ment effect, which was larger than that for process innovation and was significant for all size categories.
Innovators were also found to employ a greater number of unskilled and female workers than non-innovators. But the link between process innovation
and unskilled employment growth was weaker than with product innovation, and there is some evidence that non-process innovators may have had a stronger link with employment of unskilled labour. Female employment in developing countries was strongly linked to innovation, while across the whole sample of countries it appeared to be linked to innovation only in new and medium-size enterprises.
Industrial organization: the underlying driverThe way an industry is organized has a profound influ-ence on structural change through shifts in output, productivity, growth and employment. Important ele-ments to be considered are firm size, production frag-mentation, and spatial distribution and clustering.
Firm sizeAverage firm size in the manufacturing sector, measured by formal sector employees, declined in 1981–2007 in all country income groups except for low-income countries, reflecting the fact that smaller firms dominated start-ups and employment growth (Table 4.5). Further, across almost all branches of manufacturing, average firm size is lowest in high-income countries and highest in low-income coun-tries, reflecting the trend for the proportionate share of SMEs to rise with per capita income.8 The larger average firm size in the low-income group is likely to reflect the dualistic manufacturing structure there, with formal manufacturing dominated by large pro-ducers and a relatively large informal sector (not cov-ered in the table), with many very small firms.
High income: OECD
High income: non-OECD
Upper middle income
Lower middle income
Low income
1981–1985 202 138 317 147 187
2001–2007 58 175 127 112 208
OECD is Organisation for Economic Co-operation and Development.Note: Average employees per firm calculated as simple average of International Standard Industrial Classification two-digit branches.Source: UNIDO estimate based on UNIDO (2012a).
Table 4.5 Average firm size by country income group, selected periods, 1981–2007 (number of employees)

97
Co
st a
nd
su
PP
ly-s
Ide
st
ru
Ct
ur
al C
ha
nG
e d
rIv
er
s
4
“While SMEs have proved a key driver
of employment growth, they have not been
a driver of productivity improvements
within manufacturing in most cases
Several formal analyses of the performance of SMEs have been conducted using detailed databases compiled from the World Bank Enterprise Surveys. Defining SMEs as formal sector enterprises up to 250 workers, Ayyagari, Beck and Demirguc-Kunt (2003) found that in the sample of up to 76 countries for the 1990s manufacturing SMEs accounted for 32 per-cent of total employment for the low-income group, compared with 54 percent for the middle-income and 64 percent for the high-income groups. Regression analysis of these data (controlling for country char-acteristics and the starting level of per capita income) finds that the size of the SME sector is positively asso-ciated with economic growth, though it does not sup-port the interpretation that size causes higher growth. It seems that in the 1990s a rising share of SMEs in employment and income was a characteristic of fast-growing economies.
The same database provides estimates of informal unregistered economic activity, which shows a clear tendency to decline as a share of national income as economies grow. Thus the rising share of SMEs is partly a result of declining informal activity, as previ-ously unregistered firms shift into formal manufac-turing. Perceived obstacles to the expansion of small firms, like constrained access to credit and the costs of starting a business, are associated with smaller shares of SMEs in economic activity at the country level.
Across all countries, firm size is a significant deter-minant of employment growth and where there are more SMEs, regressions suggest that there is higher employment growth. Nurturing SMEs is conducive to employment growth. There is a slight tendency for this to be stronger at the smaller end of the SME scale (up to 100 workers), but a dummy for the size group 101–250 is also significant. In countries with employ-ment increases over the period covered by the surveys the vast majority of new jobs are created by SMEs (defined in the broadest way as up to 250 employees). This negative association between size and employ-ment growth holds even when controlling for the age of firms, unlike a recent finding for the United States (Haltiwanger, Jarmin and Miranda 2010). Thus it is
not the case that the employment effect is due to new firms taking on more workers and tending to start as SMEs. But SMEs have a significant negative associa-tion with productivity growth (again controlling for firm age). In addition, new smaller firms, as well as small mature firms (more than six years) tend to have lower productivity growth, allowing for the sector in which they operate (Ayyagari, Demirguc-Kunt and Maksimovic 2011). The results do not differ between groups of countries when they are separated by size of the informal sector.
Thus it appears from this database that while SMEs have proved a key driver of employment growth, they have not been a driver of productivity improve-ments within manufacturing in most cases. Promoting industrial SMEs to generate employment should be accompanied by efforts to upgrade them technologi-cally, so that these firms also perform a positive role in capital accumulation.
The databases discussed above exclude informal and micro firms (fewer than five employees) and so do not capture much manufacturing in low-income coun-tries. There, the informal economy forms the bulk of manufacturing employment, and growth of informal employment is usually due to new start-ups rather than to the expansion of informal firms (Sandefur 2006). In such countries few informal enterprises appear to graduate to formal status and of those that do even fewer grow to become medium-size enter-prises. Efforts to link the size of the informal sector to business environment conditions – like the cost of starting a business and enforcing a contract, and rigid-ity of employment laws – have found some association, though it is clear that other factors, such as difficulty in accessing credit and general macroeconomic condi-tions, also work to explain the size of informal activity.
Production fragmentationStructural change is driven by the extent to which firms can segment the production process and locate production to minimize unit production costs. Producing a final product in one location may offer little scope for changing the capital–labour ratio. But

98
Co
st a
nd
su
PP
ly-s
Ide
st
ru
Ct
ur
al C
ha
nG
e d
rIv
er
s
4
“Product fragmentation through the
spread of global and domestic production
networks allows the retention of manufacturing
jobs in industry segments where such
jobs might otherwise have been lost
once it becomes possible to fragment production into a series of stages, some stages will inevitably be more labour intensive than others and, with low transport and communication costs, it may be cost-effective to move these to a low-wage area.
The parts of the production process where wage costs become the critical determinant of location are simple assembly of parts or simple forms of product processing, which are largely manufacturing by hand. Assembly can relate to technologically simple products like toys or sports goods and processing to the sewing of materials for clothing. Highly sophisticated elec-tronic products, such as iPhones, are also assembled in low-wage areas (see The role of global value chains in Chapter 5).
Over time with higher savings in these economies the capital–labour ratio will rise again, and jobs will move to locations with the lowest unit labour costs. But in the short run the impact in depressing prices of labour-intensive manufactures and in increasing com-petition among producers of such goods is substan-tial. Thus product fragmentation through the spread of global and domestic production networks allows the retention of manufacturing jobs in industry seg-ments where such jobs might otherwise have been lost through substitution through process innovation.
Spatial distribution and clusteringStructural change and the move from low to high tech are driven by the way firms are distributed spatially and able to collaborate and cluster. Geographical prox-imity between producers as a means of maximizing spillovers and other external effects, like labour avail-ability, has received prominence in discussions relating to agglomeration effects and provides a rationale for creating special economic zones and related measures to encourage firms to cluster. A higher level of popula-tion density is positively associated with a higher level of manufacturing employment for 15 of 16 industries (see Figure 3.22 in Chapter 3). Key potential advan-tages for a firm being close to other producers are:• Access to a pool of skilled labour drawn to the area
by the presence of similar firms.
• Spillovers though the sharing (or copying) of tech-nological or marketing knowledge and the sharing of access to equipment and other facilities.
• Joint learning and developing of innovations through continuous interaction and working on the same problem.
• Opportunities for jointly marketing products and benefiting from buyers that can source all product from one location.
• A network of specialist suppliers drawn to the area by enough user firms near the suppliers to reduce transport costs, to help ensure timely delivery and to reduce coordination difficulties.A distinction has been drawn between localization
(agglomeration) effects of clusters of similar producers and urbanization effects of clusters of diverse produc-ers. The hypothesis is that agglomeration effects are more important for standardized and mature indus-tries, while urbanization effects are more important for newer industries where producers in different subsectors but similar technological needs can benefit from the dynamic environment created by a diversity of activities (World Bank 2009).
In developed economies clusters of relatively small firms have been at the forefront of some break-through technologies (Audretsch 2002). Many small-firm innovations have been concentrated in fairly narrow areas (such as those around Boston and San Francisco in the United States). This tight localization has been put down to the critical impor-tance of tacit knowledge (see Box 4.3). Such an expla-nation for the United States has parallels in China, the Republic of Korea, Taiwan Province of China and Thailand. But even in activities not highly inno-vative, small firms in some developing countries – chiefly in Asia and Latin America – have found it advantageous to group in clusters. Sectors include footwear (Brazil and Mexico), metalworking, sim-ple engineering and electronics (India), textiles (India and the Republic of Korea), surgical goods (Pakistan), furniture (Indonesia) and software devel-opment (India, Uruguay and more recently Kenya; Weiss 2011).
99
Co
st a
nd
su
PP
ly-s
Ide
st
ru
Ct
ur
al C
ha
nG
e d
rIv
er
s
4
“Agglomeration effects associated with
clusters can be an important driver for
development and structural change in industry
Empirical work reveals a raft of experiences among 10 clusters in low- and lower middle-income countries (UNIDO 2009). Collaboration between firms varies greatly from the casual exchange of tools and infor-mation to direct collaboration in sharing orders and training. In some cases clear specialization emerges with some firms as parts and components suppliers to other cluster-based firms; in others growing firms cease to rely on external suppliers and start to make some of the components they need. In some clusters social networks and cultural cohesion remain impor-tant; in others these are replaced by impersonal mar-ket relationships with external agents or traders stimu-lating links between firms.
Successful clusters allow small firms to expand and increase employment and even larger and more technologically sophisticated firms may benefit from being in a cluster. Yet success depends partly on the wider economic climate as well as firm-specific charac-teristics and the operating environment. In reviewing the evidence on clusters in Africa, Dinh et al. (2012) suggest that only the cluster in Mauritius has been an unqualified success for employment and growth. They highlight problems: targeting of inappropriate activities for the cluster, poor choices of location, poor infrastructure inside and outside the cluster, imple-mentation difficulties and lack of long-term policy credibility for continued support.
The success of special economic zones in East Asia, particularly China, as an institutional arrangement to support clusters has been well documented. But such success with zones elsewhere has been mixed – espe-cially disappointing in Africa. Sonobe and Otsuka (2011), contrasting experiences in Africa and Asia, find that Africa’s clusters are mainly “survival clus-ters” generating low incomes and lacking innovation and dynamism. They suggest that successful clusters are based on “multi-faceted innovation” that incorpo-rates improvements in product quality, branding, use of reliable input suppliers and effective distribution, combined with an appropriate management system to allow cluster-based firms to control stocks, labour and financing. Developing the argument further using
case studies, Sonobe, Higuchi and Otsuka (2012) regard a shortage of managerial capacity as one of the distinguishing features of unsuccessful clusters, espe-cially in Africa.
The conclusion is that agglomeration effects asso-ciated with clusters can be an important driver for development and structural change in industry if the manufacturing process can be segmented and if opti-mal low-cost production opportunities can be found in different locations.
Business environment: a basic driver for structural changeThe business environment has been highlighted as a key influence on enterprise growth and employment – for example, by World Development Report 2005 (World Bank 2005). The investment climate has been defined as “the many location-specific factors that shape the investment opportunities and incentives for firms to invest productively, create jobs and expand” (World Bank 2005, p. 2). It covers aspects of regula-tion and corruption linked to the cost of doing busi-ness, as well as broad issues like the quality of infra-structure, the skill base, the difficulty of accessing sources of finance and aspects of the labour market – all crucial in low-income economies.
The effectiveness of the court system in enforcing contracts is important, particularly once countries reach a threshold per capita income. At lower incomes where transactions may be less complex, a weak legal system can be replaced by personal relationship-based transactions that enable business development. But at all country incomes it appears that risk of expropria-tion of a firm’s profits through informal payments and bribes is a negative influence on growth.9 Small firms have been found to be more hindered by regulations than medium-size and large enterprises, for which access to finance and good-quality infrastructure are more important (Aterido, Hallward-Driemeier and Pagés 2007).
Barriers to entry such as minimum capital requirements, delays in obtaining permits and mul-tiple procedures have been shown to have negative

100
Co
st a
nd
su
PP
ly-s
Ide
st
ru
Ct
ur
al C
ha
nG
e d
rIv
er
s
4
“Governments, working alongside the private
sector, can help use key drivers, such as wages,
technology, and education and skills, to change
manufacturing industry and so boost employment
generation while transforming the economy
effects on start-up numbers and productivity. They are expected to have the most deleterious impact in frontier sectors (where technological change is most rapid) and in sectors where natural barriers to entry (for example, due to initial investment requirements) are relatively low (Djankov 2009). There is evidence that modest changes to the business environment have little impact on firm behaviour, particularly in highly regulated environments, and that reforms undertaken as a package have a stronger impact than reforms undertaken independently or sequen-tially (Klapper and Love 2010). A common example in the context of combining reforms relates to the removal of the investment licensing system in India, where a positive growth and employment effect was only found in states with less restrictive labour mar-kets (Aghion, Algan and Cahuc 2008; Aghion et al. 2008).
Poor infrastructure is a major constraint on employment growth in low-income economies, par-ticularly for export activities, as shown in a wide range of survey data. Infrastructure can drive structural change in industries through the costs they cause. But in less developed countries it is simply the existence (or absence) that shapes change in industries. From surveys of firms in Bangladesh, China, Ethiopia and Pakistan, measures of infrastructure (such as power losses and days to install a telephone line) dominate business environment indicators in an analysis of firm performance (Dollar, Hallward-Dreimeier and Mengistae 2005).
Recent analysis based on the large database cre-ated by the World Bank Enterprise Surveys reveals that aspects of the investment climate are important for employment growth across manufacturing firms in different size categories and countries. Controlling for these characteristics, Aterido and Hallward-Dreimeier (2010) find that employment growth in low-income countries is significantly related to reduced power outages and access to finance. Measured corruption and regulation (as proxied by management time spent with officials) have no significant impact on industrial development.
Dinh, Mavridis and Nguyen (2010) used the same large database to assess the most binding constraint on employment growth. They asked respondents to rate different constraints on a scale of 1 (minor) to 4 (severe). Overall labour regulation appeared as only a minor obstacle with electricity, taxation, corruption and access to finance the most severe.10
In conclusion, while regulations and control may impede growth in manufacturing in some circum-stances, particularly in low-income Sub-Saharan countries, they are less central than the quality of infrastructure and the system of financial inter-mediation. More generally, governments, working alongside the private sector, can help use key driv-ers, such as wages, technology, and education and skills, to change manufacturing industry and so boost employment generation while transforming the economy.
Notes1. For example, Manyika et al. (2012) suggest they
are most important in the category of labour-intensive tradables, which are activities with a high labour intensity (up to 35 hours per $1,000 of value added) where price competition is strong and the ability to respond to market trends quickly is critical. For developing countries as a group, labour-intensive tradables are estimated at 10 percent of value added.
2. To be wholly accurate, comparisons such as these should use long-run equilibrium real exchange rates to convert local wage costs to a common for-eign currency. These World Bank efficiency cal-culations test for the effect of real exchange rate changes.
3. Private returns to education are calculated based on incremental earnings. They normally exceed estimated social returns because in most coun-tries individuals do not meet the full costs of their education. Wider externalities from education are difficult to incorporate in these calculations.
4. This argument applies less to Latin American economies where educational attainment is
101
Co
st a
nd
su
PP
ly-s
Ide
st
ru
Ct
ur
al C
ha
nG
e d
rIv
er
s
4relatively high but natural resource–based exports are a fairly high proportion of total exports. Similarly, Bangladesh and Pakistan also appear to be exceptions, where export expansion has been based on relatively low-skill products; see Machin and van Reenen (1998).
5. The diffusion of ICT still varies considerably even between higher income economies; see Castaldi et al. (2009).
6. Conte and Vivarelli (2005) found robust and sig-nificant evidence that R&D increases the likeli-hood of introducing product innovation.
7. Bogliacino, Piva and Vivarelli (2012) using a panel of European firm data find a positive employment effect of R&D in these sectors but not in techno-logically more mature manufacturing sectors.
8. In three two-digit branches (18, 31, 33) average firm size is highest in lower middle-income coun-tries as opposed to low-income countries; even in the latter in 11 of 18 branches, average firm size has fallen since the early 1980s.
9. Beck, Demirguc-Kunt and Levine (2005) find that speed of courts in resolving disputes has no impact on firm performance while managerial time spent dealing with regulators and bribes paid has a negative effect. Similarly, Acemoglu and Johnson (2005) find protection from expro-priation (what they term “property rights insti-tutions”) always to be statistically significant in explaining firm performance.
10. This analysis covers nearly 40,000 establishments in 98 countries.

102
Chapter 5
Trade and foreign direct investment as external drivers of structural change
Trade in manufactured goods is a key driver of struc-tural change through four mechanisms: revenues from trade (generating resources for high-tech investments); pressure from buyers (accelerating learning and pro-ductivity); access to technology; and imports of capital goods.
But trade liberalization has not enhanced struc-tural change in all regions: while East Asia has become one of the most important manufacturing production networks, aided by liberalization, Latin America has seen deindustrialization and growth-reducing struc-tural change in the 1990s and 2000s.1 In East Asia industrial policies were key to transform opportuni-ties coming from the global market into structural change–driven industrialization. But as the outcome of trade openness policies can be so different depend-ing on the effectiveness of state intervention, a sample of 44 countries on different continents offered only modest empirical evidence of a strong relationship between trade openness and structural change.
Trade openness is thus an opportunity – and a threat for low-income countries. Excessive specializa-tion in low-tech manufacturing may be a risk if these countries have too much exposure to international markets, which increases volatility of export revenues and presents a consequent higher risk of non-sustained growth. Countries with a diversified manufacturing portfolio and the capacity to produce high-tech goods with few competitors, reflecting a high level of past structural change, are better equipped to absorb this risk.
The impact of trade openness on employment generation through manufacturing structural change is mediated by two mechanisms: labour-saving tech-niques and the extent of mechanization of production processes; and whether developing country exports are facing demand from buying countries that can-not be sustained in the long run. But the negative impact on employment of manufacturing structural change based on labour saving or volatile demand can
be compensated for by industrial policies that achieve one or more of the following: ensuring that output growth in higher productivity sectors is strong enough to make up for the downward effects of employment growth; diversifying business activities towards more (highly productive) sectors and thus broadening the range and volume of total output; and leading to pro-ductivity changes that significantly stimulate local economic activity through multiplier effects.
Global value chains (GVCs) now underpin inter-national trade. A country’s production structure is determined by its ability to join, stay part of or move up GVCs, and technological upgrading is the best long-term strategy for preserving a country’s participa-tion in them. Still, despite growing product fragmen-tation and increasing international trade, the role of GVCs may be narrower in the future because of physi-cal limits to product fragmentation and transaction costs.
Structural change can work to derail any “race to the bottom”, where firms in rich countries are tempted to relocate to low-income countries with lower labour costs, less restrictive labour laws and weaker monitor-ing of labour conditions and environmental impacts. Governments – especially in low- and middle-income countries – should steer trade to stimulate produc-tivity through knowledge diffusion, research and development (R&D) and learning-by-doing spillover effects. Bilateral investment treaties and multilateral cooperation can help ensure that cross-border invest-ment and trade are conducive to low-income countries (see Chapter 9).
Finally, as with trade openness, foreign direct investment (FDI) is not a one-way bet: it can be a major force in promoting manufacturing structural change through diversifying production and exports, gener-ating spillovers, creating more backward and forward linkages and improving local business conditions (see Box 9.1 in Chapter 9). Yet only when it is properly inte-grated with local economies can they reap the benefits.

103
tr
ad
e a
nd
For
eIG
n d
Ire
Ct In
ve
st
Me
nt a
s e
xt
er
na
l dr
Ive
rs
oF s
tr
uC
tu
ra
l Ch
an
Ge
5
“An increase of trade openness is a growth
opportunity for a country only if local resources
can be deployed in adequate quantities to
produce goods for the external market
Trade as a likely driver of structural changeDemand for manufactured goods from advanced countries represented the engine of growth in East Asia and many other developing regions adopting an export-led structural change approach. Expanding trade increases business opportunities for low- and middle-income countries. As pointed out by Freund (2009), the elasticity of trade to income rose from 1.77 in the 1960s to 3.69 in the 2000s, but not all develop-ing countries outside East Asia took advantage of the market expansion.
Weiss (2005) suggested several factors conducive to structural change based on trade openness:• Manufactures face an initial stage of import sub-
stitution when domestic production can capture the market served by imports.
• Growth of manufacturing output is more valuable at the margin than the same growth of agricul-ture or services, due to externalities and dynamic increasing returns to scale.
• Export-oriented growth may lead to further FDI and growth.
• Exporting exposes firms to foreign competition, technology and marketing, leading to productivity gains that would not be obtained from sales on the domestic market.Trade in turn improves technology and productiv-
ity in four main ways. First, the increase in revenues from trade integration induces exporters to upgrade technology (Bustos 2011). Second, it exposes firms to forms of competition not present in the domestic market. Third, it improves quality standards and raises the efficiency of production processes to international levels as foreign suppliers exert pressure over domes-tic suppliers (Weiss 2005). Fourth, it provides access to advanced capital equipment and R&D, and thus knowledge, as modern technologies are produced by a few developed economies. Empirical studies present evidence of this (such as Coe and Helpman 1995).
But trade cannot be the only driver of structural change, according to much theoretical work and anec-dotal evidence. Even Wacziarg and Welch (2008),
who argued that that open trade regimes experienced average annual growth about 1.5 percentage points faster after than before liberalization, acknowledge that trade openness works only if countries have the right business conditions. Political stability, commit-ment to trade policies, the non-existence of counterac-tive policies and the right macroeconomic conditions are all factors that may help make trade liberalization a success. The creation and strengthening of institu-tions protecting property rights, maintaining macro-economic stability, regulating market participants and managing conflicts are also essential to boost tech-nological upgrading and productivity (Rodrik 2001). Ocampo and Taylor (1998) add that an increase of trade openness is a growth opportunity for a country only if local resources can be deployed in adequate quantities to produce goods for the external market. Domestic production capabilities have to be already in place in order to respond to international competition, improve technology and exploit trade opportunities from increased liberalization.
In sum, the literature suggests that trade liberaliza-tion is not a precondition for structural change, and that its impact depends on the economic context and quality of industrial policies.
When trade worksIn 1960 the Republic of Korea was poorer than many countries in Sub-Saharan Africa. It now leaves African countries far behind. Most explanations of the wider East Asian “growth miracle” stress export orienta-tion and structural change towards high-tech exports, which climbed steeply during 1985–1998 (Table 5.1).
Beyond trade openness, industrial policy also played a crucial role in the East Asian miracle, steer-ing structural change through manufactured exports. Many governments in the region implemented poli-cies to improve the competitiveness of firms and pro-mote export-led growth. They provided credit through state-supported banks, restricted competition from imports, constrained new domestic competitors and developed export-marketing institutions (Stiglitz and Charlton 2006).

104
tr
ad
e a
nd
For
eIG
n d
Ire
Ct In
ve
st
Me
nt a
s e
xt
er
na
l dr
Ive
rs
oF s
tr
uC
tu
ra
l Ch
an
Ge
5
“Domestic production capabilities have to be
already in place in order to respond to international
competition, improve technology and exploit trade
opportunities from increased liberalization
When trade does not workPieper (1998) argues that Brazil formally started implementing trade liberalization policies in 1990. Until then its manufacturing sector absorbed labour with employment growth rates above the national average at about 4 percent a year, associated with negative annual rates of productivity growth. After trade liberalization manufacturing stopped absorbing labour, and gains in manufacturing productivity were associated with overall growth stagnation.
Jobs released from the restructuring of industry prompted by trade liberalization in Latin America (and in Africa) created two different negative mecha-nisms. First, the excess labour was absorbed by less-productive activities, such as agriculture and the informal sector (or even fed into unemployment), and for this reason the contribution of structural change to productivity was negative (Figure 5.1). Second, especially in poor countries, structural change often moved activities towards sectors with a low labour intensity (albeit with a high productivity) such as min-ing and quarrying. In poor countries with a mining sector that has weak links to the rest of the economy, few people are employed with very high labour pro-ductivity – labour productivity is 136 times larger in mining than in agriculture in Malawi, for example (McMillan and Rodrik 2011).
Cimoli and Katz (2003) argue that these fac-tors, alongside undervalued exchange rates, may have
hampered Latin America’s attempts to upgrade its industrial value chain through liberalizing its trade poli-cies. The region’s economies failed to secure a sustainable pattern of technological accumulation or a narrowed productivity gap with the United States and Europe.
McMillan and Rodrik (2011) identify several fac-tors that cause structural change to either enhance or
Economy
Resource-based Low tech Medium tech High tech
1985 1998 1985 1998 1985 1998 1985 1998
Korea, Rep. of 8.6 10.7 41.4 21.0 37.2 38.5 12.8 29.8
Taiwan Province of China 9.9 5.5 52.9 30.4 21.1 27.5 16.2 36.6
Singapore 43.5 14.1 8.6 7.0 23.4 18.7 24.5 60.2
Malaysia 53.7 16.7 8.0 11.0 11.4 20.3 26.9 52.1
Thailand 37.9 19.3 35.4 25.3 22.0 20.5 4.7 34.8
Philippines 56.0 7.2 24.1 14.5 0.9 10.9 11.0 67.4
Indonesia 75.2 38.8 15.5 33.0 6.4 18.5 3.0 9.7
Hong Kong SAR China 3.2 4.5 63.0 56.3 19.1 13.2 14.8 26.0
Source: Lall 2000.
Table 5.1 Share of manufactured exports by technological classification, 1985 and 1998 (percent)
Figure 5.1 Decomposition of productivity growth by region, 1990–2005
High income
Asia
Africa
Latin Americaand the Caribbean
–2 20 4
WithinStructural change
Percentage points
Note: High income comprises Denmark, Finland, Italy, Japan, the Netherlands, Spain, Sweden, the United Kingdom and the United States. Source: Adapted from McMillan and Rodrik (2011).

105
tr
ad
e a
nd
For
eIG
n d
Ire
Ct In
ve
st
Me
nt a
s e
xt
er
na
l dr
Ive
rs
oF s
tr
uC
tu
ra
l Ch
an
Ge
5
“The rigidity of the labour market reduces the
absorption of released labour when trade openness
pushes non-competitive firms out of the market
hamper growth and employment. The larger the share of agricultural employment, for example, the larger the opportunities for growth-enhancing structural change, as many people can be shifted from lower to higher productivity activities. Similarly, policies to overvalue the exchange rate may also be beneficial, stimulating export diversification and growth. Conversely, special-ization in the production and export of commodities does not represent an incentive to upgrade, while the rigidity of the labour market reduces the absorption of released labour when trade openness pushes non-com-petitive firms out of the market.
Some evidence about the trade openness–structural change relationshipTo garner some evidence about this complex relation-ship, data for the openness of trade in manufacturers (expressed as the ratio between manufactured imports and exports and GDP) and for structural change2 (expressed as the value added in high-tech manufac-turing divided by the value added in medium-tech and low-tech manufacturing) was plotted for 44 countries for 1997 and 2007 (Figures 5.2–5.5). All figures are
divided into quadrants by a horizontal and a vertical line representing the average structural change index and the average trade openness index in the sam-ple in 1997 and 2007 for four continents (Asia, the Americas, Africa and Europe).
The relationship between trade openness and structural change is in fact weak. A regression analysis between structural change and trade openness with the 1997 and 2007 data revealed a statistically insignificant relationship, even though the data suggested the exist-ence of a positive correlation (0.17 in 1997 and 0.19 in 2007).3 Countries are scattered in all four segments of the trade openness/structural change diagram.
The upper-left quadrant encompasses countries that were successful in upgrading their economies towards high-tech manufacturing and that are not heavily exposed to trade in manufactures, as such trade (exports plus imports normalized by GDP) rep-resents a share of national GDP below the average. This group includes the Republic of Korea (see Figure 5.2) and the United States (see Figure 5.3), with high production of capital-intensive sectors and fairly low exposure to trade openness.
Figure 5.2 Manufacturing trade openness and structural change index, Asia
1997 2007
0 1 2 30
1
2
3
China
Hong Kong SAR China
India
JapanKorea, Rep. Malaysia
MongoliaOman
Singapore
Turkey
0 1 2 30
2
4
6
China
Hong Kong SAR China
India
JapanKorea, Rep.
Kuwait
Malaysia
Mongolia
Singapore
Turkey
OmanKuwait
Stru
ctur
al c
hang
e in
dex
Manufacturing trade openness
Stru
ctur
al c
hang
e in
dex
Manufacturing trade openness
Source: UNIDO estimate based on UN (2013a), UNCTAD (2013a) and UNIDO (2012a).

106
tr
ad
e a
nd
For
eIG
n d
Ire
Ct In
ve
st
Me
nt a
s e
xt
er
na
l dr
Ive
rs
oF s
tr
uC
tu
ra
l Ch
an
Ge
5
“No Latin American countries upgraded
their industrial production despite the
increasing trade openness over time
The lower-right quadrant includes economies with high levels of trade openness but manufacturing struc-tural change and upgrading below the average. Hong
Kong SAR China belongs to this category between 1997 and 2007 (see Figure 5.2). Despite relocating light labour-intensive manufacturing industries to
Figure 5.3 Manufacturing trade openness and structural change index, Americas
1997 2007
0.0 0.2 0.4 0.60.0
0.5
1.0
1.5
United States
CanadaMexico
Costa Rica
Chile
Uruguay
Ecuador
0.00 0.25 0.50 0.750.0
0.5
1.0
1.5
United States
Canada
Mexico
Costa Rica
Chile
Uruguay
Ecuador
Stru
ctur
al c
hang
e in
dex
Manufacturing trade openness
Stru
ctur
al c
hang
e in
dex
Manufacturing trade openness
Source: UNIDO estimate based on UN (2013a), UNCTAD (2013a) and UNIDO (2012a).
Figure 5.4 Manufacturing trade openness and structural change index, Africa
1997 2007
0.00 0.25 0.50 0.75
Ethiopia
Malawi
Morocco
Tanzania
Senegal
0.00
0.25
0.50
0.75
0.00 0.25 0.50 0.75
Ethiopia
Malawi
Morocco
Tanzania
Senegal
0.00
0.25
0.50
0.75
Stru
ctur
al c
hang
e in
dex
Manufacturing trade openness
Stru
ctur
al c
hang
e in
dex
Manufacturing trade openness
Source: UNIDO estimate based on UN (2013a), UNCTAD (2013a) and UNIDO (2012a).

107
tr
ad
e a
nd
For
eIG
n d
Ire
Ct In
ve
st
Me
nt a
s e
xt
er
na
l dr
Ive
rs
oF s
tr
uC
tu
ra
l Ch
an
Ge
5
“Excessive specialization in low-
tech manufacturing may represent a
risk if countries are too exposed to the
international market through trade
China during the 1980s encouraged by rising labour and rent costs, Hong Kong SAR China still remains an economy with prominent printing, food and tex-tile industries within the manufacturing sector, even though the services sector is now predominant in the overall economy.
The lower-left quadrant brings together low-income countries characterized by a low degree of trade openness, reflected in economic isolation, and low structural change. The countries in this group include Ethiopia, Malawi and the United Republic of Tanzania (see Figure 5.4). Their position in the lower-left quadrant also reflects their low capacity to exploit international business opportunities.
The upper-right quadrant includes Malaysia and Singapore, which are highly exposed to trade openness and have succeeded in upgrading their economies with a very competitive high-tech industry (see Figure 5.2).
No Latin American countries upgraded their industrial production despite the increasing trade openness over time (see Figure 5.3). Among the high-income countries, those in Southern Europe such as Italy and Spain downgraded theirs to below
the average structural change index (see Figure 5.5). Countries in Eastern Europe are quite varied, with Poland and the Russian Federation having low trade openness and low structural change, and the Czech Republic and Hungary having high trade openness and high structural change (see Figure 5.5).
Over 1997–2007 both the average structural change index and trade openness index increased (from 0.48 to 0.61 and from 0.52 to 0.61, respectively), indicating that over 10 years the 44 countries became more successful in implementing structural change and on average more interconnected globally.
If the evidence on the relationship between struc-tural change and trade openness is ambiguous, the data are clearer in showing that excessive specializa-tion in low-tech manufacturing may represent a risk if countries are too exposed to the international mar-ket through trade. Concentration in a few categories of manufactured goods (or commodities) increases the volatility of export revenue and generates a higher risk of stop-start economic growth. This latter risk is reduced if countries have heavily changed their structure, as countries producing goods with a high
Figure 5.5 Manufacturing trade openness and structural change index, Europe
1997
0.00 0.25 0.50 0.75 1.00
Stru
ctur
al c
hang
e in
dex
Manufacturing trade openness
0.0
0.5
1.0
1.5
Sweden
Macedonia, FYR
LatviaRomaniaPortugal
Russian FederationPoland
Norway
Italy
Spain
France
Finland
Austria
Czech Rep.
SloveniaHungaryBulgaria
0.0 0.5 1.0 1.5
Stru
ctur
al c
hang
e in
dex
Manufacturing trade openness
0.0
0.5
1.0
1.5
Macedonia, FYR
Latvia
Romania
Greece
Portugal
Russian Federation
Italy
Spain
Austria
Bulgaria
HungarySweden
France
United Kingdom
Norway
Finland
Czech Rep.
SlovakiaSlovenia
2007
SlovakiaPoland
Denmark
United Kingdom
Denmark
Greece
Source: UNIDO estimate based on UN (2013a), UNCTAD (2013a) and UNIDO (2012a).
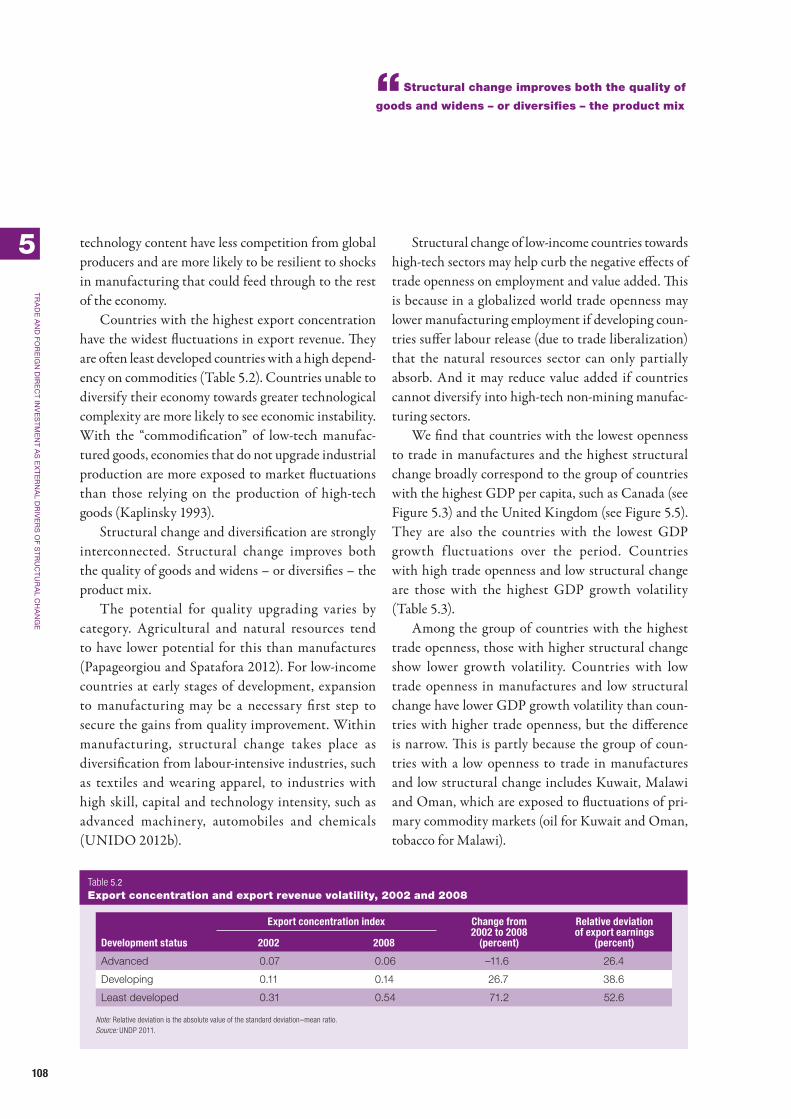
108
tr
ad
e a
nd
For
eIG
n d
Ire
Ct In
ve
st
Me
nt a
s e
xt
er
na
l dr
Ive
rs
oF s
tr
uC
tu
ra
l Ch
an
Ge
5
“Structural change improves both the quality of
goods and widens – or diversifies – the product mix
technology content have less competition from global producers and are more likely to be resilient to shocks in manufacturing that could feed through to the rest of the economy.
Countries with the highest export concentration have the widest fluctuations in export revenue. They are often least developed countries with a high depend-ency on commodities (Table 5.2). Countries unable to diversify their economy towards greater technological complexity are more likely to see economic instability. With the “commodification” of low-tech manufac-tured goods, economies that do not upgrade industrial production are more exposed to market fluctuations than those relying on the production of high-tech goods (Kaplinsky 1993).
Structural change and diversification are strongly interconnected. Structural change improves both the quality of goods and widens – or diversifies – the product mix.
The potential for quality upgrading varies by category. Agricultural and natural resources tend to have lower potential for this than manufactures (Papageorgiou and Spatafora 2012). For low-income countries at early stages of development, expansion to manufacturing may be a necessary first step to secure the gains from quality improvement. Within manufacturing, structural change takes place as diversification from labour-intensive industries, such as textiles and wearing apparel, to industries with high skill, capital and technology intensity, such as advanced machinery, automobiles and chemicals (UNIDO 2012b).
Structural change of low-income countries towards high-tech sectors may help curb the negative effects of trade openness on employment and value added. This is because in a globalized world trade openness may lower manufacturing employment if developing coun-tries suffer labour release (due to trade liberalization) that the natural resources sector can only partially absorb. And it may reduce value added if countries cannot diversify into high-tech non-mining manufac-turing sectors.
We find that countries with the lowest openness to trade in manufactures and the highest structural change broadly correspond to the group of countries with the highest GDP per capita, such as Canada (see Figure 5.3) and the United Kingdom (see Figure 5.5). They are also the countries with the lowest GDP growth f luctuations over the period. Countries with high trade openness and low structural change are those with the highest GDP growth volatility (Table 5.3).
Among the group of countries with the highest trade openness, those with higher structural change show lower growth volatility. Countries with low trade openness in manufactures and low structural change have lower GDP growth volatility than coun-tries with higher trade openness, but the difference is narrow. This is partly because the group of coun-tries with a low openness to trade in manufactures and low structural change includes Kuwait, Malawi and Oman, which are exposed to fluctuations of pri-mary commodity markets (oil for Kuwait and Oman, tobacco for Malawi).
Export concentration index Change from 2002 to 2008
(percent)
Relative deviation of export earnings
(percent)Development status 2002 2008
Advanced 0.07 0.06 –11.6 26.4
Developing 0.11 0.14 26.7 38.6
Least developed 0.31 0.54 71.2 52.6
Note: Relative deviation is the absolute value of the standard deviation–mean ratio.Source: UNDP 2011.
Table 5.2 Export concentration and export revenue volatility, 2002 and 2008

109
tr
ad
e a
nd
For
eIG
n d
Ire
Ct In
ve
st
Me
nt a
s e
xt
er
na
l dr
Ive
rs
oF s
tr
uC
tu
ra
l Ch
an
Ge
5
“A more productive economy encourages
additional demand for services and industrial
products, which generates profitable investment
opportunities and a growing demand for labour
Thus two lessons emerge from the coefficients of variation for 1997–2007:• Countries with the highest openness to trade in
manufactures experience the highest fluctuations of GDP growth.
• Given a certain degree of openness to trade in manufactures (high or low), higher structural change helps stabilize economic performance.
Trade, structural change and employment creationThe impact of trade-based industrial structural change on employment is not straightforward. As discussed in the previous chapter, manufacturing stimulates struc-tural change and employment through productivity growth, which is derived from specialization, learning and agglomeration economies, as well as from econo-mies of scale. As labour and capital move into higher productivity activities, average productivity increases. A more productive economy encourages additional demand for services and industrial products, which generates profitable investment opportunities and a growing demand for labour (UNCTAD 2010a).
Two important mechanisms may, however, con-strain employment generation (ILO 2012): labour-saving techniques and mechanization are increas-ingly becoming substitutes for human labour. Even in developing countries endowed with abundant labour relative to capital, technology transferred to them is often labour saving as it reflects the market conditions of technology-exporting advanced countries. Thus, the opportunity to absorb labour in manufacturing may be cut off prematurely (discussed in Skill-biased technological change in Chapter 4). Further, structural shifts have been based on export-led strategies and continuing global demand, often bolstered by a rise in debt in many developed nations, which is unsustain-able in the long run.
To ensure that trade is positive for employment generation, government policies will need to ensure that:• Output growth in the higher productivity sectors
is strong enough to make up for the downward effect of productivity growth (UNCTAD 2010a).
• Diversification expands business activities of developing countries towards high-productivity sectors so that the scope and volume of output can be increased.
• Changes of productivity stimulate local economic activities through multiplier effects.An increase of exports of developing countries may
stimulate direct effects (additional labour demand to produce output), indirect effects (additional labour demand for intermediate inputs) and induced effects (additional production and labour deriving from the increase of household spending). Chen et al. (2012) report that for every $1,000 of Chinese total exports in 2007, domestic value added estimated at $591 and employment at 0.096 person-years (Table 5.4).
The role of global value chains
Global value chains and structural changeChapter 4 showed that structural change is driven by the extent to which firms can segment the produc-tion process and locate production to minimize unit
Groupa
Coefficient of variation (standard deviation/average)b
Group 1: High structural change/low openness to trade in manufacturesc 0.3
Group 2: Low structural change/low openness to trade in manufacturesd 0.9
Group 3: High structural change/high openness to trade in manufacturese 1.0
Group 4: Low structural change/high openness to trade in manufacturesf 1.2
a. Structural change and trade openness data for 2007 were used.b. As a first step the aggregate group GDP as a sum of countries GDP in each group was calculated. Then annual growth rates for each group were calculated.c. Canada, China, Denmark, Finland, France, Japan, the Republic of Korea, Mexico, Norway, Sweden, the United Kingdom and the United States.d. Chile, Ecuador, Ethiopia, Greece, India, Italy, Kuwait, Malawi, Morocco, Oman, Poland, Portugal, Romania, the Russian Federation, Senegal, Spain, the United Republic of Tanzania, Turkey and Uruguay.e. Austria, the Czech Republic, Hungary, Malaysia, Singapore, Slovakia and Slovenia.f. Bulgaria, Costa Rica, Hong Kong SAR China, Latvia, the Former Yugoslav Republic of Macedonia and Mongolia.Source: UNIDO estimate based on UN (2013a), UNCTAD (2013a) and UNIDO (2012a).
Table 5.3 Coefficients of variation of GDP growth rates in different economy groups, 1997–2007

110
tr
ad
e a
nd
For
eIG
n d
Ire
Ct In
ve
st
Me
nt a
s e
xt
er
na
l dr
Ive
rs
oF s
tr
uC
tu
ra
l Ch
an
Ge
5
“Technological upgrading represents the best
long-term strategy for protecting and promoting
a country’s participation in global value chains
production costs. Thus product fragmentation has local and global dimensions – this subsection focuses on the global dimensions.
International trade has surged since the 1960s, far outpacing growth in GDP and becoming more frag-mented since the 1980s. Domestic content accounts for only about half the total exports of the most important manufacturing country, China, and even less (18 percent) of its processed exports (Koopman, Wang and Wei 2008). China’s exports in intermedi-ate goods are growing faster than those of other Asian countries, and China is emerging not only as the cen-tre of production but also as a leading processing hub in the region, being a prominent participant in global value chains (see Figure 2.7 in Chapter 2). Developing countries take advantage of GVCs because the increase in demand for intermediate goods and services creates opportunities for new firms and categories of work-ers to move into more complex and innovative activi-ties (Sturgeon and Memedovic 2010). For this reason trade in intermediate goods is usually considered a
good proxy for the size of GVCs. Global imports of intermediate goods are stable at more than 50 percent of the total (Figure 5.6).
Beyond traditional competitiveness drivers (pro-duction costs), a country’s competitiveness can now be measured on its capacity to join, stay in and move up a GVC (Box 5.1). Technological upgrading – characterized by dynamic movement along the value chain towards production stages with higher growth potential that leads to structural change improve-ments – represents the best long-term strategy for protecting and promoting a country’s participation in GVCs (Cattaneo et al. 2013). East Asian firms in the apparel market upgraded along the GVC with the shift from input assembly to original brand-name manufacturing, where firms design and sell their own branded products (Gereffi and Memedovic 2009).
But GVCs also pose challenges to firms in devel-oping countries, the most important of which is that trade is unlikely to maintain its dynamism, as there are physical limits and transaction costs to product fragmentation. Elasticity of trade to income seems to have peaked in the 1990s (Table 5.5).
Manufacturing subsector Employment multiplier
Food products 0.24
Textile and apparel 0.19
Sawmills and furniture 0.17
Papers and products 0.10
Chemicals 0.06
Non-metal mineral products 0.29
Metals smelting and pressing
0.13
Metals products 0.07
Common and special equipment
0.07
Transport equipment 0.07
Electric and electronic products
0.05
Other manufacturing products
0.12
Total for Chinese exports 0.10
Source: Chen et al. 2012.
Table 5.4 Effects of $1,000 of Chinese exports to the world, free on board, on total employment by sector, 2007 (person-years)
Figure 5.6 Share of intermediate goods in global imports, 1990, 2000 and 2011
Consumption goods
Intermediate goods
Other goods
Capital goods
Percent
0 20 40 60
199020002011
Source: UNIDO estimate based on UN (2013a).

111
tr
ad
e a
nd
For
eIG
n d
Ire
Ct In
ve
st
Me
nt a
s e
xt
er
na
l dr
Ive
rs
oF s
tr
uC
tu
ra
l Ch
an
Ge
5
“But global value chains also pose
challenges to firms in developing countries,
the most important of which is that trade
is unlikely to maintain its dynamism
Other issues are that product differentiation on variety and quality matters less to non-high-income consumers than price. Consequently, the usual inten-sity of standards (public and private) in GVCs is going to be much less pronounced.4 And given that emerg-ing economies often have a comparative advantage in processing themselves, they will probably have a pref-erence for importing relatively unprocessed products and may thus limit upgrading options for low-income
countries that seemed to open up through the rise of GVCs in the past. Two case studies – one for cassava in Thailand and one for timber in Gabon – confirm that a market shift from the European Union to China has led to a decrease in the importance of standards and lower value addition in source countries (Kaplinsky and Farooki 2010).
Globalization may also cause global structural change because of re-balancing. China and the United
International best practice shows, that the identification
of high-growth potential value chains and their promotion
can be a fundamental driver for inclusive and sustainable
growth.
In Malaysia the palm oil sector has notably contrib-
uted to the durable socioeconomic growth that over the
last 3 decades, with the generation of long-term jobs and
balanced revenue distribution, increased national value-
added and export revenues.
the rapid expansion of oil palm in the 1960s was
encouraged by Malaysia’s government, which recognized
its potential as a complementary crop to rubber.
“the oil palm is the world’s most efficient oil- bearing
crop in terms of land utilization and productivity. a hectare
of cultivated oil palm land can supply about 10 and 5 times
more oil than a soybean or rapeseed hectare, respectively.
whether further improvements occur in the agronomic
performance of the palm or the nutritional property of
palm oil, the crop’s future depends on innovation through
research and development” (May 2012).
the main palm product exported until the 1970s was
crude palm oil. at that time taxation and incentive policies
were introduced to encourage the export of refined palm
products.
Malaysia currently accounts for 39 percent of world
palm oil production and 44 percent of world exports. on
average, the country produces 25 tonnes of palm oil a year
(5–6 percent of the GdP) of which 84 percent is exported
for more than $18 billion (60 percent of the total export
earnings). Currently, more than 1.4 million workers are
engaged in the palm oil sector, or 8 percent of the working
population.
one of the biggest producers and exporters of palm
oil and palm oil products, Malaysia has an important role
in fulfilling the growing global need for oils and fats sus-
tainably. with a head start of more than 100 years in the
oil palm business, Malaysia has a competitive advantage
and will continue to innovate with continuing support and
facilitation of agronomic research, technology transfer and
alliances with other centres of excellence to ensure the
industry’s sustainable development.
Malaysia – geographically small with scarce arable
land for new oil palm plantations – continues to increase
planter productivity and competitiveness through a
nationwide replacement of unproductive palms with high-
yielding hybrids. the exercise includes replanting on lands
owned by independent smallholders who contribute to
14 percent of the area under oil palm in Malaysia.
Malaysia’s example of supporting palm oil value
chains demonstrates how identifying and developing
value chains with high growth and employment potential
can be an effective policy tool for ensuring inclusive and
sustainable socioeconomic growth in the long run.
Source: Industrial Development Report 2013 Team.
Box 5.1 Value chains development as an effective policy tool for promoting inclusive and sustainable growth: Malaysia’s palm oil value chain
1950–1959 1960–1969 1970–1979 1980–1989 1990–1999 2000–2009
World trade to income elasticity 1.62 1.54 1.31 1.19 2.82 1.42
Source: Fontagné and Fouré 2013.
Table 5.5 World trade to income elasticity, selected years, 1950–2009

112
tr
ad
e a
nd
For
eIG
n d
Ire
Ct In
ve
st
Me
nt a
s e
xt
er
na
l dr
Ive
rs
oF s
tr
uC
tu
ra
l Ch
an
Ge
5
“Technologically successful recipient
economies built up capabilities to apply, adapt and
modify foreign technologies, either in partnership
with foreign firms or by copying from them
States account for huge shares of global imbalances. There is widespread agreement that the current imbal-ances are unsustainable and that United States will reduce imports while China will increase consumer spending. As the import content and absolute value of Chinese consumption is lower than that of US house-holds, this could affect exports and growth in low- and middle-income countries (UNCTAD 2010a; Mayer 2011).
For all these reasons implementing industrial poli-cies to encourage firms to join, stay in and move up a GVC is not easy (see Chapter 7). The wide dispersion of productivity among businesses, the large number of unsustainable micro-enterprises and the stagnation of some larger firms suggest that the rapid growth of transition economies and East Asian countries in past decades will not be repeated in most developing coun-tries (World Bank 2013a).
So, how do low-income countries take advantage of GVCs? Steps include encouraging the highest inte-gration possible between the business systems of the low-income countries and the GVC; promoting tra-ditional approaches (skill upgrading and vocational training, improving the business environment and aid for trade interventions for potential entrepreneurs in developing countries); and tackling “spoilers” – opera-tors who are reluctant to change (WEF 2013). These operators include companies with high sunk costs or that depend on supply-chain barriers (like goods or services replaceable by alternative high-tech offerings). These constraints and lack of coordination could all hold back low- and middle-income countries from advancing along GVCs. That would be a huge loss: the 30 developing economies that successfully inte-grated in GVCs and showed the highest participation rates grew almost five times faster than the 30 bottom countries (UNCTAD 2013b).
Global value chains and technological changeThe spread of global production networks based on a subdivision of the production process has had impor-tant implications for how technology is transferred
and applied in importing developing countries. The technology transfer model of the 1960s and 1970s involved either FDI or transfer of foreign technology under licence. Technologically successful recipient economies built up capabilities to apply, adapt and modify foreign technologies, either in partnership with foreign firms or by copying from them. National support systems helped for R&D investment, training and various forms of subsidy, particularly in the most successful East Asian cases – the Republic of Korea, Singapore and Taiwan Province of China.
The newer form of technology transfer based on production networks has been termed technology “lending”, with international firms providing their technology to produce parts needed for other elements of their global operations. In this interpretation indus-trialization has been made both “easier and faster” but at the same time “less meaningful” (Baldwin forth-coming). Before the 1980s, export success required a deep industrial base – a network of domestic suppli-ers and technological mastery. In the new era, firms in developing countries can link to international produc-tion networks and draw on the technological and mar-keting prowess of the lead firms in these chains.
One crucial effect of the new system is that much of the technology lent is specific to the lead firm and has tight intellectual property protection to pre-vent imitation. So once firms in developing coun-tries are committed to GVCs, they risk finding it far harder than their predecessors in East Asia did to move through the various stages of own equipment manufacture. Their precursors worked with the lead firm from design, to manufacturing with their own designs, to finally breaking into world markets with their own brand. Many observers, such as Kaplinsky (2005), have commented on the risk that globalization is creating a distinction between “headquarter econo-mies”, where lead firms are based, where technology originates and where manufacturing profits are high, and “factory economies”, where there is little technical innovation and where wages and profits are low.
In economies where this process of product frag-mentation has played a major role, employment

113
tr
ad
e a
nd
For
eIG
n d
Ire
Ct In
ve
st
Me
nt a
s e
xt
er
na
l dr
Ive
rs
oF s
tr
uC
tu
ra
l Ch
an
Ge
5
“Trade is likely to have a positive
impact on skilled labour but a negative
impact on unskilled workers
growth in export manufacturing is likely to have con-tributed to rising inequality due to a relative rise in the demand for skilled labour (as discussed above). In developed economies the offshoring of lower produc-tivity tasks raises the possibility of higher wages for the remaining jobs in manufacturing as the average productivity of those workers remaining in employ-ment increases, again widening wage differentials with the rest of the economy.
Trade, particularly through the import of goods that embody new skill-intensive technologies, appears to have played an important role in increasing income inequality by raising the relative wage of skilled work-ers and increasing the premium attached to further education. Importantly, however, the relation between trade and inequality holds for trade between middle-income technology-importing countries and high-income countries, but not for trade between low-income countries and high-income countries nor for trade between low-income countries as a group.
Impact of trade in manufactures on employment qualityAs seen at the start of this chapter, trade of manufac-tured goods may drive technological change and pro-ductivity. Economic theory postulates that productiv-ity drives wages. So trade can improve employment
quality through the productivity effect. Endogenous growth models providing theoretical foundations have largely focused on two types of technologi-cal change: R&D and learning-by-doing spillover effects (Grossman and Helpman 1991; Romer 1990; Box 5.2).
The literature has empirical evidence supporting the argument that trade improves skills and produc-tivity through knowledge diffusion. Brazil started to liberalize trade in the 1990s, and exports and imports grew after 2000. Over the same period rela-tive demand for skilled labour increased substantially. Technological transfer from richer countries upgraded the skills of Brazilian manufacturing firms (Araújo, Bogliacino and Vivarelli 2009).
Trade is likely to have a positive impact on skilled labour but a negative impact on unskilled workers. Evidence from six manufacturing sectors in Tunisia shows that unskilled workers are vulnerable to trade as they face increasing competition in the output market. Skilled labour is better positioned because the increase in market opportunities in skill-intensive markets derived from additional trade openness outweighs substitution possibilities for this category of worker (Mouheli and Ghazali 2012).
Rodrik (1997) identifies three main impacts of lib-eralization on the international labour market. First,
Coe and helpman (1995) provide a theoretical and empiri-
cal background on the relationship between trade and
spillovers. they estimate that foreign research and devel-
opment has beneficial effects on domestic productivity,
and that these are stronger the more open an economy is
to foreign trade. developing countries will be able to enjoy
technology spillovers based on their capability to absorb
technological change. short geographical distance, short
technological distance (expressed as a similar distribution
of patenting among different technologies) and linguis-
tic and trade-bloc relations all encourage technological
transfer. the flow of knowledge is more likely to occur
between leader innovators (verdolini and Galeotti 2011).
the notion of learning by doing derives from the con-
cept of the “learning curve”, which reflects the observation
that with greater “experience” (cumulative production)
there is a decline in the unit costs of new technologies
(arrow 1962). trade also stimulates learning by doing, and
most of the technical and managerial innovations made
in high-income countries may be adopted by low-income
countries (young 1991). the positive externalities of cost
discovery are also important, especially for entrepreneurs.
If a project is successful, other entrepreneurs learn that
they can make the product. In this way benefits to the first
mover spread to the overall industry (hausmann, hwang
and rodrik 2006). this imitation process may help low-
income countries transition to higher value-added sectors
and increase their demand for skilled labour.
Source: Industrial Development Report 2013 Team.
Box 5.2 Research and development and learning-by-doing spillover effects from trade

114
tr
ad
e a
nd
For
eIG
n d
Ire
Ct In
ve
st
Me
nt a
s e
xt
er
na
l dr
Ive
rs
oF s
tr
uC
tu
ra
l Ch
an
Ge
5
“As with trade, FDI does not automatically
generate growth and beneficial structural change
workers in the North have to accept lower labour standards and benefits, given poorer wages and con-ditions in competing countries (the race to the bot-tom). Second, greater openness leads to a more volatile labour market, which widens wage inequalities within groups and increases insecurity among workers. Third, given that workers are substitutable, the bargaining power of trade unions declines.
The effect of the race to the bottom is seen in the Global Wage Report 2010–2011 (ILO 2011b). It shows a decrease of the manufacturing wage share over 1990–2007 – that is, before the global financial crisis, as wages rose less quickly than manufacturing value added (profits rose more quickly; Figure 5.7).
The race to the bottom would be unlikely ever to lead to positive structural change, except in those countries where low-productivity, low-wage jobs repre-sent the only alternative to unemployment. But some low-income countries could take advantage of the race. In recent decades Asian countries have increased their share of world merchandise exports to more than
30 percent, attracting employment by offering a more competitive business environment such as through lower wages, while other countries (including those in South Asia and Sub-Saharan Africa) were unable to raise their merchandise export share, which remained below 5 percent (Figure 5.8). However, China’s ris-ing wages could help Sub-Saharan Africa increase its manufacturing jobs. Lin (2011) argues that China will free up 85 million labour-intensive manufactur-ing jobs, compared with Japan’s 9.7 million in the 1960s and the Republic of Korea’s 2.3 million in the 1980s, due to wage increases in the coming years. Africa, the continent with the lowest GDP per capita, has only around 10 million manufacturing jobs and could thus gain from changes in China’s wages and competitiveness.
Foreign direct investment: a potentially key driverAs with trade, FDI does not automatically generate growth and beneficial structural change. It affects the
Figure 5.7 Change in wage shares in manufacturing
–30
–20
–10
0
10
20
30
Chan
ge in
wag
e sh
are
(per
cent
age
poin
ts)
Long-term trendShort-term change (since 2007)
Icelan
d (19
90–2008
)
Franc
e (19
90–2008
)
Korea
, Rep
. (199
0–2008
)
United
King
dom (1
990–20
08)
Spain
(199
0–2008
)
Belgium
(199
0–2008
)
Slove
nia (1
995–20
08)
Polan
d (19
94–2008
)
Eston
ia (19
93–20
08)
Irelan
d (19
90–2008
)
Hunga
ry (19
92–20
08)
Norway
Denmark
Greece
Czech R
ep. (1
993–20
08)
Austria
Netherl
ands
Slova
kia (1
993–20
09)
Swed
enItaly
German
y
Finlan
d
Luxem
bourg
Mexico
(199
0–2007
)
Canad
a (19
90–2005
)
United
State
s (19
90–2007
)
New Ze
aland
(199
0–2006)
Austra
lia (19
90–2007
)
Portu
gal (1
990–20
06)
Japa
n (19
90–2006)
Positive changes since 2007
Negative changessince 2007
No recent data
Source: ILO 2011b.
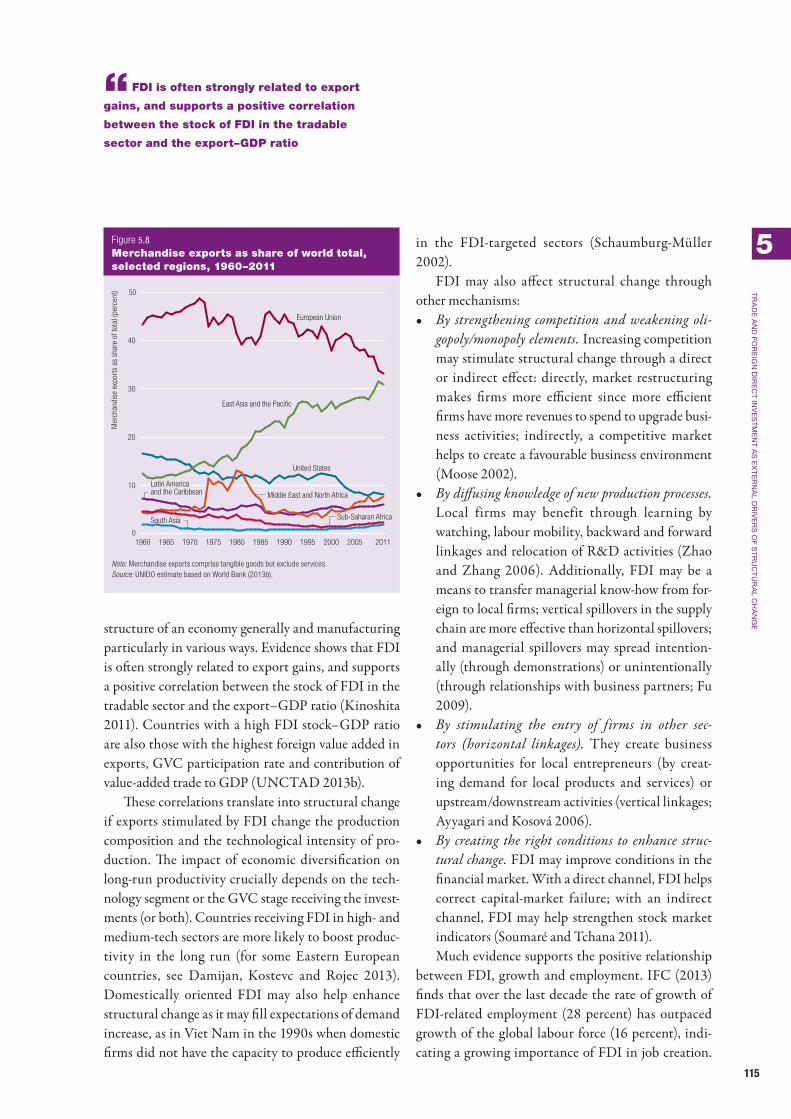
115
tr
ad
e a
nd
For
eIG
n d
Ire
Ct In
ve
st
Me
nt a
s e
xt
er
na
l dr
Ive
rs
oF s
tr
uC
tu
ra
l Ch
an
Ge
5
“FDI is often strongly related to export
gains, and supports a positive correlation
between the stock of FDI in the tradable
sector and the export–GDP ratio
structure of an economy generally and manufacturing particularly in various ways. Evidence shows that FDI is often strongly related to export gains, and supports a positive correlation between the stock of FDI in the tradable sector and the export–GDP ratio (Kinoshita 2011). Countries with a high FDI stock–GDP ratio are also those with the highest foreign value added in exports, GVC participation rate and contribution of value-added trade to GDP (UNCTAD 2013b).
These correlations translate into structural change if exports stimulated by FDI change the production composition and the technological intensity of pro-duction. The impact of economic diversification on long-run productivity crucially depends on the tech-nology segment or the GVC stage receiving the invest-ments (or both). Countries receiving FDI in high- and medium-tech sectors are more likely to boost produc-tivity in the long run (for some Eastern European countries, see Damijan, Kostevc and Rojec 2013). Domestically oriented FDI may also help enhance structural change as it may fill expectations of demand increase, as in Viet Nam in the 1990s when domestic firms did not have the capacity to produce efficiently
in the FDI-targeted sectors (Schaumburg-Müller 2002).
FDI may also affect structural change through other mechanisms:• By strengthening competition and weakening oli-
gopoly/monopoly elements. Increasing competition may stimulate structural change through a direct or indirect effect: directly, market restructuring makes firms more efficient since more efficient firms have more revenues to spend to upgrade busi-ness activities; indirectly, a competitive market helps to create a favourable business environment (Moose 2002).
• By diffusing knowledge of new production processes. Local firms may benefit through learning by watching, labour mobility, backward and forward linkages and relocation of R&D activities (Zhao and Zhang 2006). Additionally, FDI may be a means to transfer managerial know-how from for-eign to local firms; vertical spillovers in the supply chain are more effective than horizontal spillovers; and managerial spillovers may spread intention-ally (through demonstrations) or unintentionally (through relationships with business partners; Fu 2009).
• By stimulating the entry of firms in other sec-tors (horizontal linkages). They create business opportunities for local entrepreneurs (by creat-ing demand for local products and services) or upstream/downstream activities (vertical linkages; Ayyagari and Kosová 2006).
• By creating the right conditions to enhance struc-tural change. FDI may improve conditions in the financial market. With a direct channel, FDI helps correct capital-market failure; with an indirect channel, FDI may help strengthen stock market indicators (Soumaré and Tchana 2011).Much evidence supports the positive relationship
between FDI, growth and employment. IFC (2013) finds that over the last decade the rate of growth of FDI-related employment (28 percent) has outpaced growth of the global labour force (16 percent), indi-cating a growing importance of FDI in job creation.
Figure 5.8 Merchandise exports as share of world total, selected regions, 1960–2011
20112005200019951990198519801975197019651960
Mer
chan
dise
exp
orts
as
shar
e of
tota
l (pe
rcen
t)
East Asia and the Pacific
Sub-Saharan Africa
Middle East and North Africa
South Asia
European Union
United States
0
10
20
30
40
50
Latin Americaand the Caribbean
Note: Merchandise exports comprise tangible goods but exclude services.Source: UNIDO estimate based on World Bank (2013b).

116
tr
ad
e a
nd
For
eIG
n d
Ire
Ct In
ve
st
Me
nt a
s e
xt
er
na
l dr
Ive
rs
oF s
tr
uC
tu
ra
l Ch
an
Ge
5
“FDI is not a “silver bullet”. While it is often
linked to growth of capital and technology,
spillovers to local economic development do
not always spread to the whole economy
The World Investment Report 2013 finds a strong and positive relationship between FDI and GDP growth (UNCTAD 2013b).
Despite this evidence FDI is not a “silver bullet”. While it is often linked to growth of capital and tech-nology, spillovers to local economic development do not always spread to the whole economy. For example, countries with rich natural resources but low quality of governance rarely show structural change (te Velde 2006), a point underlined in Table 5.6: Africa and least developed countries with the lowest GDP per capita have the biggest share of FDI in the primary sector (UNCTAD 2013b) – where backward and for-ward linkages are typically very weak.
Honing in on a single country, in Costa Rica over 1997–2005 foreign investment in offshoring activities contributed to the expansion of skilled, productive and well-paying jobs, reflecting business by Intel and other high-tech companies. But offshoring activities did not integrate well with the overall economy, par-ticularly manufacturing – and such integration is key to maximizing FDI’s beneficial impact on growth and employment (Ernst and Sánchez-Ancochea 2008).
Large, newly established and highly productive domestic firms seem more likely to benefit from FDI (Amendolagine et al. 2013). This means that FDI often provides most benefits to highly productive firms rather than to those needing to upgrade through technology, thus increasing inequality and offering little impact on structural change. So, for technology
transfer to trickle down to domestic firms through FDI, governments need to promote local firms that can initially adopt and adapt technology from FDI, and support the development of domestic production linkages and networks, in which initial adopters play a conduit role in disseminating the foreign technology vertically and horizontally to related firms.
Notes1. In this chapter we use trade liberalization, trade
openness and export orientation almost as syno-nyms. Some analysts question whether East Asian countries really liberalized and increased trade openness as they adopted trade protectionist measures, and for this reason they prefer to call them export oriented. Trade openness is a broader concept than trade liberalization as it incorpo-rates liberalization of FDI, remittances and the wider financial market. As the most common measure of trade openness (ratio of exports plus imports to GDP) and the scientific and policy debate do not always capture these nuances, we prefer to acknowledge this distinction but use these terms interchangeably.
2. For simplicity and for consistency with the rest of the report we call this index “structural change”, even though it represents the orientation of the manufacturing production towards high-tech sectors (stock variable) rather than properly struc-tural change (flow variable). The two variables are
Region/development-level grouping Primary Manufacturing Services
Africa 15.98 44.57 39.45
East and South-East Asia 0.25 47.84 51.92
South Asia 11.69 54.65 33.66
West Asia 1.11 42.08 56.80
Latin America and the Caribbean 8.06 47.32 44.62
Transition economies 6.49 45.19 48.32
Developed economies 4.05 38.26 57.69
Least developed countries 20.12 30.33 49.56
Source: UNIDO estimate based on UNCTAD (2013b).
Table 5.6 Greenfield projects by industry, 2012 (percent)

117
tr
ad
e a
nd
For
eIG
n d
Ire
Ct In
ve
st
Me
nt a
s e
xt
er
na
l dr
Ive
rs
oF s
tr
uC
tu
ra
l Ch
an
Ge
5strongly correlated as countries with the high-est orientation towards high-tech sectors are those that implemented structural change more intensely over time.
3. For this regression we exclude Singapore as an outlier and excluded it from the dataset.
4. See Private sustainability standards in Chapter 9.

118
Chapter 6
Structural change and manufacturing employment in a resource-constrained world
Sustainable development rests on economic develop-ment, social advancement and environmental protec-tion. The concept has been ensconced in policy for decades, but translating it into action remains a chal-lenge, which for industry means producing goods and services that do not harm the natural environment but that improve living standards. The paradigm of continually increasing demand for finite resources to support economic growth, alongside worsening envi-ronmental degradation, must be shifted in the coming years.
The rate of this demand increase may well be set to rise too, with the rapid expansion of emerg-ing markets and an estimated additional 3 billion middle-class consumers in the next 20 years (Kharas 2010). In recent years global material consump-tion has grown at around 3 percent a year, and so by 2050 could reach 140 billion tonnes of minerals, ores, fossil fuels and biomass a year, or about three times current levels (UNEP 2011a). In addition, this soaring demand takes place at a time when accessing and processing most of those resources has become more challenging and expensive (Dobbs et al. 2011). Wasteful production and consumption patterns – along with continuing soil degradation, deforesta-tion and overfishing – will result in increasing water shortages and escalating prices for food, energy and other commodities (ILO 2012). And along with climate change, they are increasingly constraining production. Environmental change is likely to accel-erate in the coming decades, no doubt affecting the underprivileged the most, as they depend the most on environmental capital and have the least means to adapt.
Resource efficiency thus has not been a major driver of structural change in the past – but must be so in the future. The paradigm of resource-intensive and highly polluting economic development is being ques-tioned. Some scholars argue that green-sensitive ideas may well cause a slowdown in the rate of structural
change and thus on employment. In this vein Dercon (2012) posits that environmental constraints may change the patterns of structural change with employ-ment and distributional effects that will not lead to sustained economic growth. The argument holds from the perspective of internalization of environmental externalities.
But efforts to promote resource efficiency find themselves at the intersection of economic, employ-ment and environmental policies. “Decoupling” nat-ural resource use and environmental impacts from economic activity is a concrete means to reconcile the policy imperatives of economic growth, and thus employment and environmental protection. Indeed, increased resource productivity lifts competitiveness, especially as resources often represent a significant share of production costs, especially in developing countries. It also supports employment, and undoubt-edly alleviates the burden on the environment.1
Green structural change – a move to green industry – will involve shifting to industries more technologically advanced and with higher labour and capital productivity, while improving resource productivity as a means of both boosting competi-tiveness and protecting the environment. Past abun-dance of relatively inexpensive natural resources, such as energy, water and materials, is coming to an end, and industries will need to restructure with demand for environmentally damaging goods fall-ing and for environmentally preferable goods rising. Green structural change will be influenced by factors related to resource constraints and environmental protection, as well as other cost and environmental considerations. As manufacturing industries tend to be resource intensive, cost considerations will focus on increasing resource productivity. Environmental considerations will arise from consumers looking for environmentally friendly products or from govern-ments aiming to reduce the environmental footprint of human activity.

119
st
ru
Ct
ur
al C
ha
nG
e a
nd
Ma
nu
FaC
tu
rIn
G e
MP
loy
Me
nt In
a r
es
ou
rC
e-C
on
st
ra
Ine
d w
or
ld
6
“Reconciling the legitimate aspirations for a
better life with environmental protection requires
a paradigm shift that decouples economic activity
from resource use and environmental impact
Reconciling the legitimate aspirations for a bet-ter life with environmental protection requires a paradigm shift that decouples economic activ-ity from resource use and environmental impact. Opportunities for decoupling will arise for enter-prises as they adapt to new prices and scarcities and as they get involved in new businesses that commer-cialize green goods and services, such as equipment for recycling or renewable energy, or specialized consult-ing services. Bettering resource efficiency will be the driver of green structural change underpinned by the uptake of new green technologies and a growing trade in environmental goods.
And green jobs will be created, arising from invest-ments in the areas of renewable energy, industrial energy efficiency, waste management and recycling, environmental services and, most important, new green technologies and products as countries move up the productivity and technological ladder.
Industrial greening: an emerging driverUNIDO refers to “green industry” as a pattern of industrial production and development that does not come at the expense of the health of natural systems and does not lead to adverse human health outcomes. It consists of an industrial system that does not require an ever-growing use of natural resources and pollution to fuel societal progress (Box 6.1).
Such a change is needed. In the recent past the abundance of relatively inexpensive natural resources, such as energy, water and materials, spurred economic development. The material throughput of the global economy and environmental pollution has followed similar trends (Figure 6.1). But there are strong indica-tions that this era is coming to an end, given increas-ing competition for resources. Also, from an environ-mental perspective, “planetary boundaries” are being overstepped (Rockström et al. 2009).
a green economy results in “improved human well-being
and social equity, while significantly reducing environ-
mental risks and ecological scarcities” (uneP 2010).
Closely related, “green industry” is a concept to address
global, interrelated challenges through a set of imme-
diately actionable cross-cutting strategies that take
advantage of market forces and emerging industries. It
contributes to a model of development that considers
resource constraints and the earth’s carrying-capacity
limits.
developing and transition countries have huge poten-
tial for pursuing green industry further – they are already
making heavy public and private investments to improve
resource productivity and reduce environmental impact
(in one of the worst manifestations, pollution) and secur-
ing the associated benefits of improved competiveness,
employment and environmental conservation.
Green structural change reflects the growing impor-
tance of shifting towards sectors – and within them,
activities – that efficiently use not only capital and labour
but also natural resources to minimize environmental
impact.
Source: Industrial Development Report 2013 Team.
Box 6.1 Green economy and green industry
Figure 6.1 Global trends in GDP, population and material use, 1980–2008
0
100
200
300
2008200019901980
Inde
x (1
980
= 1
00)
Physical trade
GDP
Material extraction and consumption
PopulationMaterial
productivity
Source: Dittrich et al. (2012) based on SERI (2012).

120
st
ru
Ct
ur
al C
ha
nG
e a
nd
Ma
nu
FaC
tu
rIn
G e
MP
loy
Me
nt In
a r
es
ou
rC
e-C
on
st
ra
Ine
d w
or
ld
6
“Resource scarcity and environmental factors
are constraining industrial production, leading to
adjustments at the enterprise and sector levels to
deal with resource-related risks and opportunities
This shift towards higher productivity and greener industries will entail economic restructur-ing. An overall increase in resource productivity and a decline in manufacturing’s intensity of pollution – other things being equal – would be key charac-teristics of green structural change. But for now material use and socioeconomic development are intertwined, to some degree at least: countries with the highest per capita manufacturing value added are those with the highest domestic material use (Figure 6.2). Still, material consumption has been increasing globally over the past few decades more slowly than GDP in all major regions of the world – that is, productivity of material use is increasing (Dittrich et al. 2012).
Increased demand and investment in greener products and services, as well as the equipment and infrastructure to produce them, will expand cer-tain industries and enterprises (ILO 2012). This will translate into higher labour demand and job creation (direct effect), mainly in green sectors (see Green manufacturing jobs below). In addition, due to inter-industry relations of the expanding industries,
other parts of the economy that supply inputs to the expanding green sectors will also benefit, creating additional employment (indirect effect), including employment in non-green sectors such as cement for green buildings or steel and carbon fibre for the blades and towers of wind turbines. The income generated by this additional economic activity is redistributed by spending on additional consumption and invest-ment across the economy, creating further employ-ment (induced effects), in addition to the direct and indirect jobs.
Factors at playThe empirical evidence is becoming more persuasive that resource scarcity and environmental factors are constraining industrial production, leading to adjust-ments at the enterprise and sector levels to deal with resource-related risks and opportunities (Dobbs et al. 2011). Job opportunities, especially those of the underprivileged, may decline if economic growth is constrained by physical or economic shortages (EU 2012).
The response – green structural change – is thus influenced by factors related to resource constraints and environmental protection, as well as to other external factors, classified as cost and environmental.
Cost considerations may well trigger a shift from resource- and pollution-intensive sectors, but independently from considerations related to resource conservation and environmental pro-tection. As manufacturing industries tend to be resource intensive, greater resource productivity is a key factor in competitiveness in its own right. For their part, environmental concerns will stimulate increased resource productivity in industrial activi-ties and reduce their environmental impact. They can trigger a self-induced structural shift towards greener manufacturing, to respond to increasing customer demand for resource-efficient products, for example. Or they can be prompted by targeted policy and regulatory interventions, such as phasing out subsidies for fossil fuels or banning incandes-cent light bulbs.
Figure 6.2 Correlation between per capita manufacturing value added and domestic material use, 2008
0 250 500 750 1,000
Dom
estic
mat
eria
l use
(ton
nes
per c
apita
)
Manufacturing value added per capita ($)
0
5
10
15
South Africa
Seychelles
Morocco
Egypt
Algeria
Sudan
Mali
SenegalEthiopia
Cameroon
Côte d’Ivoire
Malawi
TogoNigeriaKenya
Madagascar
Source: UNIDO estimate based on UNCTAD (2012b).

121
st
ru
Ct
ur
al C
ha
nG
e a
nd
Ma
nu
FaC
tu
rIn
G e
MP
loy
Me
nt In
a r
es
ou
rC
e-C
on
st
ra
Ine
d w
or
ld
6
“For sustainable industrial development,
industrial structure has to change towards
a direction that decouples economic activity
from resource use and environmental impact
Straddling the two sides are cases when the envi-ronmental burden has an internalized cost. Decreasing the cost of managing waste is best achieved by avoid-ing waste in the first place. Also, non-compliance with environmental regulations – when enforced – can have financial and operational consequences, includ-ing sanctions.
Adapting manufacturing capacity to this evolving context translates into two elements: reorienting exist-ing industries towards greener resources, processes, practices and products; and creating green industries (UNIDO 2011c).
The first element entails improving production efficiency, by using resources more efficiently and optimizing the productive use of natural resources; minimizing environmental impact by reducing the generation of waste and emissions and promoting the environmentally sound management of residual wastes; and minimizing health risks by managing chemicals safely.
The second reflects environmental technologies and services originating from the transition to a green economy, including companies that develop, manu-facture and install clean technologies for industrial, transport, buildings and automotive sectors. They also cover service industries, including material-recovery companies, recycling companies and waste- management, -treatment and -transport companies. Other examples are engineering companies special-izing in wastewater treatment, air pollution control and the manufacture of waste treatment equipment, as well as companies providing monitoring, measure-ment and analytical services.
DecouplingFor sustainable industrial development, industrial structure has to change towards a direction that decou-ples economic activity from resource use and environ-mental impact (Figure 6.3).
Decoupling may be viewed as relative, where production rises but the increase in resource use and environmental impact does not rise as quickly – and as absolute, where production can increase while
resource use and environmental impact fall. The world economy has already achieved a relative decoupling, extracting around 40 percent more economic value from each tonne of raw material than three decades ago. Still, these gains have been swamped by eco-nomic growth of 150 percent over the same period (Hinterberger et al. 2013).
Even though an abundant literature stresses that environmental protection bears a cost, a parallel lit-erature has emerged showing that green measures can provide economic and social benefits, including von Weizsäcker et al. (2009), who argue that gains in resource productivity in several economic sectors can lead to an 80 percent reduction of environmen-tal impacts per unit of economic output. Similarly Dobbs et al. (2011) observe that up to 30 percent of the resource demand in 2030 could be addressed by resource-productivity opportunities – and thus avoided in absolute terms.
Since the 1990s an academic discussion has emerged around the hypothesis of the “Environmental Kuznets Curve” (EKC).2 In this, the environmental impact first increases until reaching a given level of
Figure 6.3 Decoupling economic activity from resource use and environmental impact
Time
Human well-being
Economic activity (GDP)
Resource decoupling
Resource use
Impact decoupling
Environmental impact
Source: UNEP 2011a.

122
st
ru
Ct
ur
al C
ha
nG
e a
nd
Ma
nu
FaC
tu
rIn
G e
MP
loy
Me
nt In
a r
es
ou
rC
e-C
on
st
ra
Ine
d w
or
ld
6
“Aspirations for better socioeconomic
conditions can be reconciled with the
finite nature of natural resources and
the need to protect the environment
economic activity, before gradually decreasing by itself as economies mature (Azar, Holmberg and Karlsson 2002). The hypothesis is based on four assumptions (Stamm et al. 2009).
First, there is a tendency for the values to shift from welfare based on quantitative satisfaction towards higher preferences for environmental qual-ity. Better educated and informed agents tend to be more likely to take the environmental externali-ties into account before consuming, thus providing an incentive for manufacturers to adapt production patterns accordingly (Inglehart 1977). Second, as an economy develops, the composition of value addition changes, changing the pattern of resource use and environmental impact (Pasinetti 1983). Third, insti-tutions in higher income countries are more inclined to internalize environmental externalities and pro-vide adequate incentives. Fourth, more advanced and sophisticated businesses tend to apply technological innovations in production. Whether introduced to spur productivity or based on environmental con-cerns, these innovations often raise resource pro-ductivity and lower the intensity of environmental impact.
A vast body of work has tested this EKC hypoth-esis. Some studies have corroborated the existence of an EKC-like relationship with local pollutants, such as sulphur dioxide and nitrogen dioxide (Stern 2004), though the empirical evidence demonstrating the prevalence of EKC for other environmental indicators and at a broader scale is “scant, fleeting and fragile” (Carson 2010).
But even assuming that an EKC exists, passively waiting for the hypothetical turning point is no option, as it could coincide with a global level of pol-lution beyond the abortive capacity of the biosphere (Stamm et al. 2009). Also, the link between income and environmental impact at country level is blurred, due to the huge increase in international trade. Indeed, consumption might be delinked from production in a given country (Panayotou 2000).
The key thus lies in decoupling natural resource use and environmental impacts from economic
activity. In such a way, aspirations for better socioec-onomic conditions can be reconciled with the finite nature of natural resources and the need to protect the environment. This huge shift will require drastic structural changes, affecting employment positively (through opportunities for green jobs) as well as less benignly.
The opportunities will stem from two areas of adjustment. First, existing enterprises will need to adapt to the new circumstances, whether caused by more expensive raw materials or by policy incentives and disincentives, and so will require new skill sets and experience. Second, greener manufacturing will create a range of opportunities for businesses that commercialize green goods and services such as equip-ment for recycling or renewable energy, or specialized consulting services.
Some subsectors will undoubtedly see job losses, though the number should be manageable and small relative to shifts produced by other factors such as globalization or movement between enterprises (ILO 2012). Firms in more resource- or energy-intensive activities will no doubt lose competitiveness as well, but this is all the more reason for them to be look-ing forward. The same argument holds at the macro-economic level. Countries improving competitive-ness through measures to achieve greater resource efficiency will be well positioned in a resource-con-strained global economy: Figure 6.4 suggests that countries with lower energy intensive industry tend to add more value – and vice versa.
Countries that focus on moving towards cleaner and more sustainable industries have numerous field-proven instruments. At their core, strategy-planning, goal-setting and benchmarking have proved useful in identifying potential improvements. Benchmarking, which can raise awareness of resource productivity (or its lack), provides a tangible way to determine the resource or energy efficiency of a system, whether a process, company or nation. It compares actual energy and resource use against best available practice.
Despite the seemingly clear case for resource efficiency – environmentally or economically – major

123
st
ru
Ct
ur
al C
ha
nG
e a
nd
Ma
nu
FaC
tu
rIn
G e
MP
loy
Me
nt In
a r
es
ou
rC
e-C
on
st
ra
Ine
d w
or
ld
6
“Resource efficiency is the ratio between
resources required and desired output. So
resource productivity can be defined as the
efficiency with which energy or materials
are used to produce a given output
barriers remain to pushing through concrete measures. Central is access to financing. Many enterprises in developing countries, particularly small and medium-size ones, struggle to finance gains in resource produc-tivity and environmental performance. These invest-ments are crucial to any government strategy aimed at promoting industrial development, especially as small and medium-size enterprises often form the backbone of developing economies.
Resource efficiency as a driver of manufacturing structural changeResource efficiency is the ratio between resources required and desired output. So resource produc-tivity can be defined as the efficiency with which energy or materials are used to produce a given out-put. Increasing resource efficiency is appealing from a number of viewpoints: economic, given that resources often loom large in many developing countries’ manu-facturing output costs; and environmental, as fewer inputs should mean less pollution and less contamina-tion from wastage.
One school of thought draws attention to the potential negative impacts of restrictions on resource use and pollution on firms’ competitiveness, arguably jeopardizing jobs. Morgenstern, Pizer and Shih (2002) analysed job dynamics in four heavily polluting indus-tries in the United States (pulp and paper mills, plas-tic manufacturers, petroleum refiners, and iron and steel mills) and found that increased environmental spending generally did not cause a significant drop in employment. If anything, the change tended to be positive.
There is ample empirical evidence demonstrat-ing the positive influence of more efficient resource use on economic performance. For a sample of ISO 14001 certified companies in South-East Asia, Rao and Holt (2005) modelled the link between green supply-chain management practices and increased competitiveness on the one hand and improved economic performance on the other. They found a positive correlation between those dimensions. Similarly, Ilinitch and Schaltegger (1995) demon-strated that positive environmental performance
Figure 6.4 Manufacturing value added per capita and industrial energy intensity at the country level, 2010
Man
ufac
turin
g va
lue
adde
d pe
r cap
ita ($
thou
sand
s, lo
g sc
ale)
Industrial energy intensity (terajoules per $1,000 of manufacturing value added, log scale)
0.01
0.1
1
10
100
0.1 1 10 100
High incomeUpper middle incomeLower middle incomeLow income
Source: UNIDO estimate based on IEA (2013), UNIDO (2012a) and World Bank (2013b).

124
st
ru
Ct
ur
al C
ha
nG
e a
nd
Ma
nu
FaC
tu
rIn
G e
MP
loy
Me
nt In
a r
es
ou
rC
e-C
on
st
ra
Ine
d w
or
ld
6
“Steep gains in resource efficiency
require dedicated actions
could be associated with neutral or positive eco-nomic performance, in contrast to the often asserted negative effects.
Steep gains in resource efficiency require dedicated actions. Indeed, even in world regions characterized by limited economic growth and advanced innova-tion systems, signs of effective decoupling are fee-ble, perhaps due to the “rebound effect” (Sorrell and Dimitropoulos 2008). This refers to the behavioural or other systemic responses to the introduction of new technologies that increase the efficiency of resource use, thus potentially offsetting the benefits of the measures taken.
What some argue for is thus a qualitative leap in resource productivity, particularly in economies with high growth and weaker innovation. Huber (2000) looks to transformational, as opposed to incremen-tal, changes in industrial structures, which would require a shift from the predominant policy focus on improvement of labour and capital productivity towards resource productivity (see also Hinterberger et al. 2013).
By the mid-1990s thought leaders had already developed such a vision of drastic change. The “Factor 4” strategy outlined a world with double the wealth using half the natural resources in the coming decades (von Weizsäcker, Lovins and Lovins 1997). Based on this, and examining innovation in indus-try, the subsequent Factor Five described how to roll out measures leading to 80 percent improvements in resource and energy productivity, with a massive boost in wealth for billions of people (von Weizsäcker et al. 2009).
Uptake of green technologyTechnology will be essential in decoupling eco-nomic growth from the burdens on the environment. Ocampo (2011) stresses that the green transition entails a technological revolution, with fundamental impacts on production structures and consumption patterns. Yet technological change rarely takes place in a vacuum, and often requires incentives. Success stories of widespread penetration of new energy technologies
are the product of forward-thinking, ambitious gov-ernment policies.
Bursts of innovation are associated with cyclical economic development (Freeman and Perez 1988). From this perspective, Rifkin (2011) argues that we are entering an area of innovations related to sustain-ability, paving the way towards the “next great eco-nomic era” (Figure 6.5).
A logarithmic mean Divisia index technique is applied to investigate the green technological uptake using carbon dioxide emissions reduction as a proxy of environmental impact. Using the I = PAT model, where the human impact on the environment is assumed to be a function of the population, economic activity (affluence) and technology, it is possible to cal-culate to what extent the variation of manufacturing carbon dioxide emissions depends on the variation of emission intensity, energy productivity, value added per capita and population:
Ei,t Popi,t= *MVAi,t
Popi,t*
Eneri,t
MVAi,t*
Ei,t
Eneri,t
,
where E represents manufacturing carbon dioxide emissions, MVA is manufacturing value added, Pop is total population and Ener is manufacturing energy.
The calculation was applied to 45 countries with data on all these variables over 2001–2010, and Figure 6.6 shows the outcome of the decomposition of manufacturing carbon dioxide emissions. Global manufacturing carbon dioxide emissions rose 40 per-cent. The decomposition indicates that at the global level all components – population, value added per capita, energy intensity and emissions intensity – contributed positively to that increase. By con-trast, considering high-income countries separately, where manufacturing emissions fell 11 percent, all determinants contributed to the decrease with the notable exception of population, which is inversely correlated.
In Brazil, the Russian Federation, India, China and South Africa (BRICS) where manufacturing emissions rose 109 percent, the emission intensity rose only slightly while energy intensity declined a

125
st
ru
Ct
ur
al C
ha
nG
e a
nd
Ma
nu
FaC
tu
rIn
G e
MP
loy
Me
nt In
a r
es
ou
rC
e-C
on
st
ra
Ine
d w
or
ld
6
“The increase in manufacturing value added per
capita explains most of the increase in emissions,
reflecting the shift in materials production to
developing countries, particularly to the BRICS
little. Interestingly, the increase in manufacturing value added per capita explains most of the increase in emissions, reflecting the shift in materials production
to developing countries, particularly to the BRICS (Banerjee et al. 2012). As far as low-income countries are concerned, where carbon dioxide manufactur-ing emissions climbed 16 percent, the decomposi-tion indicates that much of that increase is due to increased manufacturing activity and a rising popula-tion. The emission intensity of manufacturing energy fell sharply, a trend that can be interpreted as a sign of gains in manufacturing processes and greater use of green technology.
Low-income countries account for a small share of global emissions, though the likely growth of their economic activity will no doubt add to emissions, offset to a degree (on the current pattern) by the uptake of green technology. Applying the “best avail-able technologies” as industries develop represents a unique opportunity for low-income countries. Large investments, particularly in heavy machinery, have an impact over several decades, as switches of existing plant are few and refurbishing costly. So cleaner tech-nologies offer promising prospects to boost industry’s competitiveness in these countries.
For green structure change, knowledge and innovation – including technologies – represent key
Figure 6.6 Decomposition of manufacturing carbon dioxide emissions, 2001–2010
Emissions intensity
Energy intensity
Value added per capita
Population
Percent
–300 –200 –100 0 100 200 300
High incomeBRICSLow incomeAll
BRICS is Brazil, the Russian Federation, India, China and South Africa.Source: UNIDO estimate based on IEA (2013), UNIDO (2012a) and World Bank (2013b).
Figure 6.5 Waves of innovation
202019901950189018451785
Inno
vatio
n
1st waveIron
Water powerMechanization
TextilesCommerce
6th waveSustainability
Radical resource productivityBiomimicry
Green chemistryIndustrial ecologyRenewable energy
Green nanotechnology
5th waveDigital networksBiotechnology
Softwareinformation technology
4th wavePetrochemicals
ElectronicsAviationSpace
3rd waveElectricityChemicals
Internal combustion engine
2nd waveSteam power
RailroadSteel
Cotton
Source: Adapted from Hargroves and Smith (2005).

126
st
ru
Ct
ur
al C
ha
nG
e a
nd
Ma
nu
FaC
tu
rIn
G e
MP
loy
Me
nt In
a r
es
ou
rC
e-C
on
st
ra
Ine
d w
or
ld
6
“Governments in all countries will need to
carry out policies to continue strengthening
green technological change by encouraging
profitable opportunities as industries go green
assets. Schumpeter identified innovation as the criti-cal dimension of economic change (Pol and Carroll 2006). Recent changes in intellectual property rights are due to the increase of cross-border exchanges in terms of goods and services, but also to structural changes in economies, with knowledge becoming an important tradable asset (Curtis 2012).
With intellectual property rights associated with private sector investment, strengthening such regimes would imply greater opportunities for firms to com-pound their position (Lesser 1998). But some studies indicate that developing countries with low human capital might not benefit from strengthening intel-lectual property rights (Bravo-Ortega and Lederman 2010). Indeed, such action could have a negative effect on domestic innovation, particularly where it is mostly based on imitation or adaptive in nature (Schneider 2005).
In the next few decades governments in all countries will need to carry out policies to continue strengthening green technological change by encour-aging profitable opportunities as industries go green (UNIDO 2011b).
Trade and green structural changeAll major world regions already export environmental goods (Figure 6.7), demonstrating the ready market for such products. As an illustration, about 9 percent of the retail price of high-efficiency refrigerators in Spain can be considered a price premium, representing a third of the cost of saved energy over the appliance’s life (Galarraga, Heres and Gonzalez-Eguino 2011). An expanded environmental market could generate international spillovers by reducing production costs for low-income countries exporting to high-income economies (Cantore 2009).
Under the global regime for mitigating climate change, industrialized countries are bound to targets for reducing greenhouse gas emissions, theoretically enabling developing countries to grow in two ways (Gerlagh and Kuik 2007): a reduction of fossil fuel demand in high-income countries cuts the global price of energy, raising demand for energy and thus growth in developing countries; or environmental policies in high-income countries encourage industries to relo-cate to developing countries, where constraints are looser.
Figure 6.7 Exports of green and “close-to-green” goods and services as a share of GDP, 2000, 2005 and 2010
High incomeDevelopingaverage
South AsiaSub-SaharanAfrica
Middle East andNorth Africa
Latin America andthe Caribbean
Europe andCentral Asia
East Asia andthe Pacific
Perc
ent
200020052010
0
5
10
15
20
Source: Adapted from Dutz and Sharma (2012) based on data from the Organisation for Economic Co-operation and Development’s list of environmental six-digit Harmonized System categories and UN (2013a).

127
st
ru
Ct
ur
al C
ha
nG
e a
nd
Ma
nu
FaC
tu
rIn
G e
MP
loy
Me
nt In
a r
es
ou
rC
e-C
on
st
ra
Ine
d w
or
ld
6
“Structural change towards a service-
focused society, as in industrialized
countries, does not necessarily imply a
global reduction of resource use
Reduced emissions in high-income countries would thus be partly offset by increased emissions in developing countries, a variant of “carbon leakage”. This occurs when one country increases its carbon dioxide emissions because a second country with a strict climate policy has reduced its emissions, though the literature shows little evidence of the size of the long-term leakage effects.
The prospect of carbon leakage gave rise to pro-posals for border taxes based on the embodied carbon content of goods imported from develop-ing countries. But such schemes are rarely effective and are hard to set up. Some scholars find that the border tax adjustments have little impact on reduc-ing carbon leakage and protecting economic com-petitiveness (Antimiani et al. 2011; McKibbin and Wilcoxen 2009). Cosbey (2008) further raises issues of compliance with international trade agreements, as well as other legal and institutional issues. Also, border tax does not hold the comparison with con-sumption taxation, which, besides being simpler to implement, implies a more efficient allocation of resources across the life cycle and thus an arguably more equitable proposition from the perspective of developing countries.
Structural change towards a service-focused society, as in industrialized countries, does not nec-essarily imply a global reduction of resource use, because resource- and pollution-intensive industries in developing countries are producing goods for wealthier countries (Stamm et al. 2009). For this reason data based on domestic production provide a highly skewed picture as they disregard embod-ied resources and emissions in imported goods and services, especially in a world where manufacturing production is shifting to industrializing and devel-oping countries.
Consumption-based accounting helps reorient the picture: covering international trade and transport, it encapsulates all emissions related to global consump-tion (Peters 2008). Consumption-based invento-ries draw on total global emissions for the economic consumption of a country, rather than the economic
activity of the producing country. This has obvious implications for the political economy of environmen-tal protection, as current regimes in the realm of cli-mate change are based on production-based environ-mental impact.
Green manufacturing jobs
An approach rather than a definitionGreen jobs have no single and universally accepted definition, although typical characteristics are that they reduce consumption of energy and raw materials; limit greenhouse gas emissions; minimize waste and pollution; protect and restore ecosystems; and ena-ble enterprises and communities to adapt to climate change (ILO 2013).
The quality of employment often features, and the literature frequently incorporates, social consid-erations such as “decent work” (Renner, Sweeney and Kubit 2008, for example). Such considerations involve opportunities for work that is productive and deliv-ers a fair income, security in the workplace and social protection for families, better prospects for personal development and social integration, freedom for peo-ple to express their concerns and organize and partici-pate in the decisions that affect their lives, and equal-ity of opportunity and treatment for all women and men (ILO 2013).
Some commentators distinguish between green jobs and environment-related employment. Varma (2010) argues that to be called green, environment-related jobs must meet acceptable standards on wages, gender and working conditions, and suggests that green jobs account for only about a quarter of all environment-related jobs.3 But as Pollin (2009) has noted, an absence of a clear-cut definition should not stand in the way of actions to promote green jobs.
Estimates of current jobsAs industries that provide environmental goods and services continue to expand – reflecting a combination of growing green demand, increasingly stringent laws

128
st
ru
Ct
ur
al C
ha
nG
e a
nd
Ma
nu
FaC
tu
rIn
G e
MP
loy
Me
nt In
a r
es
ou
rC
e-C
on
st
ra
Ine
d w
or
ld
6
“Skilled jobs in energy and environmental
services, the smart application of information
and communications technologies, repair and
maintenance, and substitute and recycled
materials will be in greater demand
and agreements and a growing focus on resource effi-ciency, productivity and competitiveness – so too does demand for cleaner technologies, less risk to the envi-ronment and better resource management (including recycling and resource recovery; UNIDO 2011b).
But pinning down job numbers is a challenge, not least for the methodological and definitional reasons suggested above (see, for example, Bowen 2012). Statistics rarely capture self-employment or the informal economy, especially in developing countries where reliable and comprehensive data are scarce.
Still, the literature abounds with estimates for green jobs, and usually suggests that numbers are increasing steadily (for example, Renner, Sweeney and Kubit 2008). It may also claim that tens of millions of green jobs have been created worldwide, with a growth surge over the past few years, notably in renewable energy and ecosystem services, such as forestry (ILO 2012).
Many sector-specific studies estimate numbers. Rutovitz and Atherton (2009) estimate 9 million jobs were created in energy globally in 2010, with about 20 percent of jobs created by renewable energy and energy-efficient generation. Renner, Sweeney and Kubit (2008) “conservatively” put jobs in renewable and supplier industries at 2.3 million worldwide.
India alone may be able to create some 900,000 jobs by 2020 (from 2007) in biomass gasification. Of these, 300,000 might be among manufacturers of gas-ifier stoves (including masons and metal fabricators) and 600,000 in biomass production, supply chain operations and after-sales services. Another 10,000 people might find employment in advanced biomass cooking technologies (Holdren 2007).
UNEP (2011b) estimates that waste recycling employs 12 million people in just three countries – Brazil, China and the United States. Sorting and processing recyclables alone sustain 10 times more jobs than land filling or incineration based on weight. Basic manufacturing industries such as steel, alu-minium, cement and paper are starting to stimulate green jobs through scrap use, greater energy efficiency
and reliance on alternative energy sources (Renner, Sweeney and Kubit 2008).
Potential for green jobsEnergy is the emblematic example of sectoral “green-ing”. Renewable energy (excluding large hydropower) represented almost half the new generation capacity added globally in 2011, up from a minuscule share just a few years earlier. Global investments in renewable power and fuels rose by 17 percent to $257 billion in 2011 – for comparison, investment in fossil-fuel gen-erating capacity was $302 billion – with about a third of that in developing countries (REN21 2012; UNEP and BNEF 2012).
Evaluations of the impact of green technol-ogy on employment are rare. One that used model simulation and scenario analysis estimated the impact of a “green investment” scenario on indus-try. Assuming that 3 percent of total additional green investment was allocated to improving the efficiency of industrial energy, it estimated that 109 million jobs would be created by 2050, or 15 percent more than in the business-as-usual base-line scenario (UNEP 2011b).
Waste collection seems to offer promising returns on investment. In the same simulation the green investment scenario then allocated 0.16 percent of global GDP to three areas of waste management, pri-oritizing investment in the first two, waste recycling and composting of agricultural and forestry organic waste (including energy recovery), to support mate-rial recovery and agricultural activities; the remaining investment was in waste collection.
About $33 billion a year was allocated to waste recycling and composting over the period, based on a global average estimated cost of recycling of $100 per tonne of waste. Waste collection alone generated almost 10 percent of the additional jobs worldwide expected by 2050 in this scenario over the baseline, reflecting current low rates of collection and recycling in low-income countries.
Skilled jobs in energy and environmental ser-vices, the smart application of information and
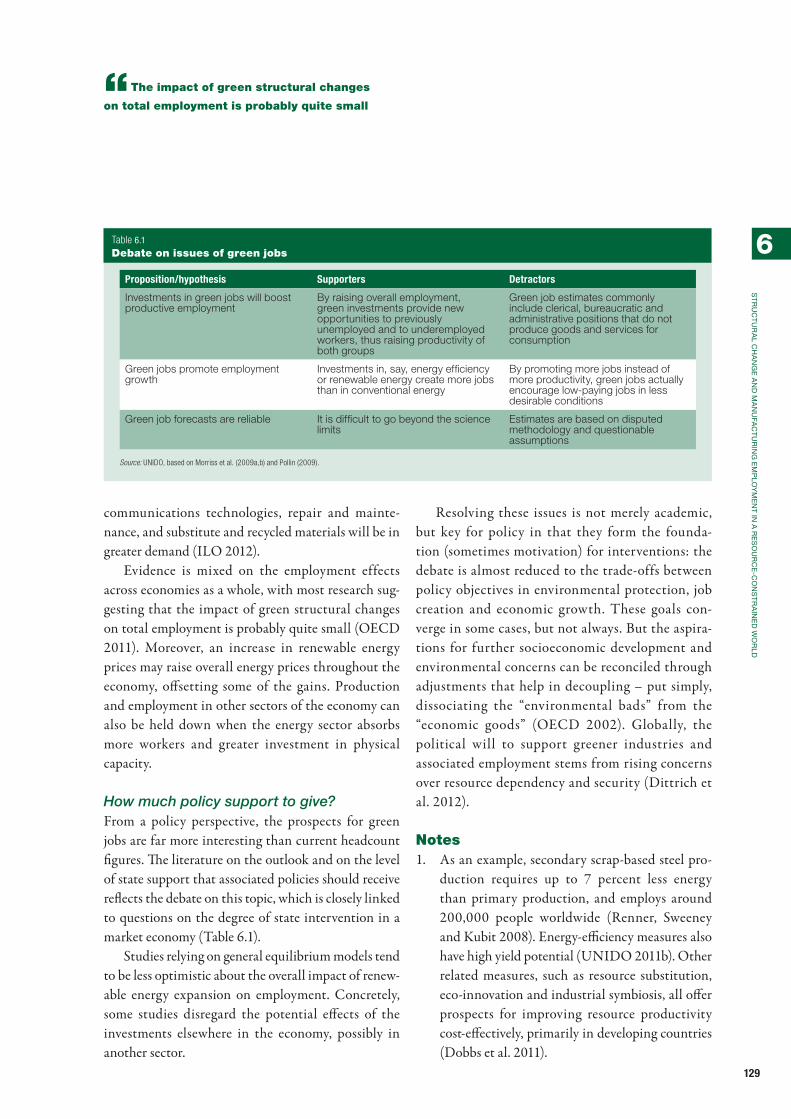
129
st
ru
Ct
ur
al C
ha
nG
e a
nd
Ma
nu
FaC
tu
rIn
G e
MP
loy
Me
nt In
a r
es
ou
rC
e-C
on
st
ra
Ine
d w
or
ld
6
“The impact of green structural changes
on total employment is probably quite small
communications technologies, repair and mainte-nance, and substitute and recycled materials will be in greater demand (ILO 2012).
Evidence is mixed on the employment effects across economies as a whole, with most research sug-gesting that the impact of green structural changes on total employment is probably quite small (OECD 2011). Moreover, an increase in renewable energy prices may raise overall energy prices throughout the economy, offsetting some of the gains. Production and employment in other sectors of the economy can also be held down when the energy sector absorbs more workers and greater investment in physical capacity.
How much policy support to give?From a policy perspective, the prospects for green jobs are far more interesting than current headcount figures. The literature on the outlook and on the level of state support that associated policies should receive reflects the debate on this topic, which is closely linked to questions on the degree of state intervention in a market economy (Table 6.1).
Studies relying on general equilibrium models tend to be less optimistic about the overall impact of renew-able energy expansion on employment. Concretely, some studies disregard the potential effects of the investments elsewhere in the economy, possibly in another sector.
Resolving these issues is not merely academic, but key for policy in that they form the founda-tion (sometimes motivation) for interventions: the debate is almost reduced to the trade-offs between policy objectives in environmental protection, job creation and economic growth. These goals con-verge in some cases, but not always. But the aspira-tions for further socioeconomic development and environmental concerns can be reconciled through adjustments that help in decoupling – put simply, dissociating the “environmental bads” from the “economic goods” (OECD 2002). Globally, the political will to support greener industries and associated employment stems from rising concerns over resource dependency and security (Dittrich et al. 2012).
Notes1. As an example, secondary scrap-based steel pro-
duction requires up to 7 percent less energy than primary production, and employs around 200,000 people worldwide (Renner, Sweeney and Kubit 2008). Energy-efficiency measures also have high yield potential (UNIDO 2011b). Other related measures, such as resource substitution, eco-innovation and industrial symbiosis, all offer prospects for improving resource productivity cost-effectively, primarily in developing countries (Dobbs et al. 2011).
Proposition/hypothesis Supporters Detractors
Investments in green jobs will boost productive employment
By raising overall employment, green investments provide new opportunities to previously unemployed and to underemployed workers, thus raising productivity of both groups
Green job estimates commonly include clerical, bureaucratic and administrative positions that do not produce goods and services for consumption
Green jobs promote employment growth
Investments in, say, energy efficiency or renewable energy create more jobs than in conventional energy
By promoting more jobs instead of more productivity, green jobs actually encourage low-paying jobs in less desirable conditions
Green job forecasts are reliable It is difficult to go beyond the science limits
Estimates are based on disputed methodology and questionable assumptions
Source: UNIDO, based on Morriss et al. (2009a,b) and Pollin (2009).
Table 6.1 Debate on issues of green jobs

130
st
ru
Ct
ur
al C
ha
nG
e a
nd
Ma
nu
FaC
tu
rIn
G e
MP
loy
Me
nt In
a r
es
ou
rC
e-C
on
st
ra
Ine
d w
or
ld
6 2. The term makes an analogy to the work by Simon Kuznets who postulated that income inequal-ity first rises as economic activity increases, then plateaus and finally decreases. This relationship would thus form an inverted U shape, implying that a certain level of economic activity needs
to be reached before income inequality can decouple.
3. This is because green jobs relate to occupations and skills with an identifiable environmen-tal focus, but environment-related jobs include employment in industries (or projects) whose products are deemed of environmental benefit.

131
One important message from the previous sec-tion was that the effect of drivers on employment is not straightforward and not always unambiguous. Ensuring that it is beneficial often depends on having the right combination of government policies in place.
The third section of the report thus turns to exam-ine the role of industrial policy in promoting structural change and employment generation. In its first chapter it begins by looking at the policy efforts needed at the national level to achieve this change. After discussing the different roles and instruments governments have in targeting drivers of structural change, it underlines the importance of understanding the specific condi-tions of countries attempting to transform themselves and of using tailor-made policies. While policy con-tent attuned to concrete realities is a necessity, another strong message is that getting the policy- making pro-cess right is crucial, as is consensual implementation: proper coordination among stakeholders; engaged political leadership; public– private dialogue; manage-ment capability; and flexibility in execution are just a
few of the key dimensions that make industrial poli-cies work.
The second chapter then highlights human capital for manufacturing structural change. It is one of the policy areas where, arguably, more consensus could be achieved among views of what a government’s role should be in promoting industrialization, and so deserves special attention in this report.
The final chapter of the section addresses whether current international arrangements provide the neces-sary policy space for countries to be able to engage in structural change and, through it, generate employ-ment. It analyses international collaboration as expressed in bilateral investment treaties in attracting foreign direct investment, the role of private sustain-ability standards in avoiding the “race to the bottom”, and the role of international knowledge exchange for best practices in learning. It ends with a glance at what the post-2015 development agenda might entail for manufacturing structural change and employment generation.
Section 3 Policy imperatives

132
Chapter 7
Industrial policy
Industrial policy should seek to promote struc-tural change: from agriculture to labour-intensive or resource-based manufacturing at an early stage of industrialization; through upgrading and diversifica-tion in manufacturing at a later stage; and through technological innovation at an advanced stage.
The state can promote policy either as a regulator, financier, producer or consumer, using policy instru-ments that target key drivers of structural change: edu-cation and skills, capital and technology, and material inputs. In this targeting the state should oversee close coordination with other policies such as those on com-petition, trade and foreign direct investment (FDI), as well as the exchange rate, as they can undermine the objectives of industrial policy if they are misaligned.
Carefully chosen and implemented interventions can promote industrial growth and employment, as confirmed by solid evidence from the results of impact evaluations for high-income countries published in 2010 and 2012. (Subsidies for competitive sectors may be one promising approach.) But while interna-tional experience with policy instruments can provide interesting lessons, developing countries are unlikely to succeed with simple emulation, because a strategic approach to industrial policy-making has to be tai-lored to their own circumstances.
Evidence-based and realistic industrial policy implemented in a consensual way is key for policy effectiveness, irrespective of the concrete instruments used. This would require measures to:• Use – do not fight – the political system. A fact of
political life is that no policy will be underwritten unless those in power agree to it.
• Strengthen political leadership. This will set a national transformation agenda that aims, in low-income countries, to create and nurture produc-tive activities or, in middle-income countries, to advance technologically.
• Encourage public–private dialogue. This will help to both design interventions that draw on expert
knowledge in the private sector and ensure that all key stakeholders support decisions.
• Boost industrial policy management capabilities. These capabilities have to be strengthened consid-erably among key actors in developing countries in a pragmatic and concentrated way, ideally through learning by doing.Finally, developing countries should initiate their
own national industrial policy experimentation and learning processes, including monitoring and evalua-tion, to identify high-impact solutions.
Promoting structural change through industrial policyIndustrial policy is a widely used term but difficult to define. Warwick (2013, p. 15) suggests “any type of intervention or government policy that attempts to improve the business environment or to alter the structure of economic activity towards sectors, tech-nologies or tasks that are expected to offer better pros-pects for economic growth or societal welfare than would occur in the absence of such intervention, i.e. in the market equilibrium”.1
The main objective of industrial policy is to “antic-ipate structural change, facilitating it by removing obstacles and correcting for market failures” (Syrquin 2007). Hausmann and Rodrik (2003, 2006) identify three main types of market failure that are particu-larly relevant for new activities to emerge (thus chang-ing the industrial structure), where identification and correction provide a rationale for industrial policy: coordination externalities, as specific new industries or activities require simultaneous, large investments to become profitable; information externalities, as discovery of new activities requires an investment whose returns cannot be fully appropriated by the investor; and labour training externalities, as firms regard labour mobility as a disincentive to invest in on-the-job training, thus reducing technological spillovers.

133
Ind
us
tr
Ial P
olIC
y
7
“Influencing and planning strategically a
country’s position in an international setting has
gained importance as an industrial policy objective
Financial market failures sometimes provide a major justification for industrial policy through the creation of special financial instruments for small and medium-size enterprises (SMEs), or special financ-ing institutions like development banks to finance, say, new products, firms entering new markets or new technologies.
Finally, the role of influencing and planning stra-tegically a country’s position in an international set-ting has gained importance as an industrial policy objective during an age when value chains get more fragmented and there are more options for countries and regions to plug themselves into international and regional production networks.
But industrial policies have not been free of con-troversy, even though they have been extensively used in the developed and developing worlds. In the dec-ades after World War II advanced countries success-fully implemented industrial policies – usually the tricky part – as, for example, France through indica-tive planning, Finland through technology policy and Ireland through the targeting of high-tech foreign investment (Weiss 2011). In the developing world East Asia from the 1960s provides good examples of success: starting with Japan and continuing with the Republic of Korea, Singapore and Taiwan Province of China, governments took extensive measures to pro-mote industry, depending on the country’s develop-ment stage. These different stages are reviewed below.
Early stage: from agriculture to low-technology manufacturingAt the initial stage of industrialization agriculture is still the largest sector for employment, though it tends to be the least productive (Herrendorf, Rogerson and Valentinyi 2013). This lower productivity than in the more advanced sectors leaves a great potential untapped, suggesting that manufacturing can still play a major role as an engine of growth through the reallocation of resources (see Chapter 1).
To promote structural change by moving from agriculture to manufacturing, low-income countries need to align agricultural and industrial policies. They
need agricultural development strategies with a strong emphasis on increasing agricultural productivity, which will translate into cheaper agricultural prod-ucts and release a typically unskilled and cheap labour force. And to absorb the released labour and to ben-efit from cheaper agricultural inputs, industrial policy should seek to create or support labour-intensive and resource-based manufacturing with low entry barriers, which are likely to favour industrial SMEs important for broadening the industrial base. Support for SME development should thus be an integral part of indus-trial policy at this early stage.
Climbing the ladder: towards more technologically advanced industriesIn countries that have reached the middle-income range or are on track to do so, such as Brazil, China, Malaysia and Thailand, the contribution of agriculture to GDP and employment has declined, due to a greater share of industry, particularly manufacturing. Although low-tech manufacturing subsectors still play an important but decreasing role, some medium- and high-tech indus-tries increase their employment (see Chapter 3). While the latter sectors tend to create fewer jobs than low-tech manufacturing, they provide more high-skilled jobs with positive spillover effects on the economy.
The above observations suggest that industrial policy should focus on two issues. First, because unemployment is likely to remain a critical issue in most middle-income countries, industrial policy should aim to improve efficiency and productivity in labour-intensive and low-tech sectors to increase com-petitiveness. Yet as per capita income grows, compet-ing on cost with low-income countries will become increasingly difficult, bringing forth a second issue: middle-income countries will need to diversify and upgrade their economic structure towards more tech-nologically advanced sectors.
Government intervention is needed to favour a shift towards higher value, higher tech or skill-inten-sive industries and to build the required productive and technological capabilities, with a sharper focus on the quality rather than quantity of jobs.2

134
Ind
us
tr
Ial P
olIC
y
7
“Direct subsidies are important for national
governments to promote industry in areas
such as production, investment, research
and development, exports and training
Keeping technological leadership: innovationAlthough reindustrialization is now on the agenda of many high-income countries, they cannot com-pete in low-cost, mature segments of industry. So they should pursue differentiation (by raising qual-ity) and innovation (by launching new products and services) – a strategy that may be prescient given their relative abundance of highly educated labour. In par-ticular, although global manufacturing production is shifting gradually from high-income to lower income countries, innovation remains dominated by countries in the Organisation for Economic Co-operation and Development (OECD; Pilat et al. 2006).
The differentiation and innovation strategy requires countries to shift resources into promising new areas so as to expand the global technological frontier. The shift towards new technological trajecto-ries, which are desirable from an industrial–dynamic or social (“green technology”) perspective, will require an industrial policy that removes obstacles. It has therefore to be aligned with competition and innova-tion policies to reduce entry barriers, and instruments have to be designed to favour innovative new entrants and counter incumbents’ industrial advantages, as well as their lobbying power.
Manufacturing-related services, too, should be a key element in high-income countries. Although these countries typically show waning reliance on manufac-turing as a source of growth and increasing depend-ence on services, links between industrial and service activities have become important because of the greater share of service activities necessary for or complemen-tary to manufacturing production (see Chapter 3).
Industrial policy instruments – four main categoriesAccording to Peres and Primi (2009), the state can promote industrial development in four main ways: as a regulator establishing tariffs, fiscal incentives or subsidies; as a financier influencing the credit market and allocating public and private financial resources to industrial projects; as a producer participating directly in economic activity through, for example,
state-owned enterprises (SOEs); and as a consumer guaranteeing a market for strategic industries through public procurement programmes.
This subsection discusses the main policy instru-ments for these roles, and notes that successful indus-trial policy is not only about picking winners but also about letting losers go (Günther and Alcorta 2011). Beneficiaries should be aware that government sup-port is time limited (through “sunset clauses”) and based on performance incentives.
The state as regulatorFiscal incentives are government transfers of pub-lic resources to firms, activities, whole industries or regions, free or at below-market rates, made through direct subsidies (cash or in kind) or indirect subsidies (tax incentives).
Direct subsidies are important for national govern-ments to promote industry in areas such as production, investment, research and development (R&D), exports and training. It is important to distinguish between generic subsidies from sectorial ones. The former may encourage investment but not structural change. The areas requiring support depend on a country’s char-acteristics. Advanced countries consider R&D sub-sidies to be legitimate industrial policy for promot-ing high-tech industries, but they generally oppose export subsidies – also prohibited by the World Trade Organization (WTO) – which target a particular activity in which emerging market countries are typi-cally strong (Naudé 2010). But during the 2008 global financial crisis France, Germany and the United States resorted to direct subsidies to bail out manufacturing firms, particularly in the automotive industry.
Indirect subsidies (tax incentives) present no general model for promoting manufacturing. While many com-mentators attribute part of the Asian growth story to tax incentives, some recommend governments to limit their use (James 2009). In fact, tax systems in many countries have been subject to comprehensive reforms, curtailing the use of incentives for investment. The United Nations, World Bank, OECD and International Monetary Fund all recognize the importance for developing countries to

135
Ind
us
tr
Ial P
olIC
y
7
“Recognizing the importance of
manufacturing SMEs in the economy, many
countries have developed subsidized loan
schemes to support their development
find “the right balance between an attractive tax regime for domestic and foreign investment, by using tax incen-tives, for example, and securing the necessary revenues for public spending” (IMF et al. 2011, p. 10).
The fact is that the tax incentives offered by indi-vidual countries now more than ever affect the choice of enterprises with regard to where to set up a business (James 2009). Countries can no longer design their tax systems in isolation but have to consider those of other countries thanks to the global mobility of capi-tal and labour, but they risk engaging in harmful tax competition. Such countries are also concerned that once the tax holiday expires, manufacturing enter-prises, often very mobile, will move their operations to another country that lures them with incentives.
The state as financierA well-functioning financial market is crucial to boost industrial development through the provision of com-petitive lending for working capital, leasing of capital goods, consultancy services, and loans for fixed assets including investment projects and real-estate develop-ment. Access to reasonably priced credit is a key con-straint for SMEs particularly, even for those with pro-jects having positive private and social returns, as they usually lack collateral or credit history.
Recognizing the importance of manufacturing SMEs in the economy, many countries have developed
subsidized loan schemes to support their develop-ment. Under the execution of the Small and Medium Industry Development Organization, the Turkish government has targeted manufacturing enterprises through the SME Credit Support Mechanism, which offers interest rate support for bank loans.
Governments can also offer guarantee schemes to increase lender confidence in making investments in SMEs, by supporting either debt or equity finance, to ensure more credit or better credit terms for targeted sectors or groups. The Egyptian Credit Guarantee Company, established by the government as a joint-stock company, had a guarantee coverage of only 50 percent with a low risk-sharing rate, but the guar-antee has nevertheless proved “attractive to banks in Egypt because the guarantee fund is actually depos-ited in participating banks” (Levitsky 1997, p. 7).
Launched in 2000, the Small Business Guarantee Fund (FOGAPE) in Chile guarantees a share of loans made by banks to SMEs, small exporters and small business associations, with a maximum of 50–80 per-cent according to credit type. No doubt partly due to FOGAPE, the share of SMEs with access to credit is far higher (estimated in 2007 at 93 percent at least) than in many other countries (Agosin, Larraín and Grau 2010).
National development banks hold a special place as industrial policy tools (Box 7.1). They are typically
Founded in 1952, the Brazilian development Bank
(Bndes) is wholly owned by the federal government. Its
mission is “to foster sustainable and competitive devel-
opment in the Brazilian economy, generating employment
while reducing social and regional inequalities” (Bndes
n.d.). Bndes, the largest creditor in south america, is
a main source of long-term financing to Brazilian enter-
prises, with annual disbursements climbing sharply from
$11.7 billion in 2003 to $82.3 billion in 2011 (Colby 2012).
the government uses Bndes as a key instrument in
implementing industrial, infrastructure and foreign trade
policies. Manufacturing industry is central to the agenda
of Bndes and received around 40 percent of the Bank’s
total disbursements in 1995–2012 (Banco Central do Bra-
sil n.d.).
Bndes supports manufacturing firms through the
following measures: finance for investment projects to
establish and upgrade plants, modernize processes and
spur technological upgrading and innovation; funding for
production, sales, acquisition or leasing of new machin-
ery and equipment; support for production and export of
goods and services marketed abroad; and facilitation of
changes in firm ownership and project risk sharing (otta-
viano and de sousa 2007).
Source: UNCTAD 2012a.
Box 7.1 The Brazilian Development Bank

136
Ind
us
tr
Ial P
olIC
y
7
“As a consumer, a national government
can be the single largest buyer in several
markets for goods and services in a country
“set up to foster economic development, often tak-ing into account objectives of social development and regional integration, mainly by providing long-term financing to, or facilitating the financing of, projects generating positive externalities” (UNDESA 2006b, pp. 10–11). Most of these banks focus on sectors that governments consider strategically important for the long-term development of the domestic economy, and act as catalysts for expanding targeted sectors and as facilitators of structural change.
In the longer run countries could aim at correct-ing credit market failures by strengthening institu-tions to reduce asymmetric information costs through credit bureaus, improve legal and judicial enforce-ment institutions and influence informal institutions by promoting a “repayment culture” (Meléndez and Perry 2010). The provision of credit rating systems is particularly important, and this type of information service should be introduced by governments if not developed by the private sector.
The state as producerIn pursuing development objectives the state has historically played a key role in industrial develop-ment through SOEs. State ownership can be justi-fied when there are natural monopolies unsuitable for private enterprises, for social or developmental goals, to achieve investment returns for supporting budg-etary objectives, and for national economic security (Mattlin 2009). They can also act as incubators for technical skills and managerial talent, as in China (Rodrik 2010).
Although there are good arguments to privatize enterprises, the state can succeed as an entrepreneur. A well-known example is the Republic of Korea’s steel firm, POSCO, which began production in 1973, at a time where the country’s biggest export items were fish, cheap apparel, wigs and plywood. It became the most efficient producer in the global steel industry in 10 years (Chang 2006). Likewise, Embraer, the state-owned Brazilian aircraft company, has estab-lished itself as a key player in the aerospace industry. European countries had used state subsidies and SOEs
to expand at an unprecedented rate for more than three decades after World War II, but shifted towards privatization, deregulation and competition at the end of the 1970s (Ulltveit-Moe 2008).
The state as consumerAs a consumer, a national government can be the single largest buyer in several markets for goods and services in a country. It can use this purchasing power to stimulate economic activity and innovation, pro-tect national industry against foreign competition, improve competitiveness of some industrial sectors or remedy regional disparities (Watermeyer 2000). For example, to develop or improve the competitiveness of selected sectors, public procurement was used after World War II in East Asia (Kattel and Lember 2010). Countries there started by identifying the products as well as the technological capabilities and know-how needed to produce them. Procurement contracts were then awarded to domestic firms with the government setting deadlines and quality standards to ensure con-tinuing improvement and productivity in these tar-geted products.
States use several approaches (Yülek and Taylor 2012). A government can “buy domestic” to support selected industrial sectors, as illustrated by the Buy America Act in the United States, which gives pref-erence to domestic products in federal government procurements. Similarly, local content rules – requir-ing a share of the procured product to be produced by domestic firms – can support domestic industry in two ways: first, by providing a market to domes-tic business (even when the procurement contract is awarded to a foreign firm) as well as employment and income to the country; second, by helping domestic businesses acquire know-how, transfer technology and lower unit costs through learning-curve effects.
Countertrade agreements are another approach, and build reciprocity into a transaction by requiring a foreign seller to purchase specified products from domestic firms. One example is an offset arrangement where a government requires a foreign firm to trans-fer economic benefits (beyond cash) to the domestic

137
Ind
us
tr
Ial P
olIC
y
7
“Training and education call for industrial
policy instruments that provide explicit
incentives for human capital investments by
firms and households, beyond the government’s
required investments in education
economy as a condition for awarding a procurement contract. These benefits may include technology trans-fer, managerial services, investment, credit transfer, licensed production or co-production, with a view to improving domestic productive capabilities.
Public procurement usually needs strong govern-ment capabilities, and often generates controversy among foreign companies, which may request applica-tion of the WTO principle of equal treatment (Yülek and Taylor 2012).
Targeting key drivers of structural changeIndustrial policy instruments can be used to target key drivers of structural change (see Chapter 4): education and skills, technology and innovation, and material inputs.
Education and skillsEducation and skills3 are essential to build produc-tive capacities for national industrial development, yet would be underprovided in a pure market-driven environment as employers have too few incentives to provide funds for training and education because of labour mobility (the employee may move to another firm). Likewise, there is typically insufficient private spending on education as individuals base their invest-ment decisions on private returns, not social returns. Further, employees would have few chances to self-finance the acquisition of human capital because it is extremely hard to “mortgage” future expected returns (a financial market failure).
So, training and education call for industrial pol-icy instruments that provide explicit incentives for human capital investments by firms and households, beyond the government’s required investments in education. These instruments include scholarships or long-term loans for undergraduate and graduate uni-versity studies (at home and abroad); vocational or engineering scholarships to carry out in-house train-ing of prospective workers by firms; wage subsidies as an incentive for firms to hire and train more employ-ees; demand-driven courses to train workers in the
technical standards in certain industries; and business training for owners and managers of SMEs in issues like management, finance, accounting and invest-ment analysis. Although countries have introduced policy measures to support such skills, the national training fund is increasingly popular (see Box 8.3 in Chapter 8).
Technology and innovationTechnology and innovation are crucial for strengthen-ing industrial competitiveness. Yet limited appropri-ability, lack of competitive finance, and coordination failures, among other factors, make them prone to market failures and induce underinvestment relative to the socially optimal level (Martin and Scott 2000). Government intervention to promote adopting tech-nology and innovation to upgrade domestic private sector capabilities is required. Countries have very different capabilities in this area, often dictating dif-ferent policies, but most policy instruments finance and provide public inputs or information (Melo 2001) and include grants (typically non-reimbursable), subsi-dized loans and fiscal incentives (see above).
Innovation requires strong links between universi-ties and research institutions and enterprises. To cre-ate those links, technological platforms can be estab-lished to provide forums where firms in a particular sector (or region) can identify technological obstacles and define the actions to remove them, partnering with research institutions. Similarly, technological centres or institutions can be set up to offer consult-ing to firms in various areas, such as product or process R&D; metrology, normalization, and certification ser-vices; and technology choice and adaptation (Box 7.2).
In public procurement schemes for innovation, a government agency places orders to purchase a prod-uct that does not yet exist or needs to be customized but that could probably be developed within a reason-able time through additional R&D, in this way lift-ing the producers’ innovative capacity. The Internet and global positioning technology are two examples of government innovation-oriented procurement from the United States (Kattel and Lember 2010),
138
Ind
us
tr
Ial P
olIC
y
7
“As a reliable supply system of low-
cost and high-quality material inputs is
crucial for local industrial production,
countries lacking it sometimes use policy
instruments to reduce the costs of inputs
and the X2000 high-speed train, the AXE telephone switch and energy-efficient lighting and refrigera-tors are examples from Sweden (Edquist and Zabala-Iturriagagoitia 2012).
Material inputsAs a reliable supply system of low-cost and high-quality material inputs is crucial for local industrial production, countries lacking it sometimes use policy instruments to reduce the costs of inputs. A “linkage creation” policy seeks to identify the main require-ments for inputs and raw materials from large firms, and match this demand with local suppliers, often SMEs. More important, the policy should promote the development of local suppliers through technical assistance. Likewise, trade liberalization can reduce costs of imported inputs, benefiting local manufac-turers, particularly those targeting export markets, through productivity and competitiveness gains (Amiti and Konings 2007; Topalova and Khandelwal 2011). For their part, tariff incentives allow firms to partially or totally recover some taxes or duties on imported inputs, while temporary admission schemes give to importing firms partial or total exemption from duties on input materials used in production.
In the current global context of increased resource scarcity and availability, industrial policy instruments must support green structural change (see Chapter 6), involving three categories of policy instruments to alter firms’ behaviour.4
Market-based instruments. Instruments such as taxes, subsidies and tradable permits consider the costs of pollution and environmental degradation in the pricing of goods and services. For example, material input taxes seek to encourage a more efficient use of resources and to promote more material-efficient production technologies; they are applied to each (physical) unit of virgin extraction. They are already levied on a few resources (usually minerals) in some countries, including Bulgaria, Canada, Denmark and France. Tradable resource-use permits can be rights to emit pollutants (including greenhouse gas emissions) or rights to access natural resources (such as water) that are allocated to firms, which may trade them. The aim is to encourage firms to use existing opportunities to reduce resource use and particularly to develop innovative resource-saving technologies, to profit from unused permits.
Financial incentives or subsidies can also be used for resource-saving research and technological innovation, but subsidies that encourage overuse of natural resources should be removed. All subsidies should be time bound, well targeted and performance monitored.
Regulatory and voluntary instruments. Norms and standards that set binding limits can be defined by public authorities to achieve goals like reducing emissions and waste or increasing resource or energy efficiency. Bans are more stringent, and
a private, non-profit organization created in 1976 by the
government of Chile and Itt Corporation, Fundación Chile
focuses its main research on adapting and applying tech-
nologies in commercial operation elsewhere to the Chil-
ean environment, though it sometimes conducts original
research. Its best-known success is salmon cultivation,
developed in norway and scotland.
Fundación Chile turns an idea abroad into a domes-
tic business opportunity by first identifying a profitable
product, technology or service that has still to enter the
national economy. then it attempts to acquire the rights
through licensing (if needed) so as to adapt it to the
national environment through research and development.
Finally it commercializes it.
other successes include berry cultivation, and exports
of vacuum-packed and boxed frozen pork and beef, now
worth about $500 million annually. yet it has also had a
few projects that did not meet expectations, such as the
cultivation of southern hake, farmed turbot and abalone.
Source: Agosin, Larraín and Grau 2010.
Box 7.2 Fundación Chile

139
Ind
us
tr
Ial P
olIC
y
7
“If industrial policy targets sectors rather
than particular firms, it can be quite compatible
– in fact complementary – to competition policy
typically imposed on toxic materials. The Stockholm Convention focuses, for instance, on eliminating or reducing the release of 12 persistent organic pollutants. Beyond regulatory measures, voluntary agreements or negotiated environmental agreements can also be used to address, say, pollution and energy efficiency targets as well as reporting requirements.
Information-based instruments. Governments can use various measures to increase awareness by providing information on resource efficiencies and sustainable industrial production. Information-based approaches include using environmental data, indicators and eco-labelling or certification. Designed and implemented well, they can strengthen the effectiveness of other policy instruments such as environmental taxes. Finally, data and indicators should facilitate benchmarking as a way to determine the resource or energy efficiency of a system.
Aligning industrial and other policiesThe targeting of key drivers requires close coordina-tion with other policies – notably on competition, trade and FDI, and exchange rates – that play an important complementary role to industrial policy.5 Failure to exploit these synergies may counteract pol-icy objectives.
Competition policyCompetition policy includes competition legislation, which aims to prevent agreements between firms restricting competition (cartels), abuse of market power by dominant firms, and mergers or acquisitions that may create a dominant player and weaken com-petition. It may also include competition advocacy, which aims to promote (if needed, set up) a culture of competition.
Competition and industrial policies are often viewed as mutually conflicting. This is because com-petition policy typically aims to foster rivalry between firms in an industry for greater efficiency and eco-nomic welfare, while industrial policy frequently gives a market advantage over competitors (including
producers of substitute products) to favoured domestic sectors or industries.
Two areas of possible conflict stand out (Brooks 2007). The first relates to new entry. There is a conflict zone between a high degree of competition (“contest-ability”) in markets and the willingness of firms to commit large investments into developing new prod-ucts and new types of technologies or branching out into new areas of international specialization. Thus where innovation is crucial, protection of intellectual property rights is needed through patents, copyrights and trademarks, as temporary monopoly rents provide incentives to invest in creating or improving products, services or processes.
The second area concerns competition between domestic and foreign firms, as entry of the foreign firms usually increases competition in the short term and may threaten domestic ones. Governments may be tempted to use industrial policy to impede foreign entry, but they should also consider the possible posi-tive effects of FDI on the endowments and productiv-ity of factors of production, as well as spillover effects. The mode of foreign entry also matters, as mergers and acquisitions may result in abuse of market power by a dominant player, violating competition policy.
Aghion et al. (2012) argue that if industrial policy targets sectors rather than particular firms, it can be quite compatible – in fact complementary – to com-petition policy (see also Possas and Borges 2009). In order words, competition policy can be used to foster competition within sectors or industries that were picked by industrial policy, as in the Republic of Korea where intense competition between chaebol was ensured in the domestic market, or in Japan where oligopolistic rivalry rather than single national cham-pions was promoted (Brooks 2007). Competitive pressures within an industry can also be maintained if instruments use sunset clauses (Rodrik 2004).
Finally, industrial policy seeks to favour tech-nologies or tasks expected to offer better prospects for economic growth or societal welfare. Given its greater emphasis on the long-term development path, industrial policy can be given precedence over

140
Ind
us
tr
Ial P
olIC
y
7
“Climbing up the ladder in the seemingly
hierarchical structure of international production
and trade relationships has become a prime
target of trade and industrial policies
competition policy. But competition policy provides a framework or contributes to “proper governance” of industrial policies. A strong and independent compe-tition authority with clear and transparent rules for decision-making can be an important complementary agency for forward-looking industrial policy meas-ures, as in the European Union (EU), where com-petition policy is at the EU level and so somewhat removed from capture by national lobbying efforts of incumbent firms.
Trade and foreign direct investment policyTrade policy no doubt played an important role in countries’ catch up by imposing direct import restric-tions (tariffs, quotas and non-tariff barriers), offering preferable treatment to domestic producers on the domestic market (public procurement policies) and providing export support (export credits, and sup-port to access foreign markets and export-processing zones; Chang 2003). Today, although some trade and FDI policies have been restricted through bilateral or multilateral trade policy agreements, governments still have some space to use trade-related instruments for industrial policy.
Developments over recent decades have been two-sided. There has been a strong increase in inter-national integration, with a rising number of coun-tries with liberalized trade regimes, leading to greater openness of their economies. But there has also been greater pressure on countries to move towards a more liberalized trade policy regime, but this can lead to specialization in products in which a country has a comparative advantage at the moment of liberaliza-tion. For many developing countries this may translate into producing and exporting only low value-added products, such as agricultural commodities, or only low value-added manufactures, such as textiles and electronic components, characterized by low wages. So analysis and policy concerns have shifted toward a dynamic perception of the place that a country’s pro-ducers occupy in international production structures (at the industry level) or international value chains (at the task or fragment level within industries).
Climbing up the ladder in this seemingly hierar-chical structure of international production and trade relationships has become a prime target of trade and industrial policies. Such hierarchies have been opera-tionalized in empirical research through rankings by capital-, skill-, technology- or R&D-intensities, lead-ing to a focus on supporting a country’s move across ladders of such hierarchies. The role of foreign produc-ers as sources of technology spillovers and as support for access to foreign markets has been recognized. As a result, great attention has been paid to incentivizing the channels through which such spillovers to domes-tic producers would occur, such as through linkage programmes. Policies that try to encourage more use of domestic inputs by foreign firms may also play an important role in upgrading domestic industry and promoting structural change.
In addition to specialization, trade liberalization can also lead to deindustrialization, with rapid growth of manufactured imports, closure of some local indus-tries and stagnation or low growth in industrial jobs (see, for example, Reinert 2006).
The upshot is that trade policy instruments pre-viously used by successful countries like China and the Republic of Korea to restrict imports are being replaced by:• Non-tariff barriers, in a combination of import
licensing, unjustified sanitary and phyto-sanitary conditions, a complex regulatory environment, red tape or lengthy customs procedures.
• Export-promoting instruments that support export-ers in areas such as access to competitive and diversi-fied finance, market access, R&D and training.As trade policy is a key component of any indus-
trial policy, the current policy space (such as under WTO rules) may need to be fully assessed and taken advantage of, or recovered if needed to promote struc-tural change, particularly in developing countries (see Chapter 9).
Exchange rate policyMovement of the real exchange rate (the nominal exchange rate adjusted by relative prices or unit costs

141
Ind
us
tr
Ial P
olIC
y
7
“Well-designed industrial policies are
a mechanism to promote employment
generation, spur growth and improve welfare
in developing and developed countries alike
between the domestic economy and its main trading partners) heavily influences industrial development. An appreciating real exchange rate makes a country’s manufactured products less price competitive, which affects competition on the domestic market relative to imports and competition of the country’s exports on foreign markets.6
An argument for policies targeting the tradable sector (through real exchange rate undervaluation, for instance) is that tradable activities (particularly manu-facturing) are inherently scalable, in that economies can expand output without running into diminish-ing returns, unlike non-tradable activities (Rodrik 2008a). Moreover, the scope for productivity growth and learning is higher in tradable than non-tradable activities.
In trying to influence real exchange rate move-ments, authorities have to deal with the difference between the economy being in a fixed exchange rate regime (or even a currency union) and in a flexible exchange rate regime counterpart to its main trading partners. Closely monitoring the real exchange rate and keeping it undervalued to support the tradable sector, primarily manufacturing – including manipu-lation of the nominal exchange rate – have featured in almost all successful catch-up countries (Gala 2008; Rodrik 1986, 2008a). These measures are also crucial to prevent the current account deficit from becom-ing unsustainable, which would jeopardize industrial policy (McCombie and Thirlwall 2004).
Getting industrial policy to work – more than emulation requiredSeveral recent design-based studies provide compel-ling empirical evidence that carefully chosen and implemented industrial policy can promote industrial growth and employment. For instance, there is now robust evidence that subsidies to manufacturing firms can increase employment at comparably very low “cost per job” (Criscuolo et al. 2012). Well-allocated firm-level subsidies can also boost total factor productivity (Aghion et al. 2012), and there is convincing evidence that tariffs that account for the varying skill levels
among industries can boost economic growth (Nunn and Trefler 2010). These studies – discussed in more detail below – emphasize clean-research designs and use either randomized control trials or natural experi-ments to identify causal effects, helping make the industrial policy debate more objective.
Many scholars are now more optimistic that well-designed industrial policies are a mechanism to promote employment generation, spur growth and improve welfare in developing and developed coun-tries alike. Consequently, many of them demand to move the debate from whether industrial policies should be considered at all, to how these policies should be designed and implemented (for instance, Aghion et al. 2012; Rodrik 2008a).
This subsection summarizes the lessons from selected impact evaluations of industrial policy inter-ventions. It stresses that reproducing policy instru-ments in different countries needs to be handled cautiously, and that evaluations are crucial for experi-mentation and learning.
Handle with careThe majority of industrial policy instruments in the past were deliberately designed to achieve a set of policy objectives. But in most cases prospective justi-fications were not backed up by retrospective evalua-tions of the results’ impact on objectives. This paucity of impact evaluations is a key constraint for a com-prehensive and comparative appraisal of their future potential, their applicability in certain countries or sectors and their effectiveness for achieving growth and employment objectives.
In addition, most available analyses must be inter-preted with great caution. First, many were not per-formed thoroughly enough, so an assessment of their internal validity suggests that causal relationships between policy instruments and observable impacts are hard to establish.7 Second, the findings on the achievements or failures that can be distilled from international experiences cannot that easily be gen-eralized because of country heterogeneity, so careful case-by-case assessment is needed.

142
Ind
us
tr
Ial P
olIC
y
7
“Governments have many ways to subsidize
firms, activities, whole industries or regions
In a nutshell no comparison of industrial policy instruments will find a “silver bullet”. Still, it is evident that the more comparable the two countries under review are in their stage of development, country-specific factors, evident challenges and so on, the more likely it is that comparable results can be achieved.
With these caveats the rest of this subsection pre-sents the most convincing evidence of the potential success that carefully chosen and well-implemented instruments can bring about. It looks into the effects of a number of regularly applied industrial policy instruments: first, subsidies and subsidized loans and fiscal incentives, then, trade policy instruments.
Subsidies, subsidized loans and fiscal incentivesGovernments have many ways to subsidize firms, activities, whole industries or regions. Here, we refer to subsidies as any government action that allocates public resources – cash, financial assets and tangi-bles – for free or at below market prices. Many past cases involved SOEs and provided production inputs at below market prices, or government owned-banks that provided credit on preferential terms. Another way is reduced tax liabilities through tax exemptions, deductions or credits.
In each case one might assume that the crucial point is to identify and subsidize those productive activities where public resources would have the high-est impact on employment and growth. But many pol-icy instruments in high-income countries are explic-itly based on an equity rationale and do not focus on efficiency. These include place-based economic devel-opment policies that target public resources at disad-vantaged geographical areas rather than selected firms or disadvantaged groups of people. The most credible impact evaluations are for these place-based policies, and some design-based studies from high-income countries provide evidence that such policies have the potential to promote employment and growth.
For example, Criscuolo et al. (2012) examine the most important business support scheme in the United Kingdom: Regional Selective Assistance, which has provided subsidies to firms (mainly in manufacturing)
in deprived areas over the last 40 years. By firm size the authors find that the subsidy programme had strong, positive effects for smaller firms, but an essentially zero impact on larger firms.8 Spatially, the authors find that the programme raised employment mainly by reducing unemployment and did not result in equal and offsetting falls in employment in non-participat-ing firms. The programme increased employment (and investment) in deprived areas, where the authors esti-mate the cost per job at about $6,300. They find no effects on total factor productivity.
Kline and Moretti (2012) evaluate the long-run impact of the most ambitious US place-based eco-nomic development policy: the Tennessee Valley Authority programme launched in the 1930s, which aimed to improve regional economic activity mainly by investing in large-scale infrastructure programmes. The authors find that the policy has increased employ-ment in manufacturing, where positive effects are still present over 70 years after launch. In agriculture positive employment effects were only temporary, and starting in the 1960s gains were completely reversed. As wages in manufacturing were far higher than those in agriculture, the shift raised aggregate income in the Tennessee Valley Authority region for an extended period.
In contrast, Becker, Egger and von Ehrlich (2010), who evaluated the impact of the Objective 1 scheme of the EU’s Structural Funds, do not find statistically significant positive effects on employment rates in eli-gible areas, but they do report positive GDP per capita growth effects. In a follow-up study they show that the impact of the policy varies greatly by a region’s absorp-tive capacity – that is, the higher a region’s human cap-ital endowment, the more it benefits (Becker, Egger and von Ehrlich forthcoming).
It remains unclear to what degree these findings for high-income countries can be generalized to devel-oping countries, especially as policy-makers in devel-oping countries may not target deprived areas but focus on efficiency. One could seek to identify market imperfections, which impede manufacturing activi-ties in areas where economic development is already
143
Ind
us
tr
Ial P
olIC
y
7
“When subsidies are allocated to competitive
sectors, the net impact of subsidies on total factor
productivity becomes positive and significant
above the national average that could be overcome with public resources. Equivalently, the conclusions of Criscuolo et al. (2012) – to focus on smaller firms – might not be applicable in low-income countries, because in such settings only larger firms may have enough absorptive capacity to benefit from such pro-grammes. In middle-income countries the situation might again be different.
Design-based studies for low-income countries are unavailable, but Aghion et al. (2012), looking at China, provide a convincing argument that firm-level subsidies targeting production activities to a particu-lar sector have the highest potential to spur growth if within-sector competition is high, and when the pol-icy preserves this competition.
The crucial role of industrial policy is to induce companies to stay in high-growth sectors. The notion that targeting these sectors is more efficient when com-petition is more intense within a sector and when the policy manages to preserve competition is supported by the authors’ empirical analysis (Aghion et al. 2012). Based on a panel dataset of large Chinese firms for 1998–2007, the authors show that when subsidies are allocated to competitive sectors (or in such a way as to preserve competition), the net impact of subsidies on total factor productivity becomes positive and signifi-cant. This suggests that subsidies to competitive sec-tors may be a promising approach.
What can trade policy instruments contribute?The likely impact of trade policy instruments on growth and employment is not as clear cut as the pro-ponents of trade liberalization and openness usually suggest. First, tailored packages of complementary industrial policy instruments comprising different areas and accounting for the specific circumstances of each country seem necessary to benefit from trade liberalization (see above). Second, trade protection can be a promising complement for strategically chosen, relatively skill-intensive sectors.
On the mechanics themselves, trade policies com-prise all government actions that favour domestic (rather than foreign) manufacturing and that promote
exports of the domestic industry. Favouring domes-tic manufacturing is achieved by trade protection – imposing some sort of cost on the import of foreign goods, typically distinguished between tariffs and non-tariff barriers to trade (such as import quotas or import licences). And promoting exports of the domestic industry can be achieved by any intervention that subsidizes export activity.
Export subsidies have three theoretical advantages over trade protection (Harrison and Rodríguez-Clare 2010):• Subsidized exporting firms are subject to the dis-
cipline of the international market, which should force them to become more productive.
• Subsidies to exporting firms implicitly help firms with a certain level of productivity.
• The domestic market may be too small to reap the full benefits of externalities.It is hard to find rigorous evidence on the impact
of any specific trade policy, and only a single design-based study on the impact of a specific trade policy could be identified. But a vast empirical literature exists that tries to answer the underlying question of how trade protection (in contrast to trade liberaliza-tion) affects economic growth and employment. Many studies show a strong correlation between increasing trade shares and country performance, while the more recent literature has started investigating the mecha-nisms for gains from trade. For at least two reasons, though, these investigations cannot say much about the actual impact of trade policies on growth and employment:• The most commonly used measures of openness
to trade are not measures of policy instruments themselves, but rather trade volumes (exports or imports). Given that trade volumes are also affected by many other factors such as geography or exchange rate movements, the results could be misleading (Rodriguez and Rodrik 2001). Notably, the far fewer studies that use trade poli-cies themselves as an explanatory variable tend to find insignificant or weak relationships (Harrison and Rodríguez-Clare 2010).

144
Ind
us
tr
Ial P
olIC
y
7
“Any industrial policy will only work if it is
in line with, or at least does not go against,
the incentives of the political system
• Irrespective of the measure for openness, it is extremely hard to establish causality. Is it open-ness to trade that causes economic growth? Or do growing economies simply become more open? And if that is not enough, many policies that lib-eralize trade are introduced as parts of a broader package of policy changes, making it even harder to tease out their impacts.Thus, empirical evidence on trade policy instru-
ments does not allow for a conclusion that policies promoting openness will spur growth and that trade protection will hamper growth. And many studies suggest that openness is not a sufficient condition for growth, but that gains from trade are contingent on industrial policies. Accordingly, trade policy instru-ments should be investigated in a more detailed way in the future, particularly because effects are very likely to be heterogeneous across industries.
One design-based study on the impact of tariffs follows this approach and does at least partially pro-vide support for protectionist trade policy instru-ments. Nunn and Trefler (2010) point out that the conflicting results in the previous literature may be because it is conceptually wrong to look at the impact of a country’s average tariff. Based on a comprehensive empirical analysis using cross-country industry-level panel data, they conclude that tariffs can be effective in raising growth if the industries chosen for protec-tion are skill intensive. This result is in line with the infant industry argument that predicts a productivity-enhancing effect of tariff protection in the skill-inten-sive early stages of industrial development.
Making the industrial policy process more effectiveThis chapter showed earlier that low- and middle-income developing countries require a strategic approach to industrial policy-making, tailored to specific country circumstances. A one-size-fits-all approach to economic policy has not succeeded in the last decades and is unlikely to bring about structural changes in the future. Country heterogeneity demands a flexible approach to policy design. So the industrial
policy process can look very different in one country than in another, and industrial policy should not fol-low a universal blueprint approach. Effective indus-trial policy has to consider country characteristics and deliberately target the prevalent constraints that are the key obstacles to a sustained industrial growth path.
Using – not fighting – the political systemAn important source of variation in the success and failure of industrial policy is “political equilibrium” (Robinson 2009; Evans 1995; Haggard 1990; Wade 1990). This encapsulates the idea that the political sys-tem determines the objectives and functioning of the institutions implementing the industrial policy. This system, which reflects the preferences of the politically powerful, determines through its institutions the incen-tives of the key economic actors, influences the alloca-tion of all public resources and decides on the distri-bution of income (Acemoglu, Johnson and Robinson 2005). Given such an institutional setting any industrial policy will only work if it is in line with, or at least does not go against, the incentives of the political system.
Whether the politically powerful always benefit from industrial promotion is not known. But to the extent that structural change causes a redistribution of income (or political power), as succinctly put by Robinson (2009, p. 27): “[I]t is not sufficient to just propose good economic policies, one must propose a way in which they will be endogenously chosen by those with the political power to do so”.
Strengthening political leadershipDespite the increased attention on industrialization in many developing countries, budgets for industrial support initiatives, from national treasuries or donors, are seldom more than negligible, bound up in the fact that ministries of industry are usually weak players in cabinet. This was not always the case.
Lall (2004a), arguing persuasively that the pri-ority given to industrial policy in East Asia was crucial in turning industry into the growth driver, shows that the importance of industrial policy was partly reflected in the power vested in the ministries

145
Ind
us
tr
Ial P
olIC
y
7
“Governments should join forces with
their industrial private sector to design
interventions based on their combined expert
knowledge and to ensure that decisions
are supported by key stakeholders
responsible for the sector. In Singapore, for instance, “the management of industrial policy and FDI target-ing has been centralized in the powerful Economic Development Board (EDB). . . . EDB was endowed with the authority to coordinate all activities relating to industrial competitiveness and FDI, and given the resources to hire qualified and well-paid professional staff, [which is an essential prerequisite] to manage discretionary policy efficiently and honestly” (Lall 2004a, p. 18). Similarly, the Republic of Korea held “monthly meetings between top government officials (chaired by the President himself) and leading export-ers” (Lall 2004a, p. 20).
In middle-income countries today, industrial development rarely receives such backing. Even the better supported agencies, like the Department of Trade and Industry in South Africa, are less involved in structural change than its peers in East Asia were.
In low-income countries some initiatives at the presidential level are emerging,9 but most plans are underfunded and donors still largely disregard this priority, often arguing that industrial development is for the private sector and that governments should focus on infrastructure or training programmes.
These views seem misguided. Political leadership at the top is crucial for raising the profile of indus-trial policies and for ensuring the required coordi-nation, oversight and monitoring (Rodrik 2004). Inter-ministerial competition for resources and policy incoherence can only be prevented by strategic leader-ship at the highest levels. It is also essential for high-ranking government officials to be responsible for industrial policy so they can be held accountable if these policies fail. In the 1970s the president of the Republic of Korea himself took the lead role in cham-pioning the country’s industrial policies and strategies. Such ownership is imperative. And beyond that, dia-logue with the private sector can create further incen-tives for the political class to act.
Encouraging public–private dialogueGovernments should join forces with their industrial private sector to design interventions based on their
combined expert knowledge and to ensure that deci-sions are supported by key stakeholders.
Such dialogue between government and private sectors – defined as any interaction between the state and the private sector relating to the design of public policies – is a key policy process in countries that have achieved economic growth through structural change (Altenburg 2010; UNIDO and UNCTAD 2011). In developing countries with low public sector capac-ity, private sector input can make a real contribution to successful policies (Altenburg 2010). Even so, rent seeking is an inherent risk in public–private dialogue and governance mechanisms are needed to avoid a policy outcome narrowly focused on the interests of certain groups (te Velde and Leftwich 2010).
For that reason a participatory and consensual decision-making mechanism is one of the key deter-minants of an effective industrial policy process. It is easy to agree that a new industrial policy cannot be a top-down planning process and needs to be based on such dialogue, but in practical terms at the very least a clear structure to ensure close private sector involve-ment is needed.
Easier said than done, however. Fruitful dialogue requires private sector organizations that allow com-panies to articulate their needs and give input to the policy process, yet in low-income countries produc-ers in chambers of commerce and industry may be overshadowed by trading companies. As retailers and wholesalers can have fairly different policy concerns from manufacturers (on tariffs, import quotas and so forth), governments should consider strengthening manufacturers’ representation in national chambers.
The unorganized private sector may even need to strengthen the manufacturers’ (or subsector’s) asso-ciation, or possibly create it. Most support programmes for private sector associations focus on increasing membership or enhancing technical services to constit-uents, but frequently disregard their capacity to lobby for member firms’ interests. Thus a more consensual and effective industrial policy process often requires targeted institutional-strengthening measures for pol-icy management capabilities of these associations.

146
Ind
us
tr
Ial P
olIC
y
7
“Umbrella organizations can help ensure
broad participation of different private sector
segments without overburdening the dialogue
Another point is how to institutionalize mecha-nisms for public–private dialogue so as to make them sustainable. They can exist either temporarily, such as the informal “growth alliances” of public and private representatives in different industries in Egypt (Abdel-Latif and Schmitz 2010), or be sustained over longer periods, such as the National Economic Development and Labour Council in South Africa.
Developing country governments may want to consult a range of successful cases of effective partici-patory approaches in other countries to decide on the most appropriate institutional set-up, which could include a centralized government agency for pub-lic–private dialogue, a focal point for private sector engagement or regular forums.
While the aim of this dialogue is to secure broad political commitment, success can be held back by a suboptimal trade-off between the broadest possible participation and flexible decision-making. Umbrella organizations can help ensure broad participation of different private sector segments without overburden-ing the dialogue, but the internal governance struc-tures must be made representative of industry as a whole. This point is particularly relevant for SMEs, which need to join forces to make their voices heard (Pinaud 2007). Whether and how much trade unions and civil society bodies should be represented depends on the scope of deliberations.
A country’s industrial policy is usually formed at the national level, but dialogue should ideally take place at various levels of government – from national through regional to local – to capitalize on companies’ and entrepreneurs’ local knowledge. This approach would require private associations organized at different levels as well as correspond-ing institutional structures for the dialogue. This risks overburdening the process, particularly in the early phase, but some degree of inclusion of local actors is prerequisite for serious buy-in, and it can be achieved without far-reaching institutional rear-rangements, as with the help of subnational indus-trial policy forums, which allow firms to air their concerns.
Boosting industrial policy management capabilitiesBeyond making the above political and other adjust-ments, countries need to have a certain technocratic capacity to realize the vision of, say, the president or prime minister, for industrial policy to succeed. Many developing countries lack this capacity, which has to be built pragmatically.
Capacity gaps inhibiting industrial policyAltenburg (2011, p. 3), who coined the term “indus-trial policy management capabilities”, highlights that “the key problem of industrial policy in poor develop-ing countries is that, while the need to correct market failures is much greater than it is in highly developed societies, the ability of the public sector to tackle such failures is also much more limited”.
So the question runs: What are these capacities and how can they be built? Effective industrial policy-making requires adequate capacities for each step of the policy cycle (Box 7.3). Strong analytical capacities are needed to thoroughly diagnose industrial perfor-mance, constraints and potential. Decision-making capacities are needed for the smart design of strategic directions, and the industrial policy toolbox needs to be understood to propose adequate policy interven-tions. Implementation requires strong management as well as technical and sectoral competencies. And forward-looking monitoring and evaluation requires not only adequate financial resources but also techni-cal expertise.
Altenburg (2011) argues that most low- and lower middle-income countries perform very weakly in four key dimensions: defining priorities and building a broad consensus; establishing clear rules for mar-ket-based competition transparently and efficiently; delivering services effectively; and avoiding political capture.
The causes of the capability challenge are from home and abroad. Domestically, weak education and training systems fail to provide enough well-prepared bureaucrats, and neo-patrimonial political systems go right down most technocratic structures

147
Ind
us
tr
Ial P
olIC
y
7
“Strong analytical capacities are
needed to thoroughly diagnose industrial
performance, constraints and potential
and sometimes discourage even the most motivated and well-educated staff involved in industrial policy. Internationally, some donors have reduced policy space or even undermined industrial policy meas-ures in the last few decades in various ways, includ-ing by facilitating poverty reduction strategy papers that were biased towards social sectors; imposing economic policies that do not align with industrial policy objectives; enforcing deregulation that has weakened technocratic structures; replacing senior national decision-makers with international advi-sors; reducing the competitiveness of productive sectors through large aid inflows; actively attracting the most capable and entrepreneurial workforce into aid institutions; allowing donor fragmentation and non-alignment with national strategies; and replac-ing existing institutional structures and mandates with new implementation units (Altenburg 2011; Olukoshi 2004).
One cannot argue that industrial policy initiatives would have succeeded in low-income countries with-out donor involvement, but some egregious examples of the above issues stand out:• The set-up by an international organization of
a project for competitiveness and private sector development in Mozambique, which exceeded the total budget of the national Ministry of Industry and Trade, was designed with little national involvement, appropriated senior personnel from the ministry and essentially operated as a parallel agency (Krause and Kaufmann 2012).
• The simultaneous activities of 10 different donor agencies on value chain development in Ethiopia in the 2000s, which all used differing methodolo-gies and cooperated seldom cooperated with each other (Altenburg 2011).
• The regular posting of long-term senior inter-national experts into ministries of industry in
the phases of the industrial policy process can be charac-
terized as a cycle that starts with the diagnosis and design
of the policy, and then implementation, followed by moni-
toring and evaluation – which closes one cycle and starts
the next.
the initial phase entails thoroughly evaluating the
country’s industrial capacity, its structure and its competi-
tive performance – an industrial diagnosis. It should also
cover endowment structures, country and population size,
and so on.
the design, building on this diagnosis, prioritizes the
key objectives of the envisaged growth path and proposes
measures to accomplish them. the policy may have dif-
ferent objectives but should identify and acknowledge
trade-offs. achieving industrial growth the fastest will no
doubt require different choices from securing employment
creation or equitable regional development. In addition,
industrial policies have to identify and prioritize immediate
and future potential and solutions.
a short-term component that aims at easy gains or “low-
hanging fruit” – as through upgrading a sector or increasing
value addition to a traditional commodity – is highly impor-
tant for a realistic process, though any pragmatic short-term
focus must still show the pathway for full-fledged structural
change. thus, a longer term component for new productive
capabilities must be the ultimate goal (unIdo and unCtad
2011). the idea of “defying” comparative advantage to cre-
ate the foundations for future gains is at the core of this leap-
frogging approach (lin and Chang 2009).
Industrial policy interventions for structural change
have to be ambitious by definition, though they can only be
effective if they are realistic not only over time and scope,
but also on the current capabilities of firms and the labour
force and on financial resources for implementation. Gov-
ernments of low-income countries have to take strategic
bets into consideration, deliberating on the right ambitions.
once the policy is designed and agreed among stake-
holders, policy instruments have to be chosen (see Indus-
trial policy instruments – four main categories, above). the
implementation process of these instruments varies con-
siderably, posing very different challenges among devel-
oping countries.
a key feature of the cycle is the feedback loop from
implementation to diagnosis, based on monitoring and
evaluation. this identifies success and failure to be fed
into the next cycle, enabling adaptation and better perfor-
mance (unIdo and unCtad 2011).
Source: Industrial Development Report 2013 Team.
Box 7.3 The policy cycle

148
Ind
us
tr
Ial P
olIC
y
7
“The pragmatic idea is to concentrate
the available resources on executing highest
priority tasks, and to incrementally build
additional skills when they are really needed
Sub-Saharan Africa, who largely replaced the national design of industrial strategies and policies without much interaction with local actors.This capability challenge is more severe in the indus-
trial policy arena than others because the more central-ized government agencies usually also succeed in secur-ing the best talent. Particularly in many Sub-Saharan countries, ministries of finance, planning commissions, development banks and other key players in cabinet are best placed to secure government resources.
Building management capabilities, ideally through learning by doingDuring the Washington Consensus period, the World Bank (1997) stated that industrial policy was very difficult and required particularly high policy skills compared with other policy areas. Suggesting that the state’s role should be aligned with its capabilities, it felt that low-income countries should not engage in this area but rather build their institutional capabilities beforehand. Lall (2004b), too, made the point that the strategic choice for an industrial policy in a country should ideally be based on an understanding of gov-ernment capabilities – suggesting that simpler policies are the preferable option in less sophisticated adminis-trations. But he also highlighted that capabilities can be built over time.
Criticizing the approach of policy-capability matching more fundamentally, Ohno (2009) makes the point that institutions and capabilities of techno-crats in low-income countries cannot be enhanced in a general way, as this is neither politically appealing nor administratively implementable. Instead, capa-bilities should be strengthened in a more concentrated way, through dynamic capacity development. Citing the East Asian experiences, he suggests that the pol-icy capabilities in developing countries can best be enhanced through hands-on efforts towards concrete goals. The pragmatic idea is to concentrate the avail-able resources on executing highest priority tasks, and to incrementally build additional skills when they are really needed so as to solve emerging problems when they arise.
This debate cannot easily be settled without recourse to country cases, but it is clear that, as any eco-nomic or social decision with future impact, industrial policy-making is subject to fundamental uncertainty. This means that even the most capable administration will be unable to anticipate either the future develop-ment of its country, the dynamics of a certain sector or the competitive behaviour of competing countries. Equally, even the most sophistically designed policy intervention based on thorough analysis and imple-mented efficiently will not necessarily lead to success. Industrial policy may certainly be more risky in low-capability contexts, but may fail anywhere.
Industrial policy should thus be seen as experimentation – essentially learning by doing (see next subsection). Accordingly, the question of whether industrial policy is possible or not with the given capabilities should be replaced with: “How can the experimentation and policy-learning process be structured to fit the country context?” This process should not be held back because of concerns about failure, but interventions should rather be scaled up slowly from low-risk, low-complexity interventions to more ambitious initiatives. To quote Altenburg (2011, p. 36) again: “[T]here is a special need for poli-cies that are cheap [and] simple in their implemen-tation, and cannot easily be captured by influential interest groups”.
Flexible policy design: experimenting, learning and evaluating
Gone is the confidence that we have the correct recipe, or that privatization, stabilization and liberalization can be implemented in similar ways in different parts of the world. Reform discussions focus on the need to get away from “one-size-fits-all” strategies and on context-spe-cific solutions. The emphasis is on the need for humility, for policy diversity, for selective and modest reforms and for experimentation. . . . Policy design . . . relies less on “best practices” and more on a combination of experimenta-tion and monitoring (Rodrik 2008b).
149
Ind
us
tr
Ial P
olIC
y
7
“Industrial policy-makers in developing
countries would be well advised to gradually shift
their attention from investigating and imitating
international best practices to identifying
and reproducing national success stories
This chapter has made the point that industrial policy-makers who need to choose suitable industrial policy instruments cannot simply follow deterministic planning. While there is plenty to learn from theory and practice, and from benchmarking across coun-tries, it is just not possible to generalize findings from one situation to another. Rather than simply emulat-ing industrial policies that have worked elsewhere, countries have to go through their own learning pro-cess. This process necessarily involves experimenta-tion, and trial and error. Abhijit Banerjee, one of the leading proponents of this school of thought, empha-sizes that “what is probably the best argument for the experimental approach [is that] it spurs innovation by making it easy to see what works” (Banerjee 2007, p. 122).
For this approach to work, however, industrial pol-icy experimentation has to be combined with rigorous impact evaluation of each implemented instrument to generate the evidence on which industrial policy measures work (and which do not) in a given context. Probably the most important role of industrial policy monitoring and evaluation in developing countries is to provide feedback for making the next cycle more innovative and effective.
Industrial policy-makers in developing countries would be well advised to gradually shift their atten-tion from investigating and imitating international best practices to identifying and reproducing national success stories. In principle this leads us to the recom-mendation that every industrial policy intervention should be evaluated retrospectively. Especially in con-texts with serious budget limitations and thus prior-itization, it is essential to know whether the policy intervention was effective and whether the resulting benefits outweighed the associated public costs. But while this approach is finding more support among academics and in the donor community, policy practi-tioners encounter at least two political challenges:• Evaluations, particularly the more sophisticated
ones that include design-based studies, do not come free, thus reducing the available budgets for implementing policy. So small interventions
especially do not readily lend themselves to com-prehensive monitoring and evaluation approaches.
• Evaluations can reveal inherent flaws, limitations and even adverse consequences of industrial policy interventions. In almost all cases this implies a seri-ous political cost. So full-fledged evaluations are frequently perceived as a threat, particularly larger interventions that usually coincide with ambitious political rhetoric and wide-ranging public interest.Both these concerns could possibly be resolved
though, at least partially, with a more nuanced and pragmatic approach to industrial policy experimenta-tion and evaluation. While full-fledged design-based studies and experimental designs are not always feasi-ble, their distinctive logic should at least be incorpo-rated in the industrial policy decision-making, even if a final evaluation cannot. The point is that there are possibilities to design policy instruments as if they were experiments, without actually executing them as such. Policy interventions should come with a clearly formulated and realistic intervention logic or theory of change. At the very least, this approach would entail:• A clear definition of a target system that makes
concrete the objectives (including trade-offs among different objectives) that the policy instru-ment is aiming to have an impact on in the longer term (increased employment or economic growth, for example).
• Realistic “target corridors” for judging success or failure with regard to each objective ideally based on real-world benchmarks (such as minimum and maximum expected increase in employment, based on prior achievements in the country or elsewhere).
• An explicit impact model with a comprehensive depiction of the short- and medium-term changes in industrial sectors (at the firm and sector levels) that are needed to reach these long-term targets (such as required investments of manufacturing firms and structural changes in the production activities of firms).
• A detailed description of the steps required for reaching each of these goals (impact paths),

150
Ind
us
tr
Ial P
olIC
y
7
“This process does at least ensure that
interventions are discussed and designed
reflexively and that stakeholders are well aware of
the actions and achievements expected of them
including a critical examination of whether it is realistic to expect to reach the goal with the time and resources available.
• An account of possible unintended impacts and side-effects of the policy instrument (risk factors), based, say, on consultations of experts and affected stakeholders before the intervention is carried out.
• An honest description of the assumed counterfac-tual, for instance: “What would the employment rate have been if the government had not subsi-dized manufacturing wages?”
• The selection of concrete impact indicators, which can be used to measure change both “on the way” (intermediate indicators) and with regard to the end objective (final indicators).This process does not guarantee retrospective
scientific evidence on the causal effect of the policy instrument, which is unquestionably an evaluation’s main objective for the academic and donor commu-nities. But it does at least ensure that interventions are discussed and designed reflexively and that stake-holders are well aware of the actions and achievements expected of them.
If this process is combined with less sophisticated and less costly (non-experimental) monitoring and evaluation designs, such as reflexive comparisons and qualitative research, industrial policy interventions are likely to be much more evidence based, consensual and transparent – and (it is hoped) more effective, without overburdening the technical and budgetary capacities of developing countries.
Notes1. Pack and Saggi (2006) offer a similar but nar-
rower definition.2. In some cases capabilities can be transferable or
complementary between sectors. For example, China was able to develop a wind power industry
and become competitive in only few years (Lema, Berger and Schmitz 2012).
3. This issue is discussed in detail in Chapter 8.4. Based on UNIDO (2011c). See also Jäger (2008)
and Rayment et al. (2009).5. For example, labour and skills can be considered
part of education and employment policy, capital and technology part of innovation policy, and material inputs part of environmental policy.
6. Formally, the real exchange rate = Pd/(ε*Pf), where Pd is the domestic price level, Pf the foreign price level and ε the nominal exchange rate. This ratio tells us how much goods and services can be pur-chased abroad (after conversion into a foreign cur-rency) compared with the domestic market with a given amount of local currency.
7. In the ideal case, to obtain an unbiased estimate of a true causal effect of a policy measure, it is essential to execute a thorough design-based study that considers confounding factors, including a control group, and that avoids selection biases as well as under- and overestimation of results. A detailed technical description of impact evalu-ation methodologies goes well beyond the scope of this chapter, but Gertler et al. (2011) provide a comprehensive overview from a practitioner’s perspective. Impact evaluations can be costly and time consuming, and thus hard to combine with an industrial policy process that often puts more emphasis on short-term objectives and quick wins than on systemic transformation.
8. The heterogeneity of results with respect to firm size is quite intuitive, as larger firms are less likely to be financially constrained.
9. The most recent Five-Year-Development-Plan of the United Republic of Tanzania and the Growth and Transformation Programme in Ethiopia, to name two.

151
Chapter 8
Education and training policies for creating jobs in manufacturing
Employment creation is at the core of industrial strate-gies geared to sustainable development. There seems to be consensus that to maximize the benefits of indus-trialization, labour markets have to generate more and better jobs, which in turn increase real incomes and take people out of poverty.
The formation of specialized technical skills plays a major role in the quantity and quality of employment generation, and the accelerating pace of technologi-cal change is making these skills more important. And as the skills required for modern manufacturing have changed, so too have the institutional structures provid-ing them. In the past, employability was correlated with improvements in basic education. Today’s more competi-tive world puts greater emphasis on specialized high-level training, not only through formal training systems but mainly from the close interaction between the industrial private sector and the education apparatus.
Technological change and increased pressures to com-pete have put a premium on top skills in science, engineer-ing, mathematics, computing and information technol-ogy. The most advanced countries in Asia, for example, give incentives to students to enrol in scientific subjects at university and offer early access to vocational training.
General considerations for skill policiesMost governments agree that human capital is a cru-cial driver for economic growth. Yet many, particu-larly in the developing world, have failed to act on this belief, partly because of their inability to push through the right policies and partly because of the private sec-tor’s unwillingness to get involved in creating skills. Some guiding principles based on good practice can help policy-makers understand the elements that go into successful skill policies.
Understanding the complexity of industrial skill needsA simplified matrix (see Table 4.4 in Chapter 4) can help policy-makers identify broad skill profiles,
demand, and education and training methods, but they need to make thorough assessments of skill gaps to identify industry’s specific needs.
Matching short-term needs and long-term goalsPolicy-makers have to create or strengthen skills for industry today while anticipating demand for tomor-row, especially in countries that want to transform their economies. They may need to consider three types of intervention: “early reactive” to tackle imme-diate skill shortages; “continuing” to tackle the skill demand for upgrading within existing industries; and “future-oriented” to supply the skills for long-term structural change (Fernandez-Stark, Bamber and Gereffi 2012). Early reactive can be addressed quickly through on-the-job training, but future-oriented may call for long-term changes to education. Still, policies have to be realistic, and changes should be gradual and sequential to forestall possibly huge misuse of resources on a system that does not meet industry’s demands.
The formal education system needs to adjust over time. Other forms of training by private and pub-lic suppliers should fill in the gaps, and firms have to adopt a “skill culture” through innovation and learn-ing. This will not happen automatically, hence the need for policy intervention.
Specialized technical skills need to be built on strong education foundations set during primary and secondary school, primarily comprising the fun-damental academic skills of numeracy and literacy, as well as behavioural (or soft) skills acquired at an early age through personal interactions and problem solving.
Matching supply and demandAs discussed in Chapter 4 (see Mismatch between skill demand and supply), successful skill policies have to bridge the gaps of over-supply in some areas

152
ed
uC
at
Ion
an
d t
ra
InIn
G P
olIC
Ies
For
Cr
ea
tIn
G Jo
Bs
In M
an
uFa
Ct
ur
InG
8
“The education system will need to
develop the capacity to anticipate upcoming
demand – and work towards providing
the upcoming areas of expertise
of knowledge and of offering too many diplomas in non-required fields. Reconciling the “what is needed” with the “what can be provided and how” is possibly the most important challenge in design-ing skill policies, yet the interplay between supply and demand is complex. The supply side essentially reacts to signals from the demand side, but the tim-ing of demand and the lack of innovation strategies may hamper the speed and nature of the response by education and training organizations. Without hav-ing a complex planning system, the education sys-tem will need to develop the capacity to anticipate upcoming demand – and work towards providing the upcoming areas of expertise despite facing major uncertainty as to whether these actually will be the needed fields, if it is going to provide the required workforce for structural change and economic growth.
Aligning skill policies with the broader socioeconomic agendaSkill policies have to be aligned with the economic and social development needs of society, which requires strong coordination between stakehold-ers engaged in policy-making – public and private. Policy-makers have to be aware that the skill policies may differ greatly depending on a country’s industri-alization starting point and goal – the challenges for a resource-rich unindustrialized country differ greatly from those for a country trying to escape the middle-income trap.
Many developing countries suffer from coordi-nation failures when designing skill policies, for two main reasons. First, the government agency developing the economic agenda is not necessarily the one respon-sible for executing it. The lack of inter-ministerial coordination often results in the design of industrial policies that are unrealistic for the country’s human resources. Second, the private sector in developing countries, even if organized, is minimally involved in policy-making, which again leads to misconceptions of industry’s skill needs. Thus skill policies become supply driven.
Policy recommendations for skillsAs countries differ in many ways, so does the choice of skill policies. There is no one-fits-all policy mix that works for all countries. Policies that worked in Asia many years ago, for example, may not work in Africa today. The knowledge structure of a country is deter-mined by multiple factors, including formal school-ing, in-firm learning and the knowledge acquired and influenced by social networks such as families and communities (Nübler 2013b). The sociocultural and historical context plays a fundamental role that can lead to failure of policies that have worked elsewhere, so policy-makers should be cautious when designing skill policies. Still, they may wish to consider a few broad thrusts and some other countries’ approaches.
Support development of soft transferable skills for manufacturingIn Viet Nam manufacturing employers are not just looking for technical skills but also for cognitive, social and behavioural skills. Teamwork and prob-lem-solving skills are considered key for blue-collar workers, while critical thinking comes out as the most desired skill for white-collar workers (Bodewig 2012). Mastering English is a top priority in Thai manufacturing (World Bank 2010). These are just two examples of how important soft skills have become in South-East Asian manufacturing.
Indeed, with the growing pace of technological change in manufacturing, and the shift from routine manual to more non-routine analytical and interactive activities, companies now put a premium on a work-force better prepared to learn and absorb new tasks. Problem-solving attitudes as well as interpersonal skills such as communication and teamwork have become crucial for on-the-job learning, to the extent that some firms have now prioritized these over other technical education when hiring staff due to the transferability of skills across sectors (EC 2011; Fernandez-Stark, Bamber and Gereffi 2012; Murnane and Levy 1996).
While specialized technical skills remain key for structural change and technological upgrading in manufacturing, soft transferable skills have become

153
ed
uC
at
Ion
an
d t
ra
InIn
G P
olIC
Ies
For
Cr
ea
tIn
G Jo
Bs
In M
an
uFa
Ct
ur
InG
8
“The emphasis should be on critical
thinking, problem solving and the
encouragement of teamwork and creativity
a crucial asset for employability, both in and outside manufacturing.1 Many of these soft skills have to be developed at an early age, signifying the importance of supporting policies that establish the learning founda-tions of the future workforce. More and better school-ing will be crucial for manufacturing, and develop-ing soft transferable skills will enhance employment prospects later on. The non-technical nature of these skills also calls for changes in the teaching approach. Traditional “follow the model” methods that empha-sized static learning, memorization and imitation are no longer viable for developing interpersonal skills. The emphasis should be on critical thinking, problem solving and the encouragement of teamwork and crea-tivity. The combination of these skills and specialized technical skills acquired later will provide the best possible skill mix for employment in highly advanced manufacturing.
Complement formal education with technical and vocational education and trainingOver the last few decades there has been a strong emphasis on technical and vocational education and training (TVET) to meet the demand for industrial skills. No substitute for formal education – instead, TVET builds on it to deliver specialized technical training. Although TVET covers the whole gamut of manufacturing skills, the shift from simple assembly and processing to technology-intensive industries calls for a skilled workforce capable of operating state-of-the-art technologies. Tertiary enrolment in technical subjects, including engineering and mathematics, has normally been taken as a useful indicator for the avail-ability of skilled labour for highly advanced industry.
But university education has often proved to be insufficient supplying the skills needed by industry both because of the rigidity of university curricula in times where the demand for skills in industry is con-stantly changing and because of a lack of private sec-tor participation in developing those curricula. There seems to be a consensus that TVET is usually more adaptable to industrial needs as the private sector is often engaged in its design and even execution.2
TVET does not work automatically. In many instances the suppliers of TVET were unable to keep up with the skill needs of industry due to sud-den changes in demand. If the private sector does not provide the information continually, it is very unlikely that TVET suppliers can anticipate changes in demand and so adjust the training curriculum. Governments at times assume incorrectly to have more and better information than private parties on programmes. Finally, TVET can also fail due to enrol-ment shortages as families in developing countries may not be aware of the longer terms benefits of a technical education (Almeida, Behrman and Robalino 2012).
For TVET to be mainstreamed within the edu-cation system in developing countries – and in many developed ones – TVET programmes have to over-come three main challenges:• They still do not enjoy a good reputation among
the general public, which sees TVET as an alterna-tive for those who do not perform well at school, rather than as a mechanism that enhances future employability through the acquisition of industrial skills.
• A variety of public and private bodies offer them, frequently leading to many uncoordinated efforts and myriad certifications that can confuse pro-spective students and employers. Most countries lack a single body responsible for setting standards for TVET programmes, not only for their design but also for execution and monitoring.
• Programmes rarely have tracking systems to con-firm whether participants have found jobs in related fields, giving the institutions little feed-back on their courses’ relevance and suitability for graduates.
Engage the private sector in designing technical and vocational education and trainingThe involvement of the private sector in TVET is cru-cial for its success because its involvement is the most efficient way to link skills to the labour market (DFID 2011). The private sector is not only important by

154
ed
uC
at
Ion
an
d t
ra
InIn
G P
olIC
Ies
For
Cr
ea
tIn
G Jo
Bs
In M
an
uFa
Ct
ur
InG
8
“On-the-job enterprise training is
possibly one of the most important sources
of skill development in manufacturing
providing relevant information on skill needs but also by taking an active role in shaping the training pro-grammes to make sure they match skill demands more closely (Box 8.1).
Where the private sector is less strong, there is still the possibility to develop successful TVET pro-grammes by involving relevant stakeholders. For instance, in India the Skills Development Initiative, which aims to provide 1 million workers with employ-able skills over five years with an additional mil-lion workers each year after that, is a public–private partnership.
Encourage on-the-job trainingOn-the-job enterprise training is possibly one of the most important sources of skill development in manu-facturing. Training in enterprises, usually provided to employees after formal education and vocational training, is a very effective and economical way to develop the workforce’s industrial skills. The reason is that manufacturing firms bear the cost of train-ing only to the extent that they expect to reap some benefits. Such training can take different forms. At the lower end of the spectrum formal training is rare
and only occurs through informal exchanges with col-leagues. In highly advanced sectors training is formal-ized, becoming an integral part of the worker’s job.3
Apprenticeship schemes have become increasingly popular as an efficient public–private partnership to bring industrial skills to the shop floor (Box 8.2). They are not only responsible for developing skills that are very specific to individual firms and sectors, but are thought to be a key reasons for low youth unemploy-ment – as in Austria, Germany and Switzerland, which have successful dual-training systems.
In all countries considering this system the private sector needs to have a key role in designing the train-ing, to ensure that the skills required are being learned (AU 2007). Economies relying on a large agricultural sector and with a large informal sector may not find the dual system suitable, however, as it needs a strong private sector and a high level of institutional coordi-nation among the parties.
Make financing for training efficient and equitableLack of financing is the main constraint to supplying high-quality TVET. Governments cannot be expected
singapore’s vocational and technical education (vte) is
frequently cited as among the most effective in having
achieved a transformation from an unskilled workforce to
a highly skilled one, in 20 years (lai and yap 2004; lall
2001).
vte seems to differentiate itself from those in neigh-
bouring economies in one aspect – a private sector role in
the coordinating body (lai and yap 2004). although in the
republic of Korea, Malaysia and taiwan Province of China
the government is either the principal or only body mak-
ing decisions on vocational education, the government of
singapore has ensured that the private sector has a key
role in shaping vte, and representatives of industry and
labour organizations form a significant part of the coor-
dinating body. this representation allows for a direct and
continual flow of information on changes in the demand
for skills in industry, and teaching curricula can thus be
adapted quickly.
additionally, the system offers traineeship pro-
grammes with key industries such as aircraft maintenance
and ship manufacturing. agreements have been signed
with industry for technology and knowledge transfer
between education centres and industry, to ensure that
teachers remain up to date with industry developments
(law 2007).
the government-funded Institute of technical educa-
tion – singapore’s pride in vte – has become a world-
class institution, known for its quality, values and rele-
vance internationally. over the years it has changed from
comprising various vocational institutes to three “educa-
tional colleges”. with strong industry partnership, 70 per-
cent of the curriculum consisting of practical work and a
wide range of programmes and courses for students, the
Institute strongly emphasizes the suitability of its gradu-
ates for future employment (law 2007).
Source: Industrial Development Report 2013 Team.
Box 8.1 Involving the private sector in Singapore

155
ed
uC
at
Ion
an
d t
ra
InIn
G P
olIC
Ies
For
Cr
ea
tIn
G Jo
Bs
In M
an
uFa
Ct
ur
InG
8
“A unified nationwide certification
scheme, ideally under one body, avoids
duplication and informs sectors about
the qualifications held by individuals
to meet the whole burden when private returns surpass social returns. Yet firms, even aware of the benefits of training, may be unable to bear the associated costs and risks. This is particularly true for smaller firms in developing countries.
Governments have to make financing efficient and equitable, and the best way to do this is by partner-ing with the private sector. Indirect financing – the state co-finances training schemes but the private sec-tor takes responsibility for delivering services – has proved successful. The policy is based on the expected efficiency and equity gains economy-wide, especially for manufacturing firms that require a pool of highly skilled professionals. Two approaches have become increasingly popular for such co-financing (Box 8.3).
Develop nationwide certification for manufacturing skillsA large number of uncoordinated efforts to build indus-trial skills results in duplicity, waste of resources and confusion among employers and prospective students. A unified nationwide certification scheme, ideally under one body, avoids duplication and informs sectors about the qualifications held by individuals. For these people such a certificate signals to potential employers the types of skills they have, which can be particularly advantageous for youth who do not have experience or personal contacts, and thus face difficulties in present-ing themselves to potential employers. For a firm it is
a form of quality assurance and allows them to meas-ure and compare skills among applicants (World Bank 2010). Certification also facilitates labour mobility and creates competition within the labour market.
Support skill development through inter-firm linkagesIt is important to look beyond traditional forms of providing training and education. With globalization, the dynamics of manufacturing have changed dramat-ically. As production becomes more fragmented and the need to increase efficiency to remain competitive internationally grows, firms have found new ways to position themselves.
International trade has changed production networks (see Chapter 5), including skill creation, manufacturing clusters (Box 8.4) and huge scope for knowledge spillovers. Some governments have reacted by encouraging growth through training centres, research and development (R&D) institutes and sci-ence parks. These routes allow for knowledge to flow much faster, especially across borders.
Governments need to do more to facilitate such knowledge exchange. (The national and regional authorities were key in developing training and R&D centres in the clusters in Box 8.4.) Being part of a global production network can allow a firm and its employees to develop the skills for manufacturing employment. Often, lead firms in more economically
apprenticeship schemes combine classroom vocational
training with practical work experience in the firm. the
strong link with the private sector enables the curriculum
to adapt rapidly to changing demands in industry. the
government offers the classroom courses, and the firm
pays a reduced salary to the participant. after the contract
between the participant and the employer for this work
experience expires, the employer can hire the participant
(or choose not to).
young people in the scheme have a smoother and
faster transition from education to their first job, which
may be very important in ensuring that they are not
discouraged at the start of their career, especially as par-
ticipants are more likely to be those with lower educational
attainment at an earlier stage (Biavaschi et al. 2012).
the best-known example of a dual-training system is
in Germany. It is complex, having developed over many
years. adequate organizational capacity is required, as is
participation and collaboration of trade unions, the gov-
ernment (including for regulatory frameworks), employ-
ers and others. Particularly for employers, such in-house
training can be costly, making it crucial for the advantages
of such a scheme to be well communicated.
Source: Industrial Development Report 2013 Team.
Box 8.2 Apprenticeship schemes

156
ed
uC
at
Ion
an
d t
ra
InIn
G P
olIC
Ies
For
Cr
ea
tIn
G Jo
Bs
In M
an
uFa
Ct
ur
InG
8
“To develop the higher education system
to better suit industry’s needs for higher
skills, a variety of similar policies need to
be put in place, like those proposed for
general education and TVET systems
advanced countries either train or provide guidelines on how production should take place (Humphrey and Schmitz 2001). This knowledge is useful for the cur-rent job and can be transferred later.
Support private sector–university collaborationWhen skills need to be developed to suit manufactur-ing’s highly sophisticated activities, such as R&D and innovation, universities may be crucial in producing graduates with the right skills, especially in develop-ing countries (World Bank 2010). But as with basic education, and even TVET in many countries, there tends to be little collaboration with the private sector in higher education. Teaching methods are typically academic in style, denying students the opportunity to learn practical skills for manufacturing jobs.
So, to develop the higher education system to bet-ter suit industry’s needs for higher skills, a variety of similar policies need to be put in place, like those pro-posed for general education and TVET systems.
Ensure a focus on youthYoung people are the group most vulnerable to unemployment, especially during a recession. A focus on
Targeted voucher programmestargeted voucher programmes have traditionally been
used to make education more equitable by targeting under-
served groups like women and youth. vouchers for low-
income students can be given for them to get the education
of their choice. the same principle applies to out-of-school
training, similar to vocational training delivered by the pri-
vate sector. this can lead to more efficiency as vocational
training schools depend on revenue from students’ fees.
Levy schemesa national training fund is typically used to finance
employee training inside or outside the enterprise. Financ-
ing is usually secured through payroll-training levies. such
funds are becoming an increasingly common engine for
financing in-firm training and for many countries – often
in latin america and africa – they constitute the embryo
of their emerging educational systems for lifelong learning
(Johanson 2009; unni 2011).
the scattered evidence suggests that these schemes
have helped increase training. In Malaysia employer-
participants of the human resource development Fund
levy were more likely than non-participants to have trained
their employees (tan and Gill 1998). In singapore, through
the skills development Fund, the amount of training by
employers increased (Kuruvilla and Chua 1999; tzannatos
and Johnes 1997; dar, Canagarajah and Murphy 2003).
“a common feature of schemes, in which training has
increased, has been the fact that an effective system is
in place for administering the levy” (dar, Canagarajah and
Murphy 2003, p. 7).
one of the main criticisms is that the scheme is far from
equitable as larger firms tend to benefit more than smaller
ones. smaller firms thus see this scheme more as a tax
burden, and larger companies more as a subsidy, partly
because higher educated workers are more likely than
those with less education to receive training (oeCd 1999).
In developing countries levy schemes are particularly
difficult to implement well because they rely on effective
tax collection. “the high rates of non-compliance are
related to the low administrative capacity of governments
and ineffective levy-collection mechanisms that cannot
target smaller employers” (dar, Canagarajah and Murphy
2003, p. 7). also, procedures for receiving the training
grant can be burdensome – a deadweight for smaller firms.
Source: Industrial Development Report 2013 Team.
Box 8.3 Targeted voucher programmes and levy schemes
Clusters, often built for firms within a manufacturing
subsector, have started to benefit from their geographi-
cal proximity to undergo collective training activities.
this is particularly true in europe, where clusters such
as the advanced textiles manufacturing cluster in Flan-
ders (Belgium), the Brainport high-tech cluster (the
netherlands) or the medical technologies cluster in
Baden-wurttemberg (Germany) are exchanging knowl-
edge and expertise through education and training insti-
tutions. as firms collaborate within these clusters, work-
ers are conscious of the different working environments
and conditions among the firms, exerting pressure on
employers to ensure that employees are satisfied.
Source: CEDEFOP 2012.
Box 8.4 Clustering

157
ed
uC
at
Ion
an
d t
ra
InIn
G P
olIC
Ies
For
Cr
ea
tIn
G Jo
Bs
In M
an
uFa
Ct
ur
InG
8
“It is important to develop structured
and recognized education and training
accessible for the informal sector
jobs for them is important for three main reasons: job-lessness at that stage is a strong predictor of unemploy-ment later; it means a loss in the experience component of human capital formation; and it may discourage some of them, causing them to drop out of the labour market.
So supporting youth is very important, whether the political focus is on industrial competitiveness through skills or on social policies (Box 8.5). The majority of education and training for manufacturing employment and the policies suggested in this chapter are by nature more directed towards youth, particu-larly TVET and apprenticeship.
But these policies may not always be enough to cater to all needs. In developing countries particu-larly – where general educational attainment tends to be lower and students are more likely to have fewer years of education – second-chance initiatives can be particularly beneficial, especially for those on low incomes and in the informal sector.
Do not forget the informal economyAccess to formal or recognized TVET is hard for peo-ple working in the informal sector or in a micro- or
small enterprise. Training is usually informal, on the job and with no recognized certification. In Morocco 80 percent of those in the informal sector, whether employers or employees, had no other skills than those developed on the job. In Ethiopia virtually nobody in the informal sector had any kind of formal training (Walther 2011).
But a significant share of those employed in manu-facturing work in the informal sector or within small firms (many of which operate in the informal econ-omy). Additionally, in many countries the informal sector is the main entry point for youth for any kind of employment, even those who have completed higher education. In Central Africa 60 percent of those who have undertaken a bachelor’s or master’s course started their career in the informal sector (Walther 2011).
So it is important to develop structured and recog-nized education and training accessible for the infor-mal sector to develop the sector, increase its produc-tivity and strengthen the link between the informal and formal economies, making it easier for workers to move from the former to the latter. For such training to be effective, it should focus on addressing the skill
In tunisia the rate of unemployment has reached an aver-
age of 46 percent among qualified youth. after the revolu-
tion employment creation with a special focus on youth
in the lagging regions has become the first development
priority for the new tunisian government.
as part of a project funded by the spanish govern-
ment and the Millennium development Goal Fund, unIdo
in partnership with four other united nations agencies,1
implemented a joint programme to support the tunisian
government in its efforts to create jobs and prevent migra-
tion. unIdo intervention focused on a three-fold approach
that aimed at reinforcing local support structures (public,
private and civil society organizations), assisting young
entrepreneurs to create and develop their enterprises in
selected value chains (such as the handicraft and carpet
value chain) and finally enhancing youth participation and
information sharing through a web-based platform.
here are some results:
• 31 support structures trained in enterprise creation and
development as well as in “counselling” young people.
• 200 youth trained in enterprise creation and develop-
ment, of which 16 youth in the carpet industry.
• 3,000 youth trained and actively engaged on the digi-
tal entrepreneurship Platform.2
• More than 100 enterprises created by youth.
• 900 productive jobs created.
• three studies on “Investment opportunities in the
selected regions”, “handicraft and carpet value-chain
in Gafsa” and “access to finance for youth”.
• two exhibitions of Gafsa carpets in tunis and
amsterdam.
Notes1. the Food and agriculture organization, International
organization for Migration, International labour
organization and united nations development
Programme.
2. see www.dep.tn.
Source: Industrial Development Report 2013 Team.
Box 8.5 Youth unemployment in Tunisia

158
ed
uC
at
Ion
an
d t
ra
InIn
G P
olIC
Ies
For
Cr
ea
tIn
G Jo
Bs
In M
an
uFa
Ct
ur
InG
8
“For such training to be effective, it should
focus on addressing the skill needs of the informal
sector in particular, in addition to enabling access
needs of the informal sector in particular, in addition to enabling access. But as the informal sector has a larger share of young people, women and less-skilled workers, and stretches across all sectors of the econ-omy, a flexible approach is required to offer different schemes to match the sector’s heterogeneity (Gibson 2013).4 Training must also be recognized nationally, with participants receiving certification.
Notes1. Australia, Canada and the European Commission
have identified key competences to be developed for the workforce to prepare better for a chang-ing and increasingly demanding labour market (Mayer 1992; Brunello and Schlotter 2011; EC 2009).
2. A review of the data and different studies by the European Centre for the Development of Vocational Training suggests that TVET has a stronger positive effect on firms in manufacturing than in other sectors (CEDEFOP 2011). Studying the effects of vocational education in Ghana,
Jones (2001) finds that, besides TVET increas-ing manufacturing productivity, employees who have undergone vocational education have higher productivity than graduates with only secondary education, even if the former had fewer years of formal education.
3. The likelihood of firms engaging in formal in-house training depends on three main factors: size – larger firms are more likely to invest in train-ing (Almeida and Aterido 2011); ownership and orientation – foreign and export-oriented firms are more likely to train; and education attainment of the workforce and management and training capabilities of employers – capable workforce and management are more aware of the benefits of training.
4. Although the informal sector has largely been ignored in the past, some developing countries are addressing this omission. For example, the Kenyan government has established a Ministry of Technical Training and Applied Technology, with responsibility for the sector (Gibson 2007).
159
Manufacturing industry worldwide is facing chal-lenges, most fundamentally generating large numbers of jobs while taking into account the impact of climate change, which requires a major transformation and restructuring of industrial activity (see Chapter 6). Yet many developing countries and economies in transi-tion lack the necessary human, financial and technical resources to make this shift – a shortfall that interna-tional cooperation can help address.
After discussing the impact on developing coun-tries of a national policy space that has been curtailed by international agreements on trade, this chapter looks at international cooperation mediated through institutions like the United Nations Conference on Trade and Development (UNCTAD), UNIDO and the International Labour Organization (ILO), par-ticularly in three areas: liberating economic resources for investment in manufacturing, facilitating cross-border adoption of labour standards and generating learning effects on industrial restructuring.
International cooperation in the first of these areas contributes to economic development by pro-viding and protecting investments, often through bilateral investment treaties (BITs). These treaties have fast become a fixture in regulating interna-tional trade, and because they have a measured, positive impact on foreign direct investment (FDI), they have proved useful for regulating cross-bor-der investments. Further, BITs and other invest-ment regulations may also improve conditions for manufacturing-related employment generation, which international organizations can encourage. In the second area cooperation can help harmonize, strengthen and enforce labour standards globally, particularly in the fairly new area of private sustain-ability standards. It can also assist in generating and sharing knowledge – the third area – where emerg-ing platforms and forums that aim to promote indus-trial development can serve as vehicles, as well as the traditional multilateral bodies.
This chapter also stresses the need to ensure that an economic dimension appears on the development agenda after 2015, unlike the original Millennium Development Goals (MDGs). As the world consid-ers how to move beyond the MDGs, the opportunity arises to build a framework with goals anchored in all of the three dimensions of sustainable development – economic, social and environmental.
The trade-off between national policy autonomy and trade liberalizationTo address global environmental and economic chal-lenges, manufacturing industry needs to be trans-formed and restructured into sustainable industry. But to guide and as necessary stimulate this transfor-mation, national regulators need policy autonomy, a position that may be at odds with international coop-eration through trade agreements.
Such agreements seek to reduce barriers to trade and enhance trade through legally binding rules. Yet trade liberalization is not itself the ultimate goal. Even the first paragraph of the preamble to the Marrakesh Agreement Establishing the World Trade Organization (WTO) refers to trade in accord with the objective of sustainable development and the protection and pres-ervation of the environment.1 International coopera-tion, especially through trade and investment agree-ments, aims to lead to regulatory convergence, which requires countries to relinquish some of their policy autonomy (Trebilcock and Howse 1998), thus remov-ing certain policy options from a regulator’s arsenal.
The reduction of policy autonomy can manifest itself in two ways. First, it may no longer be possible to use a certain policy instrument, such as subsidies. Second, a national regulator may have to refrain from introducing new (or applying current) legislation to protect non-trade policy objectives such as health or the environment.
A clear example of the former is the WTO Agreement on Subsidies and Countervailing Measures
Chapter 9
International cooperation

160
Int
er
na
tIo
na
l Co
oP
er
at
Ion
9
“International cooperation can
contribute to manufacturing employment
by legally protecting foreign investors
– a powerful and frequently used policy instrument – which prohibits governments to use subsidies under certain conditions (Coppens 2009, 2013). Similarly, many export restrictions are only allowed when they follow the relevant rules in the General Agreement on Tariffs and Trade (Karapinar 2011).
The debate on the balance between policy auton-omy and trade liberalization is especially heated in cases of the latter type where measures not directly related to trade are assessed for their compliance with trade rules, and these cases give rise to some of the most contentious decisions by the dispute settlement organs of the WTO.
But it would be unfair to qualify WTO dispute settlement as in itself hostile to industrial policies, particularly those related to sustainable industrializa-tion. Considering that the WTO has identified more than 100 trade-restrictive measures, which include some measures with industrial environment in mind, enacted by Group of Twenty countries in only seven months, the disputes before the WTO are merely the tip of the iceberg (EC 2013; WTO 2013). Still, the issue of policy autonomy remains crucial for the legiti-macy of trade agreements.
Bilateral investment treaties – protecting and promoting foreign direct investmentInternational cooperation can contribute to manu-facturing employment by legally protecting foreign investors.2 As the World Investment Report 2011 puts it: “Investment promotion policy can be an impor-tant means to build productive capacity in developing countries” (UNCTAD 2011, p. 105).
FDI influences employment in manufacturing in several ways: by increasing the number of jobs through direct investment in production facilities; by lifting productivity through knowledge spillovers (World Bank 2013a) and by raising the quality of jobs, espe-cially through higher wages and better working condi-tions (Mosley 2011). But as shown in Chapter 5 and touched on again in Box 9.1, FDI is not a one-way bet.
FDI represents a commitment of capital: such investment transfers financial, technological and informational resources from owners in one coun-try to new subsidiaries, plants, offices or owners in a second – host – country. Investing directly in a host country allows firms to circumvent complica-tions associated with servicing foreign markets and
Foreign direct investment (FdI) is not the unmitigated boon
for accelerated economic development that some claim it
to be. First, it can crowd out domestic investment – that
is, investment from foreign sources discourages domestic
investment by host-country nationals (Caves 1996). as de
Backer and sleuweagen (2003, p. 71) put it: foreign firms
paying higher wages “skim the domestic labour market
and decrease the labour supply for domestic companies,
at least in the short term”.
second and relatedly, newer analyses are find-
ing weaker, negative links between innovation and FdI
inflows. this is a significant step backwards for FdI’s pro-
ponents, as a principal rationale for liberalizing access to
FdI is for the domestic market to gain from technological
spillovers. Jin, Garcia and salomon (2013), studying the
spanish manufacturing sector over 1990–2002, find that
as inward FdI flows increase, and despite rises in total
factor productivity and labour productivity, innovation
decreases, measured by the numbers of patent applica-
tions and of new products launched on the market. states
may then be faced with a decision: support productivity
increases by encouraging FdI or favour innovation by lim-
iting FdI.
thus the economic gains promised by FdI are less
clear cut than some supporters argue: crowding out and
stifled innovation create hurdles for domestic employ-
ment generation by eliminating the organic processes
of firm creation and growth. yet these issues are largely
observed in the short term: over longer periods, crowding-
out effects diminish and a measurable uptick appears in
domestic entrepreneurship through learning, networking
and linkage effects between domestic and foreign firms
(de Backer and sleuweagen 2003).
Source: Industrial Development Report 2013 Team.
Box 9.1 A few warning lights for foreign direct investment

161
Int
er
na
tIo
na
l Co
oP
er
at
Ion
9
“Bilateral investment treaties aim
to protect the sources of FDI and so
stimulate investment and create jobs
fragmented production processes (Helpman, Melitz and Yeaple 2003). When FDI roots a firm in a foreign market through a subsidiary or similar entity, firms tap local labour and supply markets to bolster output.
But foreign direct investors run risks, including expropriation and unfair treatment, as FDI host states maintain the legal right to decide how to treat incom-ing foreign investment – a right upheld by the UN Charter in 1974 – meaning that FDI-importing states have full discretion over the conditions, tax rates, property rights, dispute-settlement procedures and treatment afforded to international investors.
Rules established in BITs allay these concerns by requiring states to compensate for expropriation and allowing repatriation of assets. To avert discrimination against foreign investment, BITs also extend national treatment, most-favoured nation treatment and the like to investments defined as FDI in the BIT. BITs thus aim to protect the sources of FDI and so stimu-late investment and create jobs. They mitigate risks and credibly demonstrate the host country’s commit-ment to assuring the legal and domestic conditions to house FDI safely. Governments accede to these strin-gent conditions because the prospects of FDI entice, promising technology transfers and domestic job creation (Elkins, Guzman and Simmons 2006). They are willing to subject themselves to multilaterally sup-ported dispute-settlement mechanisms.
The number of BITs has surged in the last cou-ple of decades as the main tool for states looking to facilitate FDI, from a mere 447 in 1990 to more than 2,000 unique, bilateral agreements in 2000 and more than 3,000 in 2011 (UNCTAD 2011). Recognizing this increasingly dense web, discussions arose within the Organisation for Economic Co-operation and Development (OECD) to harmonize FDI policies in the mid-1990s. The result was a draft agreement called the Multilateral Agreement on Investment, which attempted to institutionalize FDI promotion and protection policies within the OECD and to pro-vide internal dispute resolution mechanisms (OECD 1998). But incompatibility among states’ preferences for the contents of BITs stif led progress towards
multilateral cooperation in 1998, and OECD states subsequently returned to strictly bilateral approaches to regulating FDI.
Generally positive impacts of bilateral investment treatiesThe question remains whether BITs positively – if at all – affect FDI flows. Several authors approach this issue, employing political, economic and legal per-spectives. Neumeyer and Spess (2005), for example, analyse the effect of BITs on FDI flows to developing countries. They find a positive relationship between BITs and FDI, indicating that an agreement – all other factors held constant – increases FDI flows to a BIT signatory. Importantly, FDI inflows are not iso-lated to just the BIT signatory partners, so this result includes FDI inflows from countries without BITs.
More recent findings also tend to find a similarly positive relationship, though these results are con-tingent on political factors. In fact, most of the more recent studies, such Büthe and Milner (2009), depart from traditional trade and legal analyses of BITs to concentrate on political conditions and their role in shaping BITs and FDI. Along this seam, Tobin and Rose-Ackerman (2011) report that political conditions are the most important factors for attracting FDI, but also that a BIT serves as a guarantee to improve politi-cal stability of domestic institutions. In this way BITs are capable of attracting FDI when signed between developed (FDI-exporting) and developing (FDI-importing) states. Still, they find that legal institutions and mechanisms provided for in BITs complement, but do not supplant, sound, functioning domestic institu-tions in the developing country partner.
Mixed results indicate that other factors influence FDI inflows, but as Büthe and Milner (2009) note, BITs are now standard means for states to bilaterally coordinate FDI policies. In this way investors increas-ingly identify BITs as a prerequisite when scouting for new countries for outward FDI (Büthe and Milner 2009). Most notable, though, are BITs’ impacts on regulatory governance and market liberalization. The terms they embody dismantle investment barriers

162
Int
er
na
tIo
na
l Co
oP
er
at
Ion
9
“International bodies have an opportunity to
bolster states’ benefits from bilateral investment
treaties by buttressing coordination efforts
by legally binding signatories to non-discriminatory behaviour towards foreign investors and unparalleled permission for FDI entry. A by-product of relegating dispute-settlement processes to international bodies, BITs strengthen the regulatory quality of their poli-cies on investment.
Allee and Peinhardt (2011) offer more conclusive evidence of BITs’ impact on FDI. They find that sign-ing a BIT increases FDI inflows to signatory states, but this result is conditional, too. An economy’s FDI picks up if the state is neither accused nor found guilty of violating the agreement’s terms. States taken to the International Centre for Settlement of Investment Disputes (ICSID) see a significant decrease in FDI inflows no matter the number of BITs they have signed. Allee and Peinhardt (2011) also note that states must be able to support BIT clauses institution-ally to enjoy the benefits (employment and otherwise) of greater FDI.
Persuading developing countries of the benefits of bilateral investment treatiesDespite the sharp rise in numbers of BITs signed in the last two decades, many countries (mainly developing) have failed to be among the parties. International bod-ies have an opportunity to bolster states’ benefits from them in four ways, by buttressing coordination efforts.
First, investment-related international cooperation can be multilateral or bilateral. Multilateral agree-ments are far better for efficiency and economic ben-efit, but are much harder to conclude and none is likely in the near future. Here is where international organi-zations can initially help: they can serve as a vehicle or forum for aggregating interests. As seen, multilateral efforts in the OECD in the later 1990s failed due to irreconcilable differences on investment protection. Since then the number of parties in BITs, and thus with “unique preferences” on protection, has risen, complicating prospects for a multilateral agreement.
International organizations can instead support bilateral and regional efforts by extending their data-bases on investment agreements and ensuring trans-parent reporting of agreements signed, cases disputed
and the firms and locations of FDI. Such data are valu-able for states considering new negotiations or firms seeking new investment locations. This will aid devel-oping countries especially, as knowledge on standard conditions for national treatment and disputes can help them negotiate better. Moreover, understand-ing the public nature of such data encourages states to comply more rigidly with the agreements they have signed, which in turn increases the credibility of their commitments (Büthe and Milner 2009).
Second, international organizations can provide consultative services to states interested in pursuing BITs or other investment agreements. Negotiations often begin with a template that states keep on file and alter according to the partners targeted for a par-ticular agreement. But developing states often lack the administrative capacity to fully develop such a tem-plate or, worse still, lack the administrative capacity to negotiate with states holding greater bargaining power. To this end, international organizations can lend expertise to developing states to institute a well-rounded BIT template or to train administrative staff responsible for negotiations on strategies and typical agreement clauses. UNCTAD and UNIDO seem particularly fit for such a task, as its in-house exper-tise on BITs is substantial. For example, UNIDO’s Investment Promotion Programme has been provid-ing advice and capacity building for 30 years to invest-ment promotion officers in the developing world, help-ing start international industrial partnerships through FDI in developing countries and establish investment and technology promotion units and agencies in developed and developing countries.
Third, international organizations can disseminate knowledge on investment agreements. Although viola-tions of BITs’ terms trigger marked reputational dam-age that hurts FDI inflows, developing states largely consider BITs ceremonial agreements with little or non-strictly binding terms (Allee and Peinhardt 2011). Here ICSID can disseminate information to states less keen on litigation (usually developing countries) on how to use ICSID to settle disputes, by creating a lend-ing system for states burdened by dispute-settlement

163
Int
er
na
tIo
na
l Co
oP
er
at
Ion
9
“International organizations should also
ensure that their capacity building has a focus on
technical expertise in bilateral investment treaties
costs and by advising states negotiating BITs on the implications of clauses related to dispute settlement.
Fourth, academic studies indicate BITs’ posi-tive influence on FDI flows, noting that signing and fulfilling the terms of a BIT increase FDI flows to partner countries (Haftel 2010), but only if the states show institutional quality (Büthe and Milner 2009), especially in the judiciary (Tobin and Rose-Ackerman 2010). So international organizations with expertise in establishing domestic institutions, ensuring their quality and monitoring their functioning can inter-vene to improve institutional quality where most per-tinent to BITs. Tapping the data and resources of bod-ies like the European Commission, ICSID, OECD, UNCTAD, UNIDO and World Bank can translate vast quantities of information into capacity building for domestic institutions. International organizations should also ensure that their capacity building has a focus on technical expertise in BITs.
Private sustainability standardsAnother area for international cooperation is in inter-national labour standards, particularly for manu-facturing. They have a long history, often tied to the
ILO, which urges their global adoption. Thus over many decades a body of international rules has devel-oped on labour standards including wages, worker safety and collective bargaining. Beyond the ILO’s norms and procedures to enforce them, trade unions, nongovernment organizations and social movements have put enforcement high on the political agenda, and often criticize national and international govern-mental agencies for not enforcing them properly (de Bakker et al. 2013; Keck and Sikkink 1998), as well as many leading firms and brand owners. Social activists’ discovery that reputation was a firm’s tangible asset that they could easily harm spurred a proliferation of social protests, such as the Clean Clothes Campaign, directed at apparel and textile firms (Bartley 2003).
These criticisms prompted firms in the early 1990s to respond with new forms of private govern-ance, which aimed to assure international standards along the whole value chain (Abbott and Snidal 2009; Mattli and Woods 2009). First, many firms established codes of conduct and initiatives on cor-porate social responsibility (CSR; Box 9.2). In 2003 the World Bank estimated that firms had more than 1,000 codes of conduct, many in manufacturing
In a world attuned to voluntary regulation, corporate social
responsibility (Csr) has emerged as a promising tool to
incorporate environmental and social concerns in industrial
restructuring. But large multinationals dominate the Csr
movement, a concern for the united nations and its special-
ized agencies, which aim to bring small and medium-size
enterprises (sMes) into the movement. Multinationals often
invest heavily in Csr policies and campaigns, putting pres-
sure on smaller companies that supply them or struggle
to make their own way in the international market. already
grappling with requirements to meet strict standards on
food safety and quality, many sMes lack the expertise or
finance to build sustainable business and employment prac-
tices. without help to create socially responsible and sus-
tainable practices, they risk being left behind as big market
players look to suppliers who can meet these criteria.
working with large private companies, interna-
tional organizations such as the International labour
organization and unIdo are adapting their technical
assistance programmes to include the Csr needs of
sMes in their projects (Ilo 2013; unIdo 2013b). they
receive support in better management techniques, pro-
ductivity and safer, sustainable production and labour
practices, which should create a win-win situation for both
suppliers and buyers as large companies can demon-
strate their commitment to social inclusion and to society
by bringing smaller suppliers further into the value chain.
From the point of view of sMes, if companies achieve
lower absenteeism, fewer accidents and better working
conditions, along with lower energy consumption and
waste, then competitiveness as well as social and envi-
ronmental responsibility can go together. In practice these
projects show that the business case for Csr for smaller
companies is no different from that of large corporations –
better productivity, morale and competitiveness.
Source: Industrial Development Report 2013 Team.
Box 9.2 Corporate social responsibility and industrial restructuring

164
Int
er
na
tIo
na
l Co
oP
er
at
Ion
9
“Pioneering labelling and certification
schemes involved firms, non-governmental
organizations, trade unions, governments
and international organizations to create
new forms of international regulation
subsectors such as textiles, footwear and wood pro-cessing, and many more have come about since. But many codes have been attacked for being too weak and serving as mere “window dressing” (Wells 2007), encouraging yet new forms of private governance that brought together actors and stakeholders.
Besides those from multilateral organizations, many private initiatives emerged such as the Fair Labor Association and Social Accountability 8000. These pioneering labelling and certification schemes involved firms, non-governmental organizations, trade unions, governments and international organi-zations to create new forms of international regulation (Abbott and Snidal 2009).
Labour standards also spilled over into many other initiatives aimed at promoting such “private sustainability standards” through certification and eco-labelling (Abbott and Snidal 2009; Marx 2011).3 Transnational certification initiatives aim to imple-ment labour standards in global production processes and communicate to consumers across national and regional markets that certified products have been made according to these standards.
This proliferation of labels and certification sys-tems was driven by several interrelated factors, includ-ing the commitment of multinational firms to CSR (O’Rourke 2012) and that of governments to support private sustainability standards through public pro-curement legislation.
Many such standards now cover multiple sectors, with many variations, but common characteristics are an organization that defines social and ecological standards – and procedures to check that products or processes conform to these standards. When they conform, a certificate is awarded (sometimes used for advertising and promotion), and here differences emerge in stringency of standards (Fransen 2012; O’Rourke 2003) and the certification procedure (Gereffi, Garcia-Johnson and Sasser 2001).
Impact on labour conditionsPrivate sustainability standards were initially wel-comed as “one of the most innovative and startling
institutional designs of the past 50 years” (Cashore, Auld and Newsom 2004) and were regarded as key instruments in ratcheting up labour standards internationally (Sabel, Fung and O’Rourke 2000). But doubts have emerged more recently over their potential to improve labour conditions in developing countries.
Some reservations stem from journalistic expo-sés of certified factories that breach the standards, most dramatically recent fires in garment factories in Bangladesh and Pakistan, which killed many hun-dreds of workers. Others come from the lack of cred-ible empirical data that these systems are effective.
Effectiveness in this context is often measured along two dimensions: problem solving and process (Marx, Bécault and Wouters 2012; Tikina and Innes 2008). The former is the degree to which the prob-lem that prompted the certification initiative is solved (often compliance with ILO conventions and stand-ards); the latter evaluates the adoption rate of certi-fication initiatives by firms (the number of certified firms).
On problem solving there is some evidence that private sustainability standards improve working conditions. For the Forest Stewardship Council, de Azevedo and de Freitas (2003) analyse the impact of certification on working conditions of workers in the Amazon basin in Brazil and find that in certified forests the logging camps and safety of forest opera-tions are significantly better than in non-certified forests. But some “on the ground” reports or testimo-nies call into question the thoroughness of audited factories’ compliance with labour conditions, ques-tioning their impact (Esbenshade 2004; Locke 2013; O’Rourke 2000).
For process effectiveness, annual reports of the leading initiatives on private sustainability standards show that the number of certified factories is limited, pointing to a very low overall adoption rate given that many retailers work with several thousands of con-tractors, each with several subcontractors. In addition, most certification is in only a few countries such as Bangladesh, China, India, Pakistan and Viet Nam.4

165
Int
er
na
tIo
na
l Co
oP
er
at
Ion
9
“Multilateral organizations are becoming
key knowledge managers and coordinators,
bringing together actors to share their
information and learn from others
Private sustainability standards and international cooperationThus how these mechanisms are playing out in the real world is largely unknown. No sound, overall quantitative studies – to our knowledge – exist that estimate the effects of these mechanisms on labour conditions or employment. The scattered available studies give some evidence on certain aspects but no consolidated picture (Locke 2013; Reich 2008; Vogel 2008). Here lies an important role for multi-lateral organizations, especially a new international body, the United Nations Forum on Sustainability Standards (Box 9.3).
Generating and sharing knowledgeMultilateral organizations are becoming key knowl-edge managers and coordinators, bringing together actors to share their information and learn from oth-ers. International cooperation on knowledge sharing is expected to enhance mutual learning and peer review, identify good practices and their conditions for trans-ferability and develop joint policy initiatives or iden-tify areas where joint initiatives can reinforce states’ current policies (Tholoniat 2010).
The key focus in sharing knowledge is on manag-ing and coordinating knowledge (Abbott and Snidal 2010). Several authors propose a comprehensive approach to knowledge management with a strong emphasis on a networked approach to learning and
improved network management (Rayner, Buck and Katila 2011). The former is necessary because improved knowledge management does not necessar-ily lead to learning. A key issue is bridging knowledge generation and use, which can be achieved through networked learning platforms defined “as an inte-grated set of services that provide information, tools and resources to support policy learning” (Rayner, Buck and Katila 2011, p. 141).
These knowledge platforms aim to promote struc-tural change and green growth strategies, including UNIDO’s Green Industry Platform. This is a vol-untary multi-stakeholder partnership designed to provide a framework for participants, individually or in groups, to take specific and measurable action to advance environmentally sustainable approaches and employment in industry (GIP 2013).
Sustainable manufacturing and employment post-2015As the world considers how to move beyond the MDGs after 2015, the opportunity arises to build a framework with goals anchored in the three dimen-sions of sustainable development – economic, social and environmental. The eight MDGs were intended to unify pursuit of these three dimensions, but an eco-nomic dimension was missing and a target on employ-ment was only added in 2008 (UN System Task Team 2012). Generating new employment remains a
the united nations Forum on sustainability standards
(unFss) is a new platform to generate knowledge and
information on private sustainability standards with a
particular focus on their potential contribution to devel-
opment. It is a joint initiative of the Food and agriculture
organization, unIdo, International trade Centre, united
nations environment Programme and united nations
Conference on trade and development. unFss can make
a contribution in several areas.
First, it could pool data and research on the effec-
tiveness of these systems and their potential employ-
ment impact. In doing so, it might consider expanding
the systems’ focus (not only agri-foods) to the sectors
in manufacturing where private standards are important,
such as textiles, apparel, leather, wood products, paper,
chemicals and furniture.
unFss could also consider developing a watchdog
function for private sustainability standards. some authors
have argued that these systems differ in several aspects
directly related to their effectiveness and potential employ-
ment, in numbers and quality (o’rourke 2003; sabel, Fung
and o’rourke 2001; van waarden 2011). Most important,
these systems differ in how they enforce standards.
Source: Industrial Development Report 2013 Team.
Box 9.3 United Nations Forum on Sustainability Standards

166
Int
er
na
tIo
na
l Co
oP
er
at
Ion
9
“The post-2015 agenda offers a new
opportunity for states to recouple considerations
for sustainable manufacturing and employment
with the focus on human development
pivotal global social concern, however: the first indica-tive findings from the United Nations–led consulta-tions on the post-2015 development agenda, through which more than 200,000 people from across the world contributed their views on the ideal develop-ment priorities after the expiry of the MDGs, show that job creation will remain a major social challenge, encompassing almost all economies well beyond 2015 (UNDG 2013). The post-2015 agenda thus offers a new opportunity for states to recouple considerations for sustainable manufacturing and employment with the focus on human development that dominated the original MDG programme, by recommitting to the economic dimensions of development.
Four challenges stand out: concerns about the nature of the relationship among growth, equality and development; perceptions by some parties of histori-cal over-emphasis on economic globalization and the market or on the role of public policy in economic activity; uncertainty about the environmental and resource impacts of expanding the productive activi-ties of developing countries; and fear of obscuring the clarity and simplicity of the outcome-oriented MDGs. All need to be squarely addressed in the post-2015 pro-cess (UN 2013c).
The first steps in this direction are evident in the United Nations High Level Panel of Eminent Persons on the Post-2015 Development Agenda, which com-bines global development and sustainability with pro-visions and goals for industry and trade.5 Reflecting on the accomplishments achieved and the hurdles encountered under the MDG programme, the Panel outlined five transformative shifts. One transforma-tion specifically links “sustained, long term, inclusive growth” to overcoming the challenges of unemploy-ment, resource security and adaptation to climate change and calls for the transformation of economies for jobs and inclusive growth (UN 2013b). Targeted efforts to meet these goals hold the potential to pro-vide 47 million more workers with good jobs and livelihoods and to equip 200 million more young peo-ple with the skills they need to get good work (UN 2013b). Following the Panel’s report, the General
Assembly reaffirmed the essential contribution of industrial development and employment to achieving internationally agreed development goals and called for “giving appropriate consideration to the issue of industrial development in the elaboration of the devel-opment agenda beyond 2015” (UN 2013c, p. 3).
The findings of the Panel and the implications from other post-2015 processes such as the Open Working Group on Sustained and Inclusive Economic Growth, Infrastructure and Industrialization indicate that clear action from international organizations can aid in addressing these concerns as well as building the capabilities and labour forces that will allow countries to resolve these global development challenges.
Fully bringing sustained, inclusive and sustainable economic growth, manufacturing and employment into the post-2015 development framework means paying careful attention to the globalization of pro-duction, trade, technology and finance that has made manufacturing more international and made it harder for developing countries to compete internationally. A strategy based on developing the productive resources, entrepreneurial capabilities and production linkages that together determine the capacity of a country to produce goods and services and enable it to grow and develop could set the stage for a new development part-nership (UNCTAD 2010b). Along these lines, Japan has proposed a post-2015 Pact for Global Wellbeing, prioritizing growth that is green, inclusive, shared and knowledge based (Berg and Melamed 2012).
These visions of a future where economic growth and manufacturing employment are more stable, inclu-sive, sustainable and equitable arguably contrast with the more “quick-win” approach of the MDG era. It remains to be seen to what extent the General Assembly will adequately resolve these issues when it ultimately decides on the post-2015 development agenda during its 69th session opening in September 2014.
Notes1. The first paragraph of the preamble states:
“Recognizing that their relations in the field of trade and economic endeavour should be

167
Int
er
na
tIo
na
l Co
oP
er
at
Ion
9conducted with a view to raising standards of living, ensuring full employment and a large and steadily growing volume of real income and effective demand, and expanding the production of and trade in goods and services, while allow-ing for the optimal use of the world’s resources in accordance with the objective of sustainable development, seeking both to protect and pre-serve the environment and to enhance the means for doing so in a manner consistent with their respective needs and concerns at different levels of economic development ” (WTO n.d.).
2. This chapter does not focus on the many different forms of official development assistance (grants and loans) in which international organizations are involved.
3. In the literature one can find many different refer-ences to a similar phenomenon: private standards,
labels, certificates, sustainability standards and so on. We refer to “private sustainability standards” as this is the term used in the new United Nations Forum on Sustainability Standards.
4. For data on certified facilities (including break-down by country) of two leading certification initiatives, Fair Labor Association and Social Accountability International, see FLA (2012) and SAAS (2013).
5. In July 2012 Secretary-General Ban Ki-moon assembled a 27-member High Level Panel to advise on the global development framework beyond 2015. The aim of the Panel was to draw up a report on the post-2015 development goals after consultations with civil society, the private sector, academia and research institutions from all regions in the world. The aim of the report: to set out a new development framework.


169
Part BTrends in manufacturing valued added and in manufactured exports

170
Since the start of this century industrializing econo-mies have accounted for a growing share of the world’s manufacturing value added (MVA). This trend is as much the result of a gradual shift of production from industrialized to industrializing countries to benefit from cheaper labour, largely improved infrastructure and lower social costs, as it is a reflection of the growth of industrializing countries’ domestic markets for industrial goods due to higher incomes and a fast-ris-ing middle class.
The world’s MVA reached an all-time high of $8,900 billion in 2012 (16.7 percent of global GDP), recovering fully from the sharp contraction of 2008–2009 caused by the global economic and financial crisis (Figure 10.1).1 MVA’s share in GDP in indus-trialized countries fell from 16.4 percent in 1990 to 15.0 percent in 2012, while it rose from 16.5 percent to 21.3 percent in industrializing countries.2
In manufacturing, globalization of production and the accompanying trade liberalization seem to benefit
industrializing countries, bringing in more financial resources, supporting economic growth and generat-ing employment for a growing population, if at the risk of increasing their vulnerability to external shocks. Conversely, some industrialized countries are facing the tougher task of having to adapt to the new world economic scenario with stagnating growth, budgetary constraints, unemployment and social unrest.
Manufacturing in industrializing countriesBetween 1992 and 2012 global MVA nearly doubled, from $4,960 billion to $8,900 billion, averaging 3 per-cent annual growth. While MVA expanded by a mere 1.8 percent a year in industrialized countries, below their 2.1 percent annual GDP growth rate for the period, it rose more than three-fold in industrializing countries, at an annual rate of 6.4 percent, faster than their 5.0 percent a year GDP growth rate (Table 10.1). The outcome was a near-doubling in the share in world MVA held by industrializing countries, from 18 per-cent in 1992 to 35 percent in 2012 (Figure 10.2) and a corresponding retreat of industrialized countries from the world’s manufacturing scene, underscoring the structural changes taking place in both groups.
These long-term trends conceal a clear change of pattern around the turn of the century, coincid-ing with the accession of China to the World Trade Organization and the increased trade liberalization and globalization of production that ensued. Over 1992–2002 the annual growth of world MVA aver-aged 2.9 percent, whereas over 2002–2012 it averaged 3.1 percent. Accompanying this seemingly minor dif-ference was a remarkable acceleration in MVA growth in industrializing countries, from an average annual 5.3 percent over 1992–2002 to 7.4 percent over 2002–2012. This surge was more than enough to offset the deceleration in MVA growth in industrialized econo-mies, which fell from an average annual 2.3 percent to 1.4 percent over the same periods.
Chapter 10
Trends in manufacturing value added
Figure 10.1 Manufacturing value added by development group, 1990–2012
0
2,000
4,000
6,000
8,000
10,000
201220102008200620042002200019981996199419921990
2005
$ b
illio
ns
World
Industralized countries
Industralizing countries
Source: UNIDO estimate based on UNIDO (2013c).

171
tr
en
ds
In M
an
uFa
Ct
ur
InG
va
lue
ad
de
d
10
“Between 1992 and 2012 global MVA nearly
doubled, from $4,960 billion to $8,900 billion,
averaging 3 percent annual growth
China sustained extremely high but stable MVA growth throughout both periods, with annual rates averaging 11.5 percent over 1992–2002 and 11.3 percent over 2002–2012, respectively, in itself an extraordinary performance but not an explanation for the change of pattern. Instead, it is other industrializing countries such as India (6.9 percent over 1992–2002; 8.2 percent over 2002–2012), Turkey (3.0 percent; 6.0 percent), Poland (8.0 percent; 8.9 percent), Argentina (–1.3 percent; 7.4 percent), Belarus (2.0 percent; 10.1 percent), Peru (3.9 percent; 6.5 percent) and Bangladesh (6.7 percent;
7.8 percent) that have seen a sharp acceleration of MVA growth since 2002 and are thus responsible for the increased dynamism. Given that it was in the second period when the economic and financial crisis set on, the emerging pattern gains in significance.
Despite the gain in world MVA share, manufac-turing performance among industrializing countries and regions varies widely. China increased its share in global MVA nearly five-fold over 1992–2012, reach-ing 17.5 percent, and confirmed its role as the second-largest manufacturer behind the United States. India
Manufacturing value added (constant 2005 $ billion)
Share of manufacturing value added (percent)
1992 2002 2012 1992 2002 2012
World 4,960 6,590 8,900 100 100 100
Industrialized economies 4,050 5,070 5,800 82 77 65
Industrializing economies 904 1,520 3,110 18 23 35
By industrialization level
Emerging industrial economies 778 1,340 2,820 86 88 91
Other industrializing economies 111 157 240 12 10 8
Least developed countries 14 22 44 2 1 1
By region
East Asia and the Pacific 267 684 1,810 30 45 58
Excluding China 87 149 253 10 10 8
Europe 92 106 186 10 7 6
Excluding Poland 74 68 97 8 4 3
Latin America and the Caribbean 320 391 517 35 26 17
Excluding Mexico 214 246 340 24 16 11
Middle East and North Africa 96 134 221 11 9 7
Excluding Turkey 49 71 107 5 5 3
South and Central Asia 81 143 294 9 9 9
Excluding India 32 49 89 4 3 3
Sub-Saharan Africa 48 62 84 5 4 3
Excluding South Africa 20 25 37 2 2 1
By income group
High income industrializing 175 273 495 19 18 16
Upper middle income industrializing 57 91 163 6 6 5
Lower middle income industrializing 657 1,140 2,410 73 75 78
Low income industrializing 15 21 41 2 1 1
Source: UNIDO estimate based on UNIDO (2013c).
Table 10.1 Manufacturing value added in industrializing countries, by industrialization level, region and income group, 1992, 2002 and 2012

172
tr
en
ds
In M
an
uFa
Ct
ur
InG
va
lue
ad
de
d
10
“Manufacturing in industrializing countries
is geographically highly concentrated, with
the five leading economies accounting for
70.9 percent of total production in 2012
also had an impressive performance (though from a much lower base), with its share in global MVA grow-ing four-fold in the same period and attaining 2.3 per-cent in 2012.
East Asia and the Pacific ($1,810 billion) accounted for 58 percent of industrializing country MVA in 2012, almost doubling its weight in 20 years
and drawing largely on China’s performance. South and Central Asia ($294 billion), the second-most dynamic region, managed to keep its industrializing country MVA share at 9 percent. By contrast, over 1992–2012 the industrializing country MVA share of Latin America and the Caribbean ($517 billion) fell by half from 35 percent to 17 percent, as years of eco-nomic restructuring under extreme liberalization and financial tightness drove economic activity away from manufacturing and into commodities and services. A similar phenomenon is observed in Europe ($186 bil-lion in 2012), where the industrializing country MVA share tumbled from 10 percent in 1992 to 6 percent in 2012 as most of its countries struggled with the demands of restructuring following the adoption of a market economy. The Middle East and North Africa ($219 billion) and Sub-Saharan Africa ($84 billion) performed better but still lost some of their share in industrializing country MVA over the past 20 years.
Manufacturing in industrializing countries is geo-graphically highly concentrated, with the five lead-ing economies accounting for 70.9 percent of total production in 2012, up from 52.7 percent in 1992 (Figure 10.3). The high and sustained MVA growth in China over this period (11.4 percent on average) is behind its emergence as the factory of the world: in
Figure 10.2 Industrializing countries’ share in world manufacturing value added and GDP, 1990–2012
0
10
20
30
40
201220102008200620042002200019981996199419921990Indu
stra
lizin
g co
untri
es’ s
hare
in w
orld
man
ufac
turin
g va
lue
adde
d an
d G
DP
(per
cent
)
GDP
Manufacturing value added
Source: UNIDO estimate based on UNIDO (2013c).
Figure 10.3 Share of largest industrializing economies in manufacturing value added for all industrializing countries, 1992, 2002 and 2012
1992 2002 2012
China19.9%
China35.2%
China50.0%
Others47.3%
Others36.7%
Others29.2%
Brazil10.5%
Brazil8.1%
Brazil4.9%
Indonesia4.4%
Turkey3.7%
Turkey5.3%
Mexico11.7%
Mexico9.5%
Mexico5.7%
India6.2%
India6.6%
India5.3%
Source: UNIDO estimate based on UNIDO (2013c).

173
tr
en
ds
In M
an
uFa
Ct
ur
InG
va
lue
ad
de
d
10
“The share of resource-based products in
global manufacturing fell from 31.5 percent
in 2002 to 26.8 percent in 2011, while the
share of medium- and high-tech products
rose from 43.2 percent to 47.8 percent
2012, 50 percent of industrializing-country manu-factured goods was produced in China. Of all other large industrializing economy manufacturers, only India (7.4 percent average annual MVA growth) kept pace with China’s expansion. It gained MVA share to become the second-leading manufacturer among industrializing economies, superseding Mexico and Brazil, which saw their MVA shares fall more than half from 11.7 percent and 10.5 percent in 1992 to 5.7 per-cent and 4.9 percent in 2012. Turkey’s steady MVA growth (4.5 percent on average a year over 1992–2012)
enabled it to preserve its position as the fifth-largest manufacturer among industrializing economies.
Manufacturing value added by technological categoryManufacturing is continually shifting to products with higher technological complexity. The share of resource-based products in global manufacturing fell from 31.5 percent in 2002 to 26.8 percent in 2011, while the share of medium- and high-tech products rose from 43.2 percent to 47.8 percent (Table 10.2).
2002 2005 2008 2011
RB LT MHT RB LT MHT RB LT MHT RB LT MHT
World 31.51 25.32 43.17 29.60 25.29 45.12 27.81 25.15 47.04 26.75 25.42 47.83
Industrialized economies 29.42 24.84 45.74 27.49 24.35 48.16 25.59 23.58 50.83 24.52 22.44 53.04
Industrializing economies 39.66 27.18 33.15 35.97 28.12 35.91 32.86 28.73 38.42 30.29 30.17 39.53
By industrialization level
Emerging industrial economies 37.82 27.57 34.61 34.47 28.35 37.18 31.49 28.87 39.63 29.10 30.45 40.45
Other industrializing economies 52.78 25.04 22.18 49.26 26.93 23.81 47.34 28.26 24.40 47.01 27.08 25.91
Least developed countries 67.58 11.64 20.78 67.35 11.70 20.95 71.29 10.93 17.78 72.95 10.55 16.50
By region
East Asia and the Pacific 36.58 23.85 39.58 32.40 26.59 41.02 29.68 28.42 41.90 27.28 31.10 41.62
Excluding China 47.97 19.80 32.23 43.70 19.65 36.65 42.12 17.32 40.57 42.90 17.22 39.88
Europe 45.46 32.91 21.64 42.91 32.49 24.60 40.20 32.12 27.68 38.42 31.44 30.14
Excluding Poland 46.78 32.87 20.35 44.99 33.10 21.91 44.79 31.55 23.66 45.24 30.36 24.40
Latin America and the Caribbean 41.40 27.01 31.59 40.52 27.35 32.12 40.06 26.82 33.13 40.62 25.27 34.11
Excluding Mexico 42.79 32.62 24.59 41.28 32.39 26.33 40.57 31.53 27.90 41.58 29.53 28.89
Middle East and North Africa 47.00 27.72 25.28 41.79 28.97 29.24 39.57 29.26 31.18 40.30 27.06 32.65
Excluding Turkey 44.55 28.92 26.53 41.84 29.78 28.38 39.95 30.69 29.36 41.52 27.97 30.51
South and Central Asia 31.12 37.30 31.58 29.32 35.20 35.48 25.27 32.99 41.74 24.57 32.75 42.69
Excluding India 44.44 31.25 24.32 41.91 30.60 27.49 41.03 30.99 27.98 39.70 30.87 29.44
Sub-Saharan Africa 50.80 23.54 25.66 50.39 23.61 26.00 48.86 24.60 26.55 49.00 24.88 26.11
Excluding South Africa 72.48 17.87 9.66 68.42 21.74 9.83 66.40 24.09 9.51 66.17 25.53 8.29
By income group
High income industrializing 43.35 28.84 27.81 39.76 28.33 31.91 35.32 26.91 37.77 35.20 26.19 38.61
Upper middle income industrializing 43.17 30.36 26.47 40.82 29.80 29.38 38.02 29.79 32.19 35.81 29.78 34.41
Lower middle income industrializing 38.09 26.59 35.32 34.50 28.07 37.43 31.79 29.13 39.08 29.07 30.88 40.05
Low income industrializing 66.82 12.74 20.44 65.75 13.05 21.20 69.04 13.22 17.73 71.84 12.45 15.71
RB is resource-based; LT is low-tech; MHT =is medium- and high-tech.Note: Value added at constant 2005 $.Source: UNIDO estimate based on UNIDO (2013c).
Table 10.2 Technology composition of manufacturing value added, by industrialization level, region and income group, selected years, 2002–2011 (percent)

174
tr
en
ds
In M
an
uFa
Ct
ur
InG
va
lue
ad
de
d
10
“The rate at which industrializing
countries have modified their industrial
structure and, especially, shifted from
resource-based manufacturing over
2002–2011 is particularly noteworthy
Industrialized and industrializing countries exhib-ited similar trends, with their share of resource-based products declining and that of medium- and high-tech products rising over 2002–2011. Low-tech manufacturing maintained its MVA share of around 25 percent over 2002–2011 worldwide but there was a substantial relocation of production from industrial-ized to industrializing countries, mainly to China, in search of lower labour costs and closer access to rapidly growing markets.
The rate at which industrializing countries have modified their industrial structure and, especially, shifted from resource-based manufacturing over 2002–2011 is particularly noteworthy. Their share of these products fell from 39.7 percent to 30.3 percent over the period and matched in 2012 the weight of resource-based manufacturing in industrialized coun-tries in 2002. Equally noteworthy is the persistent concentration of medium- and high-tech manufactur-ing in industrialized countries. The recent economic crisis hit resource-based and low-tech manufacturing in these countries hard, but the production of tech-nologically complex goods seems to have persisted. By 2011 the share of these products in the industrialized countries’ MVA had risen to 53 percent.
Regionally, South and Central Asia has experi-enced a substantial reduction in the share of both resource-based (to 24.6 percent in 2012) and low-tech products (to 32.8 percent), and an increase in the share of medium- and high-tech products (from 31.6 per-cent to 42.7 percent), largely relying on the transfor-mation of the manufacturing base in India with more technologically advanced products. East Asia and the Pacific already had a fairly high share of medium- and high-tech products in 2002, which increased to 41.6 percent in 2011 as other economies in the region joined China in producing technologically complex goods for global value chains and production net-works. The relocation of low-tech production from industrialized countries, mainly but not exclusively to China, accounts for the expansion of the MVA share of these products in the region from 23.9 percent in 2002 to 31.1 percent in 2011.
Europe and the Middle East and North Africa exhibit a similar pattern of shedding resource-based manufacturing (the respective shares fell to 38.4 per-cent and 40.3 percent in 2011) and embracing medium- and high-tech production (the respective shares rose to 30.1 percent and 32.7 percent in 2011), but they still have a long way to go to reach average industrializing-country shares for both categories. Latin America and the Caribbean and Sub-Saharan Africa have shown the least change in their manufac-turing base in terms of technological complexity of products over 2002–2011: as in 2002, in 2011 they were heavily concentrated in producing resource-based goods (with shares of 40.6 percent and 49.0 percent, respectively), and marginally increased their medium- and high-tech manufacturing (to 34.1 percent and 26.1 percent, respectively).
Manufacturing value added by industry sectorIn 2011 the dominant manufacturing sectors world-wide were food and beverages (11.6 percent), chemi-cals and chemical products (11.2 percent), machinery and equipment (8.9 percent), basic metals (8.6 per-cent) and radio, television and communication equip-ment (8.3 percent; Table 10.3). The last two had made significant gains over 2002–2011 thanks to the higher demand for basic metals derived from the acceleration of MVA growth in industrializing countries and the global surge in demand for electronic devices. Fifteen manufacturing sectors registered a decrease in their MVA share worldwide over 2002–2011, from a com-bined 70.4 percent to 62.0 percent, including mainly traditional manufacturing sectors such as food and beverages, textiles, wood products, and paper and printing, but also coke and refined petroleum prod-ucts, chemicals, rubber, non-metallic products, fabri-cated metal products, furniture and even motor vehi-cles. The only seven sectors that increased their MVA share, from a combined 29.4 percent to 38.0 percent, were largely advanced manufacturing such as machin-ery and equipment; office, accounting and computing machinery; electrical machinery; radio, television and

175
tr
en
ds
In M
an
uFa
Ct
ur
InG
va
lue
ad
de
d
10
“In 2011 industrializing countries
accounted for more than two-thirds
(70 percent or more) of world production of
low-tech products in labour-intensive sectors
communication equipment; medical, precision and optical instruments; and other transport equipment, which confirms the shift towards production with higher technological complexity worldwide.
In industrializing countries the leading sectors in 2011 were basic metals (15.1 percent), food and bever-ages (12.1 percent) and chemicals and chemical prod-ucts (10.4 percent). The near doubling of the share of basic metals in a short time (from 8.2 percent in 2002) is an indicator of the impact that the pull effect of accelerated manufacturing in industrializing countries is having on resource-producing countries. Machinery and equipment (7.2 percent) and radio, television and
communication equipment (6.1 percent) also showed large gains in MVA share.
In 2002 industrialized countries were gener-ally the largest producers (52 percent or more) in all manufacturing sectors (Table 10.4). The substantial industrialization efforts and expansion of markets in industrializing countries since 2002, coupled with the repercussions of the recent crisis on industrialized countries, have produced a significant shift in the dis-tribution of manufacturing activities worldwide, and in 2011 industrializing countries accounted for more than two-thirds (70 percent or more) of world production of low-tech products in labour-intensive sectors such as
International Standard Industrial Classification description
Industrializing countries Industrialized countries World
2002 2005 2008 2011 2002 2005 2008 2011 2002 2005 2008 2011
Food and beverages 16.1 14.7 13.4 12.1 11.6 11.3 11.1 11.2 12.5 12.2 11.8 11.6
Tobacco products 3.5 3.0 2.7 2.5 1.0 0.9 0.8 0.7 1.5 1.4 1.3 1.4
Textiles 5.7 5.2 4.7 4.4 2.2 1.8 1.4 1.2 2.9 2.6 2.4 2.4
Wearing apparel and fur 3.7 3.4 3.1 3.0 1.4 1.0 0.9 0.8 1.8 1.6 1.6 1.6
Leather, leather products and footwear 1.8 1.4 1.3 1.3 0.6 0.4 0.3 0.3 0.8 0.7 0.6 0.7
Wood products (excluding furniture) 1.6 1.4 1.1 1.1 2.0 2.0 1.6 1.5 1.9 1.8 1.5 1.3
Paper and paper products 3.2 2.9 2.8 2.7 3.0 2.8 2.6 2.5 3.0 2.9 2.7 2.6
Printing and publishing 2.0 1.8 1.5 1.2 4.5 4.2 3.9 3.7 4.0 3.6 3.2 2.7
Coke, refined petroleum products and nuclear fuel 6.0 5.2 4.5 3.7 3.4 3.5 3.3 3.2 3.9 3.9 3.7 3.4
Chemicals and chemical products 11.2 11.3 10.9 10.4 11.9 12.0 11.5 11.8 11.7 11.8 11.3 11.2
Rubber and plastics products 3.6 3.5 3.2 3.0 4.7 4.6 4.4 4.3 4.5 4.3 4.0 3.8
Non-metallic mineral products 5.4 5.3 5.0 4.5 3.9 3.8 3.6 3.3 4.2 4.2 4.0 3.8
Basic metals 8.2 10.1 12.1 15.1 5.0 5.0 4.8 4.5 5.7 6.2 7.0 8.6
Fabricated metal products 4.0 4.0 3.9 3.8 7.8 7.5 7.5 7.2 7.0 6.6 6.4 5.9
Machinery and equipment, not elsewhere classified 5.2 5.9 6.6 7.2 9.2 9.7 10.0 9.9 8.3 8.7 9.0 8.9
Office, accounting and computing machinery 1.2 1.6 1.9 2.2 1.4 1.4 1.8 1.8 1.3 1.5 1.8 2.0
Electrical machinery and apparatus 2.9 3.4 4.2 4.3 3.7 3.8 4.0 4.0 3.6 3.7 4.0 4.1
Radio, television and communication equipment 3.9 4.6 5.7 6.1 4.9 6.2 8.3 9.8 4.7 5.8 7.5 8.3
Medical, precision and optical instruments 0.8 0.9 1.1 1.2 3.7 3.9 4.2 4.6 3.1 3.1 3.2 3.3
Motor vehicles, trailers and semi-trailers 6.3 6.5 6.2 6.0 8.1 8.3 7.7 7.7 7.7 7.8 7.2 7.1
Other transport equipment 1.7 1.7 1.8 2.0 3.0 3.0 3.3 3.5 2.7 2.7 2.9 2.9
Furniture; manufacturing, not elsewhere classified 2.1 2.2 2.2 2.1 3.2 3.0 2.9 2.8 3.0 2.8 2.7 2.5
Total 100 100 100 100 100 100 100 100 100 100 100 100
Note: Value added at constant 2005 $.Source: UNIDO estimate based on UNIDO (2013a).
Table 10.3 Share of manufacturing value added within development group, by industry sector, selected years, 2002–2011 (percent)

176
tr
en
ds
In M
an
uFa
Ct
ur
InG
va
lue
ad
de
d
10
“Industrializing countries easily
doubled or even trebled their world share
in many manufacturing sectors
tobacco, textiles, wearing apparel and leather. Across the board over 2002–2011, industrializing countries easily doubled or even trebled their world share in many manufacturing sectors, either by relocating existing pro-duction from industrialized countries or starting new production. But industrialized countries still maintain a considerable lead (more than 70 percent of world pro-duction) in technologically complex, high value-added activities such as radio, television and communication equipment; medical, precision and optical instruments; and other transport equipment.
The five fastest growing sectors over 2007–2011 were basic metals; radio, television and communica-tion equipment; office, accounting and computing
machinery; electrical machinery and apparatus; and other transport equipment (Table 10.5). In 2011 China had become the clear global leader in four out of the five sectors, and second only to the United States in other transport equipment. The top three – China, the United States and Japan or the United Kingdom – in each sector concentrated between 51.3 percent and 70.4 percent of world manufacturing. Among industrializing countries India had become the larg-est manufacturer in four out of the five fastest growing sectors, with Mexico leading the production of office, accounting and computing machinery.
China was the first- or second-largest manufac-turer in the world in 20 out of 22 industrial sectors in
International Standard Industrial Classification description
Industrializing countries Industrialized countries
2002 2005 2008 2011 2002 2005 2008 2011
Food and beverages 26.3 30.0 34.6 40.5 73.7 70.0 65.4 59.5
Tobacco products 47.3 51.5 60.4 70.3 52.7 48.5 39.6 29.7
Textiles 40.2 49.1 59.8 70.3 59.8 50.9 40.2 29.7
Wearing apparel and fur 40.9 52.6 60.5 71.0 59.1 47.4 39.5 29.0
Leather, leather products and footwear 45.6 52.8 62.6 74.2 54.4 47.2 37.4 25.8
Wood products (excluding furniture) 17.0 18.9 23.6 31.1 83.0 81.1 76.4 68.9
Paper and paper products 21.5 25.4 31.9 40.2 78.5 74.6 68.1 59.8
Printing and publishing 10.2 12.3 14.4 17.4 89.8 87.7 85.6 82.6
Coke, refined petroleum products and nuclear fuel 31.3 33.0 37.4 42.7 68.7 67.0 62.6 57.3
Chemicals and chemical products 19.5 23.8 29.3 35.7 80.5 76.2 70.7 64.3
Rubber and plastics products 16.5 20.0 24.1 30.3 83.5 80.0 75.9 69.7
Non-metallic mineral products 26.2 31.6 38.2 45.8 73.8 68.4 61.8 54.2
Basic metals 29.6 40.3 52.6 68.0 70.4 59.7 47.4 32.0
Fabricated metal products 11.6 14.9 18.6 25.2 88.4 85.1 81.4 74.8
Machinery and equipment, not elsewhere classified 12.7 16.9 22.4 31.6 87.3 83.1 77.6 68.4
Office, accounting and computing machinery 18.4 26.4 31.2 43.9 81.6 73.6 68.8 56.1
Electrical machinery and apparatus 16.7 22.9 31.9 40.1 83.3 77.1 68.1 59.9
Radio, television and communication equipment 17.2 19.9 23.2 28.2 82.8 80.1 76.8 71.8
Medical, precision and optical instruments 5.2 7.4 10.2 14.5 94.8 92.6 89.8 85.5
Motor vehicles, trailers and semi-trailers 16.6 20.6 26.0 32.9 83.4 79.4 74.0 67.1
Other transport equipment 12.9 15.6 19.6 26.5 87.1 84.4 80.4 73.5
Furniture; manufacturing, not elsewhere classified 14.5 19.7 24.7 31.9 85.5 80.3 75.3 68.1
Note: Value added at constant 2005 $.Source: UNIDO estimate based on UNIDO (2013a).
Table 10.4 Share of manufacturing value added in industry sectors, by development group, selected years, 2002–2011 (percent)
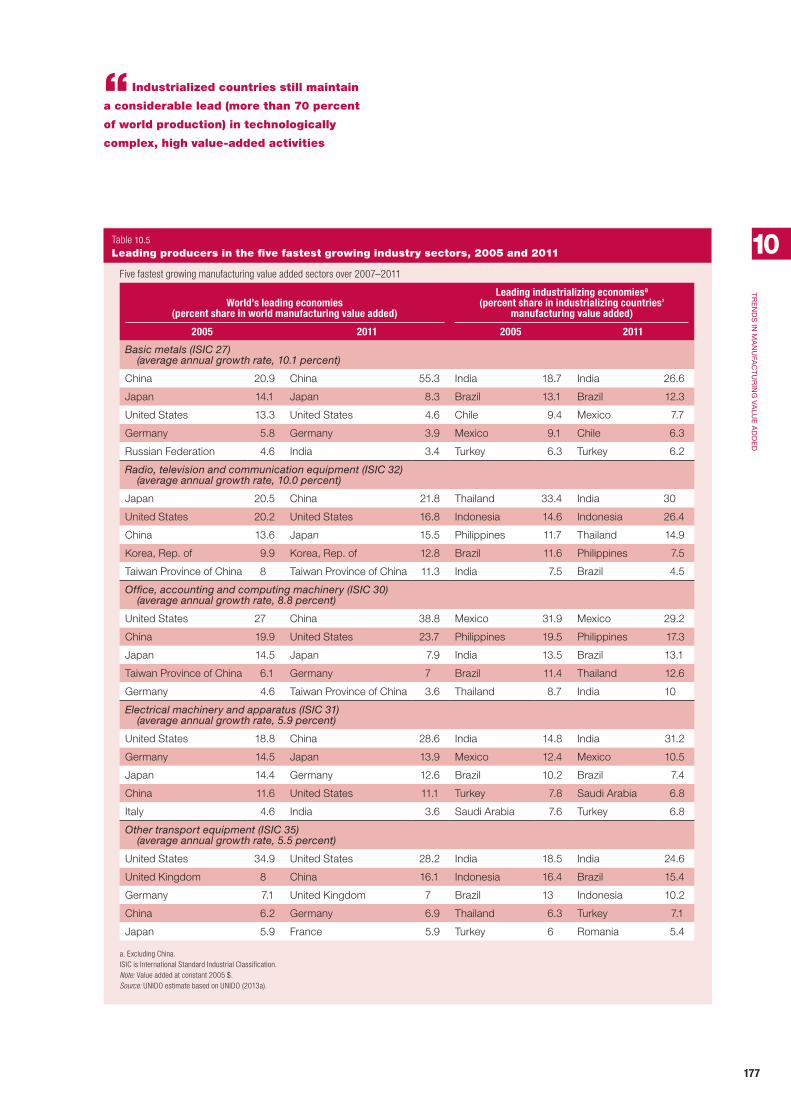
177
tr
en
ds
In M
an
uFa
Ct
ur
InG
va
lue
ad
de
d
10
“Industrialized countries still maintain
a considerable lead (more than 70 percent
of world production) in technologically
complex, high value-added activities
Five fastest growing manufacturing value added sectors over 2007–2011
World’s leading economies (percent share in world manufacturing value added)
Leading industrializing economiesa (percent share in industrializing countries’
manufacturing value added)
2005 2011 2005 2011
Basic metals (ISIC 27) (average annual growth rate, 10.1 percent)
China 20.9 China 55.3 India 18.7 India 26.6
Japan 14.1 Japan 8.3 Brazil 13.1 Brazil 12.3
United States 13.3 United States 4.6 Chile 9.4 Mexico 7.7
Germany 5.8 Germany 3.9 Mexico 9.1 Chile 6.3
Russian Federation 4.6 India 3.4 Turkey 6.3 Turkey 6.2
Radio, television and communication equipment (ISIC 32) (average annual growth rate, 10.0 percent)
Japan 20.5 China 21.8 Thailand 33.4 India 30
United States 20.2 United States 16.8 Indonesia 14.6 Indonesia 26.4
China 13.6 Japan 15.5 Philippines 11.7 Thailand 14.9
Korea, Rep. of 9.9 Korea, Rep. of 12.8 Brazil 11.6 Philippines 7.5
Taiwan Province of China 8 Taiwan Province of China 11.3 India 7.5 Brazil 4.5
Office, accounting and computing machinery (ISIC 30) (average annual growth rate, 8.8 percent)
United States 27 China 38.8 Mexico 31.9 Mexico 29.2
China 19.9 United States 23.7 Philippines 19.5 Philippines 17.3
Japan 14.5 Japan 7.9 India 13.5 Brazil 13.1
Taiwan Province of China 6.1 Germany 7 Brazil 11.4 Thailand 12.6
Germany 4.6 Taiwan Province of China 3.6 Thailand 8.7 India 10
Electrical machinery and apparatus (ISIC 31) (average annual growth rate, 5.9 percent)
United States 18.8 China 28.6 India 14.8 India 31.2
Germany 14.5 Japan 13.9 Mexico 12.4 Mexico 10.5
Japan 14.4 Germany 12.6 Brazil 10.2 Brazil 7.4
China 11.6 United States 11.1 Turkey 7.8 Saudi Arabia 6.8
Italy 4.6 India 3.6 Saudi Arabia 7.6 Turkey 6.8
Other transport equipment (ISIC 35) (average annual growth rate, 5.5 percent)
United States 34.9 United States 28.2 India 18.5 India 24.6
United Kingdom 8 China 16.1 Indonesia 16.4 Brazil 15.4
Germany 7.1 United Kingdom 7 Brazil 13 Indonesia 10.2
China 6.2 Germany 6.9 Thailand 6.3 Turkey 7.1
Japan 5.9 France 5.9 Turkey 6 Romania 5.4
a. Excluding China.ISIC is International Standard Industrial Classification.Note: Value added at constant 2005 $.Source: UNIDO estimate based on UNIDO (2013a).
Table 10.5 Leading producers in the five fastest growing industry sectors, 2005 and 2011

178
tr
en
ds
In M
an
uFa
Ct
ur
InG
va
lue
ad
de
d
10
“Among industrializing countries China
has become the uncontested leader in all 22
industrial sectors, accounting for more than
50 percent of industrializing countries’ total
manufacturing value added in 18 of them
2011. Other industrializing countries among top-five leaders in global manufacturing included Argentina, Brazil, India, Indonesia, Mexico and Turkey.
Among industrializing countries China has become the uncontested leader in all 22 industrial sectors, accounting for more than 50 percent of indus-trializing countries’ total MVA in 18 of them. When China is excluded, India leads in four out of the five fastest growing sectors and is among the top three in 13 industrial sectors, the same as Brazil. Mexico leads in one of the five fastest growing sectors and is among the top three producers in nine industrial sectors, closely followed by Indonesia, Poland and Turkey.
Manufacturing value added by regionGlobal MVA grew at an average 3.1 percent a year over 2002–2012, reaching $8,900 billion (Table 10.6). The impact of the 2008–2009 crisis on MVA was very different for industrialized and indus-trializing countries: whereas industrialized countries registered an average decline of 1.0 percent annually over 2007–2012 and have yet to recover to pre-crisis production levels, industrializing countries did not experience a contraction and, except for a slowdown to 4.1 percent growth in 2009, each year after they expanded their MVA faster than the 5.3 percent aver-age growth of 1992–2002. The relatively high MVA growth in industrializing countries over 2007–2012, 6.2 percent a year on average, goes hand in hand with their good overall economic performance, as their GDP expanded by 5.1 percent annually over the same period.
But the manufacturing performance of individual countries and regions was not even, reflecting their dif-ferent articulation into the world economy. Although all regions showed growth, the ratio was 6:1 between the fastest and slowest growing regions.
East Asia and the Pacific scored the high-est growth, 9.1 percent annually over 2007–2012, mainly driven by manufacturing in China (9.9 per-cent growth). A powerful stimulus programme put together by Chinese authorities in 2008 and 2009 – boosting domestic consumption and investment
through tax cuts, increasing government spending in infrastructure development, increasing affordable housing and loosening bank lending – succeeded in compensating for the fall in external demand that came with the global recession and in sustaining high growth in manufacturing until 2012. Only two small economies outperformed Chinese manufacturing over 2007–2012: Myanmar (14.2 percent) and Timor-Leste (11.2 percent).
Most of the region’s countries profited from the dynamism of China, from widespread participation in regional production networks and from the adoption of stimulus packages of their own, scoring significant industrial growth throughout the period (Viet Nam, 7.5 percent; Lao People’s Democratic Republic, 7.5 per-cent; Cambodia, 7.2 percent; Indonesia, 4.9 percent). Only Samoa (–6.4 percent) and Brunei Darussalam (–0.4 percent) recorded yearly contractions in their MVA.
South and Central Asia registered the second-highest growth in manufacturing over 2007–2012, at an average annual rate of 5.6 percent, and it was the only other region whose manufacturing production kept growing in 2009 despite the global recession. It benefited from proximity to China and produc-tion networks in East Asia, and from the dynamism of Indian manufacturing, which in turn was fuelled by strong domestic demand and a shift towards more technologically complex products. Since 2009 India has become the second-largest manufacturer among industrializing countries and ranks ninth in the world. There were no great outliers in industrial per-formance in the region, the countries with the fast-est growing manufacturing sectors over 2007–2012 being Bhutan (7.5 percent), Afghanistan (7.4 percent), Bangladesh (7.1 percent), India (6.7 percent), Sri Lanka (6.6 percent) and Tajikistan (5.8 percent). Only the Maldives (–3.0 percent) and the Islamic Republic of Iran (–0.1 percent) showed negative results.
In the Middle East and North Africa MVA grew by 3.5 percent over 2007–2012. The industrial perfor-mance was mixed, with the bulk of countries show-ing moderate growth averaging 3–5 percent a year

179
tr
en
ds
In M
an
uFa
Ct
ur
InG
va
lue
ad
de
d
10
“The relatively high manufacturing value added
growth in industrializing countries over 2007–2012,
6.2 percent a year on average, goes hand in hand
with their good overall economic performance
thanks to strong domestic demand, though most of the growth took place only after 2009. The top per-forming countries were Iraq (8.6 percent) and Oman (6.0 percent), the former gradually reconstructing after years of war. Cyprus (–2.1 percent), Azerbaijan (–2.0 percent), Lebanon (–1.2 percent) and Algeria (–0.7 percent) were unable to recover to pre-crisis lev-els of manufacturing output.
Industrializing countries in Europe showed com-bined annualized MVA growth of 3 percent over 2007–2012, which would seem to indicate a remark-able recovery after the slump in 2009. There was
considerable growth in Belarus (7.6 percent) and Poland (6.6 percent), pumped by fairly strong inter-nal demand and a good export performance, in turn made possible by an upgrading of the domestic pro-duction structure and a shift towards more high-tech products (EU 2012). Whereas Albania (2.5 percent) and Romania (1.4 percent) at least managed to recover the ground lost during the 2008–2009 recession, manufacturing in all other industrializing countries, mainly in Eastern Europe or the Balkans, stagnated or regressed drastically, emulating the general trend in the region’s industrialized countries.
Manufacturing value added (constant 2005 $ billions)Average growth rate (percent)
2007 2008 2009 2010 2011 20122003–2007
2007–2012
World 8,400 8,380 7,740 8,460 8,720 8,900 4.98 1.18
Industrialized economies 6,100 5,960 5,220 5,730 5,780 5,800 3.79 –1.02
Industrializing economies 2,300 2,430 2,520 2,730 2,940 3,110 8.60 6.23
By industrialization level
Emerging industrial economies 2,060 2,180 2,270 2,460 2,660 2,820 8.91 6.55
Other industrializing economies 209 217 216 228 235 240 5.91 2.84
Least developed countries 32 34 36 39 41 44 7.47 6.52
By region
East Asia and the Pacific 1,170 1,270 1,400 1,520 1,670 1,810 11.32 9.08
Excluding China 201 210 207 226 236 253 6.24 4.64
Europe 161 168 163 174 182 186 8.60 3.00
Excluding Poland 96 98 92 94 96 97 6.99 0.26
Latin America and the Caribbean 481 489 453 492 511 517 4.24 1.43
Excluding Mexico 315 324 304 328 340 340 5.09 1.52
Middle East and North Africa 186 190 185 200 212 221 6.76 3.51
Excluding Turkey 91 95 97 100 102 107 5.12 3.36
South and Central Asia 224 231 247 264 282 294 9.38 5.61
Excluding India 76 76 77 81 86 89 8.85 3.26
Sub-Saharan Africa 76 78 74 78 81 84 4.08 2.04
Excluding South Africa 30 31 32 34 35 37 3.94 4.49
By income group
High income industrializing 387 403 416 444 471 495 7.26 5.04
Upper middle income industrializing 133 142 143 150 158 163 7.84 4.12
Lower middle income industrializing 1,750 1,850 1,930 2,100 2,270 2,410 8.99 6.64
Low income industrializing 30 32 33 36 38 41 7.43 6.54
Source: UNIDO estimate based on UNIDO (2013c).
Table 10.6 Manufacturing value added by industrialization level, region and income group, 2007–2012
180
tr
en
ds
In M
an
uFa
Ct
ur
InG
va
lue
ad
de
d
10
“Most Sub-Saharan countries exhibited
robust manufacturing value added growth,
with Ethiopia (8.6 percent), Equatorial
Guinea (8.4 percent), Tanzania (8.2 percent),
Uganda (8.2 percent) and Nigeria (7.9 percent)
showing the highest rates
Most Sub-Saharan countries exhibited robust MVA growth, with Ethiopia (8.6 percent), Equatorial Guinea (8.4 percent), Tanzania (8.2 percent), Uganda (8.2 percent) and Nigeria (7.9 percent) showing the highest rates. Only a few countries, including Zimbabwe, The Gambia and the Central African Republic, saw a decline in their manufacturing out-put over 2007–2012. The rather modest performance of South Africa (0.3 percent), the region’s largest pro-ducer, accounted for the low overall growth. Amid ris-ing domestic costs and low demand in its main export markets, South Africa has yet to find a way to har-ness the potential benefits of manufacturing, which accounts for only 13 percent of jobs and 15 percent of GDP, figures much lower than in other emerging countries.
Latin America and the Caribbean’s MVA expanded the least, by 1.4 percent, which explains how the region’s share in industrializing countries’ MVA fell from 21 percent in 2007 to 16.6 percent in 2012. Many countries in the region have the United States as the major destination of their manufactured exports and were hit hard by the crisis as they faced a sharp fall in demand for their products. The highest MVA growth over 2007–2012 was in Peru (5.7 percent), Ecuador (4.8 percent) and Argentina (4.5 percent),
as these countries benefited from strong domestic demand. Other Latin American countries had more modest results; most Caribbean countries saw a con-traction of their manufacturing output.
The industrial performance of the least devel-oped countries over 2007–2012 was strong. Not only did they score the highest average annual growth as a group (6.7 percent; see Table 10.6) but many least developed countries (Myanmar, Timor-Leste, Lao People’s Democratic Republic, Cambodia, Bhutan, Afghanistan, Bangladesh, Ethiopia, Tanzania and Uganda) topped their regions’ MVA growth. Some of these countries seem to be integrating with interna-tional production networks in their regions and catch-ing up after years of isolation and domestic instabil-ity. Others are benefiting from preferential access to industrialized countries. And all seem to be benefiting from the growth of the Chinese market.
Notes1. Data for 2011 and 2012 are obtained using “now-
casting” (see Boudt, Todorov and Upadhyaya 2009).
2. See Annex 8 for a list of industrialized and indus-trializing countries and a classification of coun-tries by region.

181
A feature of the current organization of manufactur-ing is the increased use of international production networks to carry out different stages of the produc-tion process across borders, made possible by large scales of production, advances in technology (espe-cially micro-electronics) and affordable transport costs.
From simple products such as garments and shoes to complex products such as aircraft and automo-biles, manufactured parts and components are likely to be produced by numerous suppliers in different countries, shipped around several times before finally being incorporated into the end product. One extreme example is the Airbus, which relies on a network of some 1,500 suppliers in 30 countries.
The result of this production sharing has been a larger increase in trade than the corresponding increase in manufacturing value added (MVA). World exports grew 6.4 percent annually between 2006 and 2011 to reach $16.7 trillion in 2011, more than 80 per-cent of it manufactured products (Table 11.1). In the same period world output expanded on average by just 1.5 percent a year, as many countries were hit hard by the economic crisis in 2008–2009.
Industrialized economies have the bulk of the world’s manufactured exports, but industrializing countries have been increasing their world share since the 1990s.1
Global trendsIn 2011 world manufactured exports peaked at $13,469 billion, growing faster than manufactur-ing value added and GDP over 2007–2011 (see Table 11.1). They recovered fully from the contraction that followed the crisis, due mainly to the expansion in exports from large industrializing countries such as China and India. Exports of primary products grew nearly twice as fast over the same period, often fuelled by higher prices and strong demand from fast-growing countries.
Manufactured exports from industrialized coun-tries grew just 3.7 percent annually over 2007–2011, reaching $9,483 billion in 2011, as they struggled to recover from the dip in economic activity brought about by the crisis (Table 11.2; see also Table 11.4). Manufactured exports from industrializing countries grew 10.5 percent annually over the same period, to a peak of $3,985 billion in 2011.
The higher dynamism of industrializing econo-mies is also reflected in the increase in their share in world manufactured exports, from 13.9 percent in 1997 to 29.6 percent in 2011 (Figure 11.1). It was the emerging economies that accounted for most of this increase, their world share more than doubling from 12.3 percent in 1997 to 27.1 percent in 2011. Given current trends and growth in network trade, it is expected that more manufacturing activities will be
Chapter 11
Trends in manufactured exports
Category
Exports ($ billions)Average
growth rate, 2003–2007 (percent)
Average growth rate, 2007–2011 (percent)2006 2007 2008 2009 2010 2011
Manufactured 9,452 10,862 12,121 9,517 11,558 13,469 15.8 5.5
Primary 1,881 2,025 2,711 1,880 2,342 2,929 23.6 9.7
Other 149 168 217 214 250 326 19.9 18.0
World trade 11,482 13,054 15,049 11,611 14,150 16,724 17.0 6.4
Source: UNIDO estimate based on UN (2013a).
Table 11.1 World exports by product category, 2006–2011
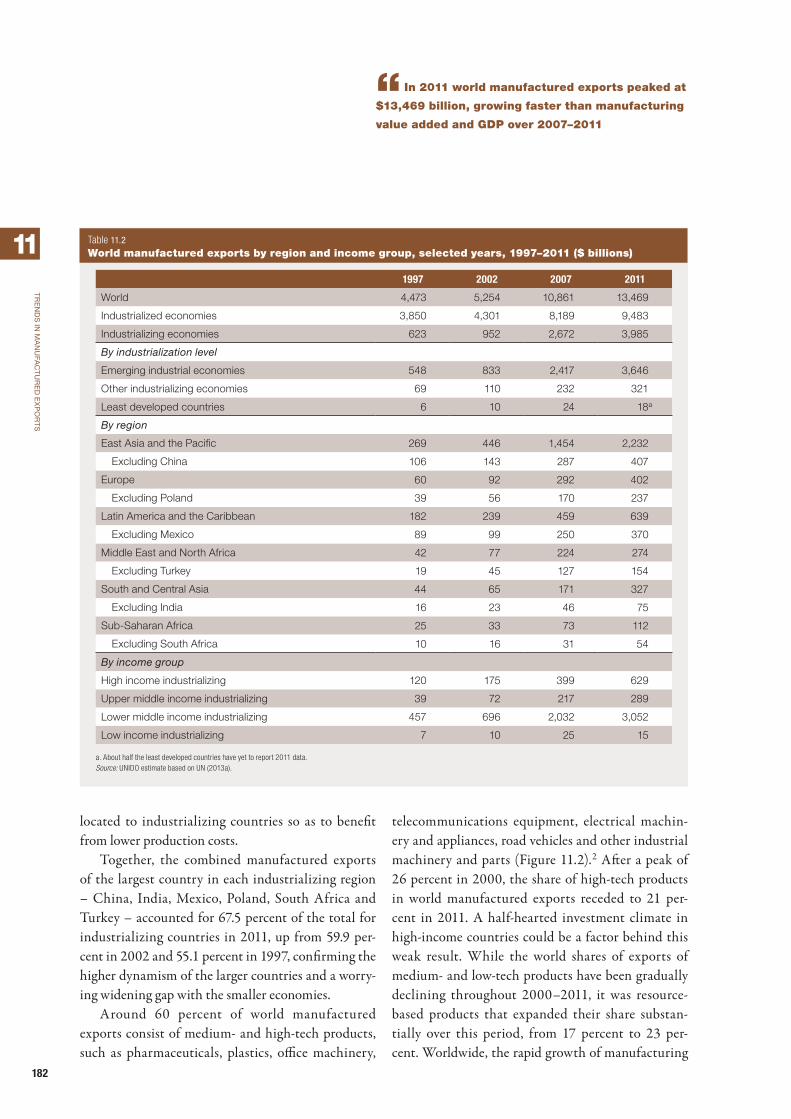
182
tr
en
ds
In M
an
uFa
Ct
ur
ed
ex
Po
rt
s
11
“In 2011 world manufactured exports peaked at
$13,469 billion, growing faster than manufacturing
value added and GDP over 2007–2011
located to industrializing countries so as to benefit from lower production costs.
Together, the combined manufactured exports of the largest country in each industrializing region – China, India, Mexico, Poland, South Africa and Turkey – accounted for 67.5 percent of the total for industrializing countries in 2011, up from 59.9 per-cent in 2002 and 55.1 percent in 1997, confirming the higher dynamism of the larger countries and a worry-ing widening gap with the smaller economies.
Around 60 percent of world manufactured exports consist of medium- and high-tech products, such as pharmaceuticals, plastics, office machinery,
telecommunications equipment, electrical machin-ery and appliances, road vehicles and other industrial machinery and parts (Figure 11.2).2 After a peak of 26 percent in 2000, the share of high-tech products in world manufactured exports receded to 21 per-cent in 2011. A half-hearted investment climate in high-income countries could be a factor behind this weak result. While the world shares of exports of medium- and low-tech products have been gradually declining throughout 2000–2011, it was resource-based products that expanded their share substan-tially over this period, from 17 percent to 23 per-cent. Worldwide, the rapid growth of manufacturing
1997 2002 2007 2011
World 4,473 5,254 10,861 13,469
Industrialized economies 3,850 4,301 8,189 9,483
Industrializing economies 623 952 2,672 3,985
By industrialization level
Emerging industrial economies 548 833 2,417 3,646
Other industrializing economies 69 110 232 321
Least developed countries 6 10 24 18a
By region
East Asia and the Pacific 269 446 1,454 2,232
Excluding China 106 143 287 407
Europe 60 92 292 402
Excluding Poland 39 56 170 237
Latin America and the Caribbean 182 239 459 639
Excluding Mexico 89 99 250 370
Middle East and North Africa 42 77 224 274
Excluding Turkey 19 45 127 154
South and Central Asia 44 65 171 327
Excluding India 16 23 46 75
Sub-Saharan Africa 25 33 73 112
Excluding South Africa 10 16 31 54
By income group
High income industrializing 120 175 399 629
Upper middle income industrializing 39 72 217 289
Lower middle income industrializing 457 696 2,032 3,052
Low income industrializing 7 10 25 15
a. About half the least developed countries have yet to report 2011 data.Source: UNIDO estimate based on UN (2013a).
Table 11.2 World manufactured exports by region and income group, selected years, 1997–2011 ($ billions)

183
tr
en
ds
In M
an
uFa
Ct
ur
ed
ex
Po
rt
s
11
“Together, the combined manufactured exports
of the largest country in each industrializing
region – China, India, Mexico, Poland, South
Africa and Turkey – accounted for 67.5 percent
of the total for industrializing countries in 2011
activities in industrializing countries has translated into a growing need for materials, while the higher incomes and rising urban middle class in many of these countries pushed up demand for processed food.
Advances in automation, coupled with tight qual-ity control by production networks’ leading firms and the upgrading of workforce skills, have made possible a large-scale relocation of manufacturing of medium- and high-tech products to industrializing countries, altering the technological complexity of their exports greatly.3 Over 2006–2011 industrializing countries expanded their share in world exports of medium- and high-tech products by 6.2 percent annually while their share in world exports of resource-based and low-tech products grew at the slower rate of 2.9 percent a year. In the same period industrialized countries saw their correspond-ing shares in world manufactured exports decline by 1.6 percent and 1.4 percent a year (Figure 11.3).
Of the 20 most dynamic manufactured export products (products with the highest average annual growth rates) over 2007–2011, 11 were resource-based products (Table 11.3).4 Resource-endowed industrial-izing countries such as Argentina, Brazil, Indonesia, Saudi Arabia, South Africa and Ukraine profited from the fast growth that was fuelled by high demand from the construction, metal working and food processing industries in China and India. At the other end of the spectrum, seven of the fastest growing manufactured
Figure 11.1 World manufactured exports by development group, 1992–2011
0
20
40
60
80
100
20112010200920082007200620052004200320022001200019991998199719961995199419931992
Shar
e of
wor
ld m
anuf
actu
red
expo
rts
(per
cent
)
IndustrializingIndustrialized
Source: UNIDO estimate based on UN (2013a).
Figure 11.2 Technology composition of manufactured exports, 1992–2011
0
10
20
30
40
50
2011200820062004200220001998199619941992
Perc
ent
Medium technology
Low technologyResource-based
High technology
Source: UNIDO estimate based on UN (2013a).

184
tr
en
ds
In M
an
uFa
Ct
ur
ed
ex
Po
rt
s
11
“China’s exports of manufactured goods grew
on average by 22.1 percent a year over 2002–2011,
twice as fast as the world’s rate of 11.0 percent
exports were medium- and high-tech products in industrialized countries as well as in China (and other Asian industrializing countries such as India, Thailand and Viet Nam). One of the major markets for these medium- and high-tech products, besides the traditional high-income Organisation for Economic Co-operation and Development countries, is China itself: in 2011 it received 63 percent of all optical instrument exports.
Exports of the top four products (iron ores, vegeta-ble fat and oils, fertilizers and office machines) grew more than 20 percent a year on average. By total export value, one resource-based product, petroleum oils (not crude oil), headed the list in 2011 with $893 billion, followed by one medium-tech item, ships, boats and floating structures ($182 billion), and one high-tech product, medicinal and pharmaceutical products other than medicaments ($153 billion).
Industrializing countries’ role in world manufactured exportsAll industrializing regions have increased their share in world manufacturing exports since 1997, but not
all countries and regions have fared equally well. The surge in industrializing countries’ exports of manu-factures since the turn of the century is largely attrib-utable to China’s emergence as a large manufacturer and exporter of many of these products. Its exports of manufactured goods grew on average by 22.1 percent a year over 2002–2011, twice as fast as the world’s rate of 11.0 percent. Having become the world’s largest exporter of manufactures in 2008, China improved its lead further, achieving exports of $1,825 billion and a world market share of 16.6 percent in 2011.
In line with its position as leading manufactur-ing region among industrializing countries, East Asia and the Pacific accounted for the largest export share in 2011: 56.0 percent of industrializing countries’ manufactured exports came from the region, up from 44.1 percent in 2000 (Figure 11.4). A considerable proportion of these exports respond to intra-regional trade, in turn driven by specialization and increased component trade within global production networks. But despite the resulting stronger economic integra-tion among the region’s countries, their dependence on the global economy remains very high, making them
Figure 11.3 Average change in world market share by technological level, 2006–2011
–3 –2 –1 1 2 3 4Aver
age
chan
ge in
the
wor
ld m
arke
t sha
re o
f med
ium
- an
d h
igh-
tech
man
ufac
ture
d ex
port
s (p
erce
nt)
Average change in the world market share of resource-based and low-tech manufactured exports (percent)
–5
0
5
10
0
Industrializing countries($1,770 billion)
Industrialized countries($2,250 billion)
Note: Bubble size indicates the change in the value of manufactured exports (in parentheses).Source: UNIDO estimate based on UN (2013a).

185
tr
en
ds
In M
an
uFa
Ct
ur
ed
ex
Po
rt
s
11
“Of China’s top 10 export products in
2012, 6 were high-tech manufactures,
totalling $446.7 billion and representing
22.8 percent of the country’s exports
particularly vulnerable to the international business cycle (Athukorala 2011; Gangnes and van Asche 2010).
Initially, China was concentrated in manufac-turing low-tech, labour-intensive assembly products, mainly as an outsourcing option for East Asian pro-ducers exporting to the world market in the 1980s and 1990s. Following its accession to the World Trade Organization in 2001, China moved massively into the production and export of more complex, medium- and high-tech manufactures with such success that in 2011 it accounted for 81.7 percent of the region’s exports (Figure 11.5). Of China’s top 10 export prod-ucts in 2012, 6 were high-tech manufactures, total-ling $446.7 billion and representing 22.8 percent of the country’s exports. They included computer, tele-communications and office equipment; diodes and
transistors; and optical instruments. Three other were medium-tech engineering products (UN 2013a). The main destinations for these technologically complex manufactures were the United States, industrialized economies in Asia (Hong Kong SAR China, Japan, Republic of Korea and Singapore), the European Union (EU) and India.
The second-largest exporter of manufactured products, Latin America and the Caribbean, could not keep up with the fast expansion of trade in Asia and saw its share in industrializing countries’ manu-factured exports drop from 28.8 percent in 2000 to 16.0 percent in 2011. Mexico and Brazil were the major actors, accounting for 68.2 percent of the region’s manufactured exports in 2011, but showed two pat-terns of integration with international markets.
Ranking Code Technology category Product
Average annual growth rate, 2007–2011
(percent)Value, 2011 ($ billions)
1 281 Resource-based Iron ore and concentrates 35.6 148.4
2 422 Resource-based Fixed vegetable fat and oils, other 26.5 49.0
3 562 Medium-tech Fertilizer, except Group 272 23.5 69.5
4 751 High-tech Office machines 22.8 51.0
5 335 Resource-based Residual petroleum products 17.7 50.4
6 897 Low-tech Gold, silverware and jewellery, not elsewhere classified 17.1 106.8
7 793 Medium-tech Ships, boats and floating structures 16.4 182.4
8 541 High-tech Medicinal and pharmaceutical products, other than medicaments of Group 542 15.7 153.1
9 232 Resource-based Synthetic rubber and so on 15.6 28.4
10 831 Low-tech Travel goods, suitcases, bags and so on 14.5 52.9
11 334 Resource-based Petroleum oils, not crude 14.1 893.1
12 421 Resource-based Fixed vegetable fat and oils, soft 13.8 37.8
13 342 Resource-based Liquefied propane and butane 13.4 51.2
14 61 Resource-based Sugars, molasses and honey 13.4 42.2
15 718 High-tech Other power generating machinery 13.2 24.3
16 625 Resource-based Rubber tyres, tubes and so on 12.9 91.5
17 871 High-tech Optical instruments, not elsewhere classified 12.4 102.8
18 522 Resource-based Inorganic chemical elements 12.1 57.0
19 512 Medium-tech Alcohols, phenols and derivatives 12.0 56.9
20 282 Resource-based Ferrous waste and scrap 12.0 54.4
Source: UNIDO estimate based on UN (2013a).
Table 11.3 Twenty most dynamic manufactured exports, 2007–2011

186
tr
en
ds
In M
an
uFa
Ct
ur
ed
ex
Po
rt
s
11
“A textbook example of a resource-rich
industrializing country, Brazil concentrated its
top 10 exports in 2012 in five primary products
and four resource-based manufactures
Mexico, the larger exporter of the two, is heavily exposed to the North American market (80.7 percent of total exports in 2012), and its exports were severely
hit by the contraction in 2008–2009. Of Mexico’s top 10 export products in 2012, two were high-tech man-ufactures (telecommunications and computer equip-ment), representing 9.6 percent of total exports, and five were medium-tech products (passenger and goods vehicles and their parts, TV receivers, and electrical distribution equipment), representing 24.2 percent.
By contrast, Brazil had only one high-tech product (aircraft, 0.2 percent of total exports) and no medium-tech products among its top 10 exports in 2012. A textbook example of a resource-rich industrializing country, Brazil concentrated its top 10 exports in 2012 in five primary products (23.4 percent of total exports) and four resource-based manufactures (iron ore, heavy petroleum oil, sugar, and pulp, representing 22.0 per-cent). Its major export destinations (China, the United States, Argentina, the EU and Japan) accounted for only 48.0 percent of total exports. Different export patterns gave different results too: over 2003–2011 Mexico’s exports of manufactures grew 7.5 percent a year while Brazil’s expanded 16.3 percent a year.
Led by Poland, the largest economy in the region, Europe has maintained its share in industrializing countries’ exports at around 10 percent throughout
Figure 11.4 Share of manufactured exports of developing countries by region, 2000–2011
0
25
50
75
100
201120102009200820072006200520042003200220012000
Shar
e of
man
ufac
ture
d ex
port
s of
dev
elop
ing
coun
tries
(per
cent
)
East Asia and the Pacific Latin America and the CaribbeanEurope
Middle East and North Africa South and Central Asia Sub-Saharan Africa
Source: UNIDO estimate based on UN (2013a).
Figure 11.5 Largest country share in regional manufactured exports, 2003, 2007 and 2011
0
20
40
60
80
100
South Africa(Sub-Saharan
Africa)
India(South and
Central Asia)
Turkey(Middle East
and North Africa)
Mexico(Latin America and
the Caribbean)
Poland(Europe)
China(East Asia
and the Pacific)
Coun
try
shar
e in
regi
on’s
man
ufac
ture
d ex
port
s (p
erce
nt)
200320072011
Source: UNIDO estimate based on UN (2013a).

187
tr
en
ds
In M
an
uFa
Ct
ur
ed
ex
Po
rt
s
11
“In 2011, 48.7 percent ($6,472 billion)
of total manufactured exports was from
one industrialized country to another
2000–2011. While keeping their traditional export markets, mostly in Eastern Europe, some countries have shown benefits of joining the EU and succeeded in securing new markets for their exports of manu-factures. Over the last few years the downside of this approach has been sluggish export and output growth as Industrialized Europe struggled with the repercus-sions of the global economic and euro crises.
Poland accounted for 41.0 percent of the region’s exports of manufactures in 2011, and although its main export market is the EU (55.6 percent of total exports), it has a fairly diversified export base concen-trated in medium-tech products. Its top 10 exports in 2012 represented only 24.2 percent of the export total and included five medium-tech manufactures (pas-senger and goods vehicles and their parts, TV receiv-ers, seats, combustion engines, and ships and floating structures), representing 14.3 percent of total exports, and one high-tech product (computer equipment), representing 1.7 percent.
Industrializing country shares of manufactured exports for the Middle East and North Africa and South and Central Asia remained below 10 percent in 2012, despite fast export growth of 15.1 percent and 19.7 percent a year, respectively. India accounted for 77 percent of South and Central Asia’s manufactured exports in 2012 and their growth over 2002–2011 – 22.0 percent a year – was impressive, nearly matching the expansion in China. Of India’s top 10 exports in 2012, three were medium- or high-tech manufactures (motor vehicles, medicines and communications equip-ment), representing 5.7 percent of total exports; low-tech jewellery exports accounted for 6.3 percent; and three resource-based products (non-crude petroleum oils, diamonds and iron ores) made up 26.8 percent.
Turkey, the main exporter of manufactures in the Middle East and North Africa with a 43.8 percent share, also exhibited a diversified structure among its top 10 exports: medium-tech products (motor vehicles and their parts, and insulated cables) accounted for 10.0 percent of total exports, low-tech exports (gar-ments and jewellery) came to 8.8 percent and resource-based exports and gold represented 11.2 percent.
Manufactured exports from Sub-Saharan Africa also grew quickly, at a 14.5 percent annual average over 2002–2011, but this was not enough to prevent a decline in the region’s share from 3.5 percent to 2.8 percent of industrializing countries’ manufactured exports over the period. Besides primary products the region was concentrated mainly in the export of resource-based and medium-tech manufactures, pri-marily motor vehicles and their parts, basic chemicals, and basic iron and steel produced in South Africa.
To appraise better a region’s export performance in terms of strength and technological complexity, the evolution of world market shares by technologi-cal level is examined (Figure 11.6). Over 2006–2011 East Asia and the Pacific, South and Central Asia and Europe increased their world market shares of resource-based and low-tech products; their shares of medium- and high-tech products increased nearly twice as fast. Latin America and the Caribbean’s share of resourced-based and low-tech products stagnated and its share of medium- and high-tech products grew marginally. The Middle East and North Africa lost world market share in resource-based and low-tech manufactured exports but made considerable gains in that of medium- and high-tech products. Sub-Saharan Africa’s world market share of resource-based and low-tech products grew much faster than its share of medium- and high-tech products.
Industrializing countries’ manufactured export marketsThe largest share of world manufactured exports is mainly accounted for by trade between industrialized countries. In 2011, 48.7 percent ($6,472 billion) of total manufactured exports was from one industrial-ized country to another. By contrast, exports of manu-factures among industrializing countries represented a minor fraction of the total, 9.1 percent ($1,208 bil-lion). But although both trade flows increased over 2006–2011, manufactured exports among industri-alizing countries did so at nearly 20 percent a year (Figure 11.7). Expansion of global production net-works incorporating new locations and involving
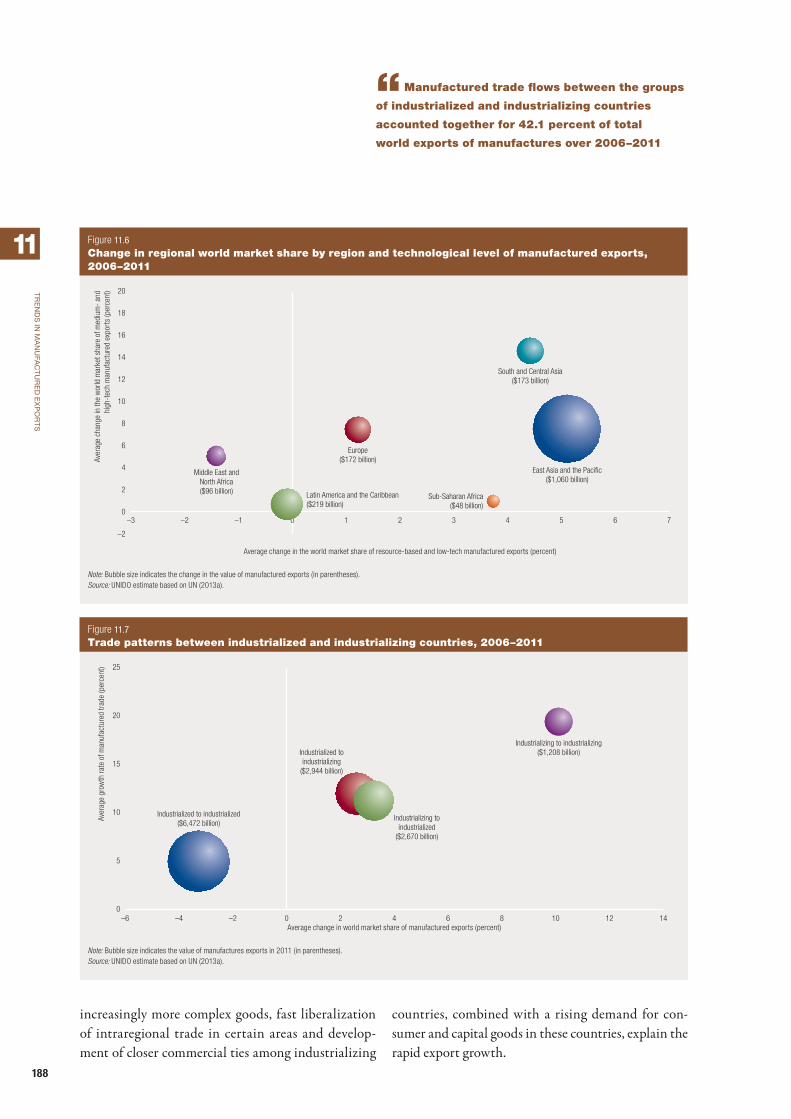
188
tr
en
ds
In M
an
uFa
Ct
ur
ed
ex
Po
rt
s
11
“Manufactured trade flows between the groups
of industrialized and industrializing countries
accounted together for 42.1 percent of total
world exports of manufactures over 2006–2011
increasingly more complex goods, fast liberalization of intraregional trade in certain areas and develop-ment of closer commercial ties among industrializing
countries, combined with a rising demand for con-sumer and capital goods in these countries, explain the rapid export growth.
Figure 11.6 Change in regional world market share by region and technological level of manufactured exports, 2006–2011
–3 –2 –1 1 2 3 4 5 6 7
Aver
age
chan
ge in
the
wor
ld m
arke
t sha
re o
f med
ium
- an
d h
igh-
tech
man
ufac
ture
d ex
port
s (p
erce
nt)
Average change in the world market share of resource-based and low-tech manufactured exports (percent)
–2
0
2
4
6
8
10
12
14
16
18
20
0
East Asia and the Pacific($1,060 billion)
South and Central Asia($173 billion)
Sub-Saharan Africa($48 billion)
Europe($172 billion)
Latin America and the Caribbean($219 billion)
Middle East andNorth Africa($96 billion)
Note: Bubble size indicates the change in the value of manufactured exports (in parentheses).Source: UNIDO estimate based on UN (2013a).
Figure 11.7 Trade patterns between industrialized and industrializing countries, 2006–2011
–6 –4 –2 0 2 4 6 8 10 12 14
Aver
age
grow
th ra
te o
f man
ufac
ture
d tra
de (p
erce
nt)
Average change in world market share of manufactured exports (percent)
Industrializing to industrializing($1,208 billion)
Industrializing toindustrialized
($2,670 billion)
Industrialized toindustrializing
($2,944 billion)
Industrialized to industrialized($6,472 billion)
0
5
10
15
20
25
Note: Bubble size indicates the value of manufactures exports in 2011 (in parentheses).Source: UNIDO estimate based on UN (2013a).

189
tr
en
ds
In M
an
uFa
Ct
ur
ed
ex
Po
rt
s
11
“By 2011 trade in manufactured
exports had fully recovered, setting a
new record of $13,469 billion, 11 percent
higher than the 2008 peak
Manufactured trade flows between the groups of industrialized and industrializing countries accounted together for 42.1 percent of total world exports of manufactures and grew at comparable rates of around 11–12 percent over 2006–2011. But despite expand-ing their export share faster, industrializing countries showed a trade deficit with industrialized countries ($274 billion) in 2011.
With the largest and best intertwined produc-tion networks having developed in East Asia and the Pacific, it is this region driving the expansion in manufactured export trade between industrializing countries (Figure 11.8). Parts and components (for electronic equipment and for garments or vehicles) are produced in different countries in the region accord-ing to the level of technological complexity involved, with final assembly usually taking place in China, enabling participation in the network – and in inter-national trade – by countries with varying levels of competency and experience in international markets (Athukorala 2011).
In all industrializing country regions, industrial-ized countries remain the top manufactured-export
partners, but their share had been declining in favour of exports to industrializing countries even before the 2008–2009 crisis (Figure 11.9). The growing pro-cessed trade (import of foreign parts and components for assembly and subsequent export as final goods) in industrializing countries, particularly in East Asia and the Pacific, reinforces this trend. In addition, tra-ditional commercial ties and more familiarity with the demand, tastes and standards of countries in the same region help explain that they, as a group, are the second destination of manufactured exports in all regions but South and Central Asia, where trade with East Asia and the Pacific is more important.
The recovery of global manufactured exportsWorld manufactured exports had grown 15.6 per-cent annually over 2003–2007, reaching more than $12,120 billion in 2008, with the growth rate in industrializing economies (23.2 percent) far greater than that in industrialized economies (13.6 percent; Table 11.4). After that, recession set in the United States, the EU and Japan, affecting most industrial-izing countries through reduced demand for their exports and lower migrant remittances, investment flows, tourism income and even development aid. The severe contraction in manufactured exports world-wide (–21.5 percent) in 2009 hit all industrializing countries, albeit with varying force. The most stricken regions were the Middle East and North Africa (–26.3 percent) and Europe (–25.9 percent), as these regions are important trading partners of the EU, but also Sub-Saharan Africa (–23.6 percent) and Latin America and the Caribbean (–22.3 percent).
By 2011 trade in manufactured exports had fully recovered, setting a new record of $13,469 billion, 11 percent higher than the 2008 peak. Despite their smaller share in manufacturing output and exports compared with industrialized economies, it is indus-trializing economies that are behind the recent revival in trade. Of the $1,349 billion additional exports in 2011 (relative to 2008), industrializing economies accounted for $846 billion (62.7 percent), equivalent
Figure 11.8 Manufactured exports between industrializing countries, 1996–2011
0
250
500
750
1,000
1,250
20112008200620042002200019981996
$ bi
llion
s
Manufactured exports inindustrializing economies
ExcludingEast Asia and the Pacific
Source: UNIDO estimate based on UN (2013a).

190
tr
en
ds
In M
an
uFa
Ct
ur
ed
ex
Po
rt
s
11
“Of the $1,349 billion additional exports
in 2011, industrializing economies accounted
for $846 billion, while industrialized
economies only registered $503 billion
to a growth rate of 8.3 percent a year, while industri-alized economies only registered $503 billion more manufactured exports (37.3 percent), or a growth rate of 1.8 percent a year over 2008–2011. This is as much a reflection of overall economic performance – because industrialized countries are still struggling to put their economies back on their feet while most of the industrializing world was already up and running in 2010 – as it is a sign of the intensification of network trade and the incorporation of more industrializing countries into existing production networks (Hanson 2012).
Manufactured export performance of each region was broadly in line with the performance of their respective major countries (Figure 11.10). East Asia and the Pacific and South and Central Asia – led by China and India – recorded new highs in 2010 and consolidated their lead in 2011. Sub-Saharan Africa also exceeded its prior performance in 2010, but the main economy in the region, South Africa,
took longer to recover. Industrializing Europe and Latin America and the Caribbean needed two years to regain their grip on manufactured exports, as did Poland and Mexico. Only the Middle East and North Africa stood in 2011 at the same level of exports as before the crisis.
Manufactured export growth in South and Central Asia (averaging 18.4 percent a year over 2008–2011) was helped by a surge in exports from India, especially from the newly established special economic zones (SEZs; spurred by the SEZ Act 2005). Although 19 SEZs existed previously, new rules were put in place and 154 new SEZs became operational after 2006. Exports of Indian SEZs boomed from a meagre $2.5 billion in (fiscal year) 2003/04 to about $60 billion in 2011/12 (SEZ India 2013). India con-tributed with $96 billion of additional manufactured exports in 2011 (from 2008); this was similar to the $102 billion contribution of all of Latin America and the Caribbean but coming from a manufacturing
Figure 11.9 Manufactured exports markets by region, 2003, 2007 and 2011
201120072003 201120072003
201120072003
201120072003
201120072003 201120072003
Perc
ent
East Asia and the Pacific
Perc
ent Middle East and North Africa
Europe Latin America and the Caribbean
South and Central Asia Sub-Saharan Africa
Industrialized East Asia and the Pacific Europe Latin America and the Caribbean Middle East and North Africa South and Central Asia Sub-Saharan Africa
0
25
50
75
100
0
25
50
75
100
0
25
50
75
100
0
25
50
75
100
0
25
50
75
100
0
25
50
75
100
Source: UNIDO estimate based on UN (2013a).

191
tr
en
ds
In M
an
uFa
Ct
ur
ed
ex
Po
rt
s
11
“Manufactured export growth in South
and Central Asia (averaging 18.4 percent
a year over 2008–2011) was helped
by a surge in exports from India
sector that was only 40 percent the size. The expan-sion of manufactured exports from the other coun-tries in the region was also fast, as they too, like India, intensified their ties with countries in the growing East Asia and the Pacific region, and experienced reductions in their exports shares to the EU and the United States.
The upturn in East Asia and the Pacific was largely led by China, which accounted for $455 billion of the new manufactured exports in 2011 (from 2008). Although China’s main export markets were still in the mire, it seems that increased competitiveness and
lower prices may have helped in securing new exports and even influenced decisions to relocate production from more expensive sites in industrialized countries. Other emerging economies in the region specialize in key final products and in different stages of compo-nent manufacturing, supplying China or industrial-ized economies in the region with inputs for further incorporation into final products.
The pace of recovery of manufactured exports in Sub-Saharan Africa (8.0 percent annual growth over 2008–2011), Latin America and the Caribbean (6.0 percent), and Europe (4.2 percent) was more
Manufactured exports ($ billions)
Average growth rate (percent)
2006 2007 2008 2009 2010 2011 2003–2007 2007–2011
World 9,447 10,861 12,120 9,516 11,558 13,469 15.6 5.5
Industrialized economies 7,232 8,189 8,980 6,954 8,242 9,483 13.6 3.7
Industrializing economies 2,215 2,672 3,139 2,562 3,316 3,985 23.2 10.5
By industrialization level
Emerging industrial economies 1,989 2,417 2,853 2,334 3,002 3,646 24.0 10.8
Other industrializing economies 206 232 270 214 297 321 16.7 8.5
Least developed countries 20 24 16 14 17 18 17.9 –6.9
By region
East Asia and the Pacific 1,169 1,454 1,688 1,431 1,868 2,232 26.4 11.3
Excluding China 248 287 318 275 349 407 15.8 9.1
Europe 230 292 355 263 314 402 24.8 8.3
Excluding Poland 136 170 204 143 176 237 23.4 8.7
Latin America and the Caribbean 420 459 537 417 536 639 15.7 8.6
Excluding Mexico 219 250 308 232 297 370 21.3 10.3
Middle East and North Africa 178 224 274 202 247 274 23.5 5.2
Excluding Turkey 101 127 155 114 147 154 24.0 4.9
South and Central Asia 154 171 197 181 254 327 21.2 17.6
Excluding India 49 46 41 32 66 75 12.7 13.0
Sub-Saharan Africa 64 73 89 68 97 112 16.7 11.3
Excluding South Africa 29 31 38 32 48 54 16.9 14.9
By income group
High income industrializing 339 399 478 408 518 629 18.7 12.1
Upper middle income industrializing 178 217 257 195 240 289 24.2 7.4
Lower middle income industrializing 1,677 2,032 2,389 1,947 2,541 3,052 24.1 10.7
Low income industrializing 21 25 15 12 17 15 20.6 –12.0
a. About half the least developed countries have yet to report 2011 data.Source: UNIDO estimate based on UN 2013a.
Table 11.4 World manufactured exports by industrialization level, region and income group, 2006–2011

192
tr
en
ds
In M
an
uFa
Ct
ur
ed
ex
Po
rt
s
11
“The least developed countries fared fairly well
after the crisis, with manufactured exports in 2011
reaching $18 billion, up from $16 billion in 2008
moderate. The first two regions have a strong pres-ence of resource-based manufactures, whose prices have been on the rise due to strong demand growth in large industrializing countries. The growth in manu-factured exports in Industrializing Europe was instead helped by the accession of Bulgaria and Romania to the EU in 2007. Middle East and North African countries do not enjoy tariff-free access to the EU and have been unable to surpass their manufactured exports peak of 2008.
The least developed countries fared fairly well after the crisis, with manufactured exports in 2011 reaching $18 billion, up from $16 billion in 2008. Their specialization in low-tech, affordable consumer
products gave them a competitive edge in the con-text of restrained spending in their traditional export markets, the EU and the United States. Bangladesh, the largest economy in the group, obtains more than 75 percent of its export earnings from the export of knitted and woven garments and saw its exports of these products increase steadily after the crisis. Other least developed countries, such as Cambodia, the Lao People’s Democratic Republic and Myanmar, are slowly being incorporated into their regional produc-tion networks to capitalize on their factor advantages, while other countries have benefited from high prices for their resource-based manufactures.
Despite progress, the least developed countries remain fragile, as most of them concentrate on a few products that are prone to market volatility, some of them are torn by war or political instability, and gen-erally they have weak infrastructure to support manu-facturing exports.
Notes1. See Annex 8 for a list of industrialized and indus-
trializing countries and a classification of coun-tries by region.
2. Manufactured trade can be classified by techno-logical complexity as natural resource–based, low-technology and medium- and high-technology (see Annex 4 for details).
3. Highly skilled manufacturing-related services, such as design and marketing, as well as complex manufacturing activities, are still largely per-formed in industrialized countries.
4. Geometric means are used to compute the average growth rates.
Figure 11.10 Growth of manufactured exports in selected industrializing countries, 1996–2011
100
0
500
1,000
1,500
20112008200620042002200019981996
Inde
x (1
996
= 1
00)
China
India
Mexico
Poland
South Africa
Turkey
Source: UNIDO estimate based on UN (2013a).

193
Annexes

194
Annex 1
Correlations between growth of per capita value added and labour productivity
Coefficient t-value p-value
Food and beverages 0.7614 6.26 0.0000
Textiles 0.4418 3.85 0.0000
Wearing apparel 0.3857 2.57 0.0130
Chemicals 0.8573 7.55 0.0000
Basic metals 1.4851 9.66 0.0000
Fabricated metals 0.8563 4.93 0.0000
Electrical machinery and apparatus 1.0727 5.90 0.0000
Motor vehicles 1.0775 6.37 0.0000
Note: Independent variable: change in labour productivity a year. Dependent variable: change in value added per capita a year. GDP range: $3,000–$6,000.Source: UNIDO estimate based on UNIDO (2012a).
Table A1.1 Growth of per capita value added and labour productivity

195
Annex 2
Labour intensity
To determine the level of labour intensity, employment per value added was estimated for 18 manufacturing industries at two income levels of $5,000 and $20,000 GDP per capita, as the labour intensity changes along income level. If an industry’s labour intensity is higher than the median of 18 manufacturing industries at both income levels, it is considered labour intensive; if an industry’s labour intensity is lower than the median at both income levels, it is considered relatively capital intensive.
Labour-intensive industries (ordered from the industry of the highest labour intensity):• Wearing apparel.• Textiles.• Wood products.• Fabricated metals.• Food and beverages.
Capital-intensive industries (ordered from the industry of the highest capital intensity):• Coke and refined petroleum.• Tobacco.• Chemicals.• Printing and publishing.• Electrical machinery and apparatus.

196
Annex 3
Indicators of industrial performance by economy
Economy
Manufacturing value added per capita
(2005 $)
Share of manufacturing value
added in GDP (percent)
Share of world manufacturing
value added (percent)
Share of medium- and high-
technology activities (percent)
Manufactured exports per capita
(US$)
Share of manufactured exports in total exports
(percent)
Share of world manufactured exports
(percent)
Share of medium- and high-technology activities in
manufactured exports (percent)
2006 2011 2006 2011 2006 2011 2006 2011 2006 2011 2006 2011 2006 2011 2006 2011
Albania 419 542 15.05 15.77 0.02 0.02 20.21 14.36 53 446 70.31 73.62 0.00 0.01 16.27 16.67
Algeria 176 159 5.65 4.79 0.07 0.07 11.28 11.28 267 512 16.32 25.07 0.10 0.15 1.28 0.53
Argentina 1,097 1,396 21.53 20.60 0.54 0.65 25.84 25.84 686 1,059 57.53 51.38 0.30 0.35 34.19 46.33
Armenia 232 247 12.85 12.38 0.01 0.01 7.62 5.81 2,613 5,687 43.95 47.71 0.61 1.03 29.39 17.47
Australia 3,744 3,685 9.81 9.33 0.98 0.96 23.01 23.01 14,023 17,497 86.47 86.84 1.30 1.18 60.73 59.93
Austria 7,046 7,360 18.44 18.43 0.73 0.71 42.05 41.74 252 280 34.45 9.83 0.02 0.02 11.90 13.88
Azerbaijan 108 104 5.26 3.41 0.01 0.01 9.56 6.34 77 84 93.71 91.74 0.12 0.12 2.93 4.34
Bangladesh 74 101 16.48 17.58 0.13 0.17 20.20 20.20 232 230 83.28 63.66 0.01 0.01 25.70 21.60
Barbados 655 566 5.71 5.23 0.00 0.00 38.11 38.11 743 825 81.88 84.65 0.00 0.00 37.14 41.90
Belgium 5,652 5,360 15.28 14.16 0.75 0.66 44.81 42.28 30,903 38,777 87.66 87.25 3.64 3.34 55.46 53.12
Belize 397 418 9.76 10.36 0.00 0.00 18.46 18.46 164 321 36.16 35.54 0.02 0.03 10.86 2.00
Bolivia, Plurinational State of 129 147 11.99 11.82 0.02 0.02 5.05 5.05 2,259 2,787 95.28 96.24 0.05 0.05 2.24 5.78
Botswana 195 230 3.45 3.75 0.00 0.01 21.59 21.59 527 846 71.88 64.96 1.11 1.33 46.32 35.54
Brazil 737 779 15.11 13.60 1.74 1.76 33.27 34.97 403 361 43.10 33.63 0.00 0.00 0.61 0.45
Bulgaria 560 675 13.99 14.98 0.05 0.06 24.20 25.57 1,471 2,639 74.89 69.76 0.13 0.16 27.77 35.93
Cambodia 97 127 18.88 19.51 0.02 0.02 0.26 0.26 210 335 79.57 71.46 0.03 0.04 2.44 7.06
Cameroon 158 158 16.61 15.82 0.04 0.04 11.01 11.01 55 49 27.46 45.68 0.01 0.01 2.88 28.66
Canada 4,764 3,867 13.33 10.77 1.96 1.52 37.34 37.35 7,554 7,359 67.95 59.97 2.77 2.02 57.89 54.48
Cape Verde 120 150 5.36 5.31 0.00 0.00 30.60 27.10 20 86 47.06 62.27 0.00 0.00 0.75 1.10
Central African Republic 25 19 7.19 5.38 0.00 0.00 9.25 9.25 20 7 75.46 30.39 0.00 0.00 0.27 13.24
Chile 1,111 1,069 14.79 12.57 0.23 0.21 1.32 18.92 1,807 2,202 50.12 46.71 0.33 0.30 12.67 12.56
China 631 1,063 32.62 34.15 10.44 16.42 41.29 40.70 701 1,355 95.09 96.17 10.36 14.60 57.94 58.96
Colombia 505 545 14.13 13.20 0.28 0.29 20.71 20.71 270 337 48.40 28.08 0.13 0.13 39.00 31.98
Congo 72 86 4.07 4.40 0.00 0.00 13.14 2.42 54 597 13.60 34.91 0.00 0.02 6.30 83.42
Costa Rica 991 972 20.00 17.67 0.05 0.05 19.73 16.58 1,193 1,595 72.08 73.77 0.06 0.06 69.14 58.77
Côte d’Ivoire 159 152 17.71 17.63 0.04 0.04 14.99 14.99 213 159 47.89 29.04 0.04 0.03 31.10 19.22
Croatia 1,555 1,347 14.65 12.63 0.09 0.07 31.77 31.77 2,063 2,738 88.15 90.07 0.10 0.10 44.56 47.80
Cyprus 1,234 1,096 7.31 6.35 0.02 0.01 4.83 12.32 363 553 66.93 70.67 0.00 0.00 53.14 55.08
Czech Republic 3,287 3,812 24.22 26.58 0.42 0.46 44.36 44.62 8,572 14,364 92.44 93.17 0.99 1.21 66.09 67.88
Denmark 5,941 5,528 12.14 11.85 0.41 0.35 42.71 30.51 12,528 14,805 74.46 73.15 0.77 0.66 54.07 52.24
Ecuador 259 307 9.12 9.50 0.04 0.05 8.97 8.04 203 317 21.72 20.78 0.03 0.04 24.91 19.06
Egypt 200 241 15.81 16.17 0.19 0.23 22.30 22.30 91 239 50.07 62.37 0.08 0.16 13.51 28.05
El Salvador 614 633 20.99 21.20 0.05 0.05 19.13 19.13 556 701 90.54 82.26 0.04 0.03 19.26 15.38
Eritrea 13 11 5.66 5.32 0.00 0.00 14.32 7.05 1 4 7.24 12.06 0.00 0.00 2.68 12.86
Estonia 1,685 1,592 14.79 14.27 0.03 0.02 18.07 25.66 0 0 34.57 34.57 0.00 0.00 14.67 14.67
Table A3.1 Indicators of industrial performance by economy, 2006 and 2011

197
Ind
ICa
tor
s o
F Ind
us
tr
Ial P
er
For
Ma
nC
e B
y e
Co
no
My
A3
Economy
Manufacturing value added per capita
(2005 $)
Share of manufacturing value
added in GDP (percent)
Share of world manufacturing
value added (percent)
Share of medium- and high-
technology activities (percent)
Manufactured exports per capita
(US$)
Share of manufactured exports in total exports
(percent)
Share of world manufactured exports
(percent)
Share of medium- and high-technology activities in
manufactured exports (percent)
2006 2011 2006 2011 2006 2011 2006 2011 2006 2011 2006 2011 2006 2011 2006 2011
Albania 419 542 15.05 15.77 0.02 0.02 20.21 14.36 53 446 70.31 73.62 0.00 0.01 16.27 16.67
Algeria 176 159 5.65 4.79 0.07 0.07 11.28 11.28 267 512 16.32 25.07 0.10 0.15 1.28 0.53
Argentina 1,097 1,396 21.53 20.60 0.54 0.65 25.84 25.84 686 1,059 57.53 51.38 0.30 0.35 34.19 46.33
Armenia 232 247 12.85 12.38 0.01 0.01 7.62 5.81 2,613 5,687 43.95 47.71 0.61 1.03 29.39 17.47
Australia 3,744 3,685 9.81 9.33 0.98 0.96 23.01 23.01 14,023 17,497 86.47 86.84 1.30 1.18 60.73 59.93
Austria 7,046 7,360 18.44 18.43 0.73 0.71 42.05 41.74 252 280 34.45 9.83 0.02 0.02 11.90 13.88
Azerbaijan 108 104 5.26 3.41 0.01 0.01 9.56 6.34 77 84 93.71 91.74 0.12 0.12 2.93 4.34
Bangladesh 74 101 16.48 17.58 0.13 0.17 20.20 20.20 232 230 83.28 63.66 0.01 0.01 25.70 21.60
Barbados 655 566 5.71 5.23 0.00 0.00 38.11 38.11 743 825 81.88 84.65 0.00 0.00 37.14 41.90
Belgium 5,652 5,360 15.28 14.16 0.75 0.66 44.81 42.28 30,903 38,777 87.66 87.25 3.64 3.34 55.46 53.12
Belize 397 418 9.76 10.36 0.00 0.00 18.46 18.46 164 321 36.16 35.54 0.02 0.03 10.86 2.00
Bolivia, Plurinational State of 129 147 11.99 11.82 0.02 0.02 5.05 5.05 2,259 2,787 95.28 96.24 0.05 0.05 2.24 5.78
Botswana 195 230 3.45 3.75 0.00 0.01 21.59 21.59 527 846 71.88 64.96 1.11 1.33 46.32 35.54
Brazil 737 779 15.11 13.60 1.74 1.76 33.27 34.97 403 361 43.10 33.63 0.00 0.00 0.61 0.45
Bulgaria 560 675 13.99 14.98 0.05 0.06 24.20 25.57 1,471 2,639 74.89 69.76 0.13 0.16 27.77 35.93
Cambodia 97 127 18.88 19.51 0.02 0.02 0.26 0.26 210 335 79.57 71.46 0.03 0.04 2.44 7.06
Cameroon 158 158 16.61 15.82 0.04 0.04 11.01 11.01 55 49 27.46 45.68 0.01 0.01 2.88 28.66
Canada 4,764 3,867 13.33 10.77 1.96 1.52 37.34 37.35 7,554 7,359 67.95 59.97 2.77 2.02 57.89 54.48
Cape Verde 120 150 5.36 5.31 0.00 0.00 30.60 27.10 20 86 47.06 62.27 0.00 0.00 0.75 1.10
Central African Republic 25 19 7.19 5.38 0.00 0.00 9.25 9.25 20 7 75.46 30.39 0.00 0.00 0.27 13.24
Chile 1,111 1,069 14.79 12.57 0.23 0.21 1.32 18.92 1,807 2,202 50.12 46.71 0.33 0.30 12.67 12.56
China 631 1,063 32.62 34.15 10.44 16.42 41.29 40.70 701 1,355 95.09 96.17 10.36 14.60 57.94 58.96
Colombia 505 545 14.13 13.20 0.28 0.29 20.71 20.71 270 337 48.40 28.08 0.13 0.13 39.00 31.98
Congo 72 86 4.07 4.40 0.00 0.00 13.14 2.42 54 597 13.60 34.91 0.00 0.02 6.30 83.42
Costa Rica 991 972 20.00 17.67 0.05 0.05 19.73 16.58 1,193 1,595 72.08 73.77 0.06 0.06 69.14 58.77
Côte d’Ivoire 159 152 17.71 17.63 0.04 0.04 14.99 14.99 213 159 47.89 29.04 0.04 0.03 31.10 19.22
Croatia 1,555 1,347 14.65 12.63 0.09 0.07 31.77 31.77 2,063 2,738 88.15 90.07 0.10 0.10 44.56 47.80
Cyprus 1,234 1,096 7.31 6.35 0.02 0.01 4.83 12.32 363 553 66.93 70.67 0.00 0.00 53.14 55.08
Czech Republic 3,287 3,812 24.22 26.58 0.42 0.46 44.36 44.62 8,572 14,364 92.44 93.17 0.99 1.21 66.09 67.88
Denmark 5,941 5,528 12.14 11.85 0.41 0.35 42.71 30.51 12,528 14,805 74.46 73.15 0.77 0.66 54.07 52.24
Ecuador 259 307 9.12 9.50 0.04 0.05 8.97 8.04 203 317 21.72 20.78 0.03 0.04 24.91 19.06
Egypt 200 241 15.81 16.17 0.19 0.23 22.30 22.30 91 239 50.07 62.37 0.08 0.16 13.51 28.05
El Salvador 614 633 20.99 21.20 0.05 0.05 19.13 19.13 556 701 90.54 82.26 0.04 0.03 19.26 15.38
Eritrea 13 11 5.66 5.32 0.00 0.00 14.32 7.05 1 4 7.24 12.06 0.00 0.00 2.68 12.86
Estonia 1,685 1,592 14.79 14.27 0.03 0.02 18.07 25.66 0 0 34.57 34.57 0.00 0.00 14.67 14.67
Table A3.1 Indicators of industrial performance by economy, 2006 and 2011
(continued)

198
Ind
ICa
tor
s o
F Ind
us
tr
Ial P
er
For
Ma
nC
e B
y e
Co
no
My
A3
Economy
Manufacturing value added per capita
(2005 $)
Share of manufacturing value
added in GDP (percent)
Share of world manufacturing
value added (percent)
Share of medium- and high-
technology activities (percent)
Manufactured exports per capita
(US$)
Share of manufactured exports in total exports
(percent)
Share of world manufactured exports
(percent)
Share of medium- and high-technology activities in
manufactured exports (percent)
2006 2011 2006 2011 2006 2011 2006 2011 2006 2011 2006 2011 2006 2011 2006 2011
Ethiopia 8 11 4.39 4.24 0.01 0.01 6.86 9.41 6,586 11,775 88.17 87.08 0.10 0.13 42.38 44.59
Fiji 471 462 12.72 13.01 0.00 0.00 6.81 5.54 411 438 72.93 67.52 0.00 0.00 5.01 9.20
Finland 8,514 8,097 21.95 20.52 0.56 0.50 42.95 45.36 13,548 13,191 92.32 90.15 0.80 0.57 55.59 46.44
France 4,131 3,918 11.58 11.01 3.19 2.84 44.59 45.41 6,951 8,025 89.07 87.11 4.80 4.05 65.57 64.34
Gabon 251 267 4.01 3.86 0.00 0.00 5.39 5.39 643 661 14.93 18.23 0.01 0.01 10.65 10.09
Gambia, The 28 23 6.57 4.70 0.00 0.00 3.90 3.90 1 2 16.33 35.81 0.00 0.00 64.06 5.69
Georgia 213 282 13.52 13.83 0.01 0.01 20.23 21.39 172 297 81.61 75.67 0.01 0.01 42.74 49.27
Germany 7,405 7,106 21.31 19.23 7.69 6.70 57.00 56.76 12,279 15,901 90.33 88.14 11.39 10.45 71.94 72.04
Ghana 44 45 8.48 6.70 0.01 0.01 0.80 0.80 43 265 26.11 35.89 0.01 0.05 2.86 5.93
Greece 1,784 1,618 7.90 8.14 0.25 0.21 16.64 17.17 1,422 2,184 76.18 78.45 0.18 0.20 34.75 26.05
Guatemala 405 395 18.41 17.21 0.07 0.07 22.93 16.25 139 464 56.86 67.33 0.02 0.05 29.03 18.96
Haiti 45 40 10.00 8.83 0.01 0.00 5.26 5.26 6 6 82.97 82.97 0.00 0.00 3.80 3.80
Honduras 275 271 18.68 17.59 0.02 0.02 7.16 7.16 132 143 49.17 40.40 0.01 0.01 39.72 27.79
Hong Kong SAR China 558 575 2.01 1.81 0.05 0.05 33.08 32.58 2,397 1,041 71.94 44.01 0.18 0.06 36.89 44.78
Hungary 2,230 2,357 19.58 21.14 0.28 0.27 53.41 53.47 6,526 9,812 88.69 87.92 0.74 0.78 77.97 75.62
Iceland 4,895 4,884 8.64 9.36 0.02 0.02 14.18 14.18 4,151 4,573 36.18 27.70 0.01 0.01 43.37 42.88
India 116 158 14.78 14.89 1.70 2.25 36.14 37.27 90 202 85.95 83.34 1.17 2.01 23.18 27.67
Indonesia 356 420 27.17 25.30 1.03 1.17 31.09 37.81 277 466 63.20 55.50 0.72 0.90 30.54 28.92
Iran, Islamic Rep. of 314 326 10.90 10.37 0.28 0.28 41.82 40.70 132 344 14.78 19.69 0.11 0.21 25.15 31.69
Iraq 20 25 1.69 1.93 0.01 0.01 24.68 24.68 24 4 2.34 0.27 0.01 0.00 80.00 5.23
Ireland 10,141 11,536 20.02 25.44 0.54 0.60 59.24 64.07 23,635 26,348 91.84 93.89 1.12 0.95 56.41 53.35
Israel 2,932 3,203 14.00 14.11 0.25 0.28 57.78 55.61 5,798 8,652 83.71 96.51 0.44 0.52 41.84 53.44
Italy 5,164 4,223 16.82 14.66 3.84 2.94 36.91 39.33 6,529 7,826 92.47 90.92 4.34 3.81 53.98 53.69
Jamaica 312 284 7.22 6.92 0.01 0.01 18.77 18.77 687 513 94.82 91.85 0.02 0.01 3.12 1.71
Japan 8,006 7,374 21.80 20.53 12.74 10.70 53.36 53.70 4,753 5,968 92.94 91.70 6.76 6.04 82.24 78.89
Jordan 415 449 16.77 16.26 0.03 0.03 21.31 24.91 593 790 79.56 74.28 0.04 0.04 27.74 46.40
Kazakhstan 485 565 11.74 11.03 0.09 0.11 6.50 6.84 536 1,251 21.47 23.01 0.09 0.16 31.13 34.55
Kenya 57 61 10.53 10.35 0.03 0.03 9.29 4.08 50 62 52.53 48.85 0.02 0.02 18.04 24.93
Korea, Rep. of 4,770 6,046 25.37 27.74 2.84 3.36 54.65 53.41 6,669 11,100 96.86 96.74 3.54 4.30 75.16 71.85
Kuwait 2,581 2,323 7.14 6.72 0.08 0.08 20.56 18.09 7,825 7,783 33.40 40.93 0.21 0.23 7.86 13.45
Kyrgyzstan 53 68 10.70 11.41 0.00 0.00 2.67 4.36 66 88 47.74 25.94 0.00 0.00 19.75 17.93
Latvia 828 771 10.55 10.58 0.02 0.02 14.59 20.77 2,220 4,314 86.41 80.71 0.06 0.08 27.58 35.07
Lebanon 531 510 9.89 7.13 0.03 0.02 10.83 19.95 393 651 70.49 64.99 0.02 0.02 35.36 35.80
Lithuania 1,576 1,694 19.13 19.34 0.07 0.06 18.54 18.46 3,743 7,377 89.97 86.92 0.14 0.20 37.54 37.58
Luxembourg 6,268 4,333 7.39 5.33 0.04 0.03 15.06 4.97 26,257 26,432 86.27 83.99 0.14 0.11 39.78 37.64
Macao SAR China 796 506 2.91 1.08 0.00 0.00 3.55 3.55 3,547 239 97.35 43.47 0.02 0.00 1.65 7.06
Macedonia, Former Yugoslav Rep. of 444 410 14.44 11.61 0.01 0.01 14.09 14.60 1,049 1,951 89.29 90.40 0.02 0.03 22.27 40.18
Madagascar 36 37 12.46 13.36 0.01 0.01 3.28 3.28 28 44 55.91 67.70 0.01 0.01 2.89 8.17
Table A3.1 (continued)Indicators of industrial performance by economy, 2006 and 2011

199
Ind
ICa
tor
s o
F Ind
us
tr
Ial P
er
For
Ma
nC
e B
y e
Co
no
My
A3
Economy
Manufacturing value added per capita
(2005 $)
Share of manufacturing value
added in GDP (percent)
Share of world manufacturing
value added (percent)
Share of medium- and high-
technology activities (percent)
Manufactured exports per capita
(US$)
Share of manufactured exports in total exports
(percent)
Share of world manufactured exports
(percent)
Share of medium- and high-technology activities in
manufactured exports (percent)
2006 2011 2006 2011 2006 2011 2006 2011 2006 2011 2006 2011 2006 2011 2006 2011
Ethiopia 8 11 4.39 4.24 0.01 0.01 6.86 9.41 6,586 11,775 88.17 87.08 0.10 0.13 42.38 44.59
Fiji 471 462 12.72 13.01 0.00 0.00 6.81 5.54 411 438 72.93 67.52 0.00 0.00 5.01 9.20
Finland 8,514 8,097 21.95 20.52 0.56 0.50 42.95 45.36 13,548 13,191 92.32 90.15 0.80 0.57 55.59 46.44
France 4,131 3,918 11.58 11.01 3.19 2.84 44.59 45.41 6,951 8,025 89.07 87.11 4.80 4.05 65.57 64.34
Gabon 251 267 4.01 3.86 0.00 0.00 5.39 5.39 643 661 14.93 18.23 0.01 0.01 10.65 10.09
Gambia, The 28 23 6.57 4.70 0.00 0.00 3.90 3.90 1 2 16.33 35.81 0.00 0.00 64.06 5.69
Georgia 213 282 13.52 13.83 0.01 0.01 20.23 21.39 172 297 81.61 75.67 0.01 0.01 42.74 49.27
Germany 7,405 7,106 21.31 19.23 7.69 6.70 57.00 56.76 12,279 15,901 90.33 88.14 11.39 10.45 71.94 72.04
Ghana 44 45 8.48 6.70 0.01 0.01 0.80 0.80 43 265 26.11 35.89 0.01 0.05 2.86 5.93
Greece 1,784 1,618 7.90 8.14 0.25 0.21 16.64 17.17 1,422 2,184 76.18 78.45 0.18 0.20 34.75 26.05
Guatemala 405 395 18.41 17.21 0.07 0.07 22.93 16.25 139 464 56.86 67.33 0.02 0.05 29.03 18.96
Haiti 45 40 10.00 8.83 0.01 0.00 5.26 5.26 6 6 82.97 82.97 0.00 0.00 3.80 3.80
Honduras 275 271 18.68 17.59 0.02 0.02 7.16 7.16 132 143 49.17 40.40 0.01 0.01 39.72 27.79
Hong Kong SAR China 558 575 2.01 1.81 0.05 0.05 33.08 32.58 2,397 1,041 71.94 44.01 0.18 0.06 36.89 44.78
Hungary 2,230 2,357 19.58 21.14 0.28 0.27 53.41 53.47 6,526 9,812 88.69 87.92 0.74 0.78 77.97 75.62
Iceland 4,895 4,884 8.64 9.36 0.02 0.02 14.18 14.18 4,151 4,573 36.18 27.70 0.01 0.01 43.37 42.88
India 116 158 14.78 14.89 1.70 2.25 36.14 37.27 90 202 85.95 83.34 1.17 2.01 23.18 27.67
Indonesia 356 420 27.17 25.30 1.03 1.17 31.09 37.81 277 466 63.20 55.50 0.72 0.90 30.54 28.92
Iran, Islamic Rep. of 314 326 10.90 10.37 0.28 0.28 41.82 40.70 132 344 14.78 19.69 0.11 0.21 25.15 31.69
Iraq 20 25 1.69 1.93 0.01 0.01 24.68 24.68 24 4 2.34 0.27 0.01 0.00 80.00 5.23
Ireland 10,141 11,536 20.02 25.44 0.54 0.60 59.24 64.07 23,635 26,348 91.84 93.89 1.12 0.95 56.41 53.35
Israel 2,932 3,203 14.00 14.11 0.25 0.28 57.78 55.61 5,798 8,652 83.71 96.51 0.44 0.52 41.84 53.44
Italy 5,164 4,223 16.82 14.66 3.84 2.94 36.91 39.33 6,529 7,826 92.47 90.92 4.34 3.81 53.98 53.69
Jamaica 312 284 7.22 6.92 0.01 0.01 18.77 18.77 687 513 94.82 91.85 0.02 0.01 3.12 1.71
Japan 8,006 7,374 21.80 20.53 12.74 10.70 53.36 53.70 4,753 5,968 92.94 91.70 6.76 6.04 82.24 78.89
Jordan 415 449 16.77 16.26 0.03 0.03 21.31 24.91 593 790 79.56 74.28 0.04 0.04 27.74 46.40
Kazakhstan 485 565 11.74 11.03 0.09 0.11 6.50 6.84 536 1,251 21.47 23.01 0.09 0.16 31.13 34.55
Kenya 57 61 10.53 10.35 0.03 0.03 9.29 4.08 50 62 52.53 48.85 0.02 0.02 18.04 24.93
Korea, Rep. of 4,770 6,046 25.37 27.74 2.84 3.36 54.65 53.41 6,669 11,100 96.86 96.74 3.54 4.30 75.16 71.85
Kuwait 2,581 2,323 7.14 6.72 0.08 0.08 20.56 18.09 7,825 7,783 33.40 40.93 0.21 0.23 7.86 13.45
Kyrgyzstan 53 68 10.70 11.41 0.00 0.00 2.67 4.36 66 88 47.74 25.94 0.00 0.00 19.75 17.93
Latvia 828 771 10.55 10.58 0.02 0.02 14.59 20.77 2,220 4,314 86.41 80.71 0.06 0.08 27.58 35.07
Lebanon 531 510 9.89 7.13 0.03 0.02 10.83 19.95 393 651 70.49 64.99 0.02 0.02 35.36 35.80
Lithuania 1,576 1,694 19.13 19.34 0.07 0.06 18.54 18.46 3,743 7,377 89.97 86.92 0.14 0.20 37.54 37.58
Luxembourg 6,268 4,333 7.39 5.33 0.04 0.03 15.06 4.97 26,257 26,432 86.27 83.99 0.14 0.11 39.78 37.64
Macao SAR China 796 506 2.91 1.08 0.00 0.00 3.55 3.55 3,547 239 97.35 43.47 0.02 0.00 1.65 7.06
Macedonia, Former Yugoslav Rep. of 444 410 14.44 11.61 0.01 0.01 14.09 14.60 1,049 1,951 89.29 90.40 0.02 0.03 22.27 40.18
Madagascar 36 37 12.46 13.36 0.01 0.01 3.28 3.28 28 44 55.91 67.70 0.01 0.01 2.89 8.17
Table A3.1 (continued)Indicators of industrial performance by economy, 2006 and 2011
(continued)

200
Ind
ICa
tor
s o
F Ind
us
tr
Ial P
er
For
Ma
nC
e B
y e
Co
no
My
A3
Economy
Manufacturing value added per capita
(2005 $)
Share of manufacturing value
added in GDP (percent)
Share of world manufacturing
value added (percent)
Share of medium- and high-
technology activities (percent)
Manufactured exports per capita
(US$)
Share of manufactured exports in total exports
(percent)
Share of world manufactured exports
(percent)
Share of medium- and high-technology activities in
manufactured exports (percent)
2006 2011 2006 2011 2006 2011 2006 2011 2006 2011 2006 2011 2006 2011 2006 2011
Malawi 23 27 10.27 10.20 0.00 0.00 11.16 12.51 10 33 20.46 35.58 0.00 0.00 18.97 14.80
Malaysia 1,639 1,673 29.84 26.73 0.55 0.55 48.95 41.76 5,109 6,385 84.54 81.18 1.53 1.47 70.81 59.11
Malta 2,022 1,817 13.59 11.19 0.01 0.01 41.95 44.92 6,392 11,970 92.26 94.78 0.03 0.04 79.23 42.59
Mauritius 895 982 17.37 15.75 0.01 0.01 2.27 2.98 1,607 1,401 87.25 96.49 0.02 0.01 22.11 3.87
Mexico 1,511 1,482 18.33 17.75 2.05 1.95 39.54 38.45 1,864 2,338 80.43 76.78 2.26 2.15 76.64 77.83
Moldova, Rep. of 103 95 12.18 9.08 0.00 0.00 7.73 5.55 371 452 62.13 62.93 0.01 0.01 2.47 1.91
Mongolia 63 86 5.96 5.97 0.00 0.00 5.76 5.30 142 201 73.92 58.53 0.01 0.01 14.08 13.60
Morocco 293 316 14.04 12.89 0.11 0.12 21.67 21.61 330 521 80.75 77.70 0.11 0.13 28.77 40.10
Mozambique 45 48 13.60 11.71 0.01 0.01 10.74 10.74 13 35 11.94 23.41 0.00 0.01 29.77 26.67
Nepal 23 22 7.51 6.41 0.01 0.01 9.13 1.89 22 24 87.02 79.62 0.01 0.01 9.18 19.60
Netherlands 5,116 5,094 12.69 12.26 1.05 0.97 39.73 40.07 18,475 27,405 75.52 86.08 3.40 3.65 58.14 52.39
New Zealand 3,673 3,486 13.30 12.52 0.19 0.18 12.65 13.86 2,526 3,699 49.89 45.02 0.12 0.13 25.68 20.91
Niger 16 15 5.89 5.43 0.00 0.00 24.77 24.77 20 47 56.21 78.23 0.00 0.01 22.61 4.83
Nigeria 24 32 2.89 3.08 0.04 0.06 33.44 33.44 28 121 6.85 15.60 0.05 0.16 15.82 8.87
Norway 5,805 5,633 8.77 8.67 0.34 0.32 30.17 24.09 6,471 8,433 24.72 26.06 0.34 0.33 45.95 45.34
Oman 1,110 1,362 8.48 8.90 0.03 0.04 13.10 16.75 754 2,328 9.59 16.07 0.02 0.05 33.94 49.55
Pakistan 129 142 17.90 18.04 0.26 0.29 24.57 24.57 93 115 89.29 80.67 0.17 0.16 7.67 10.94
Palestinian Territories 141 162 11.69 11.11 0.01 0.01 7.13 7.59 67 105 92.10 92.29 0.00 0.00 13.02 9.49
Panama 338 367 6.64 5.11 0.01 0.02 6.13 6.13 63 3,928 20.58 96.37 0.00 0.11 12.40 60.28
Paraguay 177 175 13.65 11.33 0.01 0.01 12.87 12.87 89 184 28.86 15.57 0.01 0.01 15.29 12.53
Peru 457 596 14.90 14.61 0.16 0.20 13.52 14.49 412 782 48.33 50.35 0.13 0.18 3.66 5.03
Philippines 296 322 23.79 22.40 0.32 0.35 45.31 45.31 506 350 93.00 69.19 0.50 0.27 78.66 65.27
Poland 1,509 2,251 17.84 21.59 0.72 0.99 32.51 35.35 2,480 4,295 86.37 87.44 1.06 1.32 55.74 56.16
Portugal 2,288 2,062 12.48 11.42 0.30 0.25 18.02 22.36 3,568 5,055 87.06 91.70 0.42 0.43 44.36 40.13
Qatar 4,275 4,122 8.19 7.30 0.05 0.09 17.44 17.44 5,211 11,552 15.16 19.16 0.06 0.17 35.43 21.46
Romania 1,045 1,206 21.19 22.54 0.29 0.30 23.05 33.88 1,400 2,628 93.99 89.86 0.34 0.45 38.62 54.36
Russian Federation 890 909 15.45 13.71 1.61 1.49 21.88 23.14 753 1,265 35.83 34.95 1.21 1.45 25.99 22.18
Rwanda 22 24 7.30 6.62 0.00 0.00 6.66 6.66 4 20 34.48 58.35 0.00 0.00 6.97 5.06
Saudi Arabia 1,266 1,405 9.64 10.17 0.40 0.45 41.12 41.12 1,702 2,476 20.35 19.41 0.47 0.56 24.66 36.89
Senegal 101 102 12.62 12.26 0.01 0.01 18.31 17.66 34 136 56.41 68.08 0.00 0.01 20.90 12.84
Serbia 391 359 14.71 12.50 0.05 0.04 20.76 20.05 533 931 81.52 77.92 0.06 0.07 25.96 33.78
Singapore 8,027 8,966 26.35 26.24 0.45 0.53 77.80 73.41 30,163 32,241 92.88 89.76 1.50 1.52 72.45 68.99
Slovakia 2,194 2,336 22.93 20.55 0.15 0.15 39.83 43.32 7,009 13,389 91.16 93.35 0.43 0.59 60.76 64.78
Slovenia 3,852 3,644 20.45 18.88 0.10 0.09 42.66 45.52 9,444 12,784 90.33 89.76 0.21 0.21 60.34 61.37
South Africa 897 897 16.62 15.19 0.55 0.52 23.47 21.24 722 1,156 66.34 62.75 0.39 0.47 47.77 43.56
Spain 3,705 2,975 13.87 11.66 2.05 1.59 30.31 34.28 4,184 5,351 86.04 83.37 2.07 1.99 60.26 54.99
Sri Lanka 251 324 19.13 18.97 0.06 0.08 17.49 12.11 253 344 75.18 72.29 0.06 0.06 8.82 9.43
St. Lucia 269 327 4.82 6.59 0.00 0.00 7.83 7.83 197 247 63.18 61.64 0.00 0.00 28.87 30.00
Table A3.1 (continued)Indicators of industrial performance by economy, 2006 and 2011

201
Ind
ICa
tor
s o
F Ind
us
tr
Ial P
er
For
Ma
nC
e B
y e
Co
no
My
A3
Economy
Manufacturing value added per capita
(2005 $)
Share of manufacturing value
added in GDP (percent)
Share of world manufacturing
value added (percent)
Share of medium- and high-
technology activities (percent)
Manufactured exports per capita
(US$)
Share of manufactured exports in total exports
(percent)
Share of world manufactured exports
(percent)
Share of medium- and high-technology activities in
manufactured exports (percent)
2006 2011 2006 2011 2006 2011 2006 2011 2006 2011 2006 2011 2006 2011 2006 2011
Malawi 23 27 10.27 10.20 0.00 0.00 11.16 12.51 10 33 20.46 35.58 0.00 0.00 18.97 14.80
Malaysia 1,639 1,673 29.84 26.73 0.55 0.55 48.95 41.76 5,109 6,385 84.54 81.18 1.53 1.47 70.81 59.11
Malta 2,022 1,817 13.59 11.19 0.01 0.01 41.95 44.92 6,392 11,970 92.26 94.78 0.03 0.04 79.23 42.59
Mauritius 895 982 17.37 15.75 0.01 0.01 2.27 2.98 1,607 1,401 87.25 96.49 0.02 0.01 22.11 3.87
Mexico 1,511 1,482 18.33 17.75 2.05 1.95 39.54 38.45 1,864 2,338 80.43 76.78 2.26 2.15 76.64 77.83
Moldova, Rep. of 103 95 12.18 9.08 0.00 0.00 7.73 5.55 371 452 62.13 62.93 0.01 0.01 2.47 1.91
Mongolia 63 86 5.96 5.97 0.00 0.00 5.76 5.30 142 201 73.92 58.53 0.01 0.01 14.08 13.60
Morocco 293 316 14.04 12.89 0.11 0.12 21.67 21.61 330 521 80.75 77.70 0.11 0.13 28.77 40.10
Mozambique 45 48 13.60 11.71 0.01 0.01 10.74 10.74 13 35 11.94 23.41 0.00 0.01 29.77 26.67
Nepal 23 22 7.51 6.41 0.01 0.01 9.13 1.89 22 24 87.02 79.62 0.01 0.01 9.18 19.60
Netherlands 5,116 5,094 12.69 12.26 1.05 0.97 39.73 40.07 18,475 27,405 75.52 86.08 3.40 3.65 58.14 52.39
New Zealand 3,673 3,486 13.30 12.52 0.19 0.18 12.65 13.86 2,526 3,699 49.89 45.02 0.12 0.13 25.68 20.91
Niger 16 15 5.89 5.43 0.00 0.00 24.77 24.77 20 47 56.21 78.23 0.00 0.01 22.61 4.83
Nigeria 24 32 2.89 3.08 0.04 0.06 33.44 33.44 28 121 6.85 15.60 0.05 0.16 15.82 8.87
Norway 5,805 5,633 8.77 8.67 0.34 0.32 30.17 24.09 6,471 8,433 24.72 26.06 0.34 0.33 45.95 45.34
Oman 1,110 1,362 8.48 8.90 0.03 0.04 13.10 16.75 754 2,328 9.59 16.07 0.02 0.05 33.94 49.55
Pakistan 129 142 17.90 18.04 0.26 0.29 24.57 24.57 93 115 89.29 80.67 0.17 0.16 7.67 10.94
Palestinian Territories 141 162 11.69 11.11 0.01 0.01 7.13 7.59 67 105 92.10 92.29 0.00 0.00 13.02 9.49
Panama 338 367 6.64 5.11 0.01 0.02 6.13 6.13 63 3,928 20.58 96.37 0.00 0.11 12.40 60.28
Paraguay 177 175 13.65 11.33 0.01 0.01 12.87 12.87 89 184 28.86 15.57 0.01 0.01 15.29 12.53
Peru 457 596 14.90 14.61 0.16 0.20 13.52 14.49 412 782 48.33 50.35 0.13 0.18 3.66 5.03
Philippines 296 322 23.79 22.40 0.32 0.35 45.31 45.31 506 350 93.00 69.19 0.50 0.27 78.66 65.27
Poland 1,509 2,251 17.84 21.59 0.72 0.99 32.51 35.35 2,480 4,295 86.37 87.44 1.06 1.32 55.74 56.16
Portugal 2,288 2,062 12.48 11.42 0.30 0.25 18.02 22.36 3,568 5,055 87.06 91.70 0.42 0.43 44.36 40.13
Qatar 4,275 4,122 8.19 7.30 0.05 0.09 17.44 17.44 5,211 11,552 15.16 19.16 0.06 0.17 35.43 21.46
Romania 1,045 1,206 21.19 22.54 0.29 0.30 23.05 33.88 1,400 2,628 93.99 89.86 0.34 0.45 38.62 54.36
Russian Federation 890 909 15.45 13.71 1.61 1.49 21.88 23.14 753 1,265 35.83 34.95 1.21 1.45 25.99 22.18
Rwanda 22 24 7.30 6.62 0.00 0.00 6.66 6.66 4 20 34.48 58.35 0.00 0.00 6.97 5.06
Saudi Arabia 1,266 1,405 9.64 10.17 0.40 0.45 41.12 41.12 1,702 2,476 20.35 19.41 0.47 0.56 24.66 36.89
Senegal 101 102 12.62 12.26 0.01 0.01 18.31 17.66 34 136 56.41 68.08 0.00 0.01 20.90 12.84
Serbia 391 359 14.71 12.50 0.05 0.04 20.76 20.05 533 931 81.52 77.92 0.06 0.07 25.96 33.78
Singapore 8,027 8,966 26.35 26.24 0.45 0.53 77.80 73.41 30,163 32,241 92.88 89.76 1.50 1.52 72.45 68.99
Slovakia 2,194 2,336 22.93 20.55 0.15 0.15 39.83 43.32 7,009 13,389 91.16 93.35 0.43 0.59 60.76 64.78
Slovenia 3,852 3,644 20.45 18.88 0.10 0.09 42.66 45.52 9,444 12,784 90.33 89.76 0.21 0.21 60.34 61.37
South Africa 897 897 16.62 15.19 0.55 0.52 23.47 21.24 722 1,156 66.34 62.75 0.39 0.47 47.77 43.56
Spain 3,705 2,975 13.87 11.66 2.05 1.59 30.31 34.28 4,184 5,351 86.04 83.37 2.07 1.99 60.26 54.99
Sri Lanka 251 324 19.13 18.97 0.06 0.08 17.49 12.11 253 344 75.18 72.29 0.06 0.06 8.82 9.43
St. Lucia 269 327 4.82 6.59 0.00 0.00 7.83 7.83 197 247 63.18 61.64 0.00 0.00 28.87 30.00
Table A3.1 (continued)Indicators of industrial performance by economy, 2006 and 2011
(continued)

202
Ind
ICa
tor
s o
F Ind
us
tr
Ial P
er
For
Ma
nC
e B
y e
Co
no
My
A3
Economy
Manufacturing value added per capita
(2005 $)
Share of manufacturing value
added in GDP (percent)
Share of world manufacturing
value added (percent)
Share of medium- and high-
technology activities (percent)
Manufactured exports per capita
(US$)
Share of manufactured exports in total exports
(percent)
Share of world manufactured exports
(percent)
Share of medium- and high-technology activities in
manufactured exports (percent)
2006 2011 2006 2011 2006 2011 2006 2011 2006 2011 2006 2011 2006 2011 2006 2011
Suriname 579 598 15.69 13.88 0.00 0.00 11.64 11.64 156 626 6.99 13.83 0.00 0.00 22.13 19.37
Swaziland 720 727 30.15 29.88 0.01 0.01 0.01 0.01 1,174 890 94.72 92.86 0.01 0.01 20.80 28.96
Sweden 7,598 7,419 17.87 16.97 0.87 0.80 52.87 46.96 14,551 17,620 89.76 89.01 1.49 1.33 60.87 57.76
Switzerland 9,687 10,110 18.74 18.56 0.91 0.89 34.91 34.91 18,403 27,800 92.95 91.18 1.55 1.71 67.97 70.57
Syrian Arab Rep. 41 52 2.59 2.96 0.01 0.01 21.52 21.52 255 244 44.12 43.87 0.05 0.05 29.13 22.69
Taiwan Province of China 4,402 4,885 26.46 25.77 1.27 1.30 61.88 61.88 9,449 11,941 96.49 95.41 2.43 2.22 71.99 71.08
Tajikistan 80 100 26.88 20.47 0.01 0.01 3.28 2.40 16 16 13.82 13.82 0.00 0.00 66.30 66.30
Tanzania, United Rep. of 31 40 8.08 8.71 0.02 0.02 1.18 1.18 11 43 25.97 42.30 0.00 0.02 11.30 16.67
Thailand 963 1,108 34.96 36.66 0.82 0.88 46.16 46.16 1,677 2,696 86.41 81.90 1.27 1.50 62.36 58.53
Tonga 196 200 7.70 7.86 0.00 0.00 17.31 17.31 8 18 8.49 13.13 0.00 0.00 35.19 18.91
Trinidad and Tobago 756 883 5.48 6.37 0.01 0.01 39.38 39.38 5,662 5,510 53.31 73.95 0.08 0.07 20.95 17.70
Tunisia 521 611 15.30 16.38 0.07 0.07 9.32 9.32 1,002 1,381 85.80 81.96 0.11 0.12 32.33 45.80
Turkey 1,309 1,503 17.51 18.07 1.14 1.27 29.81 30.04 1,115 1,623 90.06 88.60 0.87 0.96 42.70 41.19
Uganda 24 29 6.79 6.93 0.01 0.01 11.07 11.07 10 32 30.51 51.06 0.00 0.01 37.72 32.16
Ukraine 349 380 17.57 18.07 0.20 0.20 22.70 20.78 727 1,286 88.31 84.95 0.38 0.46 40.31 42.16
United Kingdom 4,518 3,882 11.69 10.32 3.44 2.78 42.33 41.99 6,138 6,015 83.61 79.25 4.18 3.00 69.30 62.14
United States 5,901 5,714 13.70 13.50 22.25 20.52 48.25 51.52 2,669 3,150 86.04 75.93 8.99 7.89 72.23 62.18
Uruguay 812 966 14.95 13.42 0.03 0.04 10.67 13.40 533 974 44.86 41.59 0.02 0.03 19.28 26.35
Venezuela, Bol. Rep. of 868 784 14.73 12.68 0.30 0.26 34.28 34.28 140 1,018 6.18 32.81 0.04 0.24 53.17 4.32
Viet Nam 146 209 21.43 23.57 0.15 0.21 20.26 20.26 265 764 55.92 70.01 0.25 0.54 23.04 33.65
Yemen 59 62 7.27 8.30 0.02 0.02 3.89 3.89 28 24 9.13 8.97 0.01 0.00 2.98 11.63
Zambia 69 79 10.66 10.21 0.01 0.01 21.08 21.08 77 118 23.89 17.63 0.01 0.01 14.40 29.57
Source: UNIDO 2013c.
Table A3.1 (continued)Indicators of industrial performance by economy, 2006 and 2011
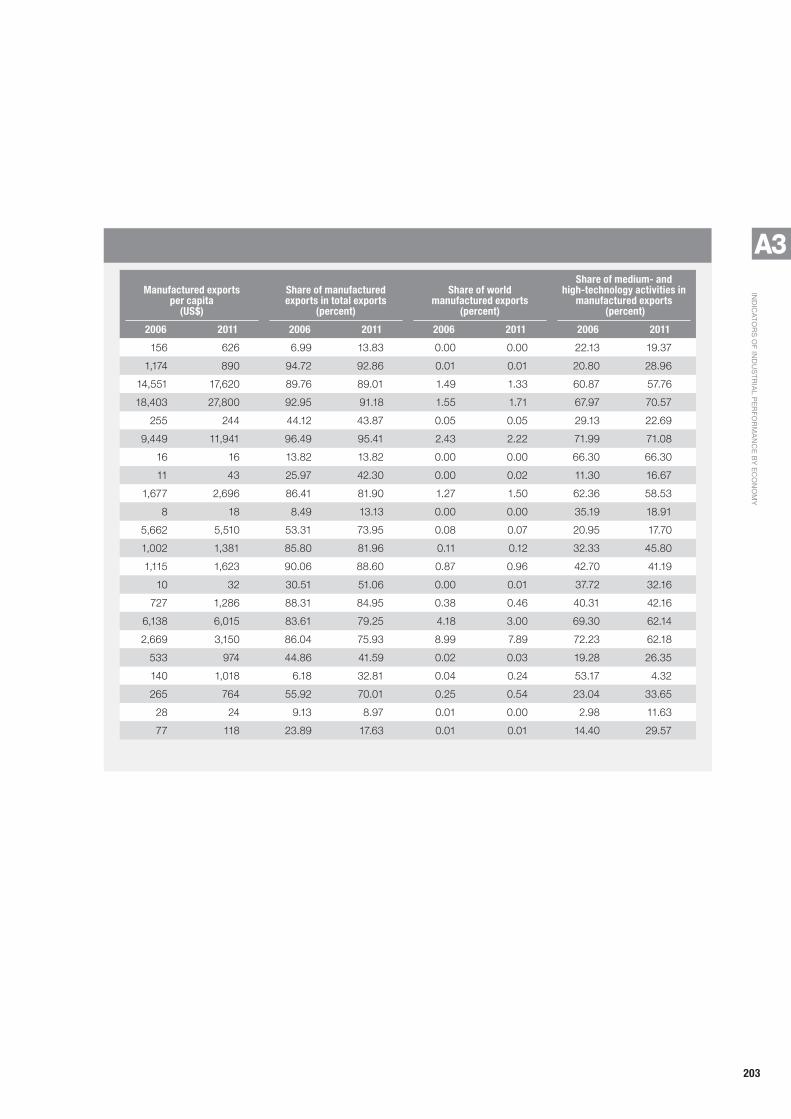
203
Ind
ICa
tor
s o
F Ind
us
tr
Ial P
er
For
Ma
nC
e B
y e
Co
no
My
A3
Economy
Manufacturing value added per capita
(2005 $)
Share of manufacturing value
added in GDP (percent)
Share of world manufacturing
value added (percent)
Share of medium- and high-
technology activities (percent)
Manufactured exports per capita
(US$)
Share of manufactured exports in total exports
(percent)
Share of world manufactured exports
(percent)
Share of medium- and high-technology activities in
manufactured exports (percent)
2006 2011 2006 2011 2006 2011 2006 2011 2006 2011 2006 2011 2006 2011 2006 2011
Suriname 579 598 15.69 13.88 0.00 0.00 11.64 11.64 156 626 6.99 13.83 0.00 0.00 22.13 19.37
Swaziland 720 727 30.15 29.88 0.01 0.01 0.01 0.01 1,174 890 94.72 92.86 0.01 0.01 20.80 28.96
Sweden 7,598 7,419 17.87 16.97 0.87 0.80 52.87 46.96 14,551 17,620 89.76 89.01 1.49 1.33 60.87 57.76
Switzerland 9,687 10,110 18.74 18.56 0.91 0.89 34.91 34.91 18,403 27,800 92.95 91.18 1.55 1.71 67.97 70.57
Syrian Arab Rep. 41 52 2.59 2.96 0.01 0.01 21.52 21.52 255 244 44.12 43.87 0.05 0.05 29.13 22.69
Taiwan Province of China 4,402 4,885 26.46 25.77 1.27 1.30 61.88 61.88 9,449 11,941 96.49 95.41 2.43 2.22 71.99 71.08
Tajikistan 80 100 26.88 20.47 0.01 0.01 3.28 2.40 16 16 13.82 13.82 0.00 0.00 66.30 66.30
Tanzania, United Rep. of 31 40 8.08 8.71 0.02 0.02 1.18 1.18 11 43 25.97 42.30 0.00 0.02 11.30 16.67
Thailand 963 1,108 34.96 36.66 0.82 0.88 46.16 46.16 1,677 2,696 86.41 81.90 1.27 1.50 62.36 58.53
Tonga 196 200 7.70 7.86 0.00 0.00 17.31 17.31 8 18 8.49 13.13 0.00 0.00 35.19 18.91
Trinidad and Tobago 756 883 5.48 6.37 0.01 0.01 39.38 39.38 5,662 5,510 53.31 73.95 0.08 0.07 20.95 17.70
Tunisia 521 611 15.30 16.38 0.07 0.07 9.32 9.32 1,002 1,381 85.80 81.96 0.11 0.12 32.33 45.80
Turkey 1,309 1,503 17.51 18.07 1.14 1.27 29.81 30.04 1,115 1,623 90.06 88.60 0.87 0.96 42.70 41.19
Uganda 24 29 6.79 6.93 0.01 0.01 11.07 11.07 10 32 30.51 51.06 0.00 0.01 37.72 32.16
Ukraine 349 380 17.57 18.07 0.20 0.20 22.70 20.78 727 1,286 88.31 84.95 0.38 0.46 40.31 42.16
United Kingdom 4,518 3,882 11.69 10.32 3.44 2.78 42.33 41.99 6,138 6,015 83.61 79.25 4.18 3.00 69.30 62.14
United States 5,901 5,714 13.70 13.50 22.25 20.52 48.25 51.52 2,669 3,150 86.04 75.93 8.99 7.89 72.23 62.18
Uruguay 812 966 14.95 13.42 0.03 0.04 10.67 13.40 533 974 44.86 41.59 0.02 0.03 19.28 26.35
Venezuela, Bol. Rep. of 868 784 14.73 12.68 0.30 0.26 34.28 34.28 140 1,018 6.18 32.81 0.04 0.24 53.17 4.32
Viet Nam 146 209 21.43 23.57 0.15 0.21 20.26 20.26 265 764 55.92 70.01 0.25 0.54 23.04 33.65
Yemen 59 62 7.27 8.30 0.02 0.02 3.89 3.89 28 24 9.13 8.97 0.01 0.00 2.98 11.63
Zambia 69 79 10.66 10.21 0.01 0.01 21.08 21.08 77 118 23.89 17.63 0.01 0.01 14.40 29.57
Source: UNIDO 2013c.
Table A3.1 (continued)Indicators of industrial performance by economy, 2006 and 2011

204
Annex 4
Technological classification of international trade data
Type of export SITC sections
Resource-based 016, 017, 023, 024, 035, 037, 046, 047, 048, 056, 058, 059, 061, 062, 073, 098, 111, 112, 122, 232, 247, 248, 251, 264, 265, 281, 282, 283, 284, 285, 286, 287, 288, 289, 322, 334, 335, 342, 344, 345, 411, 421, 422, 431, 511, 514, 515, 516, 522, 523, 524, 531, 532, 551, 592, 621, 625, 629, 633, 634, 635, 641, 661, 662, 663, 664, 667, 689
Low technology 611, 612, 613, 642, 651, 652, 654, 655, 656, 657, 658, 659, 665, 666, 673, 674, 675, 676, 677, 679, 691, 692, 693, 694, 695, 696, 697, 699, 821, 831, 841, 842, 843, 844, 845, 846, 848, 851, 893, 894, 895, 897, 898, 899
Medium technology 266, 267, 512, 513, 533, 553, 554, 562, 571, 572, 573, 574, 575, 579, 581, 582, 583, 591, 593, 597, 598, 653, 671, 672, 678, 711, 712,713 ,714, 721, 722, 723, 724, 725, 726, 727, 728, 731, 733, 735, 737, 741, 742, 743, 744, 745, 746, 747, 748, 749, 761, 762, 763, 772, 773, 775, 778, 781, 782, 783, 784, 785, 786, 791, 793, 811, 812, 813, 872, 873, 882, 884, 885
High technology 525, 541, 542, 716, 718, 751, 752, 759, 764, 771, 774, 776, 792, 871, 874, 881, 891
Source: UNIDO 2011b.
Table A4.1 Technology classification of exports, SITC Revision 3
Type of export SITC sections
Resource-based 012, 013, 023, 024, 032, 046, 047, 048, 053, 055, 061, 062, 073, 099, 111, 112, 122, 231, 242, 243, 251, 264, 265, 267, 281, 282, 283, 284, 286, 321, 332, 411, 421, 422, 431, 512, 513, 514, 521, 531, 551, 532, 621, 629, 631, 632, 633, 641, 551, 661, 662
Low technology 611, 612, 613, 642, 651, 652, 654, 655, 656, 657, 665, 666, 673, 674, 675, 676, 677, 679, 691, 692, 693, 694, 695, 696, 697, 698, 821, 831, 841, 842, 851, 891, 893, 894, 895, 897, 899
Medium technology 266, 533, 553, 554, 561, 571, 581, 599, 653, 671, 672, 678, 712, 715, 717, 718, 719, 723, 725, 731, 732, 733, 812, 862, 863, 864, 735, 951
High technology 515, 541, 711, 714, 722, 724, 726, 729, 734, 861
Source: UNIDO elaboration based on UN (2013a).
Table A4.2 Technology classification of exports, SITC Revision 1

205
Annex 5
Technological classification of manufacturing value added data
To compute the share of medium- and high- technology activities in manufacturing value added, the Organisation for Economic Co-operation and Development technology classification (OECD 2005) was used (Table A5.1).
For Niger and Zimbabwe, the classification in Table A5.2 was used because data were available only in ISIC Revision 2.
For this classification, medium- and high-tech-nology activities were combined. The sector shares of value added were then calculated in relation to the total for manufacturing subsectors.
Type of activityISIC division, major group or group
Low technology 15, 16, 17, 18, 19, 20, 21, 22, 36, 37
Medium-low technology manufacturing
23, 25, 26, 27, 28, 351
Medium- and high- technology manufacturing
24, 29, 30, 31, 32, 33, 34, 35 (excluding 351)
Source: UNIDO elaboration based on the Organisation for Economic Co-operation and Development technology classification (OECD 2005).
Table A5.1 Technology classification of manufacturing value added, ISIC Revision 3
Type of activityISIC division, major group or group
Type of activity ISIC division, major group or group
Resource-based 31, 331, 341, 353, 354, 355, 362, 369
Low technology 32, 332, 361, 381, 390
Medium and high technology 342, 351, 352, 356, 37, 38 (excluding 381), 3522, 3852, 3832, 3845, 3849, 385
Source: UNIDO 2011b.
Table A5.2 Technology classification of manufacturing value added, ISIC Revision 2

206
Annex 6
Indicators of manufacturing value added and exports by industrialization level, region and income group
Group 2007 2008 2009 2010 2011
World 1,275 1,258 1,148 1,240 1,264
Industrialized economies 5,142 4,985 4,344 4,735 4,754
Industrializing economies 425 443 455 487 517
By industrialization level
Emerging industrial economies 578 605 625 673 720
Other developing economies 186 190 186 193 196
Least developed economies 44 46 48 50 52
By region
East Asia and the Pacific 624 672 735 796 866
Excluding China 364 376 366 395 409
Europe 977 1,026 996 1,062 1,118
Excluding Poland 757 776 730 750 770
Latin America and the Caribbean 852 856 784 841 864
Excluding Mexico 692 703 653 697 715
Middle East and North Africa 521 523 500 532 554
Excluding Turkey 315 325 324 329 329
South and Central Asia 133 135 142 150 158
Excluding India 147 147 146 152 158
Sub-Saharan Africa 100 101 93 96 97
Excluding South Africa 42 43 43 45 45
By income group
High income industrializing 165 169 172 181 190
Upper middle income industrializing 1,549 1,636 1,625 1,691 1,768
Lower middle income industrializing 776 816 844 914 980
Low income industrializing 41 43 44 46 48
Source: UNIDO 2013c.
Table A6.1 Manufacturing value added per capita, 2007–2011 (constant 2005 $)
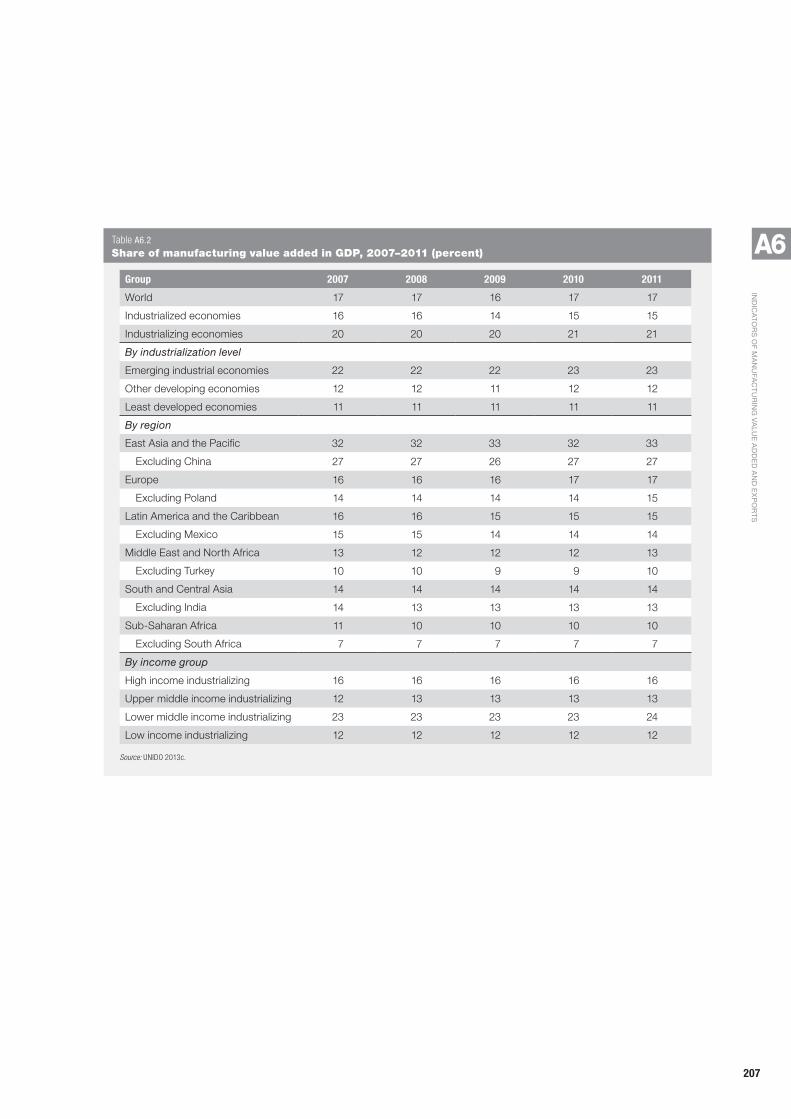
207
Ind
ICa
tor
s o
F Ma
nu
FaC
tu
rIn
G v
alu
e a
dd
ed
an
d e
xP
or
ts
A6Group 2007 2008 2009 2010 2011
World 17 17 16 17 17
Industrialized economies 16 16 14 15 15
Industrializing economies 20 20 20 21 21
By industrialization level
Emerging industrial economies 22 22 22 23 23
Other developing economies 12 12 11 12 12
Least developed economies 11 11 11 11 11
By region
East Asia and the Pacific 32 32 33 32 33
Excluding China 27 27 26 27 27
Europe 16 16 16 17 17
Excluding Poland 14 14 14 14 15
Latin America and the Caribbean 16 16 15 15 15
Excluding Mexico 15 15 14 14 14
Middle East and North Africa 13 12 12 12 13
Excluding Turkey 10 10 9 9 10
South and Central Asia 14 14 14 14 14
Excluding India 14 13 13 13 13
Sub-Saharan Africa 11 10 10 10 10
Excluding South Africa 7 7 7 7 7
By income group
High income industrializing 16 16 16 16 16
Upper middle income industrializing 12 13 13 13 13
Lower middle income industrializing 23 23 23 23 24
Low income industrializing 12 12 12 12 12
Source: UNIDO 2013c.
Table A6.2 Share of manufacturing value added in GDP, 2007–2011 (percent)

208
Ind
ICa
tor
s o
F Ma
nu
FaC
tu
rIn
G v
alu
e a
dd
ed
an
d e
xP
or
ts
A6Group 2007 2008 2009 2010 2011
World 100 100 100 100 100
Industrialized economies 73 71 67 68 66
Industrializing economies 27 29 33 32 34
By industrialization level
Emerging industrial economies 24 26 29 29 31
Other developing economies 2 3 3 3 3
Least developed economies 0 0 0 0 0
By region
East Asia and the Pacific 14 15 18 18 19
Excluding China 2 3 3 3 3
Europe 2 2 2 2 2
Excluding Poland 1 1 1 1 1
Latin America and the Caribbean 6 6 6 6 6
Excluding Mexico 4 4 4 4 4
Middle East and North Africa 2 2 2 2 2
Excluding Turkey 1 1 1 1 1
South and Central Asia 3 3 3 3 3
Excluding India 1 1 1 1 1
Sub-Saharan Africa 1 1 1 1 1
Excluding South Africa 0 0 0 0 0
By income group
High income industrializing 5 5 5 5 5
Upper middle income industrializing 2 2 2 2 2
Lower middle income industrializing 21 22 25 25 26
Low income industrializing 0 0 0 0 0
Source: UNIDO 2013c.
Table A6.3 Share of manufacturing value added in world manufacturing value added, 2007–2011 (percent)

209
Ind
ICa
tor
s o
F Ma
nu
FaC
tu
rIn
G v
alu
e a
dd
ed
an
d e
xP
or
ts
A6Group 2007 2008 2009 2010 2011
World 47 47 47 48 48
Industrialized economies 50 51 51 52 53
Industrializing economies 38 38 38 40 40
By industrialization level
Emerging industrial economies 39 40 40 41 40
Other developing economies 24 24 25 25 26
Least developed economies 19 18 18 19 16
By region
East Asia and the Pacific 42 42 42 43 42
Excluding China 40 41 39 41 40
Europe 26 28 28 29 30
Excluding Poland 23 24 23 24 24
Latin America and the Caribbean 33 33 32 33 34
Excluding Mexico 27 28 27 29 29
Middle East and North Africa 30 31 31 31 33
Excluding Turkey 28 29 29 30 31
South and Central Asia 40 42 43 44 43
Excluding India 27 28 29 29 29
Sub-Saharan Africa 26 27 24 25 26
Excluding South Africa 10 10 9 8 8
By income group
High income industrializing 36 38 38 39 39
Upper middle income industrializing 31 32 33 34 34
Lower middle income industrializing 39 39 39 40 40
Low income industrializing 19 18 17 18 16
Source: UNIDO 2013a.
Table A6.4 Share of medium- and high-technology activities in manufacturing value added, 2007–2011 (percent)

210
Ind
ICa
tor
s o
F Ma
nu
FaC
tu
rIn
G v
alu
e a
dd
ed
an
d e
xP
or
ts
A6Group 2007 2008 2009 2010 2011
World 1,649 1,818 1,411 1,695 1,953
Industrialized economies 6,901 7,517 5,784 6,814 7,798
Industrializing economies 495 574 462 591 702
By industrialization level
Emerging industrial economies 679 794 644 820 988
Other developing economies 206 237 184 252 268
Least developed economies 34 22 18 23 23
By region
East Asia and the Pacific 776 895 753 976 1,159
Excluding China 519 569 487 611 703
Europe 1,771 2,162 1,605 1,923 2,465
Excluding Poland 1,345 1,623 1,143 1,408 1,904
Latin America and the Caribbean 811 939 722 917 1,080
Excluding Mexico 549 667 498 631 777
Middle East and North Africa 627 753 546 656 715
Excluding Turkey 441 531 383 484 499
South and Central Asia 101 115 104 144 183
Excluding India 90 79 60 124 139
Sub-Saharan Africa 96 115 86 119 135
Excluding South Africa 44 52 43 63 69
By income group
High income industrializing 171 201 169 212 253
Upper middle income industrializing 2,516 2,960 2,216 2,706 3,230
Lower middle income industrializing 903 1,054 853 1,104 1,318
Low income industrializing 35 20 16 23 19
Source: UN 2013a.
Table A6.5 Manufactured exports per capita, 2007–2011 (constant 2005 $)

211
Ind
ICa
tor
s o
F Ma
nu
FaC
tu
rIn
G v
alu
e a
dd
ed
an
d e
xP
or
ts
A6Group 2007 2008 2009 2010 2011
World 83 81 82 82 81
Industrialized economies 87 85 86 85 85
Industrializing economies 74 71 74 74 72
By industrialization level
Emerging industrial economies 80 77 79 79 77
Other developing economies 45 39 43 46 43
Least developed economies 53 40 40 35 37
By region
East Asia and the Pacific 91 91 91 91 90
Excluding China 77 74 74 73 71
Europe 88 87 86 86 86
Excluding Poland 88 86 84 85 85
Latin America and the Caribbean 68 62 62 63 61
Excluding Mexico 61 54 52 53 52
Middle East and North Africa 39 34 39 41 38
Excluding Turkey 27 23 27 30 27
South and Central Asia 74 70 75 66 62
Excluding India 52 40 45 39 31
Sub-Saharan Africa 39 38 39 42 37
Excluding South Africa 25 23 27 30 26
By income group
High income industrializing 63 60 62 66 64
Upper middle income industrializing 49 45 51 49 45
Lower middle income industrializing 82 78 81 80 79
Low income industrializing 62 47 45 41 43
Source: UN 2013a.
Table A6.6 Share of manufactured exports in total exports, 2007–2011 (percent)

212
Ind
ICa
tor
s o
F Ma
nu
FaC
tu
rIn
G v
alu
e a
dd
ed
an
d e
xP
or
ts
A6Group 2007 2008 2009 2010 2011
World 100 100 100 100 100
Industrialized economies 75 74 73 71 70
Industrializing economies 25 26 27 29 30
By industrialization level
Emerging industrial economies 22 24 25 26 27
Other developing economies 2 2 2 3 2
Least developed economies 0 0 0 0 0
By region
East Asia and the Pacific 13 14 15 16 17
Excluding China 3 3 3 3 3
Europe 3 3 3 3 3
Excluding Poland 2 2 2 2 2
Latin America and the Caribbean 4 4 4 5 5
Excluding Mexico 2 3 2 3 3
Middle East and North Africa 2 2 2 2 2
Excluding Turkey 1 1 1 1 1
South and Central Asia 2 2 2 2 2
Excluding India 0 0 0 1 1
Sub-Saharan Africa 1 1 1 1 1
Excluding South Africa 0 0 0 0 0
By income group
High income industrializing 4 4 4 4 5
Upper middle income industrializing 2 2 2 2 2
Lower middle income industrializing 19 20 20 22 23
Low income industrializing 0 0 0 0 0
Source: UN 2013a.
Table A6.7 Share in world manufactured exports, 2007–2011 (percent)

213
Ind
ICa
tor
s o
F Ma
nu
FaC
tu
rIn
G v
alu
e a
dd
ed
an
d e
xP
or
ts
A6Group 2007 2008 2009 2010 2011
World 62 60 61 61 59
Industrialized economies 65 64 65 64 63
Industrializing economies 50 50 51 51 50
By industrialization level
Emerging industrial economies 53 53 53 54 52
Other developing economies 31 30 31 27 27
Least developed economies 8 15 18 15 17
By region
East Asia and the Pacific 57 57 58 58 57
Excluding China 52 50 49 48 46
Europe 46 48 50 50 48
Excluding Poland 39 41 42 43 42
Latin America and the Caribbean 54 52 51 51 50
Excluding Mexico 34 34 30 29 30
Middle East and North Africa 34 34 36 37 37
Excluding Turkey 27 27 31 33 35
South and Central Asia 22 26 27 27 27
Excluding India 15 21 19 22 25
Sub-Saharan Africa 36 40 36 32 28
Excluding South Africa 19 25 25 17 12
By income group
High income industrializing 32 34 33 31 30
Upper middle income industrializing 47 47 51 50 49
Lower middle income industrializing 55 54 55 56 55
Low income industrializing 11 16 18 15 15
Source: UN 2013a.
Table A6.8 Share of medium- and high-technology activities in manufactured exports, 2007–2011 (percent)

214
Annex 7
Summary of world trade, by industrialization level, region and income group
Group 2007 2008 2009 2010 2011
World 13,053 15,038 11,601 14,150 16,724
Industrialized economies 9,463 10,596 8,124 9,657 11,190
Industrializing economies 3,591 4,442 3,477 4,493 5,534
By industrialization level
Emerging industrial economies 3,030 3,707 2,948 3,798 4,741
Other developing economies 515 695 495 646 744
Least developed economies 45 40 34 49 49
By region
East Asia and the Pacific 1,590 1,859 1,570 2,052 2,470
Excluding China 372 429 369 477 573
Europe 330 406 304 363 466
Excluding Poland 192 237 171 207 279
Latin America and the Caribbean 675 861 672 856 1,055
Excluding Mexico 414 570 444 558 708
Middle East and North Africa 577 801 518 603 712
Excluding Turkey 471 672 417 492 579
South and Central Asia 232 281 240 386 530
Excluding India 87 102 72 171 243
Sub-Saharan Africa 187 235 173 233 301
Excluding South Africa 123 162 120 162 207
By income group
High income industrializing 633 797 654 784 981
Upper middle income industrializing 446 567 382 485 640
Lower middle income industrializing 2,472 3,046 2,414 3,182 3,878
Low income industrializing 40 32 28 42 35
Source: UN 2013a.
Table A7.1 Total exports, all commodities, 2007–2011 ($ billions)
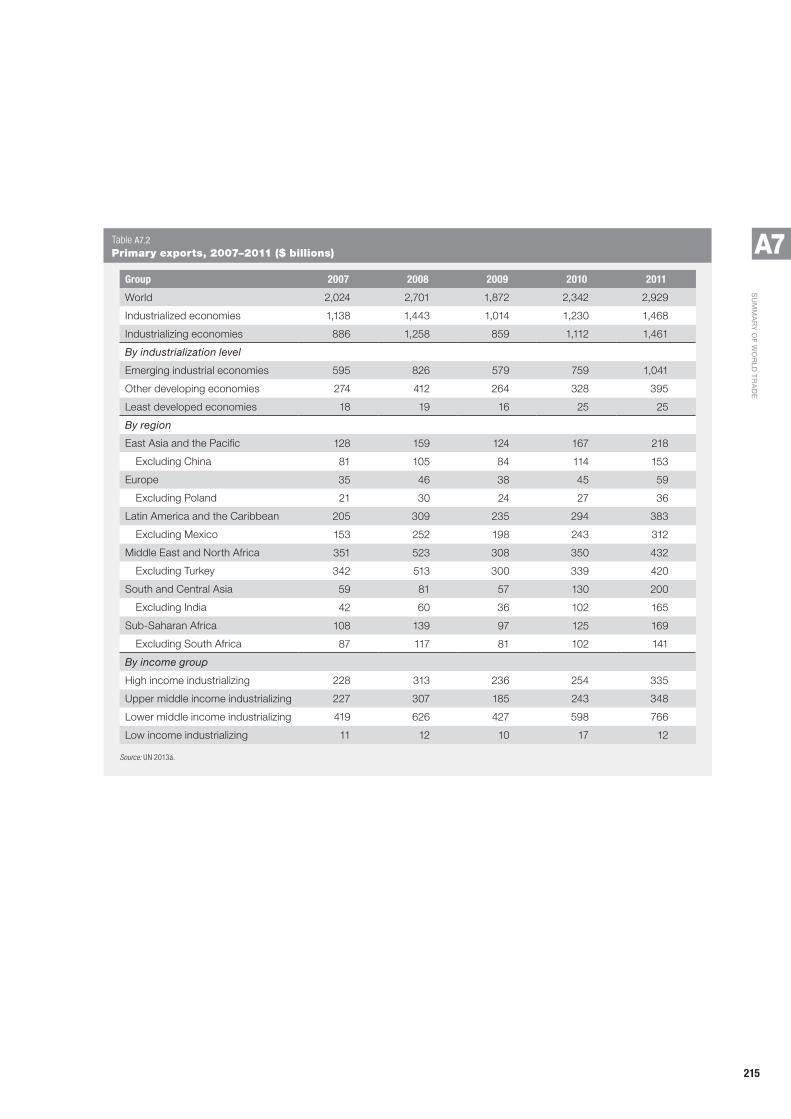
215
su
MM
ar
y o
F wo
rld
tr
ad
e
A7Group 2007 2008 2009 2010 2011
World 2,024 2,701 1,872 2,342 2,929
Industrialized economies 1,138 1,443 1,014 1,230 1,468
Industrializing economies 886 1,258 859 1,112 1,461
By industrialization level
Emerging industrial economies 595 826 579 759 1,041
Other developing economies 274 412 264 328 395
Least developed economies 18 19 16 25 25
By region
East Asia and the Pacific 128 159 124 167 218
Excluding China 81 105 84 114 153
Europe 35 46 38 45 59
Excluding Poland 21 30 24 27 36
Latin America and the Caribbean 205 309 235 294 383
Excluding Mexico 153 252 198 243 312
Middle East and North Africa 351 523 308 350 432
Excluding Turkey 342 513 300 339 420
South and Central Asia 59 81 57 130 200
Excluding India 42 60 36 102 165
Sub-Saharan Africa 108 139 97 125 169
Excluding South Africa 87 117 81 102 141
By income group
High income industrializing 228 313 236 254 335
Upper middle income industrializing 227 307 185 243 348
Lower middle income industrializing 419 626 427 598 766
Low income industrializing 11 12 10 17 12
Source: UN 2013a.
Table A7.2 Primary exports, 2007–2011 ($ billions)
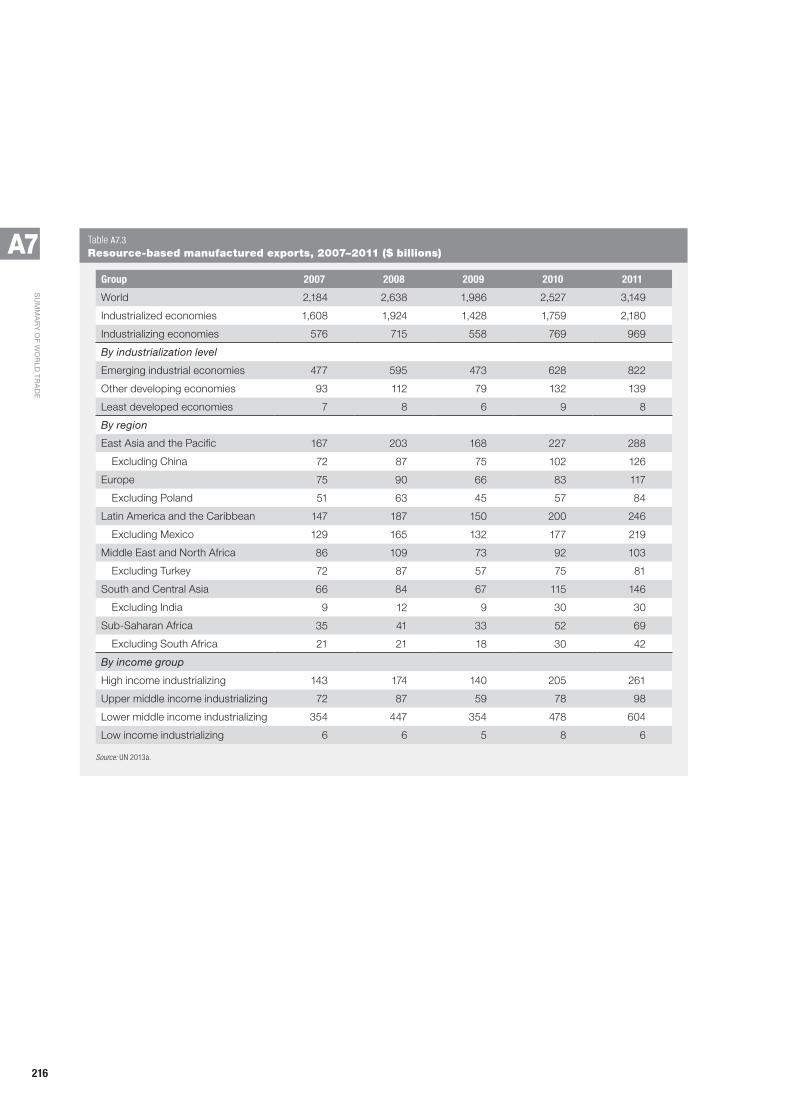
216
su
MM
ar
y o
F wo
rld
tr
ad
e
A7Group 2007 2008 2009 2010 2011
World 2,184 2,638 1,986 2,527 3,149
Industrialized economies 1,608 1,924 1,428 1,759 2,180
Industrializing economies 576 715 558 769 969
By industrialization level
Emerging industrial economies 477 595 473 628 822
Other developing economies 93 112 79 132 139
Least developed economies 7 8 6 9 8
By region
East Asia and the Pacific 167 203 168 227 288
Excluding China 72 87 75 102 126
Europe 75 90 66 83 117
Excluding Poland 51 63 45 57 84
Latin America and the Caribbean 147 187 150 200 246
Excluding Mexico 129 165 132 177 219
Middle East and North Africa 86 109 73 92 103
Excluding Turkey 72 87 57 75 81
South and Central Asia 66 84 67 115 146
Excluding India 9 12 9 30 30
Sub-Saharan Africa 35 41 33 52 69
Excluding South Africa 21 21 18 30 42
By income group
High income industrializing 143 174 140 205 261
Upper middle income industrializing 72 87 59 78 98
Lower middle income industrializing 354 447 354 478 604
Low income industrializing 6 6 5 8 6
Source: UN 2013a.
Table A7.3 Resource-based manufactured exports, 2007–2011 ($ billions)
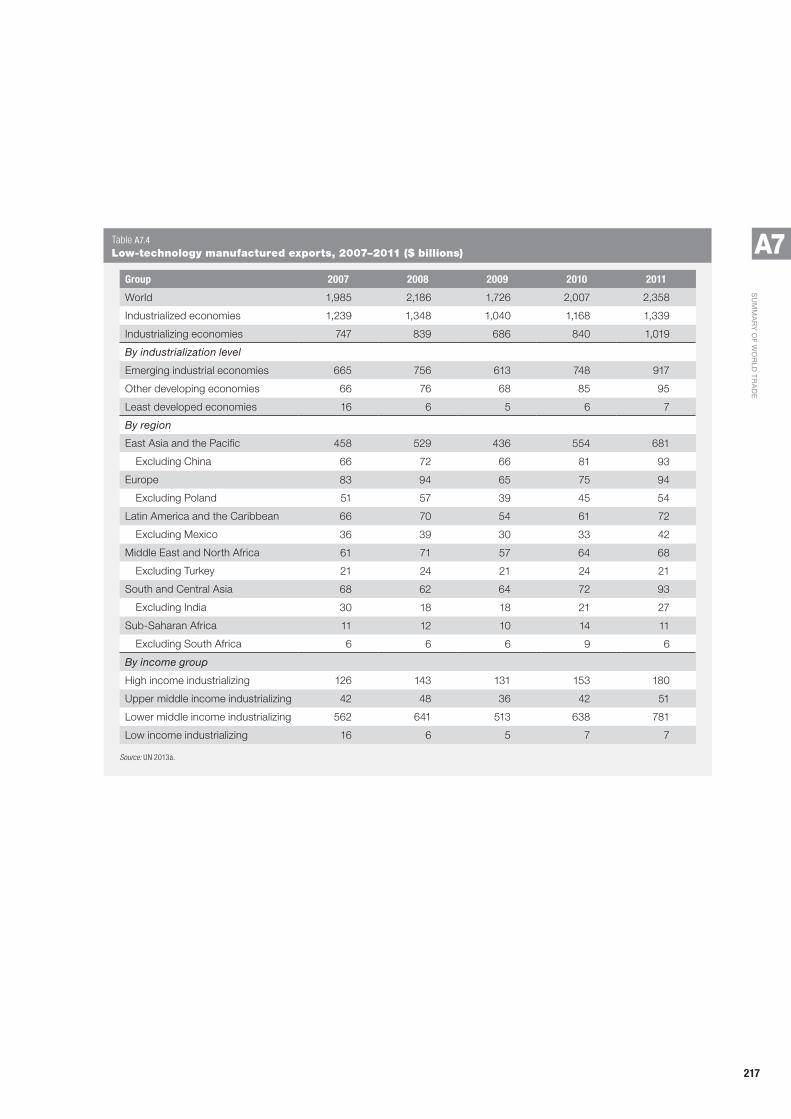
217
su
MM
ar
y o
F wo
rld
tr
ad
e
A7Group 2007 2008 2009 2010 2011
World 1,985 2,186 1,726 2,007 2,358
Industrialized economies 1,239 1,348 1,040 1,168 1,339
Industrializing economies 747 839 686 840 1,019
By industrialization level
Emerging industrial economies 665 756 613 748 917
Other developing economies 66 76 68 85 95
Least developed economies 16 6 5 6 7
By region
East Asia and the Pacific 458 529 436 554 681
Excluding China 66 72 66 81 93
Europe 83 94 65 75 94
Excluding Poland 51 57 39 45 54
Latin America and the Caribbean 66 70 54 61 72
Excluding Mexico 36 39 30 33 42
Middle East and North Africa 61 71 57 64 68
Excluding Turkey 21 24 21 24 21
South and Central Asia 68 62 64 72 93
Excluding India 30 18 18 21 27
Sub-Saharan Africa 11 12 10 14 11
Excluding South Africa 6 6 6 9 6
By income group
High income industrializing 126 143 131 153 180
Upper middle income industrializing 42 48 36 42 51
Lower middle income industrializing 562 641 513 638 781
Low income industrializing 16 6 5 7 7
Source: UN 2013a.
Table A7.4 Low-technology manufactured exports, 2007–2011 ($ billions)

218
su
MM
ar
y o
F wo
rld
tr
ad
e
A7Group 2007 2008 2009 2010 2011
World 4,267 4,730 3,564 4,374 5,103
Industrialized economies 3,446 3,738 2,783 3,345 3,868
Industrializing economies 821 992 781 1,029 1,235
By industrialization level
Emerging industrial economies 787 945 744 977 1,182
Other developing economies 33 45 36 50 51
Least developed economies 2 2 2 2 2
By region
East Asia and the Pacific 393 475 395 530 641
Excluding China 75 87 75 99 117
Europe 117 148 109 129 162
Excluding Poland 57 72 48 63 81
Latin America and the Caribbean 192 215 158 209 245
Excluding Mexico 69 84 54 69 87
Middle East and North Africa 70 85 66 83 95
Excluding Turkey 30 39 30 42 48
South and Central Asia 27 37 32 50 64
Excluding India 6 6 3 12 15
Sub-Saharan Africa 23 32 22 28 29
Excluding South Africa 3 9 6 6 6
By income group
High income industrializing 78 107 85 110 128
Upper middle income industrializing 90 106 84 102 122
Lower middle income industrializing 651 778 610 815 984
Low income industrializing 2 2 2 2 2
Source: UN 2013a.
Table A7.5 Medium-technology manufactured exports, 2007–2011 ($ billions)

219
su
MM
ar
y o
F wo
rld
tr
ad
e
A7Group 2007 2008 2009 2010 2011
World 2,424 2,565 2,240 2,649 2,858
Industrialized economies 1,897 1,971 1,703 1,970 2,096
Industrializing economies 528 594 537 679 762
By industrialization level
Emerging industrial economies 488 556 505 649 724
Other developing economies 39 37 31 30 38
Least developed economies 0 0 0 0 1
By region
East Asia and the Pacific 437 481 432 557 623
Excluding China 72 72 63 69 72
Europe 16 24 22 27 29
Excluding Poland 9 12 12 15 18
Latin America and the Caribbean 54 64 56 66 75
Excluding Mexico 18 21 15 18 24
Middle East and North Africa 7 7 7 9 8
Excluding Turkey 6 6 3 6 6
South and Central Asia 10 15 17 18 24
Excluding India 3 3 3 3 3
Sub-Saharan Africa 3 3 3 3 3
Excluding South Africa 0 0 0 0 0
By income group
High income industrializing 51 54 51 50 60
Upper middle income industrializing 12 16 15 18 19
Lower middle income industrializing 464 523 470 610 683
Low income industrializing 1 1 1 0 1
Source: UN 2013a.
Table A7.6 High-technology manufactured exports, 2007–2011 ($ billions)

220
Annex 8
Country and economy groups
Industrialized economies
East Asia and the Pacific
Australia Hong Kong SAR China Macao SAR China New Zealand
French Polynesia Japan Malaysia Singapore
Guam Korea, Rep. of New Caledonia Taiwan Province of China
Europe
Austria France Italy Netherlands Slovenia
Belgium Germany Liechtenstein Norway Spain
Czech Republic Hungary Lithuania Portugal Sweden
Denmark Iceland Luxembourg Russian Federation Switzerland
Estonia Ireland Malta Slovakia United Kingdom
Finland
Latin America and the Caribbean
Aruba British Virgin Islands French Guiana Puerto Rico US Virgin Islands
Middle East and North Africa
Bahrain Israel Kuwait Qatar United Arab Emirates
North America
Bermuda Canada Greenland United States
Industrializing economies
East Asia and the Pacific
Brunei Darussalam Indonesia Micronesia, Federated States of
Philippines Tonga
Cambodia Kiribati Mongolia Samoa Tuvalu
China Korea, Dem. People’s Rep. of
Myanmar Solomon Islands Vanuatu
Cook Islands Lao People’s Dem. Rep.
Palau Thailand Viet Nam
Fiji Marshall Islands Papua New Guinea Timor-Leste
Europe
Albania Bulgaria Latvia Montenegro Serbia
Belarus Croatia Macedonia, Former Yugoslav Rep. of
Poland Ukraine
Bosnia and Herzegovina Greece Moldova, Rep. of Romania
Table A8.1 Countries and economies by region

221
Co
un
tr
y a
nd
eC
on
oM
y G
ro
uP
s
A8Industrializing economies (continued)
Latin America and the Caribbean
Anguilla Chile Grenada Mexico St. Vincent and the Grenadines
Antigua and Barbuda Colombia Guadeloupe Montserrat Suriname
Argentina Costa Rica Guatemala Nicaragua Trinidad and Tobago
Bahamas Cuba Guyana Panama Uruguay
Barbados Dominica Haiti Paraguay Venezuela, Bol. Rep. of
Belize Dominican Republic Honduras Peru
Bolivia, Plurinational State of
Ecuador Jamaica St. Kitts and Nevis
Brazil El Salvador Martinique St. Lucia
Middle East and North Africa
Algeria Egypt Lebanon Palestinian Territories Syrian Arab Rep.
Armenia Georgia Libya Saudi Arabia Tunisia
Azerbaijan Iraq Morocco South Sudan Turkey
Cyprus Jordan Oman Sudan Yemen
South and Central Asia
Afghanistan India Kyrgyzstan Pakistan Turkmenistan
Bangladesh Iran, Islamic Rep. of Maldives Sri Lanka Uzbekistan
Bhutan Kazakhstan Nepal Tajikistan
Sub-Saharan Africa
Angola Congo, Dem. Rep. of Guinea Mozambique Somalia
Benin Congo Guinea-Bissau Namibia South Africa
Botswana Côte d’Ivoire Kenya Niger Swaziland
Burkina Faso Djibouti Lesotho Nigeria Tanzania, United Rep. of
Burundi Equatorial Guinea Liberia Rwanda Togo
Cameroon Eritrea Madagascar Réunion Uganda
Cape Verde Ethiopia Malawi São Tomé and Príncipe
Zambia
Central African Rep. Gabon Mali Senegal Zimbabwe
Chad Gambia, The Mauritania Seychelles
Comoros Ghana Mauritius Sierra Leone
Source: UNIDO elaboration based on UN Statistics Classification.
Table A8.1 (continued) Countries and economies by region

222
Co
un
tr
y a
nd
eC
on
oM
y G
ro
uP
s
A8Industrialized economies
Aruba Estonia Ireland Malta Slovenia
Australia Finland Israel Netherlands Spain
Austria France Italy New Caledonia Sweden
Bahrain French Guiana Japan New Zealand Switzerland
Belgium French Polynesia Korea, Rep. of Norway Taiwan Province of China
Bermuda Germany Kuwait Portugal United Arab Emirates
British Virgin Islands Greenland Liechtenstein Puerto Rico United Kingdom
Canada Guam Lithuania Qatar United States
Curaçao Hong Kong SAR China Luxembourg Russian Federation US Virgin Islands
Czech Republic Hungary Macao SAR China Singapore
Denmark Iceland Malaysia Slovakia
Industrializing economies
Emerging industrial economies
Argentina Colombia Kazakhstan Romania Turkey
Belarus Costa Rica Latvia Saudi Arabia Ukraine
Brazil Croatia Macedonia, Former Yugoslav Rep. of
Serbia Uruguay
Brunei Darussalam Cyprus Mauritius South Africa Venezuela, Bol. Rep. of
Bulgaria Greece Mexico Suriname
Chile India Oman Thailand
China Indonesia Poland Tunisia
Other developing economies
Albania Cook Islands Guyana Mongolia Seychelles
Algeria Côte d’Ivoire Honduras Montenegro Sri Lanka
Angola Cuba Iran, Islamic Rep. of Montserrat St. Kitts and Nevis
Anguilla Dominica Iraq Morocco St. Lucia
Antigua and Barbuda Dominican Republic Jamaica Namibia St. Vincent and the Grenadines
Armenia Ecuador Jordan Nicaragua Swaziland
Azerbaijan Egypt Kenya Nigeria Syrian Arab Rep.
Bahamas El Salvador Korea, Dem. Rep. of Pakistan Tajikistan
Barbados Equatorial Guinea Kyrgyzstan Palau Tonga
Belize Fiji Lebanon Palestinian Territories Trinidad and Tobago
Bolivia, Plurinational State of
Gabon Libya Panama Turkmenistan
Bosnia and Herzegovina Georgia Maldives Papua New Guinea Uzbekistan
Botswana Ghana Marshall Islands Paraguay Viet Nam
Cameroon Grenada Martinique Peru Zimbabwe
Cape Verde Guadeloupe Micronesia, Federated States of
Philippines
Congo Guatemala Moldova, Rep. of Réunion
Table A8.2 Countries and economies by industrialization level

223
Co
un
tr
y a
nd
eC
on
oM
y G
ro
uP
s
A8Industrializing economies (continued)
Least developed economies
Afghanistan Congo, Dem. Rep. of Lesotho Rwanda Timor-Leste
Bangladesh Djibouti Liberia Samoa Togo
Benin Eritrea Madagascar São Tomé and Príncipe
Tuvalu
Bhutan Ethiopia Malawi Senegal Uganda
Burkina Faso Gambia, The Mali Sierra Leone Vanuatu
Burundi Guinea Mauritania Solomon Islands Yemen
Cambodia Guinea-Bissau Mozambique Somalia Zambia
Central African Rep. Haiti Myanmar South Sudan
Chad Kiribati Nepal Sudan
Comoros Lao People’s Dem. Rep.
Niger Tanzania, United Rep. of
Source: UNIDO 2013d.
Table A8.2 (continued) Countries and economies by industrialization level
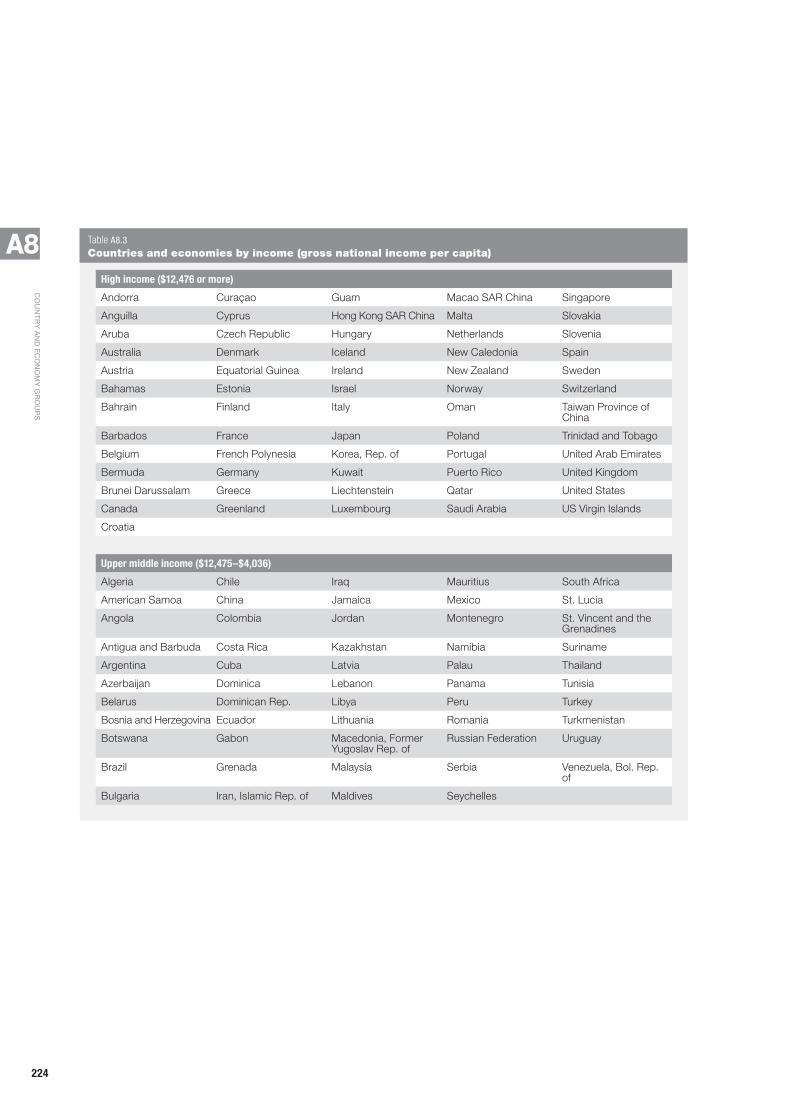
224
Co
un
tr
y a
nd
eC
on
oM
y G
ro
uP
s
A8High income ($12,476 or more)
Andorra Curaçao Guam Macao SAR China Singapore
Anguilla Cyprus Hong Kong SAR China Malta Slovakia
Aruba Czech Republic Hungary Netherlands Slovenia
Australia Denmark Iceland New Caledonia Spain
Austria Equatorial Guinea Ireland New Zealand Sweden
Bahamas Estonia Israel Norway Switzerland
Bahrain Finland Italy Oman Taiwan Province of China
Barbados France Japan Poland Trinidad and Tobago
Belgium French Polynesia Korea, Rep. of Portugal United Arab Emirates
Bermuda Germany Kuwait Puerto Rico United Kingdom
Brunei Darussalam Greece Liechtenstein Qatar United States
Canada Greenland Luxembourg Saudi Arabia US Virgin Islands
Croatia
Upper middle income ($12,475–$4,036)
Algeria Chile Iraq Mauritius South Africa
American Samoa China Jamaica Mexico St. Lucia
Angola Colombia Jordan Montenegro St. Vincent and the Grenadines
Antigua and Barbuda Costa Rica Kazakhstan Namibia Suriname
Argentina Cuba Latvia Palau Thailand
Azerbaijan Dominica Lebanon Panama Tunisia
Belarus Dominican Rep. Libya Peru Turkey
Bosnia and Herzegovina Ecuador Lithuania Romania Turkmenistan
Botswana Gabon Macedonia, Former Yugoslav Rep. of
Russian Federation Uruguay
Brazil Grenada Malaysia Serbia Venezuela, Bol. Rep. of
Bulgaria Iran, Islamic Rep. of Maldives Seychelles
Table A8.3 Countries and economies by income (gross national income per capita)

225
Co
un
tr
y a
nd
eC
on
oM
y G
ro
uP
s
A8Lower middle income ($4,035–$1,026)
Albania El Salvador Lao People’s Dem. Rep.
Papua New Guinea Syrian Arab Rep.
Armenia Fiji Lesotho Paraguay Timor-Leste
Belize Georgia Marshall Islands Philippines Tonga
Bhutan Ghana Micronesia, Federated States of
Samoa Tuvalu
Bolivia, Plurinational State of
Guatemala Moldova, Rep. of São Tomé and Príncipe
Ukraine
Cameroon Guyana Mongolia Senegal Uzbekistan
Cape Verde Honduras Morocco Solomon Islands Vanuatu
Congo India Nicaragua South Sudan Viet Nam
Côte d’Ivoire Indonesia Nigeria Sri Lanka Yemen
Djibouti Iraq Pakistan Sudan Zambia
Egypt Kiribati Palestine Swaziland
Low income ($1,025 or less)
Afghanistan Comoros Haiti Mali Sierra Leone
Bangladesh Congo, Dem. Rep. of Kenya Mauritania Somalia
Benin Eritrea Korea, Dem. Rep. of Mozambique Tajikistan
Burkina Faso Ethiopia Kyrgyzstan Myanmar Tanzania, United Rep. of
Burundi Gambia Liberia Nepal Togo
Cambodia Guinea Madagascar Niger Uganda
Central African Rep. Guinea-Bissau Malawi Rwanda Zimbabwe
Chad
Source: World Bank 2012.
Table A8.3 (continued) Countries and economies by income (gross national income per capita)
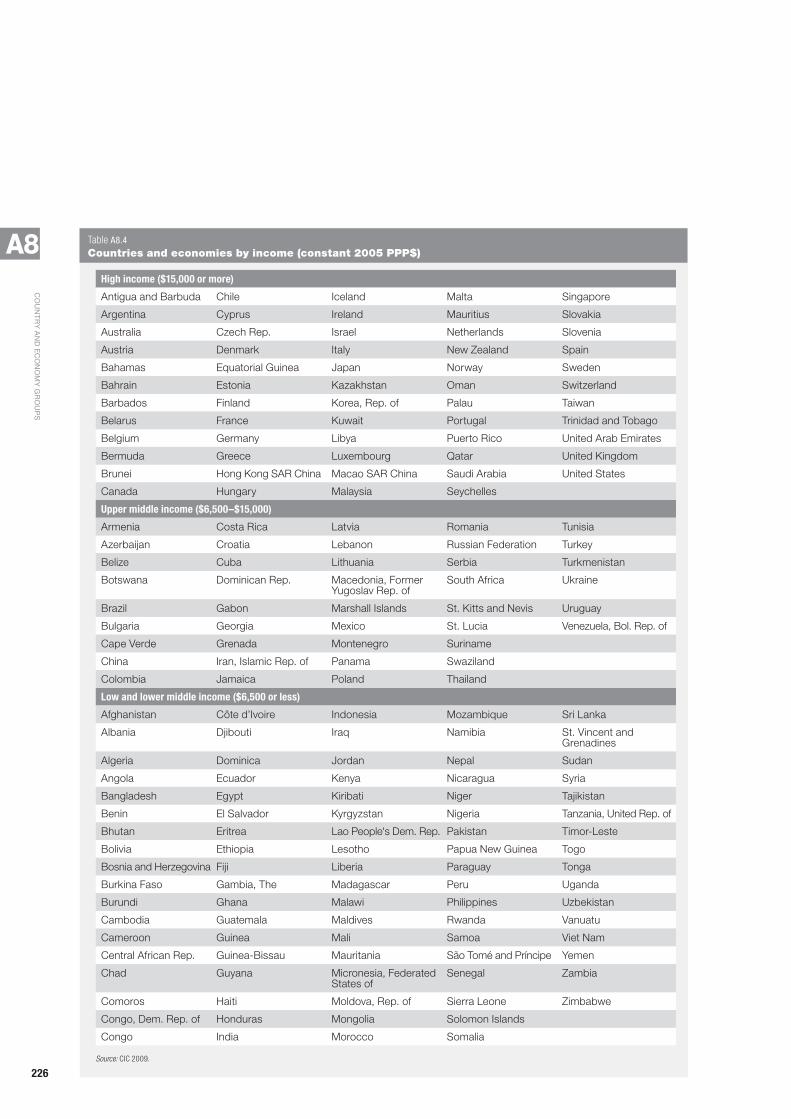
226
Co
un
tr
y a
nd
eC
on
oM
y G
ro
uP
s
A8High income ($15,000 or more)
Antigua and Barbuda Chile Iceland Malta Singapore
Argentina Cyprus Ireland Mauritius Slovakia
Australia Czech Rep. Israel Netherlands Slovenia
Austria Denmark Italy New Zealand Spain
Bahamas Equatorial Guinea Japan Norway Sweden
Bahrain Estonia Kazakhstan Oman Switzerland
Barbados Finland Korea, Rep. of Palau Taiwan
Belarus France Kuwait Portugal Trinidad and Tobago
Belgium Germany Libya Puerto Rico United Arab Emirates
Bermuda Greece Luxembourg Qatar United Kingdom
Brunei Hong Kong SAR China Macao SAR China Saudi Arabia United States
Canada Hungary Malaysia Seychelles
Upper middle income ($6,500–$15,000)
Armenia Costa Rica Latvia Romania Tunisia
Azerbaijan Croatia Lebanon Russian Federation Turkey
Belize Cuba Lithuania Serbia Turkmenistan
Botswana Dominican Rep. Macedonia, Former Yugoslav Rep. of
South Africa Ukraine
Brazil Gabon Marshall Islands St. Kitts and Nevis Uruguay
Bulgaria Georgia Mexico St. Lucia Venezuela, Bol. Rep. of
Cape Verde Grenada Montenegro Suriname
China Iran, Islamic Rep. of Panama Swaziland
Colombia Jamaica Poland Thailand
Low and lower middle income ($6,500 or less)
Afghanistan Côte d’Ivoire Indonesia Mozambique Sri Lanka
Albania Djibouti Iraq Namibia St. Vincent and Grenadines
Algeria Dominica Jordan Nepal Sudan
Angola Ecuador Kenya Nicaragua Syria
Bangladesh Egypt Kiribati Niger Tajikistan
Benin El Salvador Kyrgyzstan Nigeria Tanzania, United Rep. of
Bhutan Eritrea Lao People's Dem. Rep. Pakistan Timor-Leste
Bolivia Ethiopia Lesotho Papua New Guinea Togo
Bosnia and Herzegovina Fiji Liberia Paraguay Tonga
Burkina Faso Gambia, The Madagascar Peru Uganda
Burundi Ghana Malawi Philippines Uzbekistan
Cambodia Guatemala Maldives Rwanda Vanuatu
Cameroon Guinea Mali Samoa Viet Nam
Central African Rep. Guinea-Bissau Mauritania São Tomé and Príncipe Yemen
Chad Guyana Micronesia, Federated States of
Senegal Zambia
Comoros Haiti Moldova, Rep. of Sierra Leone Zimbabwe
Congo, Dem. Rep. of Honduras Mongolia Solomon Islands
Congo India Morocco Somalia
Source: CIC 2009.
Table A8.4 Countries and economies by income (constant 2005 PPP$)

227
Abbott, K.W., and Snidal, D., 2009. Strengthening Interna-tional Regulation through Transnational New Govern-ance: Overcoming the Orchestration Deficit. Vanderbilt Journal of Transnational Law, 42(2), pp. 501–578.
———, 2010. International Regulation without Inter-national Government: Improving IO Performance through Orchestration. The Review of International Organizations, 5(3), pp. 315–344.
Abdel-Latif, A., and Schmitz, H., 2010. Growth Alli-ances: Insights from Egypt. Business and Politics, 12(4), pp. 1–29.
Acemoglu, D., and Autor, D., 2010. Skills, Tasks and Technologies: Implications for Employment and Earn-ings. NBER Working Paper 16082. Cambridge, MA: National Bureau of Economic Research.
Acemouglu, D., and Johnson, S., 2005. Unbundling Institu-tions. Journal of Political Economy, 113(5), pp. 949–955.
Acemoglu, D., Johnson, S., and Robinson, J.A., 2005. Insti-tutions as a Fundamental Cause of Long-Run Growth. In Handbook of Economic Growth, Vol. 1A, eds. Aghion, P., and Durlauf, S.N. Amsterdam: Elsevier.
Aghion, P., Algan, Y., and Cahuc, P., 2008. Can Policy Inter-act with Culture? Minimum Wage and the Quality of Labor Relations. NBER Working Paper 14327. Cam-bridge, MA: National Bureau of Economic Research.
Aghion, P., Burgess, R., Redding, S., and Zilibotti, F., 2008. The Unequal Effects of Liberalization: Evidence from Dismantling the Licence Raj in India. American Eco-nomic Review, 98(4), pp. 1397–1412.
Aghion, P., Dewatripont, M., Du, L., Harrison, A., and Legros, P., 2012. Industrial Policy and Competition. NBER Working Paper 18048. Cambridge, MA: National Bureau of Economic Research.
Agosin, M.R., Larraín, C., and Grau, N., 2010. Industrial Policy in Chile. IDB Working Paper Series IDB-WP-170. Washington, DC: Inter-American Development Bank.
Aiyar, S., Duval, R., Puy, D., Wu, Y., and Zhang, L., 2013. Growth Slowdowns and the Middle-Income Trap. IMF Working Paper WP/13/71. Washington, DC: Interna-tional Monetary Fund.
Allee, T., and Peinhardt, C., 2011. Contingent Credibility: The Impact of Investment Treaty Violations on Foreign Direct Investment. International Organization, 65(3), pp. 401–432.
Almeida, R.K., and Aterido, R., 2011. On-the-Job Training and Rigidity of Employment Protection in the Devel-oping World: Evidence from Differential Enforcement. Labour Economics, 18(supplement 1), pp. 71–82.
Almeida, R.K., Behrman, J.R., and Robalino, D.A., 2012. The Right Skills for the Job? Rethinking Training Poli-cies for Workers. Washington, DC: World Bank. Avail-able at <https://openknowledge.worldbank.org/ handle/10986/13075>. Accessed September 2013.
Altenburg, T., 2010. Managed Latecomer Strategies vs. Political Capture: Can Developing Countries Handle Selective Business Promotion? In Effective State-Busi-ness Relations, Industrial Policy and Economic Growth: Essays, ed. te Velde, D.W. London: Overseas Develop-ment Institute.
———, 2011. Industrial Policy in Developing Countries: Overview and Lessons from Seven Country Cases. Discus-sion Paper 4/2011. Bonn, Germany: German Develop-ment Institute.
Amendolagine, V., Boly, A., Coniglio, N.D., Prota, F., and Seric, A., 2013. FDI and Local Linkages in Developing Countries: Evidence from Sub-Saharan Africa. World Development, 50(C), pp. 41–56.
Amin, A., and Awung, W., 2005. Economic Analysis of Pri-vate Returns to Investment in Education in Cameroon. Paper prepared for the Regional Conference on Edu-cation in West Africa: Constraints and Opportunities, Senegal, 25–26 November 2005.
Amiti, M., and Konings, J., 2007. Trade Liberalization, Intermediate Inputs, and Productivity: Evidence from Indonesia. The American Economic Review, 97(5), pp. 1611–1638.
Antimiani, A., Costantini, V., Martini, C. and Salvatici, L., and Tommasino, M.C., 2011. Cooperative and Non-Cooperative Solutions to Carbon Leakage. Working Paper 0136. Rome: University Roma Tre.
References

228228
re
Fe
re
nC
es
Araújo, B.C, Bogliacino, F., and Vivarelli, M., 2009. The Role of “Skill Enhancing Trade” in Brazil: Some Evidence from Microdata. IZA Discussion Paper 4213. Bonn, Ger-many: Institute for the Study of Labor.
Arauzo-Carod, J.-M., and Viladecans-Marsal, E., 2009. Industrial Location at the Intra-Metropolitan Level: The Role of Agglomeration Economies. Regional Stud-ies, 43, pp. 545–558.
Arbache, J.S., Dickerson, A., and Green, F., 2004. Trade Liberalisation and Wages in Developing Countries. Eco-nomic Journal, 114(439), pp. F73–F76.
Arrow, K.J., 1962. The Economic Implications of Learn-ing by Doing. The Review of Economic Studies, 29(3), pp. 155–173.
Aterido, R., and Hallward-Driemeier, M., 2010. The Impact of the Investment Climate on Employment Growth: Does Sub-Saharan Africa Mirror Other Low-Income Regions? Washington, DC: World Bank. Available at <https://openknowledge.worldbank.org/handle/10986/3704>. Accessed September 2013.
Aterido, R., Hallward-Driemeier, M., and Pagés, C., 2007. Investment Climate and Employment Growth: The Impact of Access to Finance, Corruption and Regulations across Firms. IZA Discussion Paper 3138. Bonn, Ger-many: Institute for the Study of Labor.
Athukorala, P.-C., 2011. Production Networks and Trade Patterns in East Asia: Regionalization or Globalization? Asian Economic Papers, 10(1), pp. 65–95.
AU (African Union), 2007. Strategy to Revitalize Techni-cal and Vocational Education and Training (TVET) in Africa. Addis Ababa.
Au, C.-C., and Henderson, J.V., 2006. Are Chinese Cities Too Small? Review of Economic Studies, 73, pp. 549–576.
Audretsch, D.B., 2002. The Dynamic Role of Small Firms: Evidence from the U.S. Small Business Economics, 18(1/3), pp. 13–40.
Autor, D.H., Levy, F., and Murnane, R.J., 2003. The Skill Content of Recent Technological Change: An Empiri-cal Exploration. Quarterly Journal of Economics, 118(4), pp. 1279–1333.
Ayyagari, M.A., Beck, T., and Demirguc-Kunt, A., 2003. Small and Medium Enterprises across the Globe: A New
Database. Policy Research Working Paper 3127. Wash-ington, DC: World Bank.
Ayyagari, M.A, Demirguc-Kunt, A., and Maksimovic, V., 2011. Small versus Young Firms across the World: Contribution to Employment, Job Creation and Growth. Policy Research Working Paper 5631. Washington, DC: World Bank.
Ayyagari, M., and Kosová, R., 2006. Does FDI Facilitate Domestic Entrepreneurship? Evidence from the Czech Republic. Working Paper 8. Washington, DC: The George Washington School of Business.
Azar, C., Holmberg, J., and Karlsson, S., 2002, Decoupling – Past Trends and Prospects for the Future. Stockholm: Environmental Advisory Council, Ministry of the Environment.
Baldwin, R., Forthcoming. Trade and Industrialization after Globalization’s Second Unbundling: How Building and Joining a Supply Chain Are Different and Why It Mat-ters. In Globalization in an Age of Crisis: Multilateral Economic Cooperation in the Twenty-First Century, eds. Feenstra, R.C., and Taylor, A.M. Chicago: University of Chicago Press.
Banco Central do Brazil, n.d. Time Series Management Sys-tem - v2.1, Public Module. Available at <www3.bcb.gov.br/sgspub>. Accessed September 2013.
Banerjee, A.V., 2007. Making Aid Work. Cambridge, MA: The MIT Press.
Banerjee, R., Cong, Y., Gielen, D., Jannuzzi, G., Maréchal, F., McKane, A.T., Rosen, M.A., van Es, D., and Worrell, E., 2012. Energy End Use – Industry. In Global Energy Assessment – Toward a Sustainable Future. Cambridge, UK: Cambridge University Press.
Banerji, A., Cunningham, W., Fiszbein, A., King, E., Patri-nos, H., Robalino, D., and Tan, J.-P., 2010. Stepping Up Skills: For More Jobs and Higher Productivity. Washing-ton, DC: World Bank.
Barro, R.J., and Lee, J.W., 2000. International Data on Edu-cational Attainment: Updates and Implications. Center for International Development. Cambridge, MA: Har-vard University.
Bartley, T., 2003. Certifying Forests and Factories: States, Social Movements, and the Rise of Private Regulation in the Apparel and Forest Products Fields. Politics & Soci-ety, 31(3), pp. 433–464.

229
re
Fe
re
nC
es
Bassanini, A., and Scarpetta, S., 2001. The Driving forces of Economic Growth: Panel Data Evidence for the OECD Countries. OECD Economic Studies, 33(2), pp. 9–56.
Beck, T., Demirguc-Kunt, A., and Levine, R., 2005. SMEs, Growth, and Poverty: Cross-Country Evidence. Journal of Economic Growth, 10(3), pp. 199–229.
Becker, S.O., Egger, P.H., and von Ehrlich, M., 2010. Going NUTS: The Effect of EU Structural Funds on Regional Performance. Journal of Public Economics, 94(9–10), pp. 578–590.
———, Forthcoming. Absorptive Capacity and the Growth Effects of Regional Transfers: A Regression Disconti-nuity Design with Heterogeneous Treatment Effects. American Economic Journal: Economic Policy.
Berg, G., and Melamed, C., 2012. Inclusive Growth and a Post-2015 Framework. London: Overseas Development Institute.
Bértola, L., and Ocampo, J.A., 2013. The Economic Develop-ment of Latin America Since Independence. Oxford, UK: Oxford University Press.
Biavaschi, C., Eichhorst, W., Giulietti, C., Kendzia, M.J., Muravyev, A., Pieters, J., Rodríguez-Planas, N., Schmidl, R., and Zimmermann, K.F., 2012. Youth Unemployment and Vocational Training. IZA Discussion Paper 6890. Bonn, Germany: Institute for the Study of Labor.
BNDES (Brazilian Development Bank). n.d. Mission, Vision and Values. Available at <www.bndes.gov.br/SiteBNDES/bndes/bndes_en/Institucional/The_BNDES/mission.html>. Accessed October 2013.
Bodewig, C., 2012. What Skills Are Employers Looking for in Vietnam’s Workforce? Washington, DC: World Bank. Available at <http://blogs.worldbank.org/eastasiapacific /what-skills-are-employers-looking-for -in-vietnam-s-workforce>. Accessed September 2013.
Bogliacino, F., Piva, M., and Vivarelli, M., 2012. R&D and Employment: An Application of the LSDVC Estimator Using European Microdata. Economics Letters, 116(1), pp. 56–59.
Boudt, K., Todorov, V., and Upadhyaya, S., 2009. Nowcasting Manufacturing Value Added for Cross-Country Compar-ison. Statistical Journal of the IAOS, 26(1–2), pp. 15–20.
Bowen, A., 2012. “Green” Growth, “Green” Jobs and Labor Markets. Washington, DC: World Bank.
Available at <https://openknowledge.worldbank.org/ handle/10986/3277>. Accessed September 2013.
Bravo-Ortega, C., and Lederman, D., 2010. Intellec-tual Property Rights, Human Capital and the Inci-dence of R&D Expenditures. Available at <https://openknowledge .worldbank.org/handle/10986/3703>. Accessed October 2013.
Bresnahan, T.F., and Trajtenberg, M., 1995. General Pur-pose Technologies “Engines of Growth”? Journal of Econometrics, 65(1), pp. 83–108.
Brooks, D.H., 2007. Industrial and Competition Policy: Con-flict or Complementarity? ADBI Research Policy Brief 24. Tokyo: Asian Development Bank Institute.
Brunello, G., and Schlotter, M., 2011. Non Cognitive Skills and Personality Traits: Labour Market Relevance and their Development in Education & Training Systems. IZA Discussion Paper 5743. Bonn, Germany: Institute for the Study of Labor.
Bruno, G.S.F., Dessy, O., Falzoni, A.M., and Helg, R., 2009. Estimating Skills in the Italian Manufacturing Sector Using the INPS Archives: An Application to the Italian Pattern of Trade. Prepared for the European Trade Study Group 2009 Annual Conference, Rome, 10–12 Sep-tember 2009.
Bureau of Economic Analysis, 2013. Regional Economic Information System (REIS). Washington, DC. Available at <www.bea.gov/regional>. Accessed September 2013.
Bustos, P., 2011. Trade Liberalization, Exports, and Tech-nology Upgrading: Evidence on the Impact of MER-COSUR on Argentinean Firms. American Economic Review, 101(1), pp. 304–340.
Büthe, T., and Milner, H.V., 2009. Bilateral investment Trea-ties and Foreign Direct Investment: A Political Analysis. In The Effects of Treaties on Foreign Direct Investment: Bilateral Investment Treaties, Double Taxation Treaties, and Investment Flows, eds. Sauvant, K.P., and Sachs, L.E. New York: Oxford University Press.
Cantore, N., 2009. International Spillovers and Learning by Doing in a Regionalized Model of Climate Change: A Post-Kyoto Analysis. In Integration and Globalization: Challenges for Developed and Developing Countries, eds. Marques, H., Soukiazis, E., and Cerqueira, P., Chelten-ham, UK: Edward Elgar Publishing.

230230
re
Fe
re
nC
es
Carson, R.T., 2010. The Environmental Kuznets Curve: Seeking Empirical Regularity and Theoretical Structure. Review of Environmental Economics and Policy, 4(1), pp. 3–23.
Cashore, B., Auld, G., and Newsom, D., 2004. Governing through Markets: Forest Certification and the Emergence of Non-State Authority. New Haven, CT: Yale Univer-sity Press.
Castaldi, C., Cimoli, M., Correa, N., and Dosi, G., 2009. Technological Learning, Policy Regimes, and Growth: Some Long-Term Patterns and Some Specificities of the ‘Globalized’ Economy. In Industrial Policy and Develop-ment: The Political Economy of Capabilities Accumula-tion, eds. Cimoli, M., Dosi, G., and Stiglitz, J. New York: Oxford University Press.
Cattaneo, O., Gereffi, G., Miroudot, S., and Taglioni, D., 2013. Joining, Upgrading and Being Competitive in Global Value Chains: A Strategic Framework. Washington, DC: World Bank. Available at <https://openknowledge .worldbank.org/handle/10986/14444>. Accessed Sep-tember 2013.
Caves, R.E., 1996. Multinational Enterprise and Economic Analysis, Second Edition. New York: Cambridge Uni-versity Press.
CEDEFOP (European Centre for the Development of Vocational Training), 2008. Skill Needs in Europe: Focus on 2020. Luxembourg: Publications Office of the Euro-pean Union.
———, 2011. The Impact of Vocational Education and Train-ing on Company Performance. Research Paper 19. Lux-embourg: Publications Office of the European Union.
———, 2012. Sectoral Perspectives on the Benefits of Voca-tional Education and Training. Research Paper 22. Luxembourg : Publications Office of the European Union.
Chang, H.-J., 2003. Kicking Away the Ladder: Infant Indus-try Promotion in Historical Perspective. Oxford Devel-opment Studies, 31(1), pp. 21–32.
———, 2006. Industrial Policy in East Asia: Lessons for Europe. EIB Papers, 11(2), pp. 106–132.
Chen, X., Cheng, L.K., Fung, K.C., Lau, L.J., Sung, Y., Yang, C., Zhu, K., Pei, J., and Tang, Z., 2012. Domestic Value Added and Employment Generated by Chinese
Exports: A Quantitative Estimation. China Economic Review, 23(4), pp. 850–864.
Chenery, H.B., and Syrquin, M., 1975. Patterns of Develop-ment, 1950–1970. New York: Oxford University Press.
Chenery, H.B., and Taylor, L., 1968. Development Patterns: Among Countries and over Time. The Review of Eco-nomics and Statistics, 50(4), pp. 391–416.
CIC (Center for International Comparisons), 2009. Penn World Table 6.3. Database. Philadelphia, PA. Available at <http://pwt.sas.upenn.edu>. Accessed September 2013.
Cimoli, M., and Katz, J., 2003. Structural Reforms, Tech-nological Gaps and Economic Development: A Latin American Perspective. Industrial and Corporate Change, 12(2), pp. 387–411.
Clark, C., 1957. The Conditions of Economic Progress. New York: Garland Publishing.
Clarke, G.R.G., 2012. Manufacturing Firms in Africa: Some Stylized Facts about Wages and Productivity. MPRA Paper 36122. Munich: Munich University Library.
Coe, D.T., and Helpman, E., 1995. International R&D Spill-overs. European Economic Review, 39(5), pp. 859–887.
Colby, S., 2012. Explaining the BNDES: What It Is, What It Does and How It Works. Rio de Janeiro: Centro Bra-sileiro de Relações Internacionais.
Conte, A., and Vivarelli, M., 2005. One or Many Knowl-edge Production Functions? Mapping Innovative Activity Using Microdata. IZA Discussion Paper 1878. Bonn, Germany: Institute for the Study of Labor.
———, 2007. Globalization and Employment: Imported Skill Biased Technological Change in Developing Countries. IZA Discussion Paper 2797. Bonn, Germany: Institute for the Study of Labor.
Coppens, D., 2009. How Much Credit for Export Credit Support under the SCM Agreement? Journal of Inter-national Economic Law, 12(1), pp. 63–113.
———, 2013. How Special Is the Special and Differential Treatment under the SCM Agreement? A Legal and Normative Analysis of WTO Subsidy Disciplines on Developing Countries. World Trade Review, 12(1), pp.79–109.
Cosbey, A., 2008. Border Carbon Adjustment. Background Paper for the Trade and Climate Change Seminar,

231
re
Fe
re
nC
es
Copenhagen, 18–20 June. Winnipeg: International Institute for Sustainable Development.
Criscuolo, C., Martin, R., Overman, H., and van Reenen, J., 2012. The Causal Effects of an Industrial Policy. NBER Working Paper 17842. Cambridge, MA: National Bureau of Economic Research.
Curtis, J.M., 2012. Intellectual Property Rights and Interna-tional Trade: An Overview. Waterloo, UK: Centre for International Governance Innovation.
Damijan, J., Kostevc, C., and Rojec, M., 2013. FDI, Struc-tural Change and Productivity Growth: Global Supply Chains at Work in Central and Eastern European Coun-tries. IRMO Occasional Paper 1/2013. Zagreb: Institute for Development and International Relations. Available at <www.irmo.hr/files/IRMO%20OP%201_2013%20sa%20ISSN.pdf>. Accessed September 2013.
Dar, A., Canagarajah, S., and Murphy, P., 2003. Training Levies: Rationale and Evidence from Evaluations. Wash-ington, DC: World Bank.
David, P.A., 1990. The Dynamo and the Computer: An His-torical Perspective on the Modern Productivity Paradox. American Economic Review, 80, pp. 355–361.
de Azevedo, T.R., and de Freitas, A.G., 2003. Direct Impacts of Certification on Working Conditions: The Case of Bra-zil. Piracicaba, Brazil: Instituto de Manejo e Certificação Florestal e Agrícola.
de Backer, K., and Sleuweagen, L., 2003. Does Foreign Direct Investment Crowd Out Domestic Entrepreneurship? Review of Industrial Organization, 22(1), pp. 67–84.
de Bakker, F.G.A., den Hond, F., King, B., and Weber, K., 2013. Social Movements, Civil Society and Corpora-tions. Organization Studies, 34(5–6), pp. 573–593.
De la Roca, J., and Puga, D., 2012. Learning by Working in Big Cities. CEPR Discussion Paper DP9423. London: Centre for Economic Policy Research. Available at <http://diegopuga.org/papers/esurban.pdf>. Accessed 30 June 2013.
Dercon, S., 2012. Is Green Growth Good for the Poor? Washington, DC: World Bank. Available at <https :// openknowledg e.worldbank .org/han-dle/10986/12082>. Accessed September 2013.
Desmet, K., and Fafchamps, M., 2005. Changes in the Spa-tial Concentration of Employment across U.S. Counties:
A Sectoral Analysis 1972–2000? Journal of Economic Geography, 5, pp. 261–284.
Desmet, K., Ghani, E., O’Connell, S., and Rossi-Hansberg, E., 2013. The Spatial Development of India. CEPR Discus-sion Paper DP9433. London: Centre for Economic Pol-icy Research. Available at <www.cepr.org/pubs/new-dps/dplist.asp?dpno=9433>. Accessed 20 May 2013.
Desmet, K. and Rossi-Hansberg, E., 2009. Spatial Growth and Industry Age. Journal of Economic Theory, 144, pp. 2477–2502.
———, 2013. Urban Accounting and Welfare. American Economic Review, 103(6), pp. 2296–2327.
———, Forthcoming. Spatial Development. American Eco-nomic Review.
DFID (Department for International Development), 2011. Engaging the Private Sector in Skills Development. Guid-ance Note: A DFID Practice Paper. London.
Dinh, H.T., Mavridis, D.A., and Nguyen, H.B., 2010. The Binding Constraint on Firms’ Growth in Developing Countries. Policy Research Working Paper 5485. Wash-ington, DC: World Bank.
Dinh, H.T., Palmade, V., Chandra, V., and Cossar, F., 2012. Light Manufacturing in Africa: Targeted Poli-cies to Enhance Private Investment and Create Jobs. Washington, DC: World Bank. Available at <https://openknowledge.worldbank.org/handle/10986/2245>. Accessed September 2013.
Dittrich, M., Giljum, S., Lutter, S., and Polzin, C., 2012. Green Economies around the World? Implications of Resource Use for Development and the Environment. Vienna: Sustainable Europe Research Institute.
Djankov, S., 2009. The Regulation of Entry: A Survey. World Bank Research Observer, 24(2), pp. 183–203. Available at <https://openknowledge.worldbank.org/handle/10986/4428>. Accessed September 2013.
Dobbs, R., Oppenheim, J., Thomson, F., Brinkman, M., and Zornes, M., 2011. Resource Revolution: Meeting the World’s Energy, Materials, Food and Water Needs. Wash-ington, DC: McKinsey Global Institute.
Dollar, D., Hallward-Dreimeier, M., and Mengistae, T., 2005. Investment Climate and Firm Performance in Developing Countries. Economic Development and Cul-tural Change, 54(1), pp. 1–31.

232232
re
Fe
re
nC
es
Dutz, M.A., Kessides, I., O’Connell, S., and Willig, R.D., 2011. Competition and Innovation-Driven Inclu-sive Growth. Washington, DC: World Bank. Avail-able at <https://openknowledge.worldbank.org/ handle/10986/3618>. Accessed September 2013.
Dutz, M.A., and Sharma, S., 2012. Green Growth, Technol-ogy and Innovation. Washington, DC: World Bank. Available at <https://openknowledge.worldbank.org/handle/10986/3252>. Accessed September 2013.
EC (European Commission), 2009. Europe 2020. A Euro-pean Strategy for Smart, Sustainable and Inclusive Growth. Communication from the Commission. Brussels.
———, 2011. Transferability of Skills across Economic Sec-tors: Role and Importance for Employment at European Level. Brussels.
———, 2013. Report from the Commission to the European Council: Trade and Investment Barriers Report 2013. Brussels.
Edquist, C., and Zabala-Iturriagagoitia, J.M., 2012. Public Procurement for Innovation as Mission-Oriented Inno-vation Policy. Research Policy, 41(10), pp. 1757–1769.
Elkins, Z., Guzman, A.T., and Simmons, B.A., 2006. Com-peting for Capital: The Diffusion of Bilateral Invest-ment Treaties, 1960-2000. International Organization, 60(4), pp. 811–846.
Enevoldsen, M.K., Ryelund, A.V., and Andersen, M.S., 2007. Decoupling of Industrial Energy Consumption and CO2 Emissions in Energy-Intensive Industries in Scandinavia. Energy Economics, 29(4), pp. 665–692.
Ernst, C., and Sánchez-Ancochea, D., 2008. Offshoring and Employment in the Developing World: The Case of Costa Rica. Employment Working Paper 4. Geneva: Interna-tional Labour Organization.
Esbenshade, J., 2004. Monitoring Sweatshops: Workers, Con-sumers, and the Global Apparel Industry. Philadelphia, PA: Temple University Press.
EU (European Union), 2012. European Report on Devel-opment 2011/2012 – Confronting Scarcity: Managing Water, Energy and Land for Inclusive and Sustainable Growth. Brussels.
Evans, P.B., 1995. Embedded Autonomy: States and Indus-trial Transformation. Princeton, NJ: Princeton Univer-sity Press.
Fagerberg, J.E., and Verspagen, B., 2002. Technology-Gaps, Innovation-Diffusion and Transformation: An Evolutionary Interpretation. Research Policy, 31(8–9), pp. 1291–1304.
Falk, M., and Jarocinska, E., 2010. Linkages between Ser-vices and Manufacturing in EU Countries. Available at <http://servicegap.org/images/Publications/rp1_falk_etal.pdf>. Accessed 17 June 2013.
Fallah, B., and Partridge, M., 2012. Geography and High-Tech Employment Growth in U.S. Counties. MPRA Paper 38294. Munich: University Library of Munich. Avail-able at <http://mpra.ub.uni-muenchen.de/38294>. Accessed 23 June 2013.
Felipe, J., Abdon, A., and Kumar, U., 2012. Tracking the Middle-Income Trap: What is it, Who is in it, and Why? Levy Economics Institute Working Paper 715. New York: Levy Economics Institute of Bard College.
Fernandez-Stark, K., Bamber, P., and Gereffi, G., 2012. Upgrading in Global Value Chains: Addressing the Skills Challenge in Developing Countries. Paris: Organisation for Economic Co-Operation and Development Publishing.
FLA (Fair Labor Association), 2012. 2011 Annual Report. Washington, DC.
Fontagné, L., and Fouré, J., 2013. Opening a Pandora’s Box: Modeling World Trade Patterns at the 2035 Horizon. Staff Working Paper ERSD 2013-09. Geneva: World Trade Organization.
Fransen, L., 2012. Corporate Social Responsibility and Global Labor Standards: Firms and Activists in the Making of Private Regulation. New York: Routledge.
Frederick, S., and Gereffi, G., 2010. The Global Apparel Value Chain, Trade and the Crisis. Challenges and Opportunities for Developing Countries. Policy Research Working Paper 5281. Washington, DC: World Bank. Available at <www-wds.worldbank.org/servlet/ WDSContentServer/WDSP/IB/2010/04/27/000158349_20100427111841/Rendered/PDF/WPS5281.pdf>. Accessed 20 May 2013.
Freeman, C., and Perez, C., 1988. Structural Crisis of Adjustment, Business Cycles and Investment Behaviour. In Technical Change and Economic Theory, eds. Dosi, G., Freeman, C., Nelson, R., and Soete, L., 38–66. London: Frances Pinter.
233
re
Fe
re
nC
es
Freund, C., 2009. The Trade Response to Global Downturns: Historical Evidence. Washington, DC: World Bank. Available at <https://openknowledge.worldbank.org/handle/10986/4208>. Accessed September 2013.
Fu, X., 2009. Foreign Direct Investment and Managerial Knowledge Spillovers through the Diffusion of Manage-ment Practices. SLPTMD Working Paper Series 035. Oxford, UK: University of Oxford.
Fukunishi, T., ed., 2012. Dynamics of the Garment Industry in Low-Income Countries: Experience of Asia and Africa. Chiba, Japan: Institute of Developing Economies–Japan External Trade Organization.
Fukunishi, T., Murayama, M., Yamagata, T., and Nishiura, A., 2006. Industrialization and Poverty Alleviation: Pro-poor Industrialization Strategies Revisited. Geneva: United Nations Industrial Development Organization.
Fukunishi, T., and Yamagata, T., 2013. Slow and Steady Wins the Race: How the Garment Industry Leads Indus-trialization in Some Developing Countries. Background paper prepared for the Industrial Development Report 2013. Vienna: United Nations Industrial Development Organization.
Gala, P., 2008. Real Exchange Rate Levels and Economic Development: Theoretical Analysis and Economet-ric Evidence. Cambridge Journal of Economics, 32(2), pp. 273–288.
Galarraga, I., Heres, D.R., and Gonzalez-Eguino, M., 2011. Price Premium for High-Efficiency Refrigerators and Calculation of Price-Elasticities for Close-Substitutes: A Methodology Using Hedonic Pricing and Demand Systems. Journal of Cleaner Production, 19(17), pp. 2075–2081.
Gangnes, B., and van Asche, A., 2010. Global Production Networks in Electronics and Intra-Asian Trade. LICOS Discussion Paper Series 257/2010. Leuven, Belgium: Katholieke Universiteit Leuven.
Gereffi, G., and Fernandez-Stark, K., 2011. Global Value Chain Analysis: A Primer, Centre of Globalization, Governance and Competitiveness. Durham, NC: Duke University, Center on Globalization, Governance & Competitiveness.
Gereffi, G., Garcia-Johnson, R., and Sasser, E., 2001. The NGO–Industrial Complex. Foreign Policy. Available
at <www.foreignpolicy.com/articles/2001/07/01/the_ngo_industrial_complex?wp_login_redirect=0>. Accessed September 2013.
Gereffi, G., and Memedovic, O., 2009. The Global Apparel Value Chain: What Prospects for Upgrading by Develop-ing Countries. Sectoral Studies Series. Vienna: United Nations Industrial Development Organization.
Gerlagh, R., and Kuik, O., 2007. Carbon Leakage with Inter-national Technology Spillovers. Working Paper 2007.33. Milan: Fondazione Eni Enrico Mattei.
Gerschenkron, A., 1962. Economic Backwardness in His-torical Perspective. Cambridge, MA: Harvard University Press.
Gertler, P.J., Martinez, S., Premand, P., Rawlings, L.B., and Vermeersch, C.M.J., 2011. Impact Evaluation in Practice. Washington, DC: World Bank. Available at <https://openknowledge.worldbank.org/handle/10986/2550>. Accessed September 2013.
Groningen Growth and Development Centre, 2013. 10-Sec-tor Database. Available at <www.rug.nl/research/ggdc/data/10-sector-database>. Accessed June 2013.
Gibson, B., 2013. Informality in Manufacturing and the Economy. Background paper prepared for the Indus-trial Development Report 2013. Vienna: United Nations Industrial Development Organization.
Gibson, N.A., 2007. The Informal Sector in Kenya. Report prepared for a presentation at the Youth Micro Finance Forum, University of Nairobi, 12 October 2007.
GIP (Green Industry Platform), 2013. Introducing the Green Energy Platform. Available at <www.greenindustry platform.org/>. Accessed September 2013.
Glaeser, E.L., Kolko, J., and Saiz, A., 2001. Consumer City. Journal of Economic Geography, 1, pp. 27–50.
Glaeser, E.L., and Mare, D.C., 2001. Cities and Skills. Jour-nal of Labor Economics, 19, pp. 316–342.
Grossman, G.M., and Helpman, E., 1991. Trade, Knowl-edge Spillovers and Growth. European Economic Review, 35(2–3), pp. 517–526.
Grossmann, G.M., and Rossi-Hansberg, E., 2008. Trading Tasks: A Simple Theory of Offshoring. American Eco-nomic Association, 98(5), pp. 1978–1997.
Günther, T., and Alcorta, L., 2011. Industrial Policy for Pros-perity: Reasoning and Approach. Working Paper 02/11

234234
re
Fe
re
nC
es
Vol. 2-2011. Vienna: United Nations Industrial Devel-opment Organization.
Haftel, Y.Z., 2010. Ratification Counts: U.S. Investment Treaties and FDI Flows into Developing Countries. Review of International Political Economy, 17(2), pp. 348–377.
Haggard, S., 1990. Pathways from the Periphery: The Politics of Growth in the Newly Industrializing Countries. Ithaca, NY: Cornell University Press.
Haltiwanger, J., Jarmin, R.S., and Miranda, J., 2010. Who Creates Jobs? Small vs. Large vs. Young. NBER Working Paper 16300. Cambridge, MA: National Bureau of Eco-nomic Research.
Hanson, G.H., 2012. The Rise of Middle Kingdoms: Emerg-ing Economies in Global Trade. Journal of Economic Per-spectives, 26(2), pp. 41–64.
Haraguchi, N., 2012. Unravelling Manufacturing Develop-ment: The Role of Comparative Advantage, Productivity Growth and Country-specific Conditions. Development Policy and Strategic Research Branch Working Paper 16/2011. Vienna: United Nations Industrial Develop-ment Organization.
Haraguchi, N., and Rezonja, G., 2011. Emerging Patterns of Manufacturing Structural Change. Development Policy and Strategic Research Branch Working Paper 04/2010. Vienna: United Nations Industrial Develop-ment Organization.
Hargroves, K., and Smith, M., 2005. The Natural Advantage of Nations: Business Opportunities, Innovation and Gov-ernance in the 21st Century. The Natural Edge Project. London: Earthscan.
Harrison, A., and Rodríguez-Clare, A., 2010. Trade, Foreign Investment, and Industrial Policy for Developing Coun-tries. In Handbook of Development Economics, Vol. 5, eds. Rodrik, D., and Rosenzweig, M. Amsterdam: Elsevier.
Hausmann, R., Hwang, J., and Rodrik, D., 2006. What You Export Matters. Journal of Economic Growth, 12(1), pp. 1–25.
Hausmann, R., and Rodrik, D., 2003. Economic Develop-ment as Self-Discovery. Journal of Development Econom-ics, 72(2), pp. 603–633.
———, 2006. Doomed to Choose: Industrial Policy as Predic-ament. Prepared for the Blue Sky seminar organized by
the Center for International Development at Harvard University. Cambridge, MA: Harvard University.
Helpman, E., Melitz, M.J., and Yeaple, S.R., 2003. Export versus FDI. NBER Working Paper 9439. Cambridge, MA: National Bureau of Economic Research.
Herrendorf, B., Rogerson, R., and Valentinyi, A., 2013. Growth and Structural Transformation. In Handbook of Economic Growth, eds. Aghion, P., and Durlauf, S.N. Amsterdam: Elsevier.
Hinterberger, F., Giljum, S., Omann, I., Polsterer, N., Stocker, A., Burrell, L., Campregher, C., Fuchs, D., and Hartwig, F., 2013. Green Growth: From Labour to Resource Productivity – Best Practice Examples, Initia-tives and Policy Options. Vienna: United Nations Indus-trial Development Organization.
Hobijn, B., and Jovanovic, B., 2001. The Information-Tech-nology Revolution and the Stock Market: Evidence. American Economic Review, 91, pp. 1203–1220.
Hoffmann, W.G., 1958. The Growth of Industrial Economies. Manchester, UK: University of Manchester.
Holdren, J.P., 2007. Linking Climate Policy with Develop-ment Strategy in Brazil, China, and India. Final Report to The William and Flora Hewlett Foundation from The Woods Hole Research Center. Falmouth, MA: The Woods Hole Research Center.
Huber, J., 2000. Towards Industrial Ecology: Sustainable Development as a Concept of Ecological Moderniza-tion. Journal of Environmental Policy and Planning, 2(4), pp. 269–285.
Humphrey, J., and Schmitz, H., 2001. Governance in Global Value Chains. IDS Bulletin 32.3. Brighton, UK: Insti-tute of Development Studies.
IDE-JETRO (Institute of Developing Economies–Japanese External Trade Organization) and WTO (World Trade Organization), 2011. Trade patterns and global value chains in East Asia: From trade in goods to trade in tasks. Geneva: WTO. Available at <www.wto.org/english/res_e/booksp_e/stat_tradepat_globvalchains_e.pdf>. Accessed 12 June 2013.
IEA (International Energy Agency), 2013. World Energy Statistics and Balances. Paris: OECD/IEA.
IFC (International Finance Corporation), 2013. IFC Jobs Study: Assessing Private Sector Contributions to Job

235
re
Fe
re
nC
es
Creation and Poverty Reduction – Summary. Washing-ton, DC.
Ilinitch, A.Y., and Schaltegger, S.C., 1995. Developing a Green Business Portfolio. Long Range Planning, 28(2), pp. 29–38.
ILO (International Labour Organization), 2008. Skills for Improved Productivity, Employment Growth and Devel-opment. Report V. International Labour Conference, 97th Session, Geneva.
———, 2011a. LABORSTA Database. Available at <http://laborsta.ilo.org>. Accessed September 2013.
———, 2011b. Global Wage Report 2010/2011: Wage Poli-cies in Times of Crisis. Geneva.
———, 2012. Growth, Structural Change and Employment – Concept Note for the Global Consultation: Building the Post-15 Development Agenda. Available at <www.ilo.org/global/meetings-and-events/events/WCMS_184041/lang--en/index.htm>. Accessed September 2013.
———, 2013. ILOSTAT Database. Available at <www.ilo.org/ilostat>. Accessed September 2013.
Imbs, J.M., and Wacziarg, R., 2003. Stages of Diversifica-tion. American Economic Review, 93(1), pp. 63–86.
IMF (International Monetary Fund), OECD (Organiza-tion for Economic Co-operation and Development), UN (United Nations) and World Bank, 2011. Support-ing the Development of More Effective Tax Systems: A Report to the G-20 Development Working Group by the IMF, OECD, UN and World Bank. Washington, DC: IMF.
Inglehart, R., 1977. The Silent Revolution: Changing Values and Political Styles among Western Publics. Princeton, NJ: Princeton University Press.
Jäger, J., 2008. Our Planet. How Much More Can Earth Take? London: Haus Publishing.
James, S., 2009. Incentives and Investments: Evidence and Policy Implications. Washington, DC: World Bank.
Jaumette, F., and Tytell, I., 2007. How Has the Globalization of Labor Affected the Labor Income Share in Advanced Countries? IMF Working Paper 298. Washington, DC: International Monetary Fund.
Jin, B., García, F., and Salomon, R., 2013. Do Host Countries Really Benefit from Inward Foreign Direct Investment? In Perspectives on Topical Foreign Direct Investment
Issues by the Vale Columbia Center on Sustainable Inter-national Investment, eds. Sauvant, K.P., and Reimer, J. Columbia FDI Perspectives, 98(1). Available at <www.vcc.columbia.edu/content/do-host-countries-really -benefit-inward-foreign-direct-investment>. Accessed September 2013.
Johanson, R.K., 2009. A Review of National Training Funds. SP Discussion Paper 0922. Washington, DC: World Bank.
Jones, P., 2001. Are Educated Workers Really More Pro-ductive? Journal of Development Economics, 64(1), pp. 57–79.
Kaplinsky, R., 1993. Export Processing Zones in the Domin-ican Republic: Transforming Manufactures into Com-modities. World Development, 21(11), pp. 1851–1865.
———, 2005. Globalization, Poverty and Inequality: Between a Rock and a Hard Place. Cambridge, MA: Pol-ity Press.
Kaplinsky, R., and Farooki, M., 2010. What Are the Impli-cations for Global Value Chains When the Market Shifts from the North to the South? Policy Research Working Paper 5205. Washington, DC: World Bank.
Karapinar, B., 2011. Export Restrictions and the WTO Law: How to Reform the “Regulatory Deficiency”. Jour-nal of World Trade, 45(6), pp. 1139–1155.
Kattel, R., and Lember, V., 2010. Public Procurement as an Industrial Policy Tool: An Option for Develop-ing Countries? Journal of Public Procurement, 10(3), pp. 368–404.
Katz, J., 2000. Structural Change and Labor Productivity Growth in Latin American Manufacturing Industries 1970–96. World Development, 28(9), pp. 1583–1596.
Keck, M.E., and Sikkink, K., 1998. Activists Beyond Borders: Advocacy Networks in International Politics. Ithaca, NY: Cornell University Press.
Keesing, D.B., and Sherk, D.R., 1971. Population Density in Patterns of Trade and Development. American Economic Review, 61(5), pp. 956–961.
Kharas, H., 2010. The Emerging Middle Class in Developing Countries. Working Paper 285. Paris: OECD Develop-ment Centre.
Kinoshita, I., 2011. Sectoral Composition of Foreign Direct Investments and External Vulnerability in Eastern

236236
re
Fe
re
nC
es
Europe. IMF Working Paper 11/123. Washington, DC: International Monetary Fund.
Klapper, L., and Love, I., 2010. The Impact of Business Envi-ronment Reforms on New Registration. Washington, DC: World Bank. Available at <https://openknowledge .worldbank.org/handle/10986/3926>. Accessed Sep-tember 2013.
Kline, P.M., and Moretti, E., 2012. Local Economic Develop-ment, Agglomeration Economies, and the Big Push: 100 Years of Evidence from the Tennessee Valley Authority. NBER Working Paper Series 19293. Cambridge, MA: National Bureau of Economic Research.
Koopman, R., Wang, Z., and Wei, S.-J., 2008. How Much of Chinese Exports Is Really Made in China? Assessing Domestic Value-Added When Processing Trade Is Perva-sive. NBER Working Paper 14109. Cambridge, MA: National Bureau of Economic Research.
Krause, M., and Kaufmann, F., 2012. Industrial Policy in Mozambique. Discussion Paper 10/2011. Bonn, Ger-many: German Development Institute.
Kuruvilla, S., and Chua, R., 2000. How Do Nations Increase Workforce Skills? Factors Influencing the Success of the Singapore Skills Development System. Global Business Review, 1(1), pp. 11–47.
Kuznets, S., 1966. Modern Economic Growth: Rate, Struc-ture, and Spread. New Haven, CT: Yale University Press.
Lai, M.-C., and Yap, S.-F., 2004. Technology Development in Malaysia and the Newly Industrializing Economies: A Comparative Analysis. Asia-Pacific Development Jour-nal, 11(2), pp. 53–80.
Lall, S., 2000. The Technological Structure and Performance of Developing Country Manufactured Exports, 1985–98. QEH Working Paper Series 44. Oxford, UK: Oxford Department of International Development, University of Oxford.
———, 2001. Competitiveness, Technology and Skills. North-ampton, MA: Edward Elgar Publishing.
———, 2004a. Reinventing Industrial Strategy: The Role of Government Policy in Building Industrial Competitive-ness. G24 Discussion Paper Series 28. Geneva: United Nations Conference on Trade and Development.
———, 2004b. Stimulating Industrial Competitiveness in Sub-Saharan Africa: Lessons from East Asia on the Role of
FDI and Technology Acquisition. Prepared for NEPAD/TICAD Conference on Asia-Africa Trade and Invest-ment, Tokyo, 1–2 November 2004.
Lavopa, A., and Szirmai, A., 2012. Industrialization, Employment and Poverty, UNU-MERIT Working Paper Series 2012-081. Maastricht, The Netherlands: United Nations University, Maastricht Economic and Social Research Institute on Innovation and Technology.
Law, S.S., 2007. Vocational Technical Education and Eco-nomic Development: The Singapore Experience. Singa-pore: Singapore Institute of Technical Education.
Lee, K., 2013. Schumpeterian Analysis of Economic Catch-up: Knowledge, Path-creation and the Middle-income Trap. Cambridge, UK: Cambridge University Press.
Lema, R., Berger, A., and Schmitz, H., 2012. China’s Impact on the Global Wind Power Industry. Report Discussion Paper 16/2012. Bonn, Germany: German Development Institute.
Lesser, W., 1998. Intellectual Property Rights and Concen-tration in Agricultural Biotechnology. AgBioForum, 1(2), pp. 56–61.
Levitsky, J., 1997. Credit Guarantee Schemes for SMEs – an International Review. Small Enterprise Development, 8(2), pp. 4–17.
Lin, J.Y., 2011. From Flying Geese to Leading Dragons: New Opportunities and Strategies for Structural Transforma-tion in Developing Countries. WIDER Annual Lecture 15. Helsinki: United Nations University–World Insti-tute for Development Economic Research.
———, 2012. New Structural Economics: A Framework for Rethinking Development and Policy. Washington, DC: World Bank. Available at <https://openknowledge.worldbank.org/handle/10986/2232>. Accessed Sep-tember 2013.
Lin, J.Y., and Chang, H.-J., 2009. Should Industrial Policy in Developing Countries Conform to Comparative Advantage or Defy it? A Debate between Justin Lin and Ha-Joon Chang. Development Policy Review, 27(5), pp. 483–502.
Locke, R., 2013. The Promise & Limits of Private Power. Promoting Labor Standards in a Global Economy. Cam-bridge, UK: Cambridge University Press.
237
re
Fe
re
nC
es
Machin, S., and van Reenen, J., 1998. Technology and Changes in Skill Structure: Evidence from Seven OECD Countries. The Quarterly Journal of Economics, 113(4), pp. 1215–1244.
Maddison, A., 2007. Contours of the World Economy, 1–2030 AD: Essays in Macro-Economic History. Oxford, UK: Oxford University Press.
Manyika, J., Sinclair, J., Dobbs, R., Strube, G., Rassey, L., Mischke, J., Remes, J., Roxburgh, C., George, K., O’Halloran, D., and Ramaswamy, S., 2012. Manufactur-ing the Future: The Next Era of Global Growth and Inno-vation. New York: McKinsey Global Institute.
Marshall, A., 1920. Principles of Economics, 8th Edition. London: McMillan and Company.
Martin, S., and Scott, J.T., 2000. The Nature of Innovation Market Failure and the Design of Public Support for Pri-vate Innovation. Research Policy, 29(4–5), pp. 437–447.
Marx, A., 2011. Global Governance and the Certification Revolution: Types, Trends and Challenges. In Hand-book on the Politics of Regulation, ed. Levi-Faur, D. Chel-tenham, UK: Edward Elgar Publishing.
Marx, A., Bécault, E., and Wouters, J., 2012. Private Standards in Forestry: Assessing the Legitimacy and Effectiveness of the Forest Stewardship Council. In Private Standards and Global Governance: Economic, Legal and Political Perspec-tives, eds. Marx, A., Maertens, M., Swinnen, J., and Wout-ers, J. Cheltenham, UK: Edward Elgar Publishing.
Matthews, R.C.O., Feinstein, C.H., and Odling-Smee, J.C., 1982. British Economic Growth 1856–1973: The Post-war Period in Historical Perspective. Oxford, UK: Oxford University Press.
Mattli, W., and Woods, N., eds., 2009. The Politics of Global Regulation. Princeton, NJ: Princeton University Press.
Mattlin, M., 2009. Chinese Strategic State-Owned Enterprises and Ownership Control. Asia Papers 4(6). Brussels: Brus-sels Institute of Contemporary China Studies.
May, C.Y., 2012. Malaysia: Economic Transformation Advances Oil Palm Industry. September 2012. Avail-able at <www.aocs.org/Membership/FreeCover.cfm ?itemnumber=18340>. Accessed October 2013.
Mayer, E., 1992. Key Competencies. Report of the Commit-tee to Advise the AEC and MOVEET on Employment- Related Key Competencies for Post-Compulsory Education
and Training. Canberra: Australian Government Pub-lishing Service.
Mayer, J., 2011. Structural Change, Global Imbalances, and Employment in the Least Developed Countries. Policy Brief Number 1. Geneva: International Centre for Trade and Sustainable Development.
McCombie, J., and Thirlwall, T., eds., 2004. Essays on Bal-ance of Payments Constrained Growth: Theory and Evi-dence. London: Routledge.
McKibbin, W.J., and Wilcoxen, P.J., 2009. The Economic and Environmental Effects of Border Tax Adjustments for Climate Policy. In Climate Change, Trade and Com-petitiveness: Is a Collision Inevitable? eds. Brainerd, L., and Sorkin, I. Washington, DC: The Brookings Institute.
McMillan, M., and Rodrik, D., 2011. Globalization, Struc-tural Change and Productivity Growth. In Making Glo-balization Socially Sustainable, eds. Bacchetta, M., and Jansen, M. Geneva: International Labour Office and World Trade Organization.
Meléndez, M., and Perry, G., 2010. Industrial Policies in Colombia. IDB Working Paper Series IDB-WB-126. Washington, DC: Inter-American Development Bank.
Melo, A., 2001. Industrial Policy in Latin America and the Caribbean at the Turn of the Century. IDB Working Paper Series IDB-WB-459. Washington, DC: Inter-American Development Bank.
MIT (Ministry of Industry and Trade of the United Repub-lic of Tanzania), POPC (President’s Office Planning Commission of the United Republic of Tanzania), and UNIDO (United Nations Industrial Development Organization), 2012. Tanzania Industrial Competitive-ness Report 2012. Dar es Salaam.
Moose, I.A., 2002. Foreign Direct Investment: Theory, Evi-dence and Practice. New York: Palgrave McMillan.
Morgenstern, R.D., Pizer, W.A., and Shih, J.-S., 2002. Jobs Versus the Environment: An Industry-Level Perspective. Journal of Environmental Economics and Management, 43(3), pp. 412–436.
Morriss, A.P., Bogart, W.T., Dorchak, A., and Meiners, R.E., 2009a. 7 Myths About Green Jobs. U Illinois Law and Economics Research Paper LE09-007. Chicago: Uni-versity of Illinois.
238238
re
Fe
re
nC
es
———, 2009b. Green Jobs Myths. U Illinois Law & Econom-ics Research Paper LE09-001. Chicago: University of Illinois.
Mosley, L., 2011. Labor Rights and Multinational Produc-tion. Cambridge, UK: Cambridge University Press.
Mouheli, R., and Ghazali, M., 2012. Impact of Trade Reforms in Tunisia on the Elasticity of Labor Demand. Corrup-tion and Economic Development, ERF 18th Annual Conference, Cairo, 25–27 March 2012.
Murnane, R.J., and Levy, F., 1996. Teaching the New Basic Skills: Principles for Educating Children to Thrive in a Changing Economy. New York: The Free Press.
Naudé, W., 2010. Industrial Policy: Old and New Issues. WIDER Working Paper 2010/106. Helsinki: United Nations University–World Institute for Development Economics Research.
Neumayer, E., and Spess, L., 2005. Do Bilateral Invest-ment Treaties Increase Foreign Direct Investment to Developing Countries? World Development, 33(10), pp. 1567–1585.
Nübler, I., 2013a. Productive Transformation and Qual-ity of Jobs – a Sectoral and Technological Analysis. A Background paper prepared for the Industrial Develop-ment Report 2013. Vienna: United Nations Industrial Organization.
———, 2013b. A Dynamic Framework of Productive Transformation: Social Capabilities Defining Options for Structural and Technological Change. A Back-ground paper prepared for the Industrial Develop-ment Report 2013. Vienna: United Nations Industrial Organization.
———, 2013c. Education structures and patterns of pro-ductive transformation. Paper presented at the UNU WIDER Conference on L2C – Learning to Compete: Industrial Development and Policy in Africa, Helsinki, 24–25 June 2013.
Nunn, N., and Trefler, D., 2010. The Structure of Tariffs and Long-Term Growth. American Economic Journal: Mac-roeconomics, 2(4), pp. 158–194.
Ocampo, J.A, 2005. The Quest for Dynamic Efficiency: Structural Dynamics and Economic Growth in Devel-oping Countries. In Beyond Reforms: Structural Dynam-ics and Macroeconomic Vulnerability, ed. Ocampo, J.A.
Santiago: Economic Commission for Latin America and the Caribbean and Stanford University Press.
———, 2011. The Transition to a Green Economy: Benefits, Challenges and Risks from a Sustainable Development Perspective. Summary of Background Papers. In Report by a Panel of Experts to Second Preparatory Committee Meeting for United Nations Conference on Sustainable Development, New York: United Nations Department of Economics and Social Affairs.
Ocampo, J.A., and Taylor, L., 1998. Trade Liberalisation in Developing Economies: Modest Benefits but Prob-lems with Productivity Growth, Macro Prices, and Income Distribution. The Economic Journal, 108(450), pp. 1523–1546.
Ocampo, J.A., and Vos, R., 2008. Structural Change and Economic Growth. In Uneven Economic Development, eds. Ocampo, J.A., and Vos, R. London: Zed Books.
OECD (Organisation for Economic Co-operation and Development), 1998. The Multilateral Agreement on Investment. Draft Consolidated Text. Negotiating Group on the Multilateral Agreement on Investment (MAI). Paris: OECD Publishing.
———, 1999. Employment Outlook 1999. Paris: OECD Publishing.
———, 2002. Sustainable Development: Indicators to Meas-ure Decoupling of Environmental Pressure from Economic Growth. Paris: OECD Publishing.
———, 2005. Science, Technology and Industry Scoreboard. Paris: OECD Publishing.
———, 2011. OECD Green Growth Studies: Energy. Paris: OECD Publishing.
———, 2013. Education at a Glance 2013: OECD Indica-tors. Paris: OECD Publishing. Available at <http://dx.doi.org/10.1787/eag-2013-en>. Accessed Septem-ber 2013.
Ohno, K., 2009. The Middle Income Trap: Implications for Industrialization Strategies in East Asia and Africa. Tokyo: GRIPS Development Forum.
Olukoshi, A.O., 2004. Democratisation, Globalisation and Effective Policy Making in Africa. In The Politics of Trade and Industrial Policy in Africa: Forced Consensus?, eds. Soludo, C.C., Ogbu, M.O., and Chang, H.-J. Trenton, NJ: Africa World Press.

239
re
Fe
re
nC
es
O’Mahony, M., and Timmer, M.P., 2009. Output, Input and Productivity Measures at the Industry Level: The EU KLEMS Database. The Economic Journal, 119(538), pp. F374–F403.
O’Rourke, D., 2000. Monitoring the Monitors: A Critique of PricewaterhouseCoopers (PwC) Labor Monitoring. Cam-bridge, MA: Massachusetts Institute of Technology.
———, 2003. Outsourcing Regulation: Analyzing Nongov-ernmental Systems of Labor Standards and Monitoring. The Policy Studies Journal, 31(1), pp. 1–29.
———, 2012. Shopping for Good. Cambridge, MA: The MIT Press.
Ottaviano, G.I.P., and de Sousa, F.L., 2007. The Effects of BNDES Loans on the Productivity of Brazilian Manu-facturing Firms. Prepared within the United Nations Development Programme Project BRA/04/052, Paper 122402.
Pack, H., and Saggi, K., 2006. Is There a Case for Indus-trial Policy? A Critical Survey. World Bank Research Observer, 21(2), pp. 267–297.
Palma, G., 2005. Four Sources of De-industrialization and a New Concept of the Dutch Disease. In Beyond Reforms: Structural Dynamics and Macroeconomic Vulnerability, ed. Ocampo, J.A. Palo Alto, CA, and Washington, DC: Stanford University Press and World Bank.
Panayotou, T., 2000. Economic Growth and the Environ-ment. CID Working Paper 56. Cambridge, MA: Centre for International Development, Harvard University.
Papageorgiou, C., and Spatafora, N., 2012. Economic Diver-sification in LICs: Stylized Facts and Macroeconomic Implications. IMF Staff Discussion Note SDN/12/13. Washington, DC: International Monetary Fund.
Pasinetti, L.L., 1983. Structural Change and Economic Growth: A Theoretical Essay on the Dynamics of the Wealth of Nations. New York: Cambridge University Press.
Peres, W., and Primi, A., 2009. Theory and Practice of Indus-trial Policy. Evidence from the Latin American Experi-ence. Desarrollo Productivo Serie 187. Santiago: United Nations Economic Commission for Latin America and the Caribbean.
Peters, G.P., 2008. From Production-Based to Consump-tion-Based National Emission Inventories. Ecological Economics, 65(1), pp. 13–23.
Pieper, U., 1998. Openness and Structural Dynamics of Productivity and Employment in Developing Coun-tries: A Case of De-Industrialization? Employment and Training Papers 14. Geneva: International Labour Organization.
Pilat, D., Cimper, A., Olsen, K., and Webb, C., 2006. The Changing Nature of Manufacturing in OECD Econo-mies. Science, Technology and Industry Working Paper 2006/9. Paris: Organisation for Economic Co-Opera-tion and Development Publishing.
Pinaud, N., 2007. Public-Private Dialogue in Developing Countries: Opportunities and Risks. Development Cen-tre Studies. Paris: Organisation for Economic Co-Oper-ation and Development Publishing.
Pol, E., and Carroll, P., 2006. An Introduction to Economics with Emphasis on Innovation. Wollongong, UK: Inno-vation Planet.
Pollin, R., 2009. Response to “Seven Myths about Green Jobs” and “ Green Jobs Myths”. Working Paper Series 198. Amherst, MA: Political Economy Research Institute, University of Massachusetts Amherst.
Possas, M.L., and Borges, H., 2009. Competition Policy and Industrial Development. In Industrial Policy and Devel-opment: The Political Economy of Capabilities Accumula-tion, eds. Cimoli, M., Dosi, G., and Stiglitz, J.E. Oxford, UK: Oxford University Press.
Prahalad, C.K., and Hamel, G., 1990. The Core Compe-tence of the Corporation. Harvard Business Review, May–June 1990.
Psacharopoulos, G., and Patrinos, H.A., 2004a. Returns to Investment in Education: A Further Update. Education Economics, 12(2), pp. 111–134.
———, 2004b. Human Capital and Rates of Return. In International Handbook On The Economics Of Educa-tion, eds. Johnes, G., and Johnes, J. Northampton, MA: Edward Elgar Publishing.
Rao, P., and Holt, D., 2005. Do Green Supply Chains Lead to Competitiveness and Economic Performance? Inter-national Journal of Operations & Production Manage-ment, 25(9), pp. 898–916.
Rayment, M., Pirgmaier, E., de Ceuster, G., Hinterberger, F., Kuik, O., Gower, H.L., Polzin, C., and Varma, A., 2009. The Economic Benefits of Environmental Policy.

240240
re
Fe
re
nC
es
Amsterdam: Institute for Environmental Studies, Vrije Universiteit.
Rayner, J., Buck, A., and Katila, P., 2011. Embracing Com-plexity: Meeting the Challenges of International Forest Governance. A Global Assessment Report Prepared by the Global Forest Expert Panel on the International Forest Regime. IUFRO World Series Vol. 28. Vienna: Interna-tional Union of Forest Research Organizations.
Reich, R.B., 2008. Supercapitalism. The Transformation of Business, Democracy and Everyday Life. New York: Vin-tage Books.
Reinert, E.S., 2006. Development and Social Goals: Balanc-ing Aid and Development to Prevent “Welfare Coloni-alism”. DESA Working Paper 14. New York: United Nations Department of Economics and Social Affairs.
REN21 (Renewable Energy Policy Network for the 21st Century), 2012. Renewable 2012: Global Status Report. Paris.
Renner, M., Sweeney, S., and Kubit, J., 2008. Green Jobs: Towards Decent Work in a Sustainable, Low-Carbon World. Nairobi: United Nations Environment Programme.
Rifkin, J., 2011. The Third Industrial Revolution: How Lat-eral Power Is Transforming Energy, the Economy, and the World. New York: Palgrave Macmillan.
Robbins, D., 2003. The Impact of Trade Liberalization upon Inequality in Developing Countries: A Review of Theory and Evidence. Working Paper 13. Geneva: International Labour Organization.
Robinson, J.A., 2009. Industrial Policy and Development: A Political Economy Perspective. Paper prepared for the 2009 World Bank ABCDE Conference, Seoul, 22–24 June 2009.
Rockström, J., Steffen, W., Noone, K., Persson, A., Chapin, F.S., Lambin, E.F., Lenton, T.M., Scheffer, M., Folke, C., Schellnhuber, H.J., Nykvist, B., de Wit, C.A., Hughes, T., van der Leeuw, S., Rodhe, H., Sorlin, S., Snyder, P.K., Costanza, R., Svedin, U., Falkenmark, M., Karlberg, L., Corell, R.W., Fabry, V.J., Hansen, J., Walker, B., Liver-man, D., Richardson, K., Crutzen, P., and Foley, J.A., 2009. A Safe Operating Space for Humanity. Nature, 461(7263), pp. 472–475.
Rodriguez, F., and Rodrik, D., 2001. Trade Policy and Eco-nomic Growth: A Skeptic’s Guide to Cross-National
Evidence. In NBER Macroeconomics Annual 2000, Vol. 15, eds. Bernanke, B., and Rogoff, K.S. Cambridge, MA: MIT Press.
Rodrik, D., 1986. “Disequilibrium” Exchange Rates as Industrialization Policy. Journal of Development Eco-nomics, 23(1), pp. 89–106.
———, 1997. Has Globalization Gone Too Far? Washington, DC: Institute for International Economics.
———, 2001. Development Strategies for the 21st Century. Prepared for the Annual World Bank Conference on Development Economics 2000. Washington, DC: World Bank.
———, 2004. Industrial Policy for the Twenty-First Cen-tury. KSG Working Paper RWP04-047. Cambridge, MA: Harvard University, John F. Kennedy School of Government.
———, 2007. Industrial Development: Some Stylized Facts and Policies. In Industrial Development for the 21st Cen-tury. New York: United Nations.
———, 2008a. Normalizing Industrial Policy. Commission on Growth and Development Working Paper 3. Wash-ington, DC: World Bank.
———, 2008b. The New Development Economics: We Shall Experiment, but How Shall We Learn? Working Paper Series 08-055. Cambridge, MA: Harvard University, John F. Kennedy School of Government.
———, 2010. The Return of Industrial Policy. Project Syndicate. Available at <www.project-syndicate.org/ commentary/the-return-of-industrial-policy>. Accessed September 2013.
———, 2011. The Manufacturing Imperative. The Project Syndicate. Available at <www.project-syndicate.org/commentary/the-manufacturing-imperative>. Accessed September 2013.
Romer, P.M., 1990. Endogenous Technological Change. The Journal of Political Economy, 98(5), pp. S71–S102.
Romijn, H., and Albaladejo, M., 2002. Determinants of Innovation Capability in Small Electronics and Soft-ware Firms in Southeast England. Research Policy, 31(7), pp. 1053–1067.
Rutovitz, J., and Atherton, A., 2009. Energy Sector Jobs to 2030: A Global Analysis. Prepared for Greenpeace Inter-national. Sydney: Institute for Sustainable Futures.
241
re
Fe
re
nC
es
SAAS (Social Accountability Accreditation Services), 2013. Certified Facilities List. Available at <www.saasaccreditation .org/certfacilitieslist.htm>. Accessed September 2013.
Sabel, C., Fung, A., and O’Rourke, D., 2000. Ratcheting Labor Standards. Regulation for Continuous Improve-ment in the Global Workplace. Washington, DC: World Bank.
Sandefur, J., 2006. Explaining the Trend towards Informal Employment in Africa: Evidence from Ghanaian Manu-facturing. Oxford, UK: Centre for Study of African Economies, University of Oxford.
Schaumburg-Müller, H., 2002. Foreign Direct Investments in Vietnam: Impact on the Development of the Manufac-turing Sector. Bonn, Germany: European Association of Development Research and Training Institutes. Avail-able at <www.eadi.org/fileadmin/WG_Documents /Reg_WG/mueller.pdf>. Accessed September 2013.
Schneider, P.H., 2005. International Trade, Economic Growth and Intellectual Property Rights: A Panel Data study of Developed and Developing Countries. Journal of Development Economics, 78(2), pp. 529–547.
SERI (Sustainable Europe Research Institute), 2012. Global Material Flows Database. Vienna. Available at <www.materialflows.net>. Accessed September 2013.
SEZ India (Special Economic Zones in India), 2013. Export Performances. Ministry of Commerce and Industry, Government of India. Available at <http://sezindia.nic.in/about-ep.asp>. Accessed September 2013.
Shepherd, B., and Stone S., 2013. Global Production Net-works and Employment: A Developing Country Perspec-tive. Paris: Organisation for Economic Co-operation and Development. Available at <www.oecd.org/dac/aft/GlobalProductionNetworks_Web_USB.pdf>. Accessed 13 May 2013.
Sianesi, B., and van Reenen, J., 2003. The Returns to Edu-cation: Macroeconomics. Journal of Economic Surveys, 17(2), pp. 157–200.
Sonobe, T., Higuchi, Y., and Otsuka, K., 2012. Productiv-ity Growth and Job Creation in the Development Process of Industrial Clusters. Background paper prepared for the World Development Report 2013. Washington, DC: World Bank. Available at <https://openknowledge.
worldbank.org/handle/10986/12143>. Accessed Sep-tember 2013.
Sonobe, T., and Otsuka, K., 2011. Cluster-Based Industrial Development: A Comparative Study of Asia and Africa. New York: Palgrave MacMillan.
Sorrell, S., and Dimitropoulos, J., 2008. The Rebound Effect: Microeconomic Definitions, Limitations and Extensions. Ecological Economics, 65(3), pp. 636–649.
Soumaré, I., and Tchana, F.T., 2011. Causality between FDI and Financial Market Development: Evidence from Emerging Markets. MPRA Paper 31328. Munich: Munich University Library.
Spangenberg, J., Omann, I., and Hinterberger, F., 2002 Sus-tainable Growth Criteria: Minimum Benchmarks and Scenarios for Employment and the Environment. Eco-logical Economics, 42(3), pp. 429–443.
Spitz, A., 2004. Are Skill Requirements in the Workplace Ris-ing? Stylized Facts and Evidence on Skill-Biased Technolog-ical Change. ZEW Discussion Paper 04-33. Mannheim, Germany: Centre for European Economic Research.
Stamm, A., Dantas, E., Fischer, D., Ganguly, S., and Rennkamp, B., 2009. Sustainability-Oriented Innova-tion Systems: Towards Decoupling Economic Growth from Environmental Pressures? Bonn, Germany: German Development Institute.
Staritz, C., 2011. Making the Cut? Low-Income Countries and the Global Clothing Value Chain in a Post-quota and Post-crisis World. Washington, DC: World Bank. Available at <https://openknowledge.worldbank.org/bitstream/handle/10986/2547/588510PUB0Maki 101public10BOX353816B.txt?sequence=2>. Accessed 20 May 2013.
Stern, D.I., 2004. The Rise and Fall of the Environ-mental Kuznets Curve. World Development, 32(8), pp. 1419–1439.
Stiglitz, J.E., and Charlton, A., 2006. Fair Trade for All: How Trade Can Promote Development. New York: Oxford University Press.
Sturgeon, T., and Memedovic, O., 2010. Mapping Global Value Chains: Intermediate Goods Trade and Structural Change in the World Economy. Development Policy and Strate-gic Research Branch Working Paper 05/2010. Vienna: United Nations Industrial Development Organization.

242242
re
Fe
re
nC
es
Syrquin, M., 2007. Structural Change and Development. In International Handbook of Development Economics, Vol. 1, eds. Dutt, A.K., and Ros, J. Cheltenham, UK: Edward Elgar Publishing.
———, 2010. Kuznets and Pasinetti on the Study of Struc-tural Transformation: Never the Twain Shall Meet? Structural Change and Economic Dynamics, 21(4), pp. 248–257.
Szirmai, A., 2009. Industrialisation as an Engine of Growth in Developing Countries. UNU-MERIT Working Paper Series 2009-010. Maastricht, The Netherlands: Maas-tricht Economic and Social Research Institute on Inno-vation and Technology.
Szirmai, A., Naudé, W., and Alcorta, L., 2013. Introduction and Overview: The Past, Present and Future of Industri-alization. In Pathways to Industrialization in the Twenty-First Century: New Challenges and Emerging Paradigms, eds. Szirmai, A., Naudé, W., and Alcorta, L. Oxford, UK: Oxford University Press.
Szirmai, A., and Verspagen, B., 2011. Manufacturing and Economic Growth in Developing Countries, 1950–2005. UNU-MERIT Working Paper Series 2011–069. Maas-tricht, The Netherlands: United Nations University, Maastricht Economic and Social Research Institute on Innovation and Technology.
Tan, H., and Gill, I., 2000. Malaysia: Meeting the Demand for Skilled Workers in a Rapidly Growing Economy. In Vocational Education and Training Reform: Matching Skills to Markets and Budgets, eds. Gill, I., Fluitman, F., and Dar, A. Oxford, UK: Oxford University Press.
te Velde, D.W., and Leftwich, A., 2010. State-Business Rela-tions and Economic Growth in Sub-Saharan Africa: A Review of Case Studies in Ghana, Mauritius, South Africa and Zambia. Manchester, UK: Research Programme Consortium for Improving Institutions for Pro-Poor Growth, University of Manchester.
te Velde, D.W., 2006. Foreign Direct Investment and Devel-opment: An Historical Perspective. Background paper for the UNCTAD 2006 World Economic and Social Survey. London: Overseas Development Institute.
Tejani, S., and Millberg, W., 2010. Global Defeminiza-tion? Industrial Upgrading, Occupational Segmenta-tion and Manufacturing Employment in Middle-Income
Countries. SCEPA Working Papers 2010–1. New York: Schwartz Center for Economic Policy Analysis, The New School.
Tholoniat, L., 2010. The Career of the Open Method of Coordination: Lessons from a “Soft” EU Instrument. West European Politics, 33(1), pp. 93–117.
Tikina, A.V., and Innes, J.L., 2008. A Framework for Assess-ing the Effectiveness of Forest Certification. Canadian Journal of Forest Resources, 38(6), pp. 1357–1365.
Timmer, M.P., ed., 2012. The World Input-Output Database (WIOD): Content, Sources, and Methods. WIOD Work-ing Paper 10. Groningen, The Netherlands: Groningen Growth and Development Centre, University of Gron-ingen. Available at <www.wiod.org>. Accessed Septem-ber 2013.
Timmer, M.P., and de Vries, G.J., 2009. Structural Change and Growth in Asia and Latin America: A New Sectoral Data Set. Cliometrica, 3(2), pp. 165–190.
Tobin, J.L., and Rose-Ackerman, S., 2011. When BITs Have Some Bite: The Political-Economic Environment for Bilateral Investment Treaties. The Review of Interna-tional Organizations, 6(1), pp. 1–32.
Topalova, P., and Khandelwal, A.K., 2011. Trade Liberaliza-tion and Firm Productivity: The Case of India. Review of Economics and Statistics, 93(3), pp. 995–1009.
Topel, R.H., 1999. Labor Markets and Economic Growth. In Handbook of Labor Economics, Volume 3, eds. Ashen-felter, O., and Card, D. North-Holland: Elsevier.
Trebilcock, M., and Howse, R., 1998. Trade Liberalization and Regulatory Diversity: Reconciling Competitive Markets with Competitive Politics. European Journal of Law and Economics, 6(1), pp. 5–37.
Tregenna, F., 2013. Manufacturing Productivity, Deindus-trialization, and Reindustrialization. In Pathways to Industrialization in the 21st Century. New Challenges and Emerging Paradigms, eds. Szirmai, A., Naudé, W., and Alcorta, L. Oxford, UK: Oxford University Press.
Trilling, B., and Fadel, C., 2009. 21st Century Skills: Learn-ing for Life in Our Times. San Francisco, CA: John Wiley & Sons.
Tzannatos, Z., and Johnes, G., 1997. Training and Skills Development in the East Asian Newly Industrialised Countries: A Comparison and Lessons for Developing

243
re
Fe
re
nC
es
Countries. Journal of Vocational Education and Train-ing, 49(3), pp. 431–453.
Ulltveit-Moe, K.H., 2008. Live and Let Die – Industrial Pol-icy in a Globalised World. Expert Report 22 to Sweden’s Globalisation Council. Västerås, Sweden: Globalisation Council.
UN (United Nations), 1974. Charter of Economic Rights and Duties of States, Resolution 3281 XXIX. New York. Available at <www.un-documents.net/a29r3281.htm>. Accessed September 2013.
———, 2013a. UN Commodity Trade Statistics (Comtrade) Database. New York. Available at <http://wits.worldbank .org/wits>. Accessed September 2013.
———, 2013b. A New Global Partnership: Eradicate Poverty and Transform Economies through Sustainable Develop-ment. The Report of the High-Level Panel of Eminent Per-sons on the Post-2015 Development Agenda. New York, NY.
———, 2013c. Resolution Adopted by the General Assembly on 21 December 2012: 67/225 Industrial Development Cooperation. New York.
UNCTAD (United Nations Conference on Trade and Development), 2010a. Trade and Development Report, 2010: Employment, Globalization and Development. New York: United Nations.
———, 2010b. The Least Developed Countries Report 2010: Towards a New International Development Architecture for LDCs. New York: United Nations.
———, 2011. World Investment Report 2011: Non-Equity Modes of International Production and Development. New York: United Nations.
———, 2012a. The Continuing Relevance of Development Banks. Policy Brief 4. Geneva: United Nations.
———, 2012b. Economic Development in Africa – Report 2012: Structural Transformation and Sustainable Devel-opment in Africa. New York: United Nations.
———, 2013a. UNCTADSTAT Database. Available at <http://unctadstat.unctad.org>. Accessed September 2013.
———, 2013b. World Investment Report 2013: Global Value Chains – Investment and Trade for Development. New York: United Nations.
UNDESA (United Nations Department of Economic and Social Affairs), 2006a. World Economic and Social Sur-vey 2006: Diverging Growth and Development. New York: United Nations.
———, 2006b. Rethinking the Role of National Development Banks. Updated and revised background paper prepared for the Ad Hoc Expert Group Meeting on “Rethinking the Role of National Development Banks”, New York, 1–2 December 2005.
———, 2012. World Urbanization Prospects, the 2011 Revi-sion. New York: United Nations. Available at <http://esa.un.org/unup/CD-ROM/Data-Sources.htm>. Accessed October 2013.
UNDG (United Nations Development Group), 2013. The Global Conversation Begins: Emerging Views for a New Development Agenda. New York.
UNDP (United Nations Development Programme), 2011. Poverty Reduction – Towards Human Resilience: Sustain-ing MDG Progress in an Age of Economic Uncertainty. New York.
UNEP (United Nations Environment Programme), 2010. Green Economy Developing Countries Success Stories. Geneva.
———, 2011a. Decoupling Natural Resource Use and Envi-ronmental Impacts from Economic Growth. Nairobi: Working Group on Decoupling to the International Resource Panel.
———, 2011b. Towards a Green Economy: Pathways to Sustainable Development and Poverty Eradication. Nairobi.
UNEP (United Nations Environment Programme) and BNEF (Bloomberg New Energy Finance), 2012. Global Trends in Renewable Energy Investments 2012. Frank-furt, Germany: UNEP Collaborating Centre for Cli-mate & Sustainable Energy Finance, Frankfurt School of Finance & Management.
UNIDO (United Nations Industrial Development Organi-zation), 2005. Industrial Development Report 2005: Capability Building for Catching up: Historical, Empiri-cal and Policy Dimensions. Vienna.
———, 2009. Industrial Development Report 2009. Break-ing In and Moving Up: New Industrial Challenges for
244244
re
Fe
re
nC
es
the Bottom Billion and the Middle-Income Countries. Vienna.
———, 2011a. Vietnam Industrial Competitiveness Report 2011. Ha Noi and Vienna: Ministry of Industry and Trade of Viet Nam and United Nations Industrial Development Organization.
———, 2011b. Industrial Development Report 2011. Industrial Energy Efficiency for Sustainable Wealth Creation – Captur-ing Environmental, Economic and Social Dividends. Vienna.
———, 2011c. UNIDO Green Industry: Policies for Support-ing Green Industry. Vienna.
———, 2012a. Industrial Statistics Database 2-Digit Level, ISIC Revision 3 (INDSTAT2), 2012. Vienna.
———, 2012b. Climbing the Stairway of Development: Structural Change as the Driver of Economic Growth. Policy Brief Issue 2, May 2012. Vienna.
———, 2012c. Promoting Industrial Diversification in Resource Intensive Economies: The Experiences of Sub-Saharan Africa and Central Asia Regions. Vienna.
———, 2013a. Industrial Statistics Database 2-Digit Level, ISIC Revision 3 (INDSTAT2), 2013. Vienna.
———, 2013b. CSR Projects. Available at <www.unido.org/what-we-do/trade/csr/csr-projects.html>. Accessed September 2013.
———, 2013c. MVA Database 2010. Vienna.———, 2013d. International Yearbook of Industrial Statistics
2013. Vienna.UNIDO (United Nations Industrial Development Organi-
zation) and UNCTAD (United Nations Conference on Trade and Development), 2011. Economic Development in Africa Report 2011: Fostering Industrial Development in Africa in the New Global Environment. New York: United Nations.
Unni, J., 2011. “Skilling” the Workforce in India – Differ-ent Models? In Towards a New Global World of Skills Development? TVET’s Turn to Make Its Mark. NOR-RAG News, 46, pp. 73–76.
UNSD (United Nations Statistics Division), 2013. Inter-national Standard Industrial Classification of All Eco-nomic Activities, Rev.3. New York. Available at <http://unstats.un.org/unsd/cr/registry/regcst.asp?cl=2>. Accessed September 2013.
UN System Task Team, 2012. Realizing the Future We Want for All: Report to the Secretary-General. New York.
UVL (University of Virginia Library), 2004. Historical Cen-sus Browser. Charlottesville, VA: Geospatial and Statis-tical Data Center. Available at <http://mapserver.lib.virginia.edu/>. Accessed September 2013.
van Waarden, F., 2011. Varieties of Private Market Regula-tion: Problems and Prospects. In Handbook on the Poli-tics of Regulation, ed. Levi-Faur, D. Cheltenham, UK: Edward Elgar Publishing.
Vandenberghe, V., and Debande, O., 2004. Financing Higher Education with Student Loans - The Crucial Role of Income-Contingency and Risk pooling. Discussion Papers 2004036. Louvain-la-Neuve, Belgium: Univer-sité Catholique de Louvain, Institut de Recherches Eco-nomiques et Sociales.
Varma, A., 2010. Estimating Green Jobs in Bangladesh: A GHK Report for the ILO. Geneva: International Labour Organization.
Verdolini, E., and Galeotti, M., 2011. At Home and Abroad: An Empirical Analysis of Innovation and Diffusion in Energy Technologies. Journal of Environmental Eco-nomics and Management, 61(2), pp. 119–134.
Vivarelli, M., 2013. The Employment and Skill Impacts of Multi-faceted Innovation. A Background paper prepared for the Industrial Development Report 2013. Vienna: United Nations Industrial Development Organization.
Vogel, D., 2008. Private Global Business Regulation. Annual Review of Political Science, 11(1), pp. 61–82.
von Weizsäcker, E.U., 1989. Erdpolitik: Ökologische Realpolitik an der Schwelle zum Jahrhundert der Umwelt. Darmstadt, Germany: Wissenschaftliche Buchgesellschaft.
von Weizsäcker, E.U., Hargroves, C., Smith, M.H., Desha, C., and Stasinopoulos, P., 2009. Factor Five: Transform-ing the Global Economy through 80% Improvements in Resource Productivity. London: Routledge.
von Weizsäcker, E.U., Lovins, A.B., and Lovins, L.H., 1997. Faktor Vier. Doppelter Wohlstand – Halbierter Naturver-brauch. Munich: Droemer Knaur.
Wacziarg, R., and Welch, K.H., 2008. Trade Liberalization and Growth: New Evidence. The World Bank Economic
245
re
Fe
re
nC
es
Review, 22(2), pp. 187–231. Available at <https://openknowledge.worldbank.org/handle/10986/4477>. Accessed September 2013.
Wade, R.H., 1990. Governing the Market. Economic Theory and the Role of Government in East Asian Industrializa-tion. Princeton, NJ: Princeton University Press.
Walther, R., 2011. Building Skills in the Informal Sector. Background paper prepared for the Education for All Global Monitoring Report 2012. Paris: United Nations Educational, Scientific and Cultural Organization.
Warwick, K., 2013. Beyond Industrial Policy: Emerging Issues and New Trends. OECD Science, Technology and Industry Policy Papers 2. Paris: Organisation of Eco-nomic Co-Operation and Development Publishing.
Watermeyer, R., 2000. The Use of Targeted Procurement as an Instrument of Poverty Alleviation and Job Crea-tion in Infrastructure Projects. Public Procurement Law Review, 9(5), pp. 226–250.
WEF (World Economic Forum), 2013. Enabling Trade Val-uing Growth Opportunities. Geneva.
Weiss, J., 2005. Export Growth and Industrial Policy: Lessons from the East Asian Miracle Experience. ADB Institute Discussion Paper 26. Tokyo: Asian Development Bank Institute.
———, 2011. Industrial Policy in the Twenty-First Century: Challenges for the Future. Working Paper 2011/55. Hel-sinki: UNU World Institute for Development Econom-ics Research.
———, 2013. Industrial Policy in the Twenty-First Cen-tury: Challenges for the Future. In Pathways to Indus-trialization in the Twenty-First Century: New Challenges and Emerging Paradigms, eds. Szirmai, A., Naudé, W., and Alcorta, L. Oxford, UK: Oxford University Press.
Welch, F., 2000. Growth in Women’s Relative Wages and in Inequality among Men: One Phenomenon or Two? American Economic Review, 90(2), pp. 444–449.
Wells, D., 2007. Too Weak for the Job: Corporate Codes of Conduct, Non-Governmental Organizations and the Regulation of International Labour Standards. Global Social Policy, 7(1), pp. 51–74.
WIOD (World Input-Output Database), 2012. The World Input-Output Database (WIOD). Available at <www.
wiod.org/database/index.htm>. Accessed September 2013.
World Bank, 1997. World Development Report 1997: The State in a Changing World. Washington, DC: World Bank. Available at <https://openknowledge. worldbank.org/handle/10986/5980>. Accessed Sep-tember 2013.
———, 2005. World Development Report 2005: A Better Investment Climate for Everyone. Washington, DC. Available at <https://openknowledge.worldbank.org/handle/10986/5987>. Accessed September 2013.
———, 2008. The Growth Report: Strategies for Sustained Growth and Inclusive Development. Washington, DC.
———, 2009. World Development Report 2009: Reshap-ing Economic Geography. Washington, DC. Avail-able at <https://openknowledge.worldbank.org/ handle/10986/5991>. Accessed September 2013.
———, 2010. Stepping Up Skills for More Jobs and Higher Productivity. Washington, DC.
———, 2012. World Development Indicators Database. Washington, DC. Available at <http://data.worldbank.org/indicator>. Accessed November 2012.
———, 2013a. World Development Report 2013: Jobs. Wash-ington, DC. Available at <https://openknowledge.worldbank.org/handle/10986/11843>. Accessed Sep-tember 2013.
———, 2013b. World Development Indicators Database. Washington, DC. Available at <http://data.worldbank.org/indicator>. Accessed September 2013.
World KLEMS, 2013. World KLEMS Database. Washing-ton, DC: Available at <www.worldklems.net>. Accessed September 2013.
WTO (World Trade Organization), 2013. Report on G-20 Trade Measures (Mid-October 2012 to Mid-May 2013): Executive Summary. Geneva.
———, n.d. Marrakesh Agreement Establishing the World Trade Organization. Geneva. Available at <www.wto.org/english/docs_e/legal_e/04-wto_e.htm>. Accessed October 2013.
Yale University, 2011. Geographically Based Economic Data (G-Econ). New Haven, CT. Available at <http://gecon.yale.edu>. Accessed September 2013.

246246
re
Fe
re
nC
es
Young, A., 1991. Learning by Doing and the Dynamic Effects of International Trade. Quarterly Journal of Eco-nomics, 106(2), pp. 369–405.
Yülek, M.A., and Taylor, T.K., eds., 2012. Designing Pub-lic Procurement Policy in Developing Countries: How to Foster Technology Transfer and Industrialization in the Global Economy. New York: Springer.
Zhao, Z., and Zhang, K.H., 2006. Multinational Corpora-tions and Technology Transfers in Developing Countries: Evidence from China. Available at <http://faculty. washington.edu/karyiu/confer/ beijing06/papers/zhao-zhang.pdf>. Accessed October 2013.

Industrial Developm
ent Report 2013 Sustaining Em
ployment Grow
th: The Role of Manufacturing and Structural Change
“ Structural change through the development of manufacturing is essential to any developing country for job creation, poverty reduction and sustained development. UNIDO’s Industrial Development Report 2013 provides careful theoretical reviews, solid empirical evidence and practical policy advice for how to facilitate the development of manufacturing in developing countries. I strongly recommend this report to anyone who is interested in finding out a path to achieve prosperity in developing countries.”
Justin Yifu Lin, Professor, National School of Development, Peking UniversityFormer Chief Economist and Senior Vice President, The World Bank
“ Structural change is the core of sustainable development. Continuous upgrading of manufacturing industries offers opportunities for growth, productive employment and the efficient use of resources. UNIDO’s Industrial Development Report 2013 provides ample evidence of how and why structural change works and presents sustainable paths to industrialization. It is an extremely valuable companion for policy-makers dealing with manufacturing upgrading and employment generation.”
Kandeh K. Yumkella, Chairman, UN Energy, Former Director General of UNIDO
“ Based on a comprehensive and sophisticated analysis of the role of manufacturing in structural change, UNIDO’s Industrial Development Report 2013 provides an insightful discussion on the evolution and the determinants of economic transformation. The Report’s findings have valuable policy implications for both economic practitioners and academics who are interested in the key role that a vibrant manufacturing sector can play in achieving inclusive and sustainable economic development.”
Ha-Joon Chang, University of Cambridge
united nations industrial development organizationVienna International Centre, P.O. Box 300, 1400 Vienna, AustriaTelephone: (+43-1) 26026-0, Fax: (+43-1) 26926-69E-mail: [email protected], Internet: www.unido.org
Printed in AustriaNovember 2013
Sales No. E.13.II.B.46ISBN-13 978-92-1-106451-3


