47
Robust Design in Less Time INDUSTRIAL EQUIPMENT—TURBOMACHINERY
Robust Design in Less TimeINDUSTRIAL EQUIPMENT—TURBOMACHINERY

2www.3ds.com/simulia
Industrial Equipment—Turbomachinery
Content
Nabtesco Ensures Gear Strength and Endurance in Gusty Wind Conditions SIMULIA Customer Video
3
Speeding the Route to Quality Rolls-Royce uses Isight for simulation process automation and design optimization of aircraft engine turbomachinery
4
Fast-Starts Help Squeeze WattsAlstom Power utilizes Abaqus FEA to improve steam turbine efficiency
7
Nabtesco Powers Up Wind Turbine Gear Performance with Realistic Simulation 9
Rotordynamics Analysis using Abaqus/StandardYoungwon Hahn (Dassault Systèmes)
12
Multi-disciplinary Optimization of Turbine Components with the Aid of Surrogate Modeling Techniques Iain Niven and Mark Willetts (Alstom)SIMULIA Community Conference, Vienna, Austria
16
DOE Analysis for Internal Cooling Configuration of Gas Turbine Blade Davide Pinna (Ansaldo Energia)Francesco Cittadella (Exemplar)SIMULIA Community Conference, Vienna, Austria
23
Collaborative Robust Engine Design Optimization Roland Parchem and Peter Flassig (Rolls-Royce Deutschland)Holger Wenzel (Dassault Systèmes)SIMULIA Community Conference, Vienna, Austria
33
Strength Analysis on Load Rejection Working Condition of Steam Turbine Gongyi Wang, Kai Cheng, Jiandao Yang, Deqi Yu, Luyin Gu, and Zeying Peng (Shanghai Turbine Works Co., Ltd.)SIMULIA Community Conference, Vienna, Austria
40
Optimizing Design Performance with Nonlinear Finite Element Analysis and Multiphysics Simulation

3www.3ds.com/simulia
Industrial Equipment—Turbomachinery
Customer Video
Nabtesco Ensures Gear Strength and Endurance in Gusty Wind Conditions
For more efficient conversion of the kinetic energy of wind into mechanical energy, or ‘wind power,’ additional control over the position of each turbine’s nacelle and blades is essential. This is the task of the yaw and pitch drives, which adjust the physical orientation of those components in response to fluctuations in the velocity and direction of prevailing breezes. To help improve strength and endurance in nacelle yaw and blade pitch drives, Nabtesco Corporation of Japan uses SIMULIA’s Abaqus finite element analysis (FEA).
For More Information www.nabtesco.com/en/index.html
4www.3ds.com/simulia
Industrial Equipment—Turbomachinery
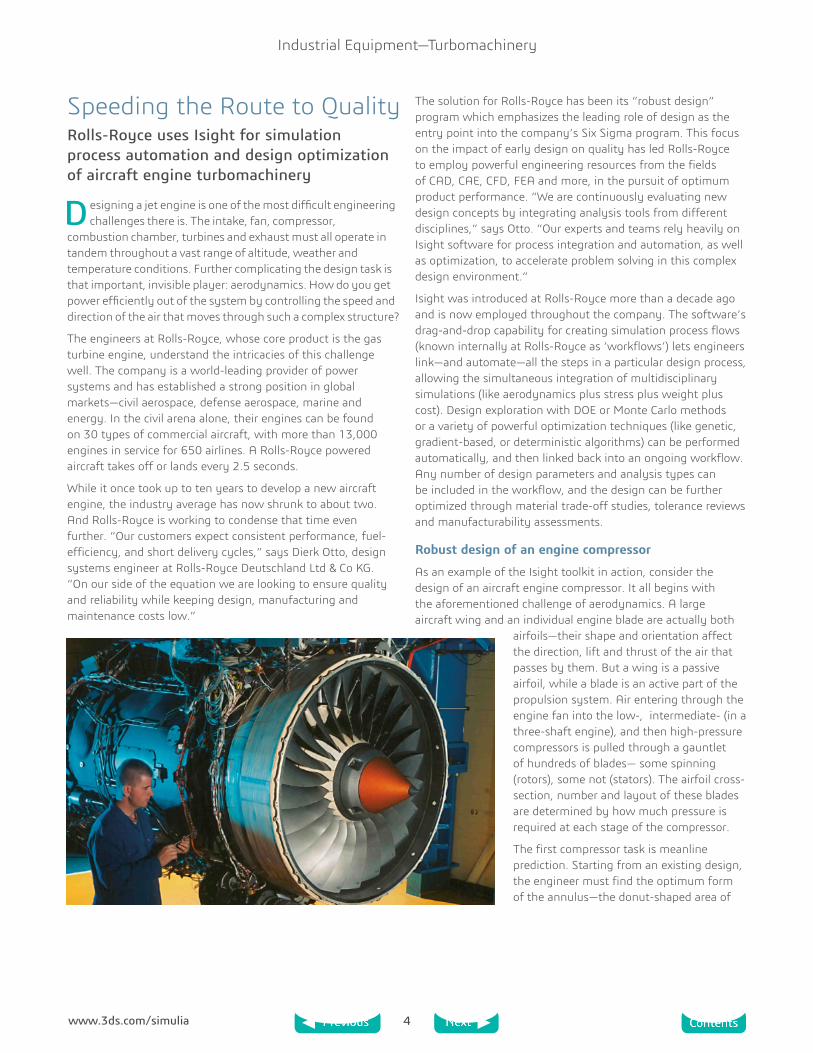
Speeding the Route to QualityRolls-Royce uses Isight for simulation process automation and design optimization of aircraft engine turbomachinery
Designing a jet engine is one of the most difficult engineering challenges there is. The intake, fan, compressor,
combustion chamber, turbines and exhaust must all operate in tandem throughout a vast range of altitude, weather and temperature conditions. Further complicating the design task is that important, invisible player: aerodynamics. How do you get power efficiently out of the system by controlling the speed and direction of the air that moves through such a complex structure?
The engineers at Rolls-Royce, whose core product is the gas turbine engine, understand the intricacies of this challenge well. The company is a world-leading provider of power systems and has established a strong position in global markets—civil aerospace, defense aerospace, marine and energy. In the civil arena alone, their engines can be found on 30 types of commercial aircraft, with more than 13,000 engines in service for 650 airlines. A Rolls-Royce powered aircraft takes off or lands every 2.5 seconds.
While it once took up to ten years to develop a new aircraft engine, the industry average has now shrunk to about two. And Rolls-Royce is working to condense that time even further. “Our customers expect consistent performance, fuel-efficiency, and short delivery cycles,” says Dierk Otto, design systems engineer at Rolls-Royce Deutschland Ltd & Co KG. “On our side of the equation we are looking to ensure quality and reliability while keeping design, manufacturing and maintenance costs low.”
The solution for Rolls-Royce has been its “robust design” program which emphasizes the leading role of design as the entry point into the company’s Six Sigma program. This focus on the impact of early design on quality has led Rolls-Royce to employ powerful engineering resources from the fields of CAD, CAE, CFD, FEA and more, in the pursuit of optimum product performance. “We are continuously evaluating new design concepts by integrating analysis tools from different disciplines,” says Otto. “Our experts and teams rely heavily on Isight software for process integration and automation, as well as optimization, to accelerate problem solving in this complex design environment.”
Isight was introduced at Rolls-Royce more than a decade ago and is now employed throughout the company. The software’s drag-and-drop capability for creating simulation process flows (known internally at Rolls-Royce as ‘workflows’) lets engineers link—and automate—all the steps in a particular design process, allowing the simultaneous integration of multidisciplinary simulations (like aerodynamics plus stress plus weight plus cost). Design exploration with DOE or Monte Carlo methods or a variety of powerful optimization techniques (like genetic, gradient-based, or deterministic algorithms) can be performed automatically, and then linked back into an ongoing workflow. Any number of design parameters and analysis types can be included in the workflow, and the design can be further optimized through material trade-off studies, tolerance reviews and manufacturability assessments.
Robust design of an engine compressor
As an example of the Isight toolkit in action, consider the design of an aircraft engine compressor. It all begins with the aforementioned challenge of aerodynamics. A large aircraft wing and an individual engine blade are actually both
airfoils—their shape and orientation affect the direction, lift and thrust of the air that passes by them. But a wing is a passive airfoil, while a blade is an active part of the propulsion system. Air entering through the engine fan into the low-, intermediate- (in a three-shaft engine), and then high-pressure compressors is pulled through a gauntlet of hundreds of blades— some spinning (rotors), some not (stators). The airfoil cross-section, number and layout of these blades are determined by how much pressure is required at each stage of the compressor.
The first compressor task is meanline prediction. Starting from an existing design, the engineer must find the optimum form of the annulus—the donut-shaped area of

5www.3ds.com/simulia
Industrial Equipment—Turbomachinery
rotating “blade exits” through which the air flows—for the desired new configuration. The meanline is calculated halfway between the hub (base of the blades) and the tip (outer end of blades) of the annulus. The total area of the annulus determines exit velocity and pressure rise for each stage. This is the principal determinant of the size and cross-sectional layout of the compressor, how many stages it should have and what the inner and outer diameters of each stage will be.
At this point the design engineer is not thinking about blade shape; he is only conducting a thermodynamic and fluid flow exercise to determine the overall flow of air that results from different diameters of annulus at different compressor stages. Yet it’s a very complex exercise already: Aerodynamic parameters that have to be taken into account in meanline prediction include pressure ratios, efficiency, surge margins, form factors and so forth. Running these analyses manually would be immensely time-consuming. But by using Isight, the engineer can integrate all the meanline tasks into an automatic process flow that works through each task sequentially, evaluating the data and applying any relevant external programs, to arrive at the optimum solution.
Isight components decrease design process complexity
Although the typical Isight user at Rolls-Royce is an expert who can set up such complex simulation flows quickly, not everyone on the design team needs to work at these deepest levels of expertise. For example, a CFD analyst might want to
use an Isight workflow of a meanline prediction to measure the feasibility and consequences of his own design ideas and changes. To support these more casual users of Isight, Otto and his colleagues created customized Isight components of calculation routines, data mapping, program controls and bundles, and dynamic link libraries. The casual users can now call upon whatever component they need and drop it into their own simulation flows to speed up and simplify their work, generating the same solutions that an expert would without having to work through all the subroutines.
“This user-friendly component approach gives our team a number of advantages,” says Otto. “Information can be shared easily—even with worksites in other locations—and we can standardize our process build-ups more readily as well as speed up our runtimes.”
Multidisciplinary optimization drives design
The next step in the development of the engine compressor requires the engineering team to move from one-dimensional meanline analysis to throughflow (optimizing streamlines of
predicted air movement inside the annulus). The final step is actual blade design. Starting with two-dimensional blade geometries (profile sections) that produce the flow angles and conditions predicted by the meanline and throughflow analyses, designers use CFD solvers within Isight to automatically optimize the geometry of every single blade, the cross-section profile of which is the familiar airfoil shape.
By stacking multiple airfoil profile sections on top of each other, connecting them with linear filaments, adjusting the lean of the resulting structure and giving it a root and a platform to sit on, the engineers arrive at the first 3D shape of a blade. Using an in-house Rolls-Royce blade generator tool, these blade profiles can be modified via different design parameters like maximum thickness, blade angles, camber style, etc. The goal is to find the airfoil design that best meets performance requirements and structural criteria as well as the previously determined, all-important aerodynamics.
The design iteration loop for an aircraft engine compressor blade. Process automation and optimization with Isight can be applied at any stage of the cycle.
2D-Blading
Throughflow
Aerodynamic
Design/ Structural analysis
Meanline
Durability/ Vibration analysis
FEM
3D-Blading
CAD
“We have noticeably less redesign work now, which leads to better control over manufacturing costs.” Dierk Otto, Design Systems Engineer,Rolls-Royce
6www.3ds.com/simulia
Industrial Equipment—Turbomachinery
In aircraft engines, lighter weight is always at a premium. Arriving at a CAD model of a blade where the geometry and orientation have been optimized for weight, the designers still need to prove that the blade will survive under real-world conditions. This is where static and dynamic (FEA) are brought into the optimization loop to perform stress analysis, study vibration and resonance behavior, and examine material creep and lifetime wear. When critical issues are identified, the engineers can modify the sections and rerun the stress analysis. Here Isight is an integral tool for accelerating the identification of the best design solution.
This automatic blading design process has a great deal of external input-output data flow, so selecting the correct design parameters is very important to avoid error. Taking a page from their experience with creating custom components for meanline prediction, the Rolls-Royce team decided to create a series of templates for blading as well. Again, the casual user (perhaps an FEA analyst this time) can now select just the required design parameters, set upper and lower boundaries for the desired parameters, and include DOE or optimization runs to refine constraints against performance goals. “While templates help speed up our process build-ups and reduce error-sources, they are also designed to preserve process flexibility,” says Otto.
Evaluating more design options—faster
Using components and templates together in a single design iteration loop—modify airfoil, run 2D CFD calculations, do 3D optimization with FEA, and finally evaluate results—now takes only 13 minutes, whereas previously it would need about a day. “We have noticeably less redesign work now, which leads to better control over manufacturing costs,” says Otto. “Overall this allows faster response to our customers’ demands while adhering to the strictest quality standards of the aircraft industry.”
For More Information www.rolls-royce.com

7www.3ds.com/simulia
Industrial Equipment—Turbomachinery
Fast-Starts Help Squeeze WattsAlstom Power utilizes Abaqus FEA to improve steam turbine efficiency
S team turbines go around. Since their invention in 1884, they have made much of the industrial world go around, as well.
Sometimes referred to as the perfect engine, steam turbines rapidly replaced the steam engine due to greater efficiency at converting heat into motion and motion into power. Their rotary action also became the primary power source for driving generators to create electricity.
Steam-powered turbines now generate some 80 percent of the world’s electricity and are expected to do so well into the future. But given the changing face of energy markets and economic and environmental pressures for greater efficiency and reduced CO2 emissions, steam turbine performance is being scrutinized under a design and optimization microscope. For manufacturers and power plant operators alike, the goal is to squeeze maximum wattage out of the available energy source.
Winning the Wattage Race
Modern steam turbines are exposed to greater stresses than earlier versions. The faster you can get a turbine up to operating conditions, the more energy you can produce. These rapid start-ups put tremendous thermal stresses on a turbine as the temperature is raised by several hundred degrees in less than an hour. In the past, power providers took their time during start-ups—a typical start-up might have taken over four hours—and as a result, stresses were much lower. Today’s power plant operators do not have this luxury, and need to shave start-up time to maximize energy production and efficiency.
Additionally, while power plants in the past ran continuously for long periods of time, modern plants and the steam turbines that drive them need to adapt to varying operating conditions: plants supplying peak power need to ramp up and down on an almost daily basis; Combined Cycle Power Plants (CCPP) have both gas and steam turbines and need to switch regularly between the two power sources; and plants that provide backup for sustainable energy sources need to come online quickly when weather conditions change.
Due to these variable operating conditions, transient events have become common. Unscheduled operations such as double-shifts or load following operation are also the norm. “Steam turbines need to be able to start-up rapidly, react to load changes in a quick and predictable way, and tolerate the stresses inherent in these operating conditions,” said Andreas Ehrsam, Project Manager at Alstom Power in Switzerland. “These are key technological challenges for modern power plants and for our engineering team.” In the future, the challenges will only increase. According to Ehrsam, “The target for hot start-up of next-generation CCPP steam turbines is well below 30 minutes.” With 100 years of experience designing and building steam turbines, and having supplied major equipment for 25 percent of the world’s existing electric power generation plants, it’s easy to see why Alstom Power is continuously looking for ways to improve turbine performance and maximize power production.
In simplified terms, the rotor in a steam turbine is comprised of rows of rotating blades that capture the energy from high velocity steam jetted from stationary nozzles in between the rows. During transient events in the operation of a steam turbine, thermal stresses occur causing high fatigue loading—and these stresses are especially prevalent in thick-walled components. At the same time, turbines experience gradual creep loading as a result of general operation at high temperatures. Combining creep and fatigue loading over time puts stresses on the turbine, eventually leading to crack initiation and growth that can limit turbine lifespan.
Automating a Start-Up Simulation
Alstom Power has been optimizing steam turbine start-up processes for years. They use Abaqus FEA because of its powerful thermo-mechanical simulation capabilities. Prior to this, early optimization analysis at Alstom Power was based on finite difference codes and simplified component models. Moving to FEA, Alstom engineers would first derive the transient thermal boundary conditions for the whole start-up simulation, basing it on a set of predefined process parameters. In a second step, they would perform a finite element analysis to verify these thermal boundary conditions. This sequential approach required numerous iterations—a tedious manual process—to arrive at the optimal process parameters.

8www.3ds.com/simulia
Industrial Equipment—Turbomachinery
With the demand for increased operational flexibility and more accurate modeling, Ehrsam’s engineering team looked to the automation capabilities in Abaqus to bypass the time-consuming iterative simulation process. To automate the optimization, the group developed a design tool that interlinked Abaqus with Alstom’s in-house thermodynamic code using Python, the programming language of the Abaqus kernel scripting interface. This solution, according to Ehrsam, “allowed direct and easy communication between our proprietary code and Abaqus/CAE.” The result was a tool that determined optimal transient thermal boundary conditions based on real-time thermal stresses and automated the search for optimal process parameters through the use of a feedback control algorithm. “Use of this tool eliminated the need for the high number of manual iterations that were previously required,” added Ehrsam. “As a result, the process became much more efficient.”
The automated simulation happens in the following way: Abaqus calls a subroutine to apply the thermal boundary condition to the model of the turbine rotor. Then it queries the Alstom thermodynamic program for the thermal boundary condition for the first time-step. With this input, Abaqus completes the thermo-mechanical analysis. To calculate the thermal boundary condition for the next time-step, Abaqus extracts the actual stresses at critical locations from its output database, calls the control algorithm to determine the optimal mass flow, queries the Alstom code for the thermal boundary conditions based on this information, and finally performs the thermo-mechanical analysis. This computational loop is repeated for each time-step—from 10 to 60 seconds depending on the application—comparing the computed stresses at critical locations with the material stress limits, while making sure that the mass flow approaches, but does not exceed, the stress limits.
Automation Trumps Iteration
To put the tool to work, Alstom Power chose to simulate a steam turbine rotor during a typical 60-minute start-up. They used Abaqus for a number of steps: for preprocessing; for the creation and meshing of 2D models of simple parts such as axisymmetric rotor models; and for optimization automation using Python scripts. More complex 3D models were created in CATIA V5 and, depending on the application, imported into Abaqus using the CATIA V5 Associative Interface for Abaqus or the CATIA V5 Import feature. The team then used Abaqus to mesh the model and perform the finite element analysis of the rotor. The time step for mass flow control and automation was set to 60 seconds.
To start the simulation, Ehrsam’s group modeled the initial temperature profile of the component before start-up. First, the turbine was accelerated to nominal speed for grid synchronization. Then, throughout the 60-minute start-up, the
team optimized the loading gradient so the maximum stress in the hottest section of the rotor was kept just below the material stress limit of the rotor materials (see Figure 1), until eventually steady-state temperature profile at base load was reached (see Figure 2). Running on a standard engineering PC, this automated optimization took approximately 16 minutes. Although the earlier manual calculations each took only about a third of this run time, they consumed significantly more set-up time because they were based on estimates that had to be changed manually from run to run.
“As a result of the automated process, we were able to determine the fastest start-up parameters and process without exceeding stress limits,” said Ehrsam. This led to a change in the design of the rotor grooves based on global deformation and heat flows. “Comparing the sequential versus automated method,” Ehrsam said, “we demonstrated time-savings and improvements in accuracy using the automated tool.” A typical time for a start-up optimization using the previous manual method was about 10 man-days. With the new tool, this was reduced to only five. The Alstom Power team validated the automated analysis against the previous process and found good agreement between results data.
Squeezing Maximum Wattage
The advantages of automating this process have since led Alstom Power to begin testing the use of Isight, as it would enable them to conduct an even deeper search of the turbine design space. “In the world of power generation, small changes in efficiency can save millions of dollars a year in fuel cost,” said Ehrsam. With savings on this scale, using simulation and optimization together to squeeze maximum wattage out of turbines will become increasingly important to power producers in the future.
For More Information www.alstom.com
Figure 1 (top). Rotor model non-stationary temperature profile at 60 minutes into start-up. Figure 2 (bottom). Rotor model with steady-state temperature profile at base load. Images courtesy of Alstom.

9www.3ds.com/simulia
Industrial Equipment—Turbomachinery
Nabtesco Powers Up Wind Turbine Gear Performance with Realistic SimulationW ind turbines have become an iconic symbol of alternative
energy with their tall, upright towers and graceful, spinning blades. Choosing a proper site for the towers is certainly the starting point for maximizing the output of a large wind farm. But for the most efficient conversion of the kinetic energy of wind into mechanical energy, or ‘wind power,’ additional control over the position of each turbine’s nacelle and blades is essential. This is the task of the yaw and pitch drives, which adjust the physical orientation of those components in response to fluctuations in the velocity and direction of prevailing breezes.
Located at the base of the nacelle, a yaw drive changes the direction which the nacelle faces. Where each blade meets the nacelle, a pitch drive changes the angle of the blades. Working in tandem, these computer-driven gear mechanisms automatically optimize the orientation of the turbine relative to the wind so power can be generated in the most efficient manner possible.
Gearing up for large wind turbines
Precision yaw and pitch drives for robotic reduction gears are a specialty of Nabtesco Corporation of Japan, known worldwide for unique technology that allows those components to be smaller and lighter than many conventional robotic drives. But when the company expanded into energy harvesting
equipment, such as wind turbines and solar energy collector trackers, they realized that ‘smaller and lighter’ have their limits in large industrial structures.
“Particularly in the wind industry, our biggest challenges are ensuring sufficient gear strength and long-term endurance in gusty conditions,” says Kazuhiko Yokoji, CAE manager, CAE & material department, whose team provides computer-aided engineering (CAE) services for the entire Nabtesco group. “Our reduction gears are made up of a lot of very complicated assemblies, with many parts that come in contact with one another. For each wind turbine configuration, we have to provide our customers with the best possible design that minimizes overall stress while maintaining durability.”
Every yaw and pitch drive in a wind turbine engages with a pinion gear, made from specialized treated steel, that transmits power from the drive to the nacelle or blade. In a huge wind turbine, the rotation angle between drive and pinion gear teeth is particularly small, so repeated contact over time—particularly under the ‘routine’ stresses of high winds and tower vibration—has the potential to damage tooth surfaces and cause assembly breakdowns.
Balancing contact for best performance
To minimize such hazards, the engineers strive to balance the contact between ring and pinion teeth so that the ‘normal’ stress of rotation and the sheer stress of the teeth against each other are reduced. Decreasing the stress on teeth improves their durability—and that of the entire assembly as well.
Since the thinner, outer edges of a tooth are most susceptible to damage, teeth are manufactured with a curved surface (“crowning”) so that the edge dips away to either side of the center of the tooth and the contact between teeth occurs somewhere in the middle. Too steep crowning decreases the contact area too much, intensifying tooth stress. Too shallow crowning allows stress to extend too close to tooth edges. Damaging edge contact can also increase if the pitch drive shaft bends. “Since crowning has such a significant effect on contact area and maximum stress, pinion tooth shape is a major focus in our design process,” says Yokoji.
Yaw drives
NacelleBlade
Tower
Pitch drives
Location of yaw and pitch drives on wind turbine.
“Our CAE workflow now enables us to optimize crowning of pinion gear teeth designs accurately and with far less manpower than before. This method reduces design times dramatically.” Kazuhiko Yokoji, CAE Manager, Nabtesco Corporation

10www.3ds.com/simulia
Industrial Equipment—Turbomachinery
Finding that optimum tooth shape is a time-consuming challenge when done manually. The contact area between drive and pinion teeth can be visually identified in a test rig by coating the teeth with a special paint that rubs off where they engage. “But using this method means a lot of pinions have to be manufactured and tested in order to identify which shape is the most desirable,” says Yokoji. “And this method doesn’t give us the overall stress data that helps us evaluate durability. We felt we could get a more complete picture using an analytical model that could simultaneously analyze tooth contact area and maximum stress.”
SIMULIA solutions speed up analysis
Yokoji’s team uses Abaqus unified finite element analysis (FEA) to solve a number of wind turbine-related design challenges. “Abaqus’ capabilities for reproducing motion, and also investigating fluid-structure interaction (wind is modeled as a fluid) are particularly important to Nabtesco,” says Yokoji.
To create an analytical simulation of the pinion test rig, the engineers started from a global Abaqus/CAE model based on imported CAD geometries of rig, drive, and pinion. The bottom surface of the test apparatus was modeled as fixed. Resistance (this data, including the effect of wind velocity, was provided by a Nabtesco customer) was applied to the reduction gear shaft, and the pinion was rotated at a prescribed angle. This allowed the team to see when and where the opposing teeth engaged as the gears rotated, and what the resulting stresses were.
For a deeper understanding of what happens when the teeth interact, the engineers needed to mesh the relatively small area of tooth-face contact with particularly fine C3D8R elements. To reduce computation time for this portion of the model, they
(Left) Smaller pinion gear engages with outer ring gear. Note that rotation angle where teeth intersect is very small; this can contribute to gear tooth damage over time. A small contact area (red, center) between teeth can be optimized with CAE analysis (red, right) to decrease average stress and prolong gear life.
created a submodel that contained only those areas of acute interest. When compared against the painted gear rig tests, the FEA results showed good agreement.
“We still wanted to get a complete picture of how the total contact area and stresses fluctuated over the course of the entire engagement processes,” says Yokoji. “This would provide us with the ‘big picture’ of contact history that we needed for evaluating tooth designs for durability.” So his team developed a proprietary post-processing technique that employed an Abaqus user subroutine to show the history of how stress developed from the start of engagement, through changes in the rotation angle, to the end of engagement. Now they had a complete toolset to start fine-tuning individual pinion tooth shape.
Optimizing gears with Isight resulted in a design that lowered contact stress across the entire surface.
Modified design 1
Isight workflow
Modified design 3

11www.3ds.com/simulia
Industrial Equipment—Turbomachinery
Optimizing the analysis with Isight
At this point the group turned to Isight process automation and optimization software, coupling their own in-house program for creating contact stress distribution history into the workflow. This allowed them to quickly generate clear results from huge result files and evaluate both the immediate (stress) and the long-term (strength/durability) consequences of every design change. They then plotted the results into three-dimensional stress distribution graphs that tracked all phases of gear engagement and let them see how modifying gear crowning contours affected overall performance.
“Our CAE workflow now enables us to optimize crowning of pinion gear teeth designs accurately and with far less manpower than before,” says Yokoji. “This method reduces design times dramatically.”
Nabtesco’s newly designed gears are just being introduced into the field and the company is gathering data to generate accurate comparisons with previous models. “We believe that there will be a significant improvement in durability,” says Yokoji. “Abaqus and Isight give us confidence that we can design durable gears that can stand up to the rigors of wind power generation.”
For More Information www.nabtesco.com/en/index.html

12www.3ds.com/simulia
Industrial Equipment—Turbomachinery
Rotordynamics Analysis using Abaqus/StandardYoungwon Hahn (Dassault Systèmes)
Acknowledgements
Dassault Systèmes SIMULIA would like to thank the students and faculty in the ROMAC Laboratory at the University of Virginia.
Summary
A wide variety of industrial machines employ rotating structures supported by bearings. Turbines, jet engines, computer disk drives and electric motors typify the use of spinning, shaft mounted, rotor-bearing structural systems. Any unbalance in such a system can introduce unwanted vibration; the area of engineering analysis that quantifies the dynamic behavior of such systems is known as rotordynamics.
While the vibration in a rotor-bearing system includes axial, lateral, and torsional components, the lateral vibration is the most critical because it is generally the principal cause of structural failures in rotor-bearing systems.
In this Technology Brief, a typical workflow for rotordynamics analysis using Abaqus is demonstrated. The results compare favorably with those from industry-standard codes from the University of Virginia’s Rotating Machinery and Controls Laboratory (commonly known as ROMAC). A substructuring application is also discussed.
Introduction
The lateral vibration of a rotating system can be analyzed by stability analysis and unbalanced frequency response analysis. In Abaqus/Standard, the stability analysis is based on a complex frequency extraction to identify the resonance, or critical, spin speed. In order to consider the rotational or spin speed of the rotor, the stability analysis must include gyroscopic effects. In the frequency response analysis, the principal item of interest is the unbalanced load, generally introduced by the unbalanced mass of the structure. Both the stability analysis and the unbalanced frequency response analysis can be performed in Abaqus/Standard using beam elements or three dimensional (3-D) solid elements.
A rotordynamics model typically consists of the rotor, disks, and bearings. The rotor and disks are normally modeled with beam and point mass/inertia elements. When the rotor geometry is very complex, 3-D models can achieve more accurate results; however, this comes at the expense of increased compute time. Figure 1 shows a beam model and a 3-D solid model for a rotor.
Key Abaqus Features and Benefits
• Special rotordynamics loading to capture the centrifugal load effects and load stiffness terms associated with spinning bodies
• Connector elements for modeling the frequency dependent stiffness and damping behavior of rotor bearings
• Substructuring capabilities for improved computational efficiency
Finite Element Analysis Approach
For the present analysis, beam elements are used for the structure. Connector elements are used to model the stiffness and damping of the bearings, since they support frequency dependent cross-coupling properties.
A stability analysis is first performed with a rotor and bearing model. Then an unbalanced frequency analysis is performed to identify the response of the rotor. Even though a rotordynamics model can be modeled directly in Abaqus/CAE, SIMULIA has developed a spreadsheet tool [1] using Excel and Visual Basic (VBA) that simplifies the development and post processing of rotor-bearing models in Abaqus (see Figure 2). Finally, examples using substructures are introduced and the results are discussed.
Rotor and Bearings
The analysis described in this Technology Brief is performed using the rotor shown in Figure 1, with section data taken from an API 684 [2] reference rotor model for a 12 MW steam turbine. A beam element model is created using the VBA
Figure 1: Beam (left) and 3-D solid (right) representations of a rotor-bearing system
Figure 2: Screen capture of the spreadsheet tool for rotor section and bearing property data definition

13www.3ds.com/simulia
Industrial Equipment—Turbomachinery
spreadsheet tool. The bearing properties [3] in Tables 1 and 2 are used to represent the frequency dependent stiffness and damping characteristics. The stiffness and damping coefficients K11 and C11 are the respective properties in the X-direction on the bearing plane (the spin axis is the Y-axis). K12 and C12 are the cross-coupling terms of the bearing stiffness and damping coefficients. Typically, the bearing coefficients are defined in two orthogonal directions on the plane.
Figure 2 shows a screen capture of the VBA spreadsheet used to set up the rotor section and bearing property data. The VBA tool streamlines model development by automatically creating an input file for a beam element model or a Python script to generate the input file for a 3-D solid model.
Stability Analysis
A stability analysis can be performed with Abaqus using a complex frequency extraction. Since the subspace projection method is used for this procedure, a real frequency extraction is required prior to the complex frequency extraction in order to create the modal space for the projection.
The effect of the rotor spin speed can be considered by applying the rotordynamic load ROTDYNF in a general static step prior to the frequency extraction step. There are two ways to consider the spin effect, which is gyroscopic: 1) in the stationary reference frame, and 2) in the moving reference frame. When the gyroscopic effect is considered in a fixed (stationary) reference frame, the complex frequency calculated in the stationary reference system represents a complex frequency in the real world. However, when the gyroscopic effect is considered in a reference frame which moves with the
rotating body, the complex frequency calculated in the moving reference system does not include the effect of the spin speed of the rotating body. Hence, the complex frequency calculated in a moving reference frame must be adjusted by adding or subtracting the spin speed in order to represent the complex frequency in the stationary reference frame.
Typically, the stationary reference frame approach is used in a rotordynamics analysis when considering the gyroscopic effect since it provides the correct whirl frequency; i.e., the complex frequency that shows the whirling mode shape. However, the stationary reference frame approach is limited in that it can only be applied to a body of revolution. The rotordynamic load in Abaqus, ROTDYNF, is calculated based on the stationary reference frame.
Since the stability analysis should be performed for several spin speeds, a step definition for each desired speed is necessary; these steps can be easily created using the VBA spreadsheet. Once the rotor section data and spin speeds are entered as shown in Figure 2, the spreadsheet tool creates the analysis input file automatically.
Stability analysis results for a spin speed of 2000 RPM are shown in Table 3 and compared to those obtained with the ROMAC codes. The difference between the results is less than 0.2%. Figure 3 shows an orbit plot at the 6th non-zero mode for the 2000 RPM spin speed case.
One of the most important results obtained from a stability analysis is the Campbell diagram. The Campbell diagram is a plot of the whirl frequency versus spin speed, with each whirl frequency having the same whirl mode connected with a line.
Figure 3: Orbit plot at the 6th non-zero mode, 2000 RPM case
Table 1: Bearing stiffness (lbf/in)
Speed (RPM) K11 K12 K21 K22
2000 3.86E+01 3.61E+01 8.19E+01 5.26E+04
6000 5.78E+04 -1.28E+02 1.02E+02 6.80E+04
12000 7.56E+04 -2.74E+02 2.58E+02 8.38E+04
16000 9.19E+04 -4.83E+02 4.75E+02 9.91E+04
20000 1.06E+05 -7.55E+02 7.53E+02 1.12E+05
24000 1.18E+05 -1.09E+03 1.09E+03 1.24E+05
Speed (RPM) C11 C12 C21 C22
2000 5.45E+02 0.00E+00 0.0E+00 4.96E+02
6000 54.50E+02 0.00E+00 0.0E+00 4.75E+02
12000 3.92E+02 0.00E+00 0.0E+00 4.05E+02
16000 3.50E+02 0.00E+00 0.0E+00 3.58E+02
20000 3.15E+02 0.00E+00 0.0E+00 3.21E+02
24000 2.87E+02 7.56E-01 -1.01E+00 2.91E+02
Table 2: Bearing damping coefficients (lbf•s/in)
Table 3: Comparison of Abaqus and ROMAC stability analysis results

14www.3ds.com/simulia
Industrial Equipment—Turbomachinery
It is used to identify operating conditions that could lead to damaging excitation of natural frequencies in the rotor-bearing system.
The VBA spreadsheet can also be used as a postprocessing tool to generate Campbell diagrams from Abaqus results. Figure 4 shows an example Campbell diagram and semi-minor plot. The whirl direction can be identified by the sign of the semi-minor value. A positive value denotes the forward whirl direction and a negative value denotes the backward whirl direction. The reference line in the Campbell diagram represents the excitation or “per rev” line, and any intersection point between the reference line and the same whirl mode line indicates a resonance point. The corresponding spin speed at this point is called the critical speed. In Figure 4, we have identified three critical speeds (9,941 RPM, 11,033 RPM, and 17,374 RPM). The VBA spreadsheet also provides the critical speeds in an external text format file.
Unbalanced Frequency Response Analysis
The unbalanced frequency response analysis can be performed using the steady state dynamics procedure. Since the gyroscopic effect is treated as a damping effect in Abaqus, only a direct or subspace-based steady state dynamic analysis can be used. The unbalanced mass effect can be modeled using concentrated forces with imaginary or real options.
The VBA spreadsheet is also used to automatically create the unbalanced frequency response model. The unbalanced load can be defined using a magnitude and phase angle in the spreadsheet. The internal VBA script in the spreadsheet converts the magnitude and phase angle to the real and imaginary format used in the analysis input file.
As shown in Figure 5, the unbalanced loads are applied at three different points on the rotor with different phase angles. The response results on the 1st probe, which is marked with a circled x at the center of the rotor in Figure 5, are compared with the results from the ROMAC codes in Figure 6. The magnitudes and phase angles predicted by Abaqus correlate well with the ROMAC results.
Substructuring
Abaqus/Standard offers a substructuring capability that allows you to create a reduced model that captures the reduced modal space of the target structural model, but that can run substantially faster than the full model. Abaqus also has the unique capability to create substructures for both the stationary and rotating structures. The rotor and support plate model shown in Figure 7 illustrates the substructure capability for rotordynamics analysis. The rotor is located at the end of the cantilevered support plate, which is modeled with solid elements and the connected rotor is modeled with coupling and connector elements.
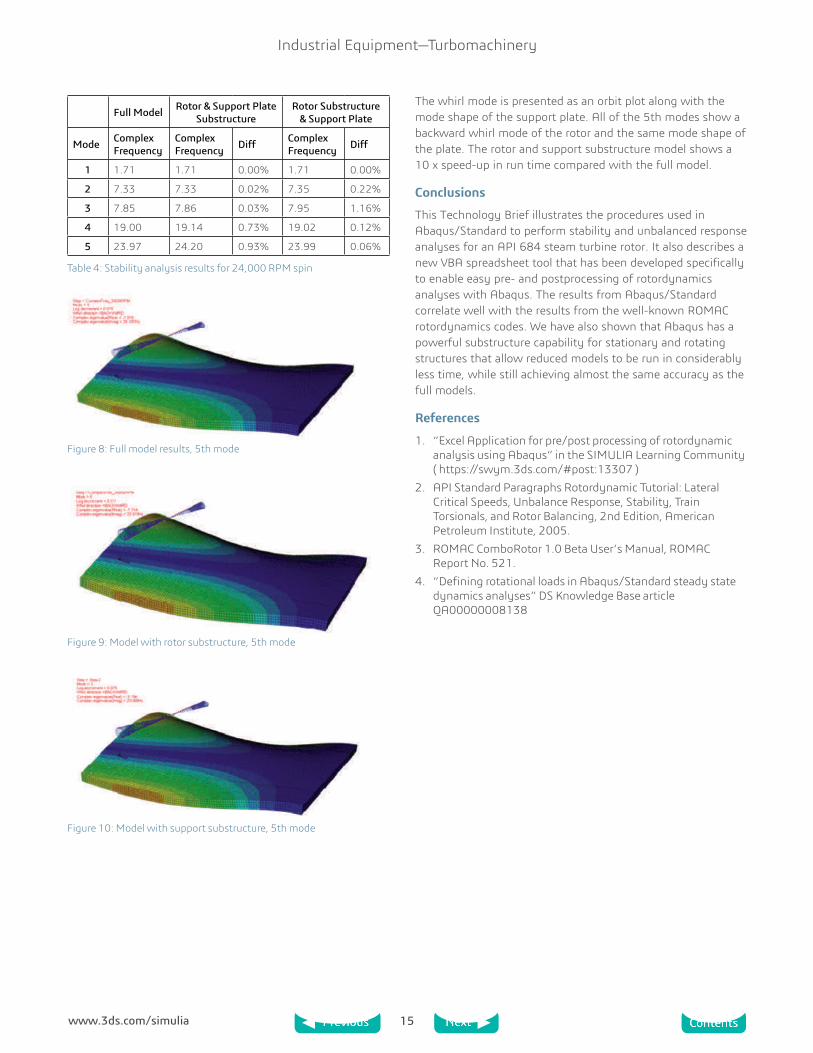
A complex frequency extraction analysis for a rotor spin speed of 24,000 RPM is performed for three different models: 1) full model: the rotor and support plate are modeled without substructures; 2) rotor & support substructure: the support plate is modeled as a substructure with the full rotor model; and 3) rotor substructure & support plate: the rotor at the 24,000 RPM spin speed is modeled as a substructure in the full support plate model.
As shown in Table 4, the complex frequency results from the three models are very similar. The 5th mode shapes for the three models are shown in Figures 8, 9 and 10 respectively.
Figure 4: Campbell diagram (left) and semi-minor plot (right)
Figure 5: Unbalanced loads and probes on the rotor
Figure 6: Response results from Abaqus and ROMAC
Figure 7: Example model of rotor and support plate
15www.3ds.com/simulia
Industrial Equipment—Turbomachinery
The whirl mode is presented as an orbit plot along with the mode shape of the support plate. All of the 5th modes show a backward whirl mode of the rotor and the same mode shape of the plate. The rotor and support substructure model shows a 10 x speed-up in run time compared with the full model.
Conclusions
This Technology Brief illustrates the procedures used in Abaqus/Standard to perform stability and unbalanced response analyses for an API 684 steam turbine rotor. It also describes a new VBA spreadsheet tool that has been developed specifically to enable easy pre- and postprocessing of rotordynamics analyses with Abaqus. The results from Abaqus/Standard correlate well with the results from the well-known ROMAC rotordynamics codes. We have also shown that Abaqus has a powerful substructure capability for stationary and rotating structures that allow reduced models to be run in considerably less time, while still achieving almost the same accuracy as the full models.
References
1. “Excel Application for pre/post processing of rotordynamic analysis using Abaqus” in the SIMULIA Learning Community ( https://swym.3ds.com/#post:13307 )
2. API Standard Paragraphs Rotordynamic Tutorial: Lateral Critical Speeds, Unbalance Response, Stability, Train Torsionals, and Rotor Balancing, 2nd Edition, American Petroleum Institute, 2005.
3. ROMAC ComboRotor 1.0 Beta User’s Manual, ROMAC Report No. 521.
4. “Defining rotational loads in Abaqus/Standard steady state dynamics analyses” DS Knowledge Base article QA00000008138
Figure 10: Model with support substructure, 5th mode
Figure 9: Model with rotor substructure, 5th mode
Figure 8: Full model results, 5th mode
Table 4: Stability analysis results for 24,000 RPM spin
Full Model Rotor & Support Plate Substructure
Rotor Substructure & Support Plate
Mode Complex Frequency
Complex Frequency Diff Complex
Frequency Diff
1 1.71 1.71 0.00% 1.71 0.00%
2 7.33 7.33 0.02% 7.35 0.22%
3 7.85 7.86 0.03% 7.95 1.16%
4 19.00 19.14 0.73% 19.02 0.12%
5 23.97 24.20 0.93% 23.99 0.06%

16www.3ds.com/simulia
Industrial Equipment—Turbomachinery
© ALSTOM 2013. All rights reserved. Information contained in this document is indicative only. No representation or warranty is given or should be relied on that it is complete or correct or will apply to any particular project. This will depend on the technical and commercial circumstances. It is provided without liability and is subject to change without notice. Reproduction, use or disclosure to third parties, without express written authority, is strictly prohibited.
Multi-disciplinary Optimization of Turbine Components with the Aid of Surrogate Modeling TechniquesIain Niven and Mark Willetts (Alstom)Abstract: Turbomachinery components design and optimization process requires a multi disciplinary approach. These components are designed and optimized for aerodynamic efficiency with robust mechanical integrity requirements. Further analyses are also required for thermal stresses, rotor dynamics, acoustics and other design requirements The analyses require different tools (in-house and commercial) which must be integrated within a fully automated process. The calculation time for these calculations, particularly for CFD, could be a limiting factor for the number of iterations used. In order to ensure the widespread adoption of this automated process throughout the design and engineering organisation a generic process framework is being developed together with supporting software tools.This allows different types of analysis to be included in the framework process and the resulting analysis process to be easily applied to different design problems. This paper presents the approach to integrate multi-disciplinary tools within an automated process and describes the use of surrogate modeling techniques to reduce the time to execute these calculations. The development and use of the analysis framework process and supporting tools is also described.
Keywords: Isight, Coupled Analysis, Design Optimization, Multi-disciplinary Optimization, Seals, Turbines.
1. Introduction
Alstom Power is a global leader in power generation systems, products and services. Computer- aided design (CAD) and engineering (CAE) tools are used extensively in our product design and analysis processes. A typical product or component design process involves the use of computational fluid dynamics (CFD), and finite element (FE) models for stress and life analysis. Analyses of vibration and heat transfer behaviour are also required. These analyses tend to be computationally costly, typically the CPU time for running one analysis case can range from minutes to hours. For this reason, design optimisation using full engineering analysis is often impractical. A pragmatic approach is to use surrogate models to support the design optimisation process. With the appropriate choice of surrogate model type and good sampling plan, the surrogate model can closely approximate the response function.
Ensuring the widespread adoption of optimisation techniques throughout the design and engineering organisation requires a simple way of introducing automation and optimisation into analysis processes in different disciplines and for different applications. The Methodologies for Tools department has developed an automated build process applied to standardised process templates which provides this, allowing the complexity of setting up the automation and optimisation and handling of different analyses to be captured in the template processes.
This paper describes the process templates and the build process, the use of surrogate models generated from the results of the CAE analysis, and gives examples of the process applied to steam turbine design.
2. CAE process automation
The Methodologies for Tools department has performed many CAE optimisation projects using Isight, some of these using robust design and Design For Six Sigma (DFSS) techniques. These have been set up on a case-by-case basis, building on previous experience and covering several types of analysis; CFD, FE, Heat Transfer, Vibration analysis, and also applying coupling between different analyses. These projects have been used for research into optimisation methods, and have demonstrated great potential benefits.
Optimisation of a CAE analysis (e.g. CFD, FE) is typically set up by an expert in the type of analysis gradually building the process into an Isight model for each specific case, and applying optimisation once the analysis process has been automated. This procedure must be repeated for each new case and therefore requires significant Isight model development effort.
In order to deploy the techniques throughout the design and engineering organisation, the lessons learned from the earlier research have been used to develop a flexible, deployable CAE process comprised of Isight process templates and supporting tools including a program which builds process models for specific analysis cases from a process templates.

17www.3ds.com/simulia
Industrial Equipment—Turbomachinery
© ALSTOM 2013. All rights reserved. Information contained in this document is indicative only. No representation or warranty is given or should be relied on that it is complete or correct or will apply to any particular project. This will depend on the technical and commercial circumstances. It is provided without liability and is subject to change without notice. Reproduction, use or disclosure to third parties, without express written authority, is strictly prohibited.
Figure 1. Template process model for CFD and MI analysis, showing mapping of parameters between components The use of a standardised automation process applicable to different types of problem and to different types of analysis reduces this duplication of work and simplifies the set-up task for each new analysis. A further benefit is that improvements made to the process are available to all users.
A basic “framework” process template has been designed to allow different types of CAE analysis to be incorporated easily. An example of CFD and Mechanical Integrity (MI) analyses integrated into the framework process is shown in Figure 1.
3. Automatic generation of CAD-CAE analysis process models
3.1 Automated parameter extraction from CAD models
The most obvious difference between two different applications of a CAE analysis is often the geometry. Usually geometric parameters will be included in the control factors of the optimization. Therefore the geometry must be parameterised so that it can be controlled by the automated process and these parameters must themselves be included in the process model.
Changes to the model geometry will affect other dimensions which need to be measured, either to be used as constraints on the optimisation, or as inputs to the CAE analysis. These measurements must also be defined in the CAD model.
Figure 2. Parameters and Measures in a CATIA CAD part
The process model building program uses simple text files to define and set parameters and dimensions in the process model when it is built from the template process. The text files are themselves generated by another program which interrogates the parameterised CAD geometry (Figure 2).

18www.3ds.com/simulia
Industrial Equipment—Turbomachinery
© ALSTOM 2013. All rights reserved. Information contained in this document is indicative only. No representation or warranty is given or should be relied on that it is complete or correct or will apply to any particular project. This will depend on the technical and commercial circumstances. It is provided without liability and is subject to change without notice. Reproduction, use or disclosure to third parties, without express written authority, is strictly prohibited.
Figure 3. Flowchart of CAD Model Preparation process
This allows different geometries with different parameterisations to be controlled by a standard process.
3.2 Automated CAE geometry generation
A CATIA CATScript program applies the parameter values to the CAD geometry and takes measurements from the updated geometry. Each CAE analysis process also runs a similar program to apply CAE-specific operations to the CAD model and generate the form of the geometry required by the CAE analysis (Figure 3).
Figure 4. Flowchart of CAD Model Preparation process
3.3 Automated generation of CAD-CAE analysis process models
Because the Isight process needs to contain an internal parameter for each CAD model parameter and dimension, these must be inserted into the template process. The process builder program does this. The builder program also copies and maps parameters between Isight process components and sets up the data exchange operations between input and output files (Figure 4).
The template process contains many configuration parameters and also some parameters used to control the process builder program. These parameters are grouped in the template process using Isight’s parameter grouping capability. As the process builder inserts the new parameters these are put into new groups. (Figure 5)

19www.3ds.com/simulia
Industrial Equipment—Turbomachinery
© ALSTOM 2013. All rights reserved. Information contained in this document is indicative only. No representation or warranty is given or should be relied on that it is complete or correct or will apply to any particular project. This will depend on the technical and commercial circumstances. It is provided without liability and is subject to change without notice. Reproduction, use or disclosure to third parties, without express written authority, is strictly prohibited.
Figure 5. Flowchart of CAD Model Preparation process
Isight expert knowledge is captured in the template process, allowing the CAE domain expert to run complex automated processes using their domain knowledge.
4. Optimisation using Surrogate Models
At Alstom Power, the Methodology for Tools department has benchmarked different types of surrogate models, including polynomial response surface model (RSM), radial basis function (RBF) and Kriging, against a number of test functions with different response characteristics. Kriging coupled with optimised Latin hypercube has been found to be highly flexible and has outperformed the other benchmarked models in most cases, ranging from the relatively smooth response surfaces to the highly non-linear multi-modal problems. (Figures 6 and 7)
Figure 6. Kriging vs true response for 2D Schwefel function

20www.3ds.com/simulia
Industrial Equipment—Turbomachinery
© ALSTOM 2013. All rights reserved. Information contained in this document is indicative only. No representation or warranty is given or should be relied on that it is complete or correct or will apply to any particular project. This will depend on the technical and commercial circumstances. It is provided without liability and is subject to change without notice. Reproduction, use or disclosure to third parties, without express written authority, is strictly prohibited.
Once confidence has been established with a surrogate model, it has been applied to engineering design optimisation. The test cases shown in this paper relate to the turbomachinary design, where the response surfaces are not explicit analytical functions but solutions from a host of engineering tools. For these test cases, the main objective is not to obtain a high fidelity approximation model throughout the design space, but to achieve improved performance. Both test cases are single objective optimisation problems. In one case, the objective is to minimise the leakage flow through a labyrinth seal in an Alstom steam turbine. In the other case, the objective is to maximise the aerodynamic efficiency of a steam turbine. Using an optimised Latin hypercube sampling plan, a Kriging model was constructed for each case. Optimisation was then performed on the surrogate model to find the optimal design point. The design variables were then fed into the full engineering analysis, to evaluate the true response at this “optimal” point. This true response was compared to the optimal objective function obtained from full optimisation runs, with certain computation budget constraints. A description of these test cases and results is provided in the following sections.
Figure 7. Adaptive sampling applied to Kriging model of 2D Schwefel function
5. Example: Seal Leakage reduction
The unavoidable leakage flow between the rotor and the static components erodes the turbine efficiency. Seals are used to reduce the leakage flow. For the labyrinth seal optimisation test case, the objective is to minimise or control the leakage flow through the optimal design of the seal geometries, while the boundary conditions are determined by the main flow. The leakage flow is dependent on a number of geometric design parameters, such as the mean thickness and tip thickness, height, and lean angle of individual fins.(Figure 8)

21www.3ds.com/simulia
Industrial Equipment—Turbomachinery
© ALSTOM 2013. All rights reserved. Information contained in this document is indicative only. No representation or warranty is given or should be relied on that it is complete or correct or will apply to any particular project. This will depend on the technical and commercial circumstances. It is provided without liability and is subject to change without notice. Reproduction, use or disclosure to third parties, without express written authority, is strictly prohibited.
Figure 8. Schematic of labyrinth seal between turbine rotor and static components
This analysis used CATIA V5 for geometry creation, Centaur for Mesh generation and Fluent as the CFD solver. Typical computational time for a single calculation was about 15 min.
Through Design of Experiments, the number of main geometric design variables affecting the leakage flow was screened to four. A Kriging model of the leakage flow versus these four parameters was created, using an optimised Latin hypercube with 50 points. In the search for the optimal solution, a 50 level full factorial sweep was carried out within the design parameter boundaries, resulting in 6.25 million evaluations of the surrogate function that takes about two minutes on a single core of a PC with 2.66GHz Intel Core(TM)2 Quad CPU. This optimal point was then fed into the full engineering analysis to obtain a validation value, which was then compared with the results obtained by full optimisation. The full optimisation was conducted using the downhill simplex or evolutionary algorithm in Isight, prescribing a budget of 1000 evaluation points for each of these algorithms.
The lowest leakage flow from the initial 50 points optimised Latin hypercube has been used as the reference for assessing the optimisation results. With surrogate model assisted optimisation, leakage flow reduction of 1.1% has been achieved. By comparison, full optimisation achieved a leakage reduction of 0.8% using downhill simplex, and a reduction of 1.4% using the evolutionary algorithm. While these results clearly show the benefit of surrogate model assisted optimisation, they also indicate its limitations.
A further study used the same test case to investigate the performance and suitability of different types of surrogate models (Badjan, 2013). Surrogate models tested included Polynomial models, Radial Basis Functions, Kriging and two types of Neural Network – Feed-forward Back- Propagation (FFBP NN) and Dynamic Threshold (DTNN). Some of the normalised results from this study are shown in Figure 9.
Figure 9. Seal Leakage surrogate models and interpolation of Full Factorial Design of Experiments study

22www.3ds.com/simulia
Industrial Equipment—Turbomachinery
© ALSTOM 2013. All rights reserved. Information contained in this document is indicative only. No representation or warranty is given or should be relied on that it is complete or correct or will apply to any particular project. This will depend on the technical and commercial circumstances. It is provided without liability and is subject to change without notice. Reproduction, use or disclosure to third parties, without express written authority, is strictly prohibited.
6. Example: Turbine flow path design optimisation
The objective of this test case was to maximise the aerodynamic efficiency for a given turbine flow path design. The aerodynamic efficiency is strongly affected by the distribution of flow and pressure field along the flow path. The aerodynamic efficiency was calculated using the Alstom in-house tool Prel.
There were initially 11 independent design variables for this study, defining both the geometry and operating conditions. Using DOE screening, the 6 most significant parameters were selected for optimisation.
A Kriging model was created for the aerodynamic efficiency, using these 6 parameters as independent variables, and 100 optimised Latin hypercube sampling points. A full sweep was performed on the Kriging model using 20 levels for each parameter to search for maximum efficiency, which made 64 million calls to the surrogate model and takes about one hour on a single core of a PC with 2.66GHz Intel Core(TM)2 Quad CPU. A further Prel run was carried out to validate the predicted efficiency at the surrogate model derived optimal point.
The surrogate assisted optimal solution was compared to the solutions from full optimisation, using a downhill simplex or evolutionary algorithm in Isight. The Prel calculation is “very fast”, each evaluation taking about 10 seconds. For the downhill simplex, 1000 evaluations were allocated. For the evolutionary algorithm, 10,000 evaluations were allocated, which takes just over a day to complete.
The optimal solutions are normalised against the original 100 Latin Hypercube points. The lowest efficiency of the sampling plan was normalised to 0, and highest to 1. The surrogate assisted optimal solution achieved a normalised efficiency 1.048. By comparison, the “full” optimal solution returned a value of 1.025 and 1.038 for the downhill simplex and evolutionary algorithm respectively.
It is clear that the downhill simplex quickly converges to a local optimum: the optimal solution was obtained at 112th evaluation. For the evolutionary algorithm, the current optimal was obtained at 3482nd out of 10,000 iterations. It is likely that the evolutionary algorithm can obtain a better solution if more iterations were allocated. Nevertheless, the usefulness of surrogate- assisted optimisation is clearly demonstrated in this case.
7. Conclusion
The application of optimisation techniques offers great benefits in turbine component design. The computationally expensive nature of many CAE simulations, especially CFD, necessitates the use of surrogate models for many of these analyses. Work on different aspects of turbine component design has demonstrated the effectiveness of surrogate models for design optimisation.
A standardised automated integrated CAD-CAE process framework and supporting tools is under development in the Methodology for Tools department of Alstom Power to facilitate widespread adoption of surrogate-model based optimisation throughout the engineering design organisation. This framework simplifies the automation of complex multi-disciplinary CAE processes and thereby the generation of surrogate models of turbine components for their optimisation.
8. References
1. Badjan, Gianluca, “Evolution of Surrogate Modelling Methods for Turbo-Machinery Component Design Optimisation”, MSc thesis, University of Trieste, 2013

23www.3ds.com/simulia
Industrial Equipment—Turbomachinery
DOE Analysis for Internal Cooling Configuration of Gas Turbine BladeDavide Pinna (Ansaldo Energia) Francesco Cittadella (Exemplar)
Abstract: Today manufacturing companies are more and more often characterized by a growing complexity of products and processes. Projects need the participation of teams that have to collaborate in a multidisciplinary and integrated way.
The gas turbine blade design process is typically multidisciplinary where the variables of one discipline can strongly influence the results of other disciplines.
For this reason it is important to have a single simulation process that can correlate the different I/O and allow an investigation of the entire Design Space, in order to verify even those solutions that are hardly predictable.
The application of optimization techniques and simulation-driven design improve and accelerate the multidisciplinary simulation analysis, in order to obtain the best product in terms of technological innovation, performance and quality, starting with the early design conception.
This paper is focused on a gas turbine blade where both the thermal and mechanical disciplines are involved. The model of the complete process, implemented in the SEE-Fiper environment and involving all the calculation tools, is described. The target of the project is the Design Space exploration (DOE Analysis) to identify a better internal cooling configuration in order to achieve a blade with simpler machining that also satisfies the criteria of minimum creep life and minimum fatigue life. The results obtained by considering many optimization variables are reported.
Keywords: Collaborative Engineering, Design of Experiments (DOE), Design Optimization, Gas Turbine Blade, Isight, Multidisciplinary Process, Data and Process Management, Process Automation, Turbomachinery.
1. Introduction
Ansaldo Energia (AEN), a company of the Finmeccanica Group (55%) and First Reserve (45%), is Italy’s leading producer of thermoelectric power plants including process, mechanical, civil, installation and start-up engineering. The production centre is split into three product lines: gas turbines, steam turbines and generators.
Among the components designed in AEN, one of those with higher-tech is certainly the gas turbine blade. It includes various types of challenges: strength, durability, flexibility and maintainability.
The project described in this paper concerns the design and implementation of an automatic multidisciplinary process for thermo-mechanical analysis of gas turbine blades, capable of handling both standalone activities and optimization activities, and that requires the launch of multiple runs of the same process.
This process has been applied to the exploration of the Design Space for the identification of a new configuration of internal cooling, in order to obtain a blade with greater creep and fatigue life and with a lower air consumption.
As shown in Figure 1, the internal geometry of the airfoil of the blade examined is composed of 13 channels along its length that supply cooling air in order to reduce the metal temperature. Special provisions (ribs) are applied on the surface of these channels in order to increase the heat transfer.
Figure 1. Blade views with internal cooling channels (left) and cooling flow exit holes at blade tip (right)
24www.3ds.com/simulia
Industrial Equipment—Turbomachinery
The disciplines involved in the analysis are the heat transfer and mechanical integrity.
The activities carried out are:
• The creation of an automated and repeatable procedure for the thermo-mechanical calculation.
• The implementation of macros for the calculation and the post-processing of the FEM results.
• The process validation.
• Design of Experiments analysis (DOE).
• Results analysis and identification of the optimized solutions.
• An approach to the distributed calculation.
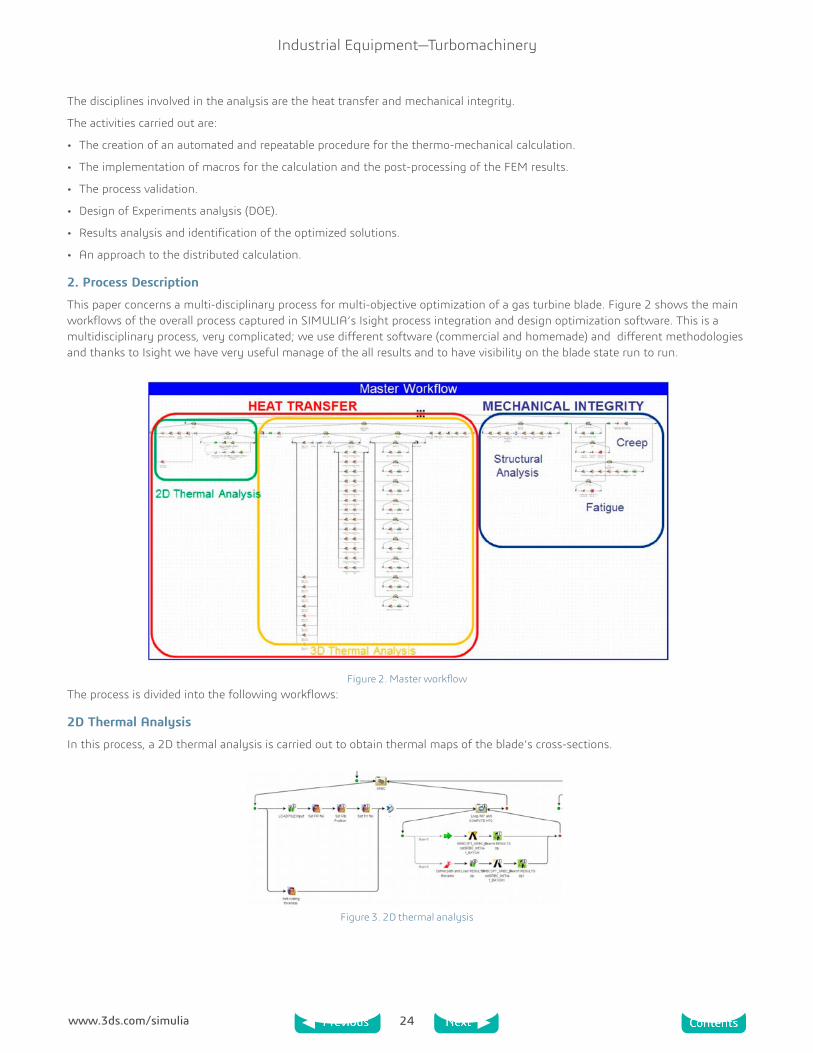
2. Process Description
This paper concerns a multi-disciplinary process for multi-objective optimization of a gas turbine blade. Figure 2 shows the main workflows of the overall process captured in SIMULIA’s Isight process integration and design optimization software. This is a multidisciplinary process, very complicated; we use different software (commercial and homemade) and different methodologies and thanks to Isight we have very useful manage of the all results and to have visibility on the blade state run to run.
Figure 2. Master workflow The process is divided into the following workflows:
2D Thermal Analysis
In this process, a 2D thermal analysis is carried out to obtain thermal maps of the blade’s cross-sections.
Figure 3. 2D thermal analysis
25www.3ds.com/simulia
Industrial Equipment—Turbomachinery
Figure 3 shows the components of the 2D thermal analysis process, including the input 2D mesh slices, heat transfer coefficient (HTC) values, boundary temperatures, thermal material properties, and output 2D temperature maps, flow network results, and 2D HTC distribution.
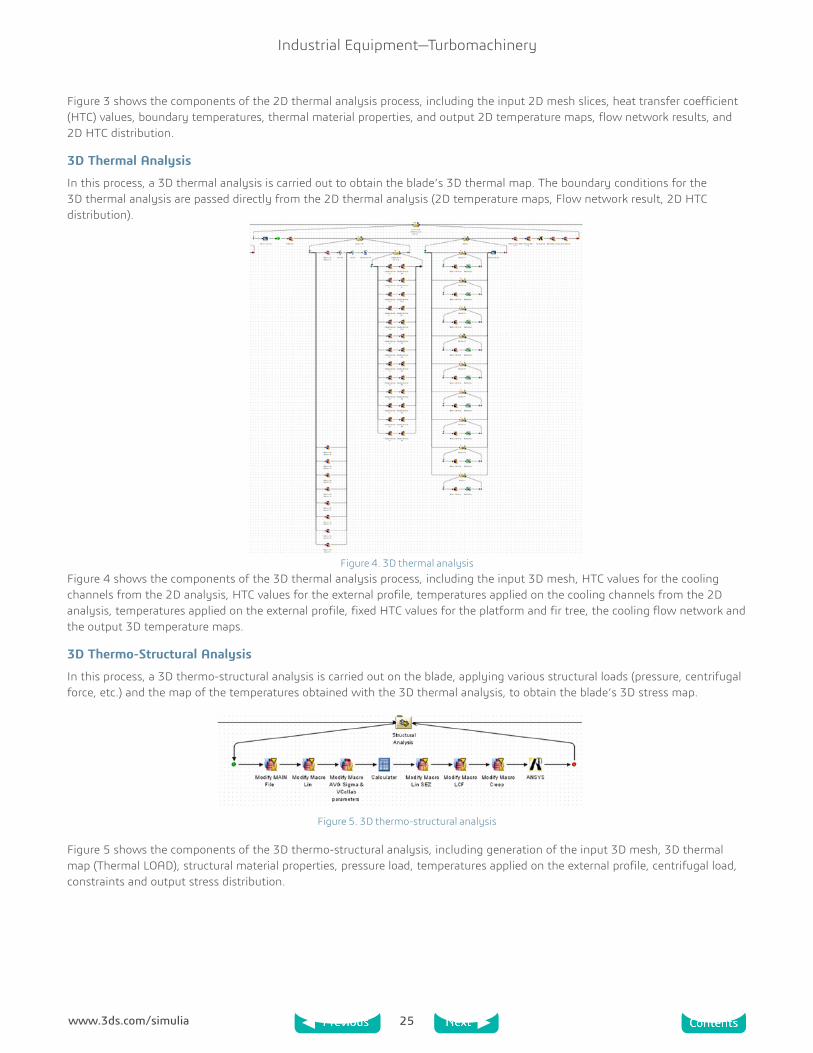
3D Thermal Analysis
In this process, a 3D thermal analysis is carried out to obtain the blade’s 3D thermal map. The boundary conditions for the 3D thermal analysis are passed directly from the 2D thermal analysis (2D temperature maps, Flow network result, 2D HTC distribution).
Figure 4. 3D thermal analysisFigure 4 shows the components of the 3D thermal analysis process, including the input 3D mesh, HTC values for the cooling channels from the 2D analysis, HTC values for the external profile, temperatures applied on the cooling channels from the 2D analysis, temperatures applied on the external profile, fixed HTC values for the platform and fir tree, the cooling flow network and the output 3D temperature maps.
3D Thermo-Structural Analysis
In this process, a 3D thermo-structural analysis is carried out on the blade, applying various structural loads (pressure, centrifugal force, etc.) and the map of the temperatures obtained with the 3D thermal analysis, to obtain the blade’s 3D stress map.
Figure 5. 3D thermo-structural analysis
Figure 5 shows the components of the 3D thermo-structural analysis, including generation of the input 3D mesh, 3D thermal map (Thermal LOAD), structural material properties, pressure load, temperatures applied on the external profile, centrifugal load, constraints and output stress distribution.

26www.3ds.com/simulia
Industrial Equipment—Turbomachinery
Thermo-structural post-processing
The thermo-structural post-processing is divided into three parts, as shown in Figures 6 through 8:
Calculation of the margin of safety
Figure 6. Post processing for margin of safetyCreep analysis (to determine the stress due to creep)
Figure 7. Post processing for creep analysis
Low cycle fatigue (LCF) analysis (to determine the time of fatigue failure)
Figure 8. Post processing for LCF analysis
These processes verify that all the criteria for mechanical integrity are respected.
In order to maintain control of the blade for creep analysis with the Larsson-Miller formula and to reduce dispersions of inconclusive results (peak loads and/or temperature due to the proximity of the boundary conditions or mesh), we decided to check 41 points fixed for each section (9 sections in our case), keeping track of them using dedicated Excel worksheets, as shown in Figure 9.
Figure 9. Examples of Excel data sheets

27www.3ds.com/simulia
Industrial Equipment—Turbomachinery
The LCF process allows us to determinate the fatigue life; in this case we use a Matlab tool created in-house by Ansaldo Energia.
With this automated procedure, the individual processes for the 2D thermal calculation, the 3D thermal calculation, the 3D thermo-structural calculation and the post processing of the results can all be launched in a single run, and studies can be performed by varying in a simple way selected parameters at the beginning of the process.
This project provides for the integration of many processes in Isight which can be distributed to many machines in order to optimize not only the result (i.e. to find a more efficient cooled blade), but also the use of company computing resources to avoid overloading a single machine.
Using this process, we have carried out a DOE (Design of Experiments) analysis composed of 4 different groups to study the trends of results for various cooling passage rib configurations. To make these analyses, we have identified a number of input parameters that can be changed by Isight in order to see their influence on the output parameters and to use as design parameters for optimization.
3. Process Validation
Analyses with a high number of runs need to rely on workflows with low computation times. To this end, we have used a coarse explorative model with 550,000 nodes, as shown in the left side of Figure 10, to reduce analysis time while maintaining an acceptable accuracy of the results. This is a qualitative approach.
The detailed model of about 2 million nodes shown on the right side of Figure 10 will be used for the certification of the blade itself, with the high number of nodes producing results with higher accuracy. This is a quantitative approach.
It is very important to validate this model and validate the process.
Figure 10. Coarse model and detailed model
As illustrated in Figure 11, with the coarse model it is possible to explore more configurations and to find the optimal solution, while with the refined model you can produce a precise analysis for final certification.
28www.3ds.com/simulia
Industrial Equipment—Turbomachinery
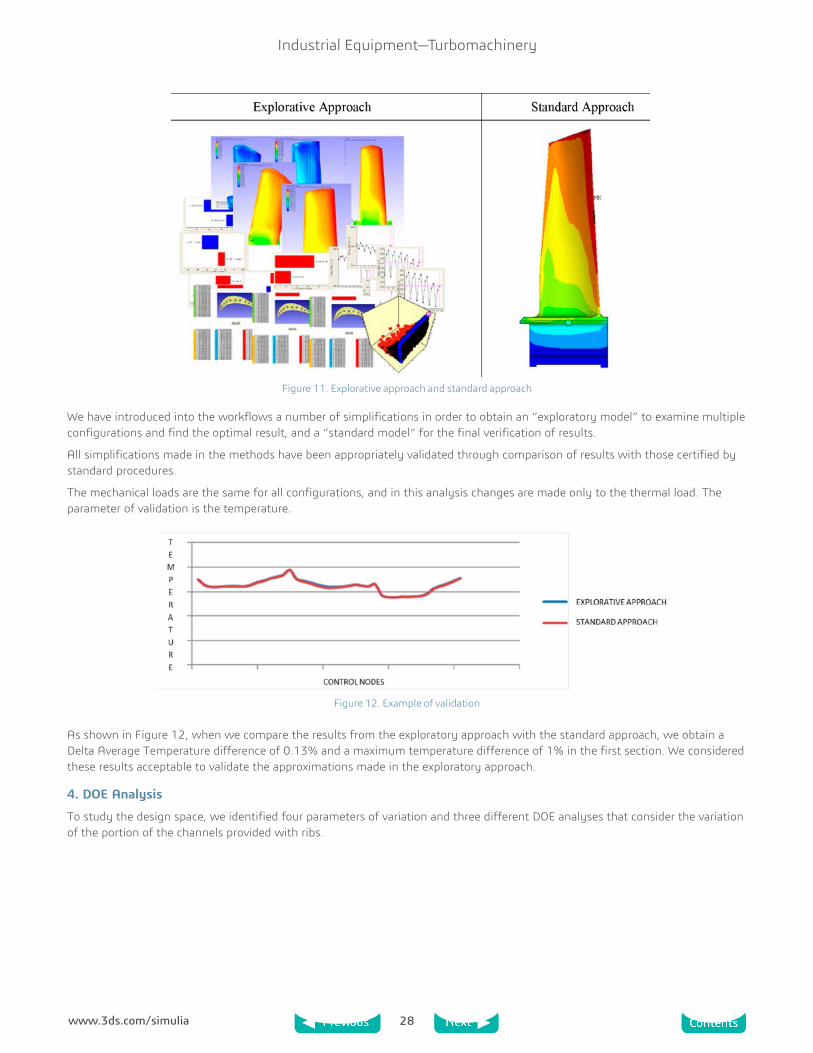
Figure 11. Explorative approach and standard approach
We have introduced into the workflows a number of simplifications in order to obtain an “exploratory model” to examine multiple configurations and find the optimal result, and a “standard model” for the final verification of results.
All simplifications made in the methods have been appropriately validated through comparison of results with those certified by standard procedures.
The mechanical loads are the same for all configurations, and in this analysis changes are made only to the thermal load. The parameter of validation is the temperature.
Figure 12. Example of validation
As shown in Figure 12, when we compare the results from the exploratory approach with the standard approach, we obtain a Delta Average Temperature difference of 0.13% and a maximum temperature difference of 1% in the first section. We considered these results acceptable to validate the approximations made in the exploratory approach.
4. DOE Analysis
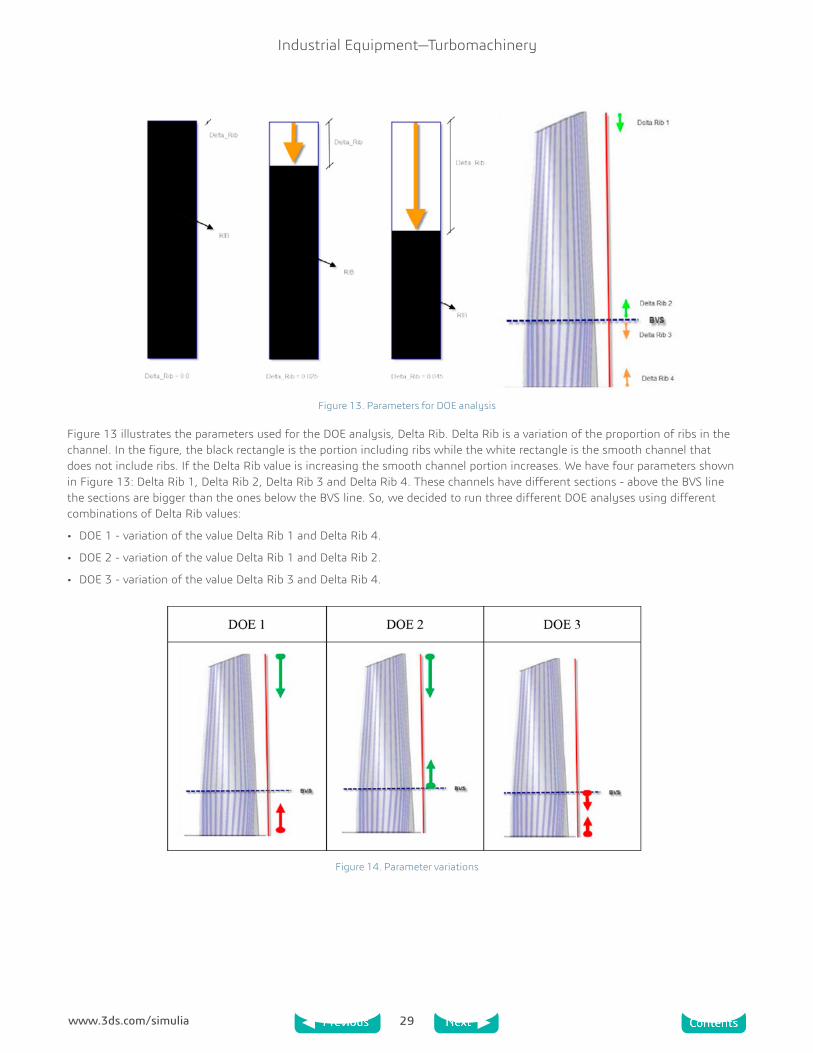
To study the design space, we identified four parameters of variation and three different DOE analyses that consider the variation of the portion of the channels provided with ribs.
29www.3ds.com/simulia
Industrial Equipment—Turbomachinery
Figure 13. Parameters for DOE analysis
Figure 13 illustrates the parameters used for the DOE analysis, Delta Rib. Delta Rib is a variation of the proportion of ribs in the channel. In the figure, the black rectangle is the portion including ribs while the white rectangle is the smooth channel that does not include ribs. If the Delta Rib value is increasing the smooth channel portion increases. We have four parameters shown in Figure 13: Delta Rib 1, Delta Rib 2, Delta Rib 3 and Delta Rib 4. These channels have different sections - above the BVS line the sections are bigger than the ones below the BVS line. So, we decided to run three different DOE analyses using different combinations of Delta Rib values:
• DOE 1 - variation of the value Delta Rib 1 and Delta Rib 4.
• DOE 2 - variation of the value Delta Rib 1 and Delta Rib 2.
• DOE 3 - variation of the value Delta Rib 3 and Delta Rib 4.
Figure 14. Parameter variations

30www.3ds.com/simulia
Industrial Equipment—Turbomachinery
From the first DOE analysis you can note how the elimination of ribs in the cooling passages of the blade leads to a variation of the temperature to be controlled, although it is not excessive. This is because the absence of ribs in the channel leads to a decrease in pressure losses; and since the pressures at input and output of the channel are constant, the pressure difference will cause the cooling flow to increase even more in the first sections of the blade.
The results of the first DOE show that the blade performs well even in the absence of ribs, as the analysis was carried out taking into account the channels as though they were all smooth and the objective was to minimize the flow of cooling air. Without adjusting platelets that regulate the cooling air flow or inserting more ribs, the only way to reduce the cooling flow rate of the blade is to reduce the diameters of the holes in of the blade, as shown in Figure 15.
Figure 15. Hole diameters as new parameters for four DOE analyses
5. SEE (formerly Fiper)
This process is implemented in the SIMULIA Execution Engine (SEE) structure. With the use of the SEE, it is possible to share various standard processes through the company’s IT resources.
A custom WebTop also has been implemented so that each of Ansaldo Energia’s users is able to run and manage the process with the ability to modify input files and parameters directly from the browser.
6. Results
Based on the DOE data mentioned above, we have been able to analyze all the results obtained (temperature maps, maps and trends for stress, and variations of the cooling flow rate) for each configuration to help identify new cooling configurations.

31www.3ds.com/simulia
Industrial Equipment—Turbomachinery
Figure 16. Examples of the results
The results of the first DOE analysis show that a reduction in the number of ribs (up to their total elimination) does not lead to critical conditions in the blade for either creep or fatigue and all the criteria of mechanical integrity are respected. The elimination of ribs causes the temperature to be more homogeneous over the entire blade and the peaks remain unchanged (with the standard configuration that includes ribs in all channels); the flow of cooling air, however, increases.
With the four DOE analyses varying hole diameters, it was possible to find a solution with smooth holes and reduced diameter which is not critical with respect to either creep or fatigue and that also minimizes the cooling flow rate.
7. Conclusion
The innovative aspects of this study can be divided into two different categories: methodological and technical innovations.
The methodology is innovative because the activity has been conducted in a completely multidisciplinary manner, with direct links between parameters of one discipline (heat transfer) and the results of another (mechanical integrity). To create these links two main elements were needed: close cooperation between specialists of different disciplines and a software tool capable of creating a single automated calculation process.
The study was technically innovative because it made it possible to obtain a new solution for the cooling system of the blade that meets all the criteria of mechanical integrity and that also allows simpler and therefore less expensive machining by eliminating ribs, thus improving the cost effectiveness of the design in economic terms. In fact, a solution was found which includes a cooling system without the use of ribs, devices which require more complex processing and special qualifications, and thus raise the manufacturing cost of the blade.
Both the innovative aspects – methodological and technical - represent a reduction of costs.
The introduction of this new methodology of integrated and automated design reduces the computation and design time and consequently the development costs, and the new technological solution (i.e. the new cooling system) simplifies the manufacturing process to lower manufacturing costs for each set of blades, thus reducing waste.
It is also important to highlight that the use of the process object of the paper (i.e. a cooled turbine blade) and, more generally, of this type of approach to the design of many gas turbine components, results in significant benefits and improvements both in the processes and in the final product. The main benefits are listed below:

32www.3ds.com/simulia
Industrial Equipment—Turbomachinery
• Sharing know-how
• Management and traceability of the design data
• Standardization of design processes
• Reuse and repeatability of the design process
8. References
1. Cofer, J.I., and Hahn, Y., “Design Study of Dovetail Geometries of Turbine Blades using Abaqus and Isight,” ASME paper GT2012-68566, ASME Turbo Expo, Copenhagen, Denmark, 11-15 June 2012.
2. Karl, A., “Simulation Driven Design Enabling Robust Design,” presented at the 2010 SIMULIA Community Conference, 25-27 May 2010.
3. Mattone, M., Maggiore, M., and Di Sciuva, M., “Integrated Environment for Virtual Product Development,” Greek-Italian Aeronautics Days: Growing by Sharing, Turin, Italy, 27 October 2006.
4. Panchenko, Y., Moustapha H., Mah, S., Patel, K., Dowhan, M.J., and Hall, D., “Preliminary Multi-Disciplinary Optimization in Turbomachinery Design,” presented at the NATO RTO AVS Symposium, Paris, France, 22-25 April 2002, and published in RTO-MP-089.
5. Pinna, D., and Macciò, M., “Collaborative Engineering Process for Multidisciplinary Optimization of a Gas Turbine Component,” presented at the 2011 SIMULIA Community Conference, Barcelona, Spain, 17-19 May 2011.
6. Pinna, D., “L’ingegneria Collaborativa: l’esperienza in Ansaldo Energia,” Master in “Innovazione tecnologica e sviluppo prodotti per la generazione di energia,” Università degli Studi di Genova, Ansaldo Energia, 2010.
Acknowledgments
The authors wish to thank Dr. Francesco Bagnera, Dr. Matteo Prato and Dr. Giuseppe Spataro of Ansaldo Energia for their contributions during the process implementation, and PhD Claudio Cavallero of Exemplar for the support provided concerning the Isight, Fiper, and SEE codes.

33www.3ds.com/simulia
Industrial Equipment—Turbomachinery
Collaborative Robust Engine Design OptimizationRoland Parchem and Peter Flassig (Rolls-Royce Deutschland) Holger Wenzel (Dassault Systèmes SIMULIA SLM)
Abstract: This paper describes some of the major contents of the set up and technical coupled simulations within an extended enterprise as developed during the European FP7 research project CRESCENDO (2009-2012). Focus is given on the execution of
simulation processes (workflows) for collaborative engineering design tasks in the aeronautical industry towards the ability to perform optimization and robust design studies. Different types of simulation workflows will be explained, such as event or process driven under the aspects of low, medium or high frequency access and execution. An industrial example of the implementation of a high frequency process driven workflow in the extended enterprise shall give an impression of the developed workflow execution capabilities in the case of an aero engine design application.
Keywords: Aero Engine, Design Optimization, Robust Optimization, Collaborative Engineering, Isight, SEE
1. Introduction
Within the European CRESCENDO (Collaborative and Robust Engineering using Simulation Capability Enabling Next Design Optimization) research project (Anonymous 2009), Rolls-Royce Deutschland Ltd & CoKG (RR-D) was the focal point for a test case called “robust detailed design” in a collaborative partner environment. As part of this test case, a demonstration of a “Collaborative Robust Engine Design Optimization (CREDO)” was given during the CRESCENDO public forum in Toulouse in 2012 (Anonymous, 2012).
Although an automated process for robust design optimization (simulation workflow) for engine components or modules of an engine can become already a major challenge for a single company, the consideration of a collaborative partner environment, including the definition, exchange and distribution of interface data and results between the partners, increases significantly the level of effort. So one of the major challenges was the set up of the collaborative design workflows enabling coupled simulations with many high frequency executable design iterations under consideration of IT-security constraints. Advanced simulation techniques, appropriate optimization and robust design methods, and visualization of the achieved results were also considered in this test case.
There are two major aspects for the collaborative design tasks:
1. The ability to exchange data via a collaboration hub or data repository
2. The ability to execute simulation commands many times (high frequency execution) between partner companies for coupled simulation studies
The first point is realistic to achieve because there are existing professional data management systems which enable partners to up- and download data. The second point is much harder to achieve because of the access to different partner company simulation environments. Usually such simulation frameworks are internally driven and all IT is principally blocked from the outside world. Security and proprietary aspects do play a major role and the risk of encountering intruders has always to be minimized. One solution for such types of high frequency driven coupled simulations is the SIMULIA Execution Engine (SEE) in addition to the process integration software Isight.
This paper describes the different types of simulation workflows, such as event or process driven under the aspects of low, medium or high frequency access and execution. An industrial example of the implementation of a high frequency process driven workflow in the extended enterprise - CREDO - shall give an impression of the developed workflow execution capabilities.
Previous research work on this subject was done in the VIVACE project and some collaborative design studies are documented in (Parchem et al., 2010) and (Wenzel et al., 2010).
2. Executing Simulation Workflows in the Extended Enterprise
During the CRESCENDO project, two different characterizations of simulation workflows emerged:
1. event driven vs. process driven workflows
2. low-, medium- and high frequency workflows

34www.3ds.com/simulia
Industrial Equipment—Turbomachinery
For the first characterization, a process driven workflow is defined by the availability of a very detailed template, where all parameters, data and information necessary for executing the workflow are given a priori, before the workflow is started.
Figure 1. Isight model as an example of a process driven workflow
One example of such a process driven workflow template is an Isight model as shown in Figure 1. The execution sequence is the most important feature and consequently shown in the main view. The data flow is de-coupled from that and presented in another view of the process. It follows mainly the process steps, where the data is created or consumed.
In contrast to this, in an event driven workflow, the exact information necessary for or produced of any simulation process step does not have to be known before it is initiated. Parameters and data can be added to the workflow as it executes. Often even the exact next step in the sequence can only be determined when the results of the previous step are available and analyzed.
Figure 2. Impact graph as visualization of an event driven workflow
A typical visualization of an event driven workflow is the impact graph of the simulation lifecycle management (SLM), shown in Figure 2. The processes are only the links between the different data items. This impact graph is generated a posteriori, when the workflow has been executed.
By its nature an event driven workflow is manual, whereas process driven workflows can be automated. In the CRESCENDO project, both types were implemented, where sometimes an automated process driven workflow was one execution step in an event driven workflow (Coleman 2012).
The other type of workflow characterization used within the CRESCENDO project is based on the number of times a workflow instance is iterated.
If it is iterated only once or a few times, it is called a low frequency workflow. Manual execution is then possible and in fact the norm. All event driven workflows are of that type.
Also, the overhead of manual communication with the central data management system developed in the CRESCENDO project, the BDA hub (Murton; Shaw. 2012), is of little concern here and can be done via a lightweight web interface running in a browser session.
If a workflow instance is iterated about ten to a few hundreds of times, it is called a mid frequency workflow. It no longer can be executed manually, but needs to be automated. In the extended enterprise context that the CRESCENDO project explored, this implies that simulation executions at remote partner sites need to be triggered and input and output data needs to be communicated between the partners programmatically.

35www.3ds.com/simulia
Industrial Equipment—Turbomachinery
The typical solution in the CRESCENDO project to this challenge was a polling mechanism already proposed within the VIVACE project (Wenzel et al., 2010). Here the BDA hub served as the common ground, where the simulation data and trigger signals were shared, which in turn initiated local workflow execution based on remote events (Baalbergen et al., 2012).
This polling mechanism is very light on IT requirements, but implies a considerable overhead in the execution time of remote simulations. This renders it unsuited for executing high frequency workflows, where the number of iterations is a few hundred at least.
Here a direct partner to partner execution must be used that eliminates any unnecessary communication overhead. This requirement also dictates that the local network of a company must be opened to the partners in such a way that they can request simulation executions and communicate input and output data.
In the CRESCENDO project one partner company developed their own solution, where all others that executed high frequency workflows in the extended enterprise used the business to business (B2B) functionality of the SIMULIA Execution Engine (SEE). This feature is based on the JEE certified middleware the SEE is implemented on and guarantees a secured, encrypted data exchange together with unique authentication of the incoming request through pre shared X.509 certificates and the protection of the IP contained in the local workflows.
3. High Frequency Process Driven Simulation Workflow – Example Collaborative Robust Engine Design Optimization
Figure 3. Collaborative design development of a core engine
Figure 3 shows a scenario for the development of the core of an aero engine in an extended enterprise with three industrial partners: RR-D in Germany, MTU in Germany and AVIO in Italy. Each of the partners contributes with their specific engine module designs for the high pressure compressor, combustor, and high and low pressure turbines to the overall design of the engine. The main intention is to achieve an engine with the best efficiency and the lowest weight, but also to guarantee the robustness of the engine. Since all of these modules are connected in some way (geometry, pressure, velocity, etc.), the challenge is the consideration of the degree of coupling between these modules for the simulation and therefore for the robust design optimization. This leads to the definition of the overall optimization problem structured into the system and subsystem level investigation. In the past, the development of such engine modules was done mainly locally at each partner company under the constraint of agreed and often rigid interfaces between the modules. This reduces the potential for the optimization of the overall engine. This test case was focused on achieving a high degree of simulation coupling, which requires a high number of coupled design iterations.
Figure 4 explains the goal of the collaborative robust design optimization in a simplified way. Two objectives, the efficiency and weight of the engine, will be optimised. This leads to a Pareto Front as shown in the graph on the left side of Figure 4. Taking then into account uncertainties and variability – for example of the design parameters – could identify the design as not being sufficient robust with regard to the design objectives (probability of failure PoF). Therefore, other points in the design space have to be investigated until a stable region can be found ensuring the robustness. This is shown in the small graph with a steep peak in the curve, which indicates that any variation of the design parameters will cause the objective value (efficiency, weight) to drop

36www.3ds.com/simulia
Industrial Equipment—Turbomachinery
down. The history graph downstream of the engine represents the probability of failure for the major objectives of efficiency and weight for a given uncertainty and variability of the design parameters as illustrated in the history graph upstream of the engine. The effort for such a robust design optimization can become high because a very high number of design iterations (samples, runs) have to be performed in order to assess the robustness of a system which can be measured as the probability of failure which should be low. This is the difference from the deterministic optimization, which is not to give specific values, but to give probabilistic values as, for example, the mean value and the standard deviation for the objectives.
Figure 4. Robust design optimization target for core engine
The major requirement to enable collaborative simulations, optimization and robust design studies is the ability to achieve high frequency process driven workflows. This will enable coupled simulation workflows between partners executing a high number of design iterations. The consideration of security aspects and proprietary rights, as required by each partner company, is also a strong challenge. During the CRESCENDO project it did require enormous effort to achieve a secure IT infrastructure with the ability to connect partner’s simulation environments. It did become clear that this requirement was quite challenging to be provided in a wide range useable for every partner company, and did remain as a partner issue to be solved. The intention was to provide the capability to deal with different partner-specific IT solutions towards a high frequency execution collaborative simulation process.
Figure 5 shows the IT connection for the coupled simulations between the partners MTU, UBRAND (University of Brandenburg), IRIAS (International Research Institute for Advanced Systems) and the partner AVIO in Italy, together with AVIO’s University partners UTORINO (University of Torino) and USALENTO (University of Salento). Some of the test case partners used Isight/SEE from Dassault Systèmes which provides a common solution for tight coupled simulations, since the collaborative workflows can directly be linked via an internet connection. This happened between RR-D in Germany and AVIO (including their partners UTORINO and USALENTO) in Italy for the coupled compressor-combustor optimization. The partner MTU provided a secure web service access to RR-D for their low pressure turbine LPT simulation environment. This enabled a coupled HPT-LPT simulation connection between RR-D and MTU to be achieved. Therefore a specific Isight component was developed by RR-D to provide an automated connection to the MTU web services.
With regard to the SEE connections between the test case partners, a further requirement regarding security aspects was to provide a virtual private network server (VPN). A VPN server installed at the company 24/7 in Potsdam Germany was rented and user accounts were provided to the partners. Although the SEE connection fulfilled the major security aspects, VPN access was installed additionally in order to “channel” the IT connections between the partners protecting it from further intrusion by hackers in the Internet world.
Several test runs were made with the test case partners using the SEE connections, or in case of MTU, the provided web services. With regard to the academic partners, some Design of Experiments studies were tested with the Isight/SEE connection using the optimization algorithms of the academic partners at their local environment and running the simulations at RR-D. It was possible to run a coupled compressor-combustor optimization process between RR-D and the partners from Italy (AVIO, UTORINO, USALENTO) that was stable over more than 24 hours and several thousands of design iterations could been performed.

37www.3ds.com/simulia
Industrial Equipment—Turbomachinery
Figure 5. Simulation connections between the CRESCENDO test case partners
Two major coupled simulations were performed between
1. the Italy partner group of AVIO, UTORINO, USALENTO and RR-D for the compressor-combustor optimization, and
2. RR-D and MTU for a coupled HPT-LPT simulation,
using the developed IT infrastructure. The coupled simulation between the Italy group is shown in Figure 6. The Isight component “Reference to CC_Model” is the link to the workflow in Italy for the combustor simulation. The overall optimization process is – in this case – controlled by RR-D in Germany.
Figure 6. Coupled compressor-combustor optimization workflow using the SEE
The whole simulation workflow for the core engine is shown in Figure7. This workflow enables a fully coupled robust design optimization on the system level including the four modules for the compressor, combustor, and high and low pressure turbines on subsystem level, as shown in Figure 7. The modules are coupled over their interfaces (pressure, velocity, radial position of the compressor, etc.). Because of the very high number of design iteration samples required for the robust design optimization (up to 107 runs), surrogate models were used in this workflow in addition to advanced probabilistic methods. Because of simulation

38www.3ds.com/simulia
Industrial Equipment—Turbomachinery
time issues, the whole workflow for the engine was run locally on one PC which took about 3 days to produce the probabilistic results for the “probability of failure” - which was minimized by the optimization - against the objectives of weight and efficiency of the engine. Based on the technical set ups for collaborative coupled simulations as described before, it would be possible to replace the local simulation models in Figure 7 by a link/reference to the partners’ simulation environment using the SEE or the Isight web service components in the case of access to the partner MTU. The main goal of this whole workflow for the engine was to demonstrate a fully coupled robust design optimization (with probability of failure prediction) in order to assess the engine design objectives against the customer expectations.
Figure 7. Process driven robust design optimization workflow for the core engine
4. Conclusions
An industrial example for a process driven high frequency collaborative workflow was demonstrated considering all principal aspects of coupled simulations and robust design optimization techniques. The workflows allow executing a very high number of design iterations as required for optimization and robust design studies. A professional collaborative IT environment was set up with secure and tight connections between the partner companies enabling these coupled simulations. The ability to enable simulation studies on a system level, such as an aero engine design investigation, based on coupled subsystem level simulations - with thousands of design iterations - provides the potential for improved and better aligned product components and modules leading to a robust design solution.
5. Acknowledgement
The research reported in this paper has mainly been carried out within the CRESCENDO Integrated Project, which receives funding from the European Commission as part of the Seventh Framework Program (FP7/2007-2013) under grant agreement No: 234344 (www.crescendo-fp7.eu/).
Contributions also were included from the research project VIT 3 (Virtual Turbomachinery, contract no. 80142272) funded by the State of Brandenburg and Rolls-Royce Deutschland.
6. References
1. Anonymous. (2009). Crescendo Project Homepage. Available: http://www.crescendo-fp7.eu/. Last accessed 25th Jan 2013.2. Anonymous. (2012). Innovations in Collaborative Modelling and Simulation to Deliver the Behavioural Digital Aircraft. Available:
http://www.crescendo-fp7.eu/pages/crescendo-forum.php. Last accessed 25th Jan 2013.

39www.3ds.com/simulia
Industrial Equipment—Turbomachinery
3. Baalbergen, E; Lammen, W; Kos, J. (2012). Mastering Restricted Network Access in Aeronautic Collaborative Engineering across Organizational Boundaries. Available: http://www.pdteurope.com/media/4838/conference_program_september_sept_20.pdf. Last accessed 25th Jan 2013.
4. Coleman, P. (2012). The CRESCENDO Project – Summary of a Key European R&T Initiative and Key Results. Available: http://www.pdteurope.com/media/4838/conference_program_september_sept_20.pdf. Last accessed 25th Jan 2013.
5. Murton, A; Shaw, N. (2012). Developing an Architecture and Standard to Support Innovations in Collaborative Modelling and Simulation. Available: http://www.pdteurope.com/media/4838/conference_program_september_sept_20.pdf. Last accessed 25th Jan 2013.
6. Parchem, R; Meissner, B; Nagel, M; Kesseler, E. (2010). Engine MDO Deployed on a Two-Stage Turbine. In: Guenov, M. and Kesseler, E. Advances and Collaborative Civil Aeronautical Multidisciplinary Design Optimization. Reston: American Institute of Aeronautics and Astronautics. p289-329.
7. Wenzel, H; Almyren, F; Barner, J; Baalbergen, E; Meissner, B; Lindeblad, M. (2010). Using the Virtual-Enterprise-Collaboration Hub for Distributed Engine Optimization. In: Guenov, M. and Kesseler, E. Advances and Collaborative Civil Aeronautical Multidisciplinary Design Optimization. Reston: American Institute of Aeronautics and Astronautics. p331-365.

40www.3ds.com/simulia
Industrial Equipment—Turbomachinery
Strength Analysis on Load Rejection Working Condition of Steam TurbineWang Gongyi, Cheng Kai, Yang Jiandao, Yu Deqi, GU Luyin, Peng Zeying (Shanghai Turbine Works Co., Ltd.)
Abstract: The load rejection is regarded as a vital process for a steam turbine performing commission operation or encountering some emergent accidents. Under the combination of the boiler and the turbine control valve, the steam temperature could be
rapidly reduced and the turbine load could be cut back. In order to analyze the stress of the steam turbine during load rejection, the first stage rotating blades and grooves are taken as research subjects and the commercial software “Abaqus” is employed to perform the FEA process. The stress, which is strongly impacted by rapid cooling process in four periods, is calculated in this paper. The result indicates that the stress of rotating blade and rotor groove is sensitive to temperature change in short time. The stress increases quickly when the steam temperature drops rapidly. When the steam temperature drops to a certain level, the internal stress of the model is redistributed, and it always takes a rather long time for the stress to restore a uniform profile where the local peak stress occurs. In gradual cooling, the stress gets accumulated and tends to become higher. Although the redistribution of the stress takes a very long time, it is recommended to let the temperature drop to a low level before the next cooling process. During all four cooling steps, the stress of the components is well controlled within the elastic range of the material noted in this paper.
Key word: Steam turbine; Load rejection; Heat impaction; Strength analysis; Low cycle fatigue
1. Introduction
In the modern design process for steam turbines, the finite element method has been widely used. The engineers in Shanghai Turbine Works Company have introduced Abaqus software for solving lots of engineering problems of turbines for many years, such as strength problems for steady or unsteady conditions; the natural frequencies calculation of the interlocked whole-cycle blades; heat transfer (steady/unsteady) in the flow passage; and high temperature creep problems on blades, control valves, and rotors. The paper presents the stress conditions when the high temperature components are cooled in a short time. The model is from a 300MW steam turbine, selecting the rotating blades and rotor grooves in the first stage of the HP (high pressure) cylinder.
2. Finite element calculation and methods
2.1 Modeling
HP (high pressure cylinder) rotating blades of the first stage in a steam turbine are assembled, shown in Figure 1. The whole-cycle-blades are circular symmetrical, so in order to simplify the model, a blade is selected for analysis modeling using the cyclic symmetric method, which is shown in Figure 2. Here the rotor is hollowed out to reduce the complexity of modeling [2-3].
Figure 1. Blades assembly Figure 2. Analysis modeling
2.2 Meshing and elements selecting
The element C3D8RT (3-dimensional linear 8-nodes reduced thermal analysis element) is adopted for the rotor’s elements type, and the total number of elements is 6040, shown in Figure 3.1 and Figure 3.2. The FEA elements of blade are divided into two parts, one part for platform and root, using C3D10MT element (3-dimensional 10-nodes modified thermal analysis element), and the other for blade foil and shroud, using C3D8RT unit (3-dimensional linear 8-node reduced thermal analysis element). The total number of elements is 17892, shown in Figure 3.3. Grids in groove fillet and blade root fillet where the stresses are concentrated, will be meshed more densely.
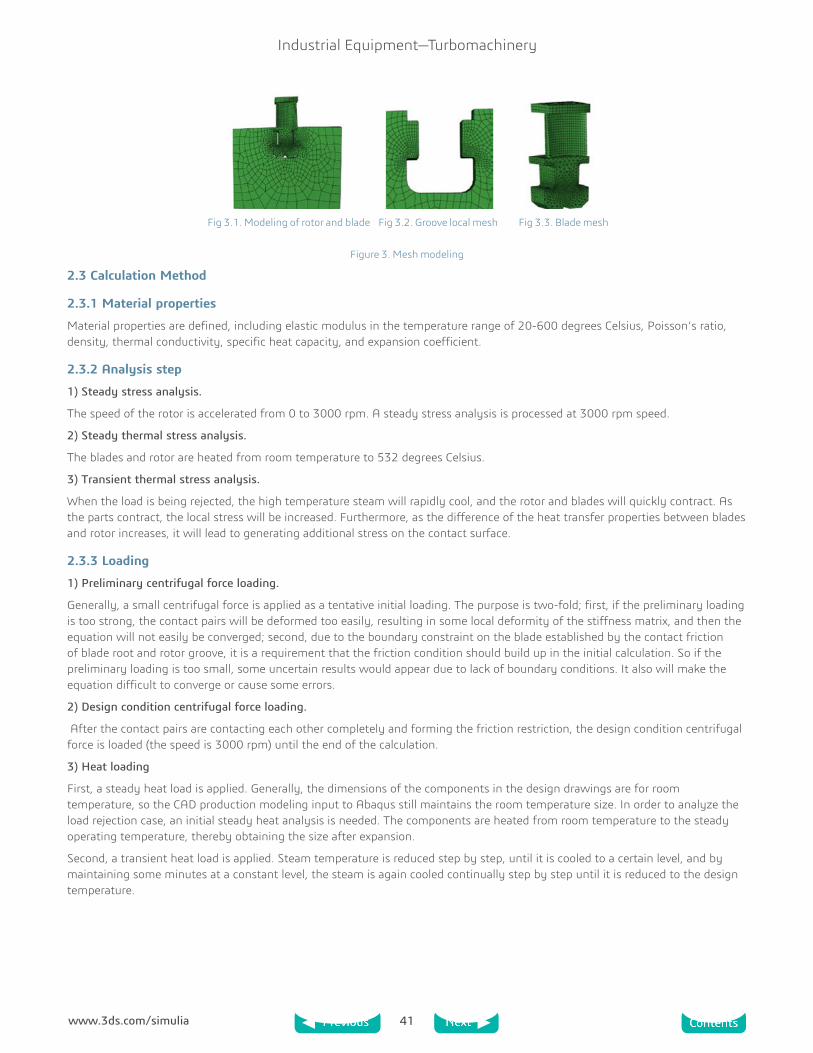
41www.3ds.com/simulia
Industrial Equipment—Turbomachinery
Fig 3.1. Modeling of rotor and blade Fig 3.2. Groove local mesh Fig 3.3. Blade mesh
Figure 3. Mesh modeling
2.3 Calculation Method
2.3.1 Material properties
Material properties are defined, including elastic modulus in the temperature range of 20-600 degrees Celsius, Poisson’s ratio, density, thermal conductivity, specific heat capacity, and expansion coefficient.
2.3.2 Analysis step
1) Steady stress analysis.
The speed of the rotor is accelerated from 0 to 3000 rpm. A steady stress analysis is processed at 3000 rpm speed.
2) Steady thermal stress analysis.
The blades and rotor are heated from room temperature to 532 degrees Celsius.
3) Transient thermal stress analysis.
When the load is being rejected, the high temperature steam will rapidly cool, and the rotor and blades will quickly contract. As the parts contract, the local stress will be increased. Furthermore, as the difference of the heat transfer properties between blades and rotor increases, it will lead to generating additional stress on the contact surface.
2.3.3 Loading
1) Preliminary centrifugal force loading.
Generally, a small centrifugal force is applied as a tentative initial loading. The purpose is two-fold; first, if the preliminary loading is too strong, the contact pairs will be deformed too easily, resulting in some local deformity of the stiffness matrix, and then the equation will not easily be converged; second, due to the boundary constraint on the blade established by the contact friction of blade root and rotor groove, it is a requirement that the friction condition should build up in the initial calculation. So if the preliminary loading is too small, some uncertain results would appear due to lack of boundary conditions. It also will make the equation difficult to converge or cause some errors.
2) Design condition centrifugal force loading.
After the contact pairs are contacting each other completely and forming the friction restriction, the design condition centrifugal force is loaded (the speed is 3000 rpm) until the end of the calculation.
3) Heat loading
First, a steady heat load is applied. Generally, the dimensions of the components in the design drawings are for room temperature, so the CAD production modeling input to Abaqus still maintains the room temperature size. In order to analyze the load rejection case, an initial steady heat analysis is needed. The components are heated from room temperature to the steady operating temperature, thereby obtaining the size after expansion.
Second, a transient heat load is applied. Steam temperature is reduced step by step, until it is cooled to a certain level, and by maintaining some minutes at a constant level, the steam is again cooled continually step by step until it is reduced to the design temperature.

42www.3ds.com/simulia
Industrial Equipment—Turbomachinery
2.3.4 Boundary conditions and initial conditions
Correct and reasonable boundary conditions can make the finite element equations simulate the real situation very well. But considering the computer hardware’s ability, it is vitally important to simplify the model reasonably. Similarly, according to the analysis requirements, some complex boundary conditions would cause trouble for solving the finite element equations, so it is necessary to reasonably simplify some complex boundary conditions.
1) Rotor boundary condition
The rotor’s bottom displacement in the three XYZ coordinate directions is restricted [4], as well as one side of the rotor axial displacement. After the completion of the first load step (preliminary centrifugal force loading), the constraints of axial displacement in the rotor’s side can be removed.
2) Blade boundary conditions.
Displacement constraints of blades are established through the frictional contact of blades roots in the rotor grooves. Here the contact properties have been given, setting the tangential contact friction coefficient value at 0.2 and the contact property for “hard contact”. Thus the displacement of blade roots in tangential and radial directions has been restricted by the friction.
The initial temperature is set to 20 degrees Celsius.
2.3.5 Heat transfer coefficient
Blades and rotor are impacted strongly by high temperature and high pressure steam. They exchange the thermal energy through the flow boundary layer. The efficiency of heat transfer in the flow field is determined by convective heat transfer coefficients which vary with steam properties (temperature, pressure, viscosity, etc.) as well as the flow conditions at different times or in different locations. In a steady flow, the time factor can be ignored, but it is a bit tricky to specify the coefficients in some different locations. The values of the heat transfer coefficients directly affect the calculation accuracy of the component’s temperature field and thermal stress field and life. A strict solution method should make use of the CFD analysis tools, obtaining the coefficient value at each element node. While this method is pretty good, the process is more cumbersome. In engineering, empirical formulas are often used to solve the problem well if the flow passage is not very complicated.
Referring to the handbook of Shanghai Turbine Works Co., Ltd., the convective heat transfer coefficient of the high pressure inlet domain is
Where:
α is the Convective heat transfer coefficient ( W / m2 °C );
λ is the Fluid heat conductivity coefficient ( W / m2 °C );
De is the Hydraulic diameter (m);
Ref is Reynolds number;
Prf is Fluid Prandtl number.
By using the formula, the solution region could be equivalent to a circular fluid domain, and the result of the convective heat transfer coefficient on the wall is 10,918 , which would be an approximation value in the flow passage of the HP first stage.
3. Results and analysis
3.1 Centrifugal force load
The centrifugal tension force is a very important force in rotating machinery. When the rotor is running at 3000 rpm, blades are connected by the roots and grooves. The stress concentration areas caused by centrifugal force mainly appear in the contact pairs surfaces and the places near the rounded corners, as shown in Figures 4.1 to 4.3.

43www.3ds.com/simulia
Industrial Equipment—Turbomachinery
Fig. 4.1. Stress distr. of assembly Fig. 4.2. Local stress distr. of groove Fig. 4.3. Local stress distr. of root
Figure 4. Centrifugal stresses distributions Figure 4.2 shows that the stress in the groove fillet is relatively concentrated, and the value is about 195Mpa which is considerably lower than the yield strength (765Mpa) of the rotor material at room temperature. As seen from Figure 4.3, the stress in the blade rounded corner is also relatively concentrated, and the value is about 190Mpa, which is also considerably lower than the yield strength (600Mpa) of the blade material at room temperature. It is safe and reliable that both stresses are in the range of the material elastic strength. As seen from Figure 4, it can be determined that the rounded corner areas of the root and groove are the areas with the most concentrated stresses, indicating where a detailed analysis should be performed, as described below.
3.2 Steady heat stress analysis
When components are heated from 20 degrees to 532 degrees steadily, the sizes of the parts are expanded in three directions. A typical element integral node in the rounded corner areas of the root and groove is taken respectively as the analysis object which is shown as the red color in Figure 5 and Figure 6. The stress at Point_A dropped from 182.5MPa to 169.8MPa after expansion; the stress at Point_B dropped from 175.2MPa to 163.0MPa after expansion. The analysis results show that the internal stress will be redistributed more uniformly after heat expansion.
Figure 5. Typical element and node in the fillet of groove
Figure 6. Typical element and node in the fillet of root
3.3 Transient heat stress analysis
Due to the requirement of operation or commission, the steam turbine unit sometimes needs to run in a load rejection condition. A sudden drop in steam temperature would greatly impact the stresses in the flow passage components. Point A in Figure 5 and Point_B in Figure 6 are still used as the research objects for analyzing the situation of the stresses.

44www.3ds.com/simulia
Industrial Equipment—Turbomachinery
Figure 7. Variation of temperature oin load rejection condition
Figure 7 is a temperature-time graph of load rejection operating conditions. As seen from the figure, the steam temperature is quickly dropped from 532 degrees to 416 degrees, then held constant for 3 minutes, and then quickly dropped to 380 degrees for 1 minute, then quickly dropped to 340 degrees for 1 minute, and then quickly dropped to 300 degrees, last keeping 300 degrees for more than 5 minutes.
Figure 8. Transient heat stresses at groove point_A
As seen from Figure 8, in the operation of the temperature curve of the load rejection, the stress at groove Point A rises from the initial value 163.0MPa in a wavy fashion to the maximum value 304.6MPa in 317 seconds. After reaching the stress peak, the stress at Point_A declines rapidly down to 172.5Mpa after 60 minutes.
Figure 9. Partial figure of transient heat stresses at groove Point_A
As mentioned above, four stages of cooling time via stress change are shown in Figure 9. The figure shows that the stress is very sensitive to temperature changes and it can quickly react in a short time. In the first stage, the stress is raised to 244.9MPa by 43.2 seconds and then dropped to 240.2MPa by 180 seconds. By comparison, with stress increasing, a longer time is needed for stress redistribution and the gradual decrease to a certain value. Similarly, after 1minute, the stress in the second stage is increased to 265.5MPa and maintained at that value for 1minute. In the third stage, the stress is increased to 289MPa in 37 seconds, and then decreased to 284.3MPa. In the fourth stage, the stress is increased to the highest point at 304MPa in 17 seconds, and then decreased gradually.

45www.3ds.com/simulia
Industrial Equipment—Turbomachinery
Figure 10. Transient heat stresses in root Point_B
Similarly, as shown in Figure 10, the Point_B stress is increased to the highest point 233.1MPa by 364 seconds after stresses accumulate in the front 3 stages. The time it takes the stress in the root Point_B to reach the highest point is about 47 seconds later than the blade’s highest stress point. It can be indicated that the rotor material is more sensitive than the blade material to temperature.
Figure 11. Partial figure of Transient thermal stress in root Point_B
Figure 11 shows that the Point_B stress is increased all the time in the four stages, which is not similar to the Point _A stress that decreases during some periods. This indicates that the time of the load rejection stage is too short for the reaction of the blade material stress, and it also shows that the stress of the blade material is not sensitive to temperature variation.
In the transient heat analysis step, it can be indicated that the highest points of the thermal stress of the blades and rotor are less than the stress yield point of the materials, so the design of the HP first stage blades and rotor are relatively conservative.
4. Conclusions
1). The blade stress is sensitive to the transient temperature gradient, and the rotor stress is relatively not sensitive to temperature change. They are all increased to a higher stress value in a short time.
2). If the temperature is constant, the stresses in the elements tend to be averaged, but it requires a very long time.
3). If the steam temperature is dropped suddenly, the components will be in contraction, and the tensile stresses in components such as blades and rotor grooves would be increased obviously in a short time.
4). Gradually cooling will result in the accumulation of stress, leading to the stress increasing more and more. Although the redistribution of the stress takes a very long time, it is recommended to let the temperature drop to a low level before the next cooling process so that the stresses can be effectively controlled in the stages of the load rejection condition.
5). The peak stresses in the four stages are all in the elastic ranges of the materials. Considering the repeated start-up and shut-down of the turbine unit and operation under the load rejection conditions, it is important and necessary to introduce an assessment criterion for judging the components’ health and safety, such as the low cycle fatigue method or fracture mechanics theory.

46www.3ds.com/simulia
Industrial Equipment—Turbomachinery
5. Acknowledgments
This work was supported by the Shanghai Post PHD Research Support Key Program (No. 11R21420200).
6. References
1. JING Jian-ping, MENG Guang. Survey of Fatigue Strength Theory of Turbine Rotor [J]. TURBINE TECHNOLOGY. 2003, 45(5):260~264.
2. CHEN Kai, XU Fen, WANG Gongyi, PENG Zeying, ZHOU Daiwei. Research on FEA Process for the Circularly Interlocked Blade: Frequency Prediction [J]. THERMAL TURBINE. 2009, 38(4):232~237.
3. CHEN Kai, XU Fen, WANG Gongyi, PENG Zeying, ZHOU Daiwei. Discussion of the FEA Process for the Circularly Coupling Blade: Steady Stress Prediction [J]. THERMAL TURBINE. 2010, 39(4):264~269.
4. SHEN Wen-cai, CAO Yue-yun, YANG Zi-chun. Thermo-Elastic-Plastic Analysis of Coupling Field and Touch Problem of Turbine Disc and Blade [J]. THERMAL TURBINE. 2009, 38(1):25~28.
5. SHI Jin-yuan, DENG Zhi-cheng, YANG Yu, GONG Gan-wen. Heat Transfer Coefficient of Wheel Rims of Large Capacity Steam Turbines [J]. JOURNAL OF CHINESE SOCIETY OF POWER ENGINEERING. 2007, 27(2):153~156.
6. SHI Jin-yuan, DENG Zhi-cheng, YANG Yu. Calculation of Heat Transfer Coefficients of Blade Grooves for Supercritical and Ultra-supercritical Steam Turbine Rotors. JOURNAL OF CHINESE SOCIETY OF POWER ENGINEERING. 2010, 30(7): 478~484.
7. James P. DeMarco, Erik A. Hogan, Calvin M. Stewart, Ali P. Gordon. An Efficient Method for the Optimization of Viscoplastic Constitutive Model Constants. ASME Turbo 2010: power for Land, Sea and Air June14-18, 2010, Glasgow, UK; GT2010-23311.

© D
assa
ult
Syst
èmes
201
4, a
ll rig
hts
rese
rved
. 3D
EXP
ERIE
NCE
® , CA
TIA
, Sol
idW
orks
, EN
OVI
A, S
IMU
LIA
, DEL
MIA
, 3D
VIA
, 3D
SwYm
, EXA
LEA
D a
nd N
etvi
bes
are
regi
ster
ed t
rade
mar
ks o
f D
assa
ult
Syst
èmes
or
its s
ubsi
diar
ies
in t
he U
S an
d/or
oth
er c
ount
ries.
Our 3DEXPERIENCE® Platform powers our brand applications, serving 12 industries, and provides a rich portfolio of industry solution experiences. Dassault Systèmes, the 3DEXPERIENCE Company, provides business and people with virtual universes to imagine sustainable innovations. Its world-leading solutions transform the way products are designed, produced, and supported. Dassault Systèmes’ collaborative solutions foster social innovation, expanding possibilities for the virtual world to improve the real world. The group brings value to over 170,000 customers of all sizes in all industries in more than 140 countries. For more information, visit www.3ds.com.
Europe/Middle East/AfricaDassault Systèmes10, rue Marcel DassaultCS 4050178946 Vélizy-Villacoublay CedexFrance
AmericasDassault Systèmes175 Wyman StreetWaltham, Massachusetts02451-1223USA
Asia-PacificDassault Systèmes20F, ThinkPark Tower2-1-1, Osaki, Shinagawa-ku,141-6020 TokyoJapan


