Industrial Outlook North America | United States | Q2 2014 • Vacancy is now below a prior cyclical low, and will trend toward 7.0 percent by year-end. Rents are increasing as new development continues to play catch-up after 2010-13 marked a 50-year delivery low. • Rent growth is pronounced in those regions with vacancy rates well below the national average, with Southern California, the Northwest and Southwest leading in year-over-year asking warehouse rent increases. Gains are expected in the Midwest, Northeast, Mid-Atlantic and Southeast as market fundamentals tighten. • Vacancies in Mexico’s North Region slightly decreased, with net absorption being notable in Ciudad Juárez, Monterrey and Saltillo Ramos. • For Canada, the leasing market weakened in Montreal; stable rent growth, low availability and dwindling tenant leverage are on the horizon for Toronto; and signs of a balanced market are present in Vancouver. Vacancy sets a new precedent
Transcript
Industrial Outlook North America | United States | Q2 2014
• Vacancy is now below a prior cyclical low, and will trend toward 7.0 percent by year-end. Rents are increasing as new development continues to play catch-up after 2010-13 marked a 50-year delivery low.
• Rent growth is pronounced in those regions with vacancy rates well below the national average, with Southern California, the Northwest and Southwest leading in year-over-year asking warehouse rent increases. Gains are expected in the Midwest, Northeast, Mid-Atlantic and Southeast as market fundamentals tighten.
• Vacancies in Mexico’s North Region slightly decreased, with net absorption being notable in Ciudad Juárez, Monterrey and Saltillo Ramos.
• For Canada, the leasing market weakened in Montreal; stable rent growth, low availability and dwindling tenant leverage are on the horizon for Toronto; and signs of a balanced market are present in Vancouver.
Vacancy sets a new precedent
Net absorption is getting stronger: JLL predicts 185.0 million square feet this year, up 9.8 percent from 2013.
3 JLL | United States | Industrial Outlook | Q2 2014
Overview of Jones Lang LaSalle’s logistics and industrial services 4 United States 6 United States industrial market 7 United States industrial property clock 9 United States industrial weather map 10 United States industrial rankings 11 Atlanta 13 Baltimore 14 Boston 15 Broward County / Fort Lauderdale 16 Central New Jersey 17 Central Valley, California 18 Charlotte 19 Chicago 20 Cincinnati 21 Cleveland 22 Columbus 23 Dallas / Fort Worth 24 Denver 25 Detroit 26 East Bay / Oakland 27 Greensboro / Winston-Salem 28 Hampton Roads 29 Houston 30 Indianapolis 31 Inland Empire 32 Jacksonville 33 Kansas City 34 Las Vegas 35 Long Island 36 Los Angeles 37 Memphis 38
Miami-Dade 39 Milwaukee 40 Minneapolis / St. Paul 41 North Bay, California 42 Northern New Jersey 43 Orange County 44 Orlando 45 Palm Beach 46 Philadelphia / Harrisburg 47 Phoenix 48 Pittsburgh 49 Portland 50 Reno / Sparks 51 Richmond 52 Sacramento 53 Salt Lake City 54 San Antonio 55 San Diego 56 Seattle-Bellevue 57 South Bay / Silicon Valley 58 St. Louis 59 Tampa 60 Washington, DC 61 Canada 62 Greater Vancouver 65 Greater Toronto 66 Montréal 67 Mexico 68 Mexico industrial property clock 71 Mexico market statistics 72 Report contacts 74
In this reportThis report provides an overview of supply and demand conditions, as well as detailed statistics and brief analyses of major industrial markets in the United States, Canada and Mexico. Our professional research department is dedicated to producing information and insights that help our clients understand dynamic real estate market trends and guide critical decision making for investors and occupiers.
4 JLL | United States | Industrial Outlook | Q2 2014
Overview of Jones Lang LaSalle’s logistics and industrial services
From manufacturing plants to around-the-clock distribution centers, industrial real estate is the backbone of the global economy. Today’s financial and competitive pressures demand that your industrial property—whether leased or owned—delivers maximum flexibility and efficiency. Our logistics and industrial professionals understand the current business environment and offer innovative, profitable strategies for supply chain optimization, site selection, sales, leasing, acquisition, financing, construction, project management, and property and facility management of industrial properties and portfolios.
Our experts know all of the issues that impact your industrial real estate decisions and apply proven best practices to address such challenges as skyrocketing energy, transportation, and labor costs; heightened security needs; tough new environmental requirements; and profound changes in global supply chains. Because of our depth of in-house talent, we can quickly assemble just the right team for your particular need. Regardless of the size and scope of the assignment, you’ll have a single point of contact who manages all service delivery and is responsible for producing the measurable results that are agreed to up front.
Seattle
San Diego
Los AngelesPhoenix
DenverKansas City
Dallas/Forth Worth
San Antonio
Houston
Memphis
Columbus
ClevelandCincinnati
Atlanta
TampaOrlando
Miami
New Jersey
Boston
Baltimore/DC
Bay Area
Orange County
Philadelphia
Charlotte
Raleigh
ChicagoDetroit
Austin
Minneapolis
St. Louis
Pittsburgh
San FranciscoIndianapolis
Reno
Las Vegas
Richmond
Sacramento
Jacksonville
West Palm Beach
Long Island
Hampton Roads
Inland Empire
Portland
Stockton
Milwaukee
Salt Lake City
Charleston
HartfordStamford
Des Moines
Tysons
More than 271 JLL professionals cover the top 50 industrial markets in the United States, Canada and Mexico and 410 more are at work in major industrial markets around the globe.
In 2013, JLL logistics and industrial services completed more than 2,724 transactions comprising over 177 million square feet of space at a value of more than $5.0 billion.
5 JLL | United States | Industrial Outlook | Q2 2014
United States
6 JLL | United States | Industrial Outlook | Q2 2014
United States
The U.S. industrial market appears to be firing on all cylinders with a vacancy rate below a prior cyclical low, increased speculative groundbreakings, healthy demand that is spread across size segments, notable absorption figures and rent growth. Market fundamentals are tightening throughout the nation; typified by large-box requirements often spilling over into secondary markets, and primary logistics corridors enjoying healthy momentum in their quality B-spaces. All well and good, but the question on many developers’ minds is “When will the music stop?” That is, when rent growth will stop or undergo a correction.
Markets with construction all suffer from some sort of supply constraints; namely a lack of quality, available inventory to appeal to today’s tenant requirements. Macroeconomic growth is particularly important, as numerous industrial indexes point to positive momentum: Jobs numbers are improving and consumer spending and inventories—while down due to a harsh winter—are forecasted to expand greatly in the second half of the year. Although some markets run the risk of over-building, we believe developers are more disciplined this cycle, meaning a macro pause to rent gains is not expected anytime soon.
Key “takeaways” • Total vacancy is now below a prior cyclical low last seen in the first quarter of 2008 when the
rate was 7.5 percent.• There have been 17 consecutive quarters of positive net absorption; this is the strongest
second quarter to-date of this cycle.• Forty-five of 50 U.S. markets had positive year-to-date net absorption. Forty-one of them
experienced year-over-year warehouse asking rent growth.• Speculative development now accounts for 60.0 percent of total construction activity.
7 JLL | United States | Industrial Outlook | Q2 2014
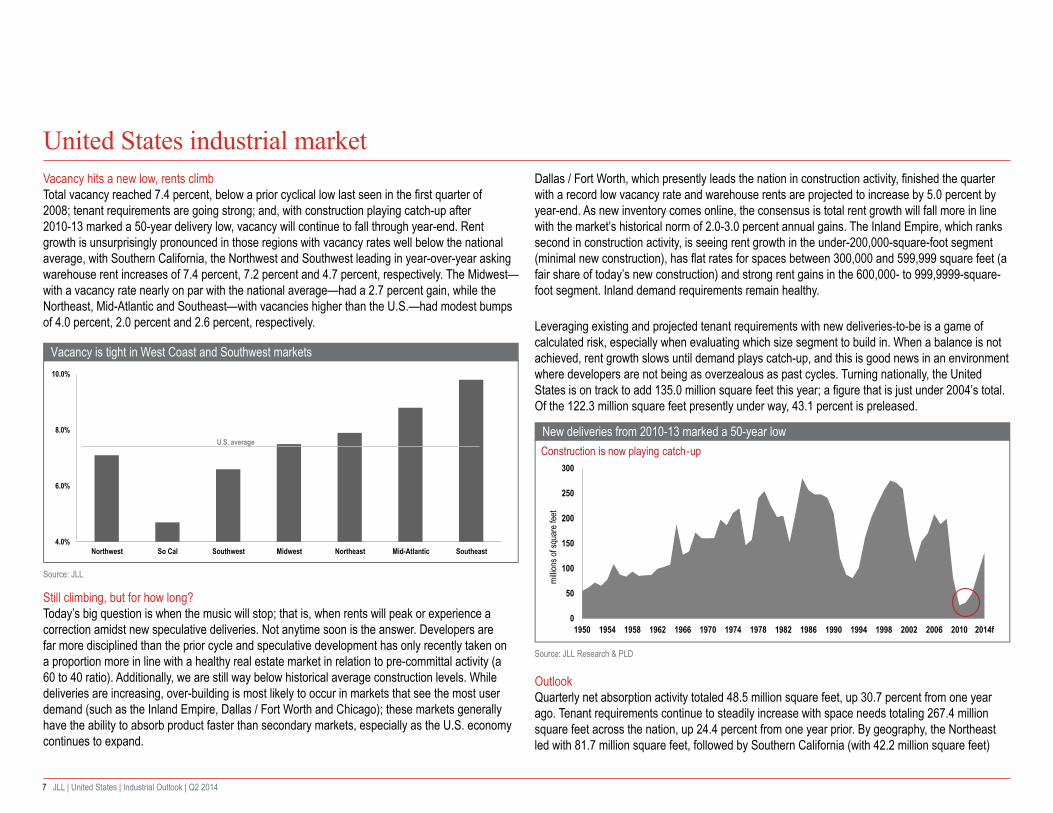
Vacancy hits a new low, rents climb Total vacancy reached 7.4 percent, below a prior cyclical low last seen in the first quarter of 2008; tenant requirements are going strong; and, with construction playing catch-up after 2010-13 marked a 50-year delivery low, vacancy will continue to fall through year-end. Rent growth is unsurprisingly pronounced in those regions with vacancy rates well below the national average, with Southern California, the Northwest and Southwest leading in year-over-year asking warehouse rent increases of 7.4 percent, 7.2 percent and 4.7 percent, respectively. The Midwest—with a vacancy rate nearly on par with the national average—had a 2.7 percent gain, while the Northeast, Mid-Atlantic and Southeast—with vacancies higher than the U.S.—had modest bumps of 4.0 percent, 2.0 percent and 2.6 percent, respectively.
Still climbing, but for how long? Today’s big question is when the music will stop; that is, when rents will peak or experience a correction amidst new speculative deliveries. Not anytime soon is the answer. Developers are far more disciplined than the prior cycle and speculative development has only recently taken on a proportion more in line with a healthy real estate market in relation to pre-committal activity (a 60 to 40 ratio). Additionally, we are still way below historical average construction levels. While deliveries are increasing, over-building is most likely to occur in markets that see the most user demand (such as the Inland Empire, Dallas / Fort Worth and Chicago); these markets generally have the ability to absorb product faster than secondary markets, especially as the U.S. economy continues to expand.
Dallas / Fort Worth, which presently leads the nation in construction activity, finished the quarter with a record low vacancy rate and warehouse rents are projected to increase by 5.0 percent by year-end. As new inventory comes online, the consensus is total rent growth will fall more in line with the market’s historical norm of 2.0-3.0 percent annual gains. The Inland Empire, which ranks second in construction activity, is seeing rent growth in the under-200,000-square-foot segment (minimal new construction), has flat rates for spaces between 300,000 and 599,999 square feet (a fair share of today’s new construction) and strong rent gains in the 600,000- to 999,9999-square-foot segment. Inland demand requirements remain healthy.
Leveraging existing and projected tenant requirements with new deliveries-to-be is a game of calculated risk, especially when evaluating which size segment to build in. When a balance is not achieved, rent growth slows until demand plays catch-up, and this is good news in an environment where developers are not being as overzealous as past cycles. Turning nationally, the United States is on track to add 135.0 million square feet this year; a figure that is just under 2004’s total. Of the 122.3 million square feet presently under way, 43.1 percent is preleased.
Outlook Quarterly net absorption activity totaled 48.5 million square feet, up 30.7 percent from one year ago. Tenant requirements continue to steadily increase with space needs totaling 267.4 million square feet across the nation, up 24.4 percent from one year prior. By geography, the Northeast led with 81.7 million square feet, followed by Southern California (with 42.2 million square feet)
Vacancy is tight in West Coast and Southwest markets
Source: JLL
4.0%
6.0%
8.0%
10.0%
Northwest So Cal Southwest Midwest Northeast Mid-Atlantic Southeast
U.S. average
8 JLL | United States | Industrial Outlook | Q2 2014
and the Southeast (with 36.5 million square feet) - the first and third regions are home to markets with vacancy rates that generally exceed the U.S. average, meaning their fundamentals are expected to tighten in the quarters ahead as demand translates to leasing activity.
Demand is heating up in smaller size segments, notably for requirements between 100,000 and 249,999 square feet. Counts in this segment totaled 465, up from the 293 of one year ago, and easily outpaced all other size categories by its annual gain. This is especially relevant since this segment generally appeals to small private distributors, who are more susceptible to fluctuations in the economy - more activity means they have more confidence.
We expect annual net absorption of 185.0 million square feet by year-end, up 9.8 percent from 2013. Rents will increase as the U.S. vacancy rate nears 7.0 percent, especially in markets such as Central Pennsylvania, Atlanta and Charlotte where speculative deliveries over the next six months will be paced. Fewer space additions equate to a more fixed supply, and modern space will command premiums.
Some highlights from around the country:
• Atlanta: Large blocks of A-space are in short supply as developers ramp up groundbreakings. Expect tightening fundamentals in the B-segment via increasing occupancy and rents, in the meantime.
• Central New Jersey: Class A rental rates were up 5.3 percent quarter-over-quarter. • Chicago: Speculative redevelopment projects are extending from O’Hare into the infill areas around
Skokie, Niles and down to McCook along I-55.• Dallas / Fort Worth: While rents have finally ended their declines and are expected to increase over
the coming quarters, growth will be modest at best.• Indianapolis: More than 4.1 million square feet of new speculative inventory will come online in the
next 12 months. • Los Angeles: Quality B-product is seeing more leasing activity. Consequently, available inventory of
this caliber (in excess of 100,000 square feet) is shrinking to prior peak levels.• Philadelphia / Harrisburg: Quarterly completions marked a two-year high; 92.7 percent of new
inventory was preleased.• Reno: Leverage is shifting from tenants to landlords due to a tightening vacancy rate, costs for tenant
improvements and changes to the credit-worthiness of tenants.
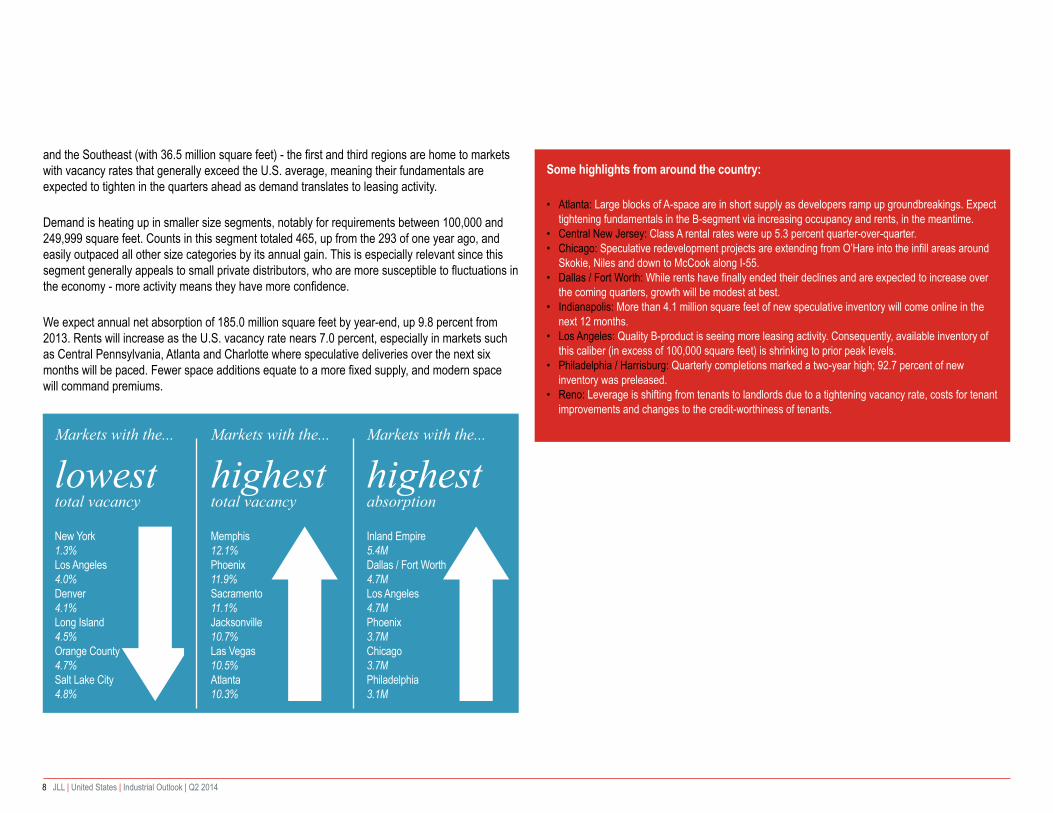
Markets with the...
lowest total vacancy New York 1.3%Los Angeles 4.0%Denver 4.1%Long Island 4.5%Orange County4.7%Salt Lake City 4.8%
Markets with the...
highest total vacancy Memphis 12.1%Phoenix11.9%Sacramento 11.1%Jacksonville 10.7%Las Vegas 10.5%Atlanta10.3%
Markets with the...
highest absorption Inland Empire 5.4MDallas / Fort Worth4.7MLos Angeles 4.7MPhoenix 3.7MChicago 3.7MPhiladelphia 3.1M
9 JLL | United States | Industrial Outlook | Q2 2014
United States industrial property clock
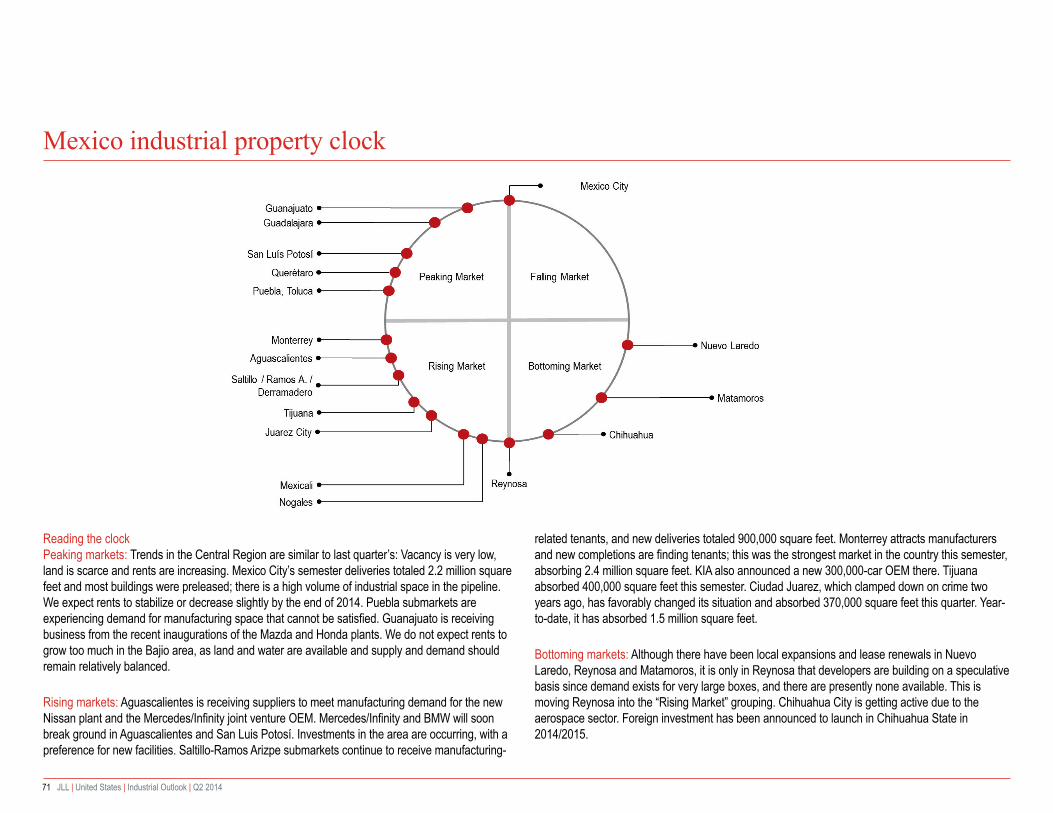
Reading the clock The JLL industrial property clock illustrates where each market sits within its real estate cycle. Markets generally move clockwise around the dial, with those markets on the left side generally facing more landlord-favorable characteristics, whereas those on the right experiencing generally tenant-favorable conditions. At the end of the second quarter of 2014, the U.S. aggregate position on the clock reached the 7:45 mark, in the ‘rising market’ quadrant. All markets are now considered rising, meaning landlords are increasingly gaining leverage across the country. Rent growth is prevalent and speculative construction is becoming more widespread in terms of both geography and size segments.
Rents in the Class A sector have firmed and are on the rise in nearly all U.S. markets, while B-product is recording gains, notably in the nation’s core logistics hubs. As the ‘big box’ logistics sector in primary and secondary markets continues to tighten, we are now seeing some spillover into demand and pricing for quality Class B product – as long as speculative completions remain measured we expect this dynamic to increase. Expect most markets to continue their progressive clockwise move while the overall U.S. position improves as well.
Peaking market
Falling market
Rising market
Bottoming market
Broward County / Fort Lauderdale, Detroit, Jacksonville, Palm Beach
Boston, Greensboro / Winston-Salem, Hampton Roads, Las Vegas, Milwaukee, Orlando, Reno, San Diego, Tampa Bay
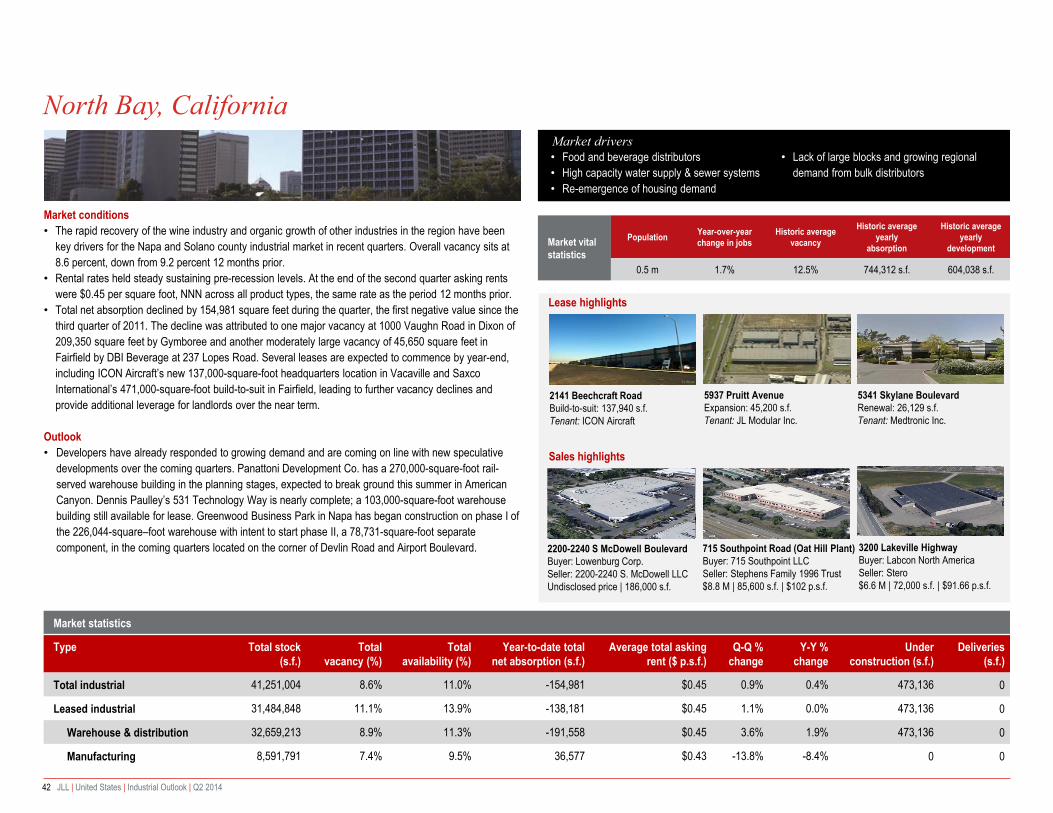
Baltimore, Central Valley (CA), Indianapolis, North Bay (CA), Northern New Jersey
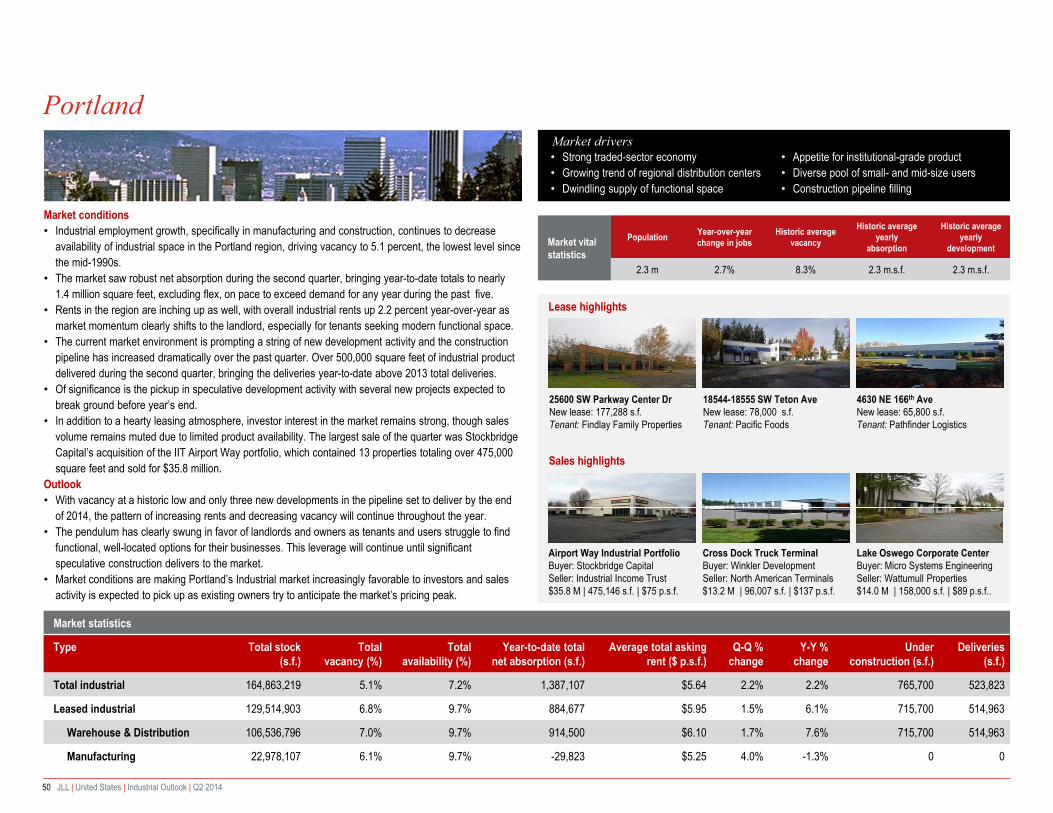
Atlanta, Charlotte, Cincinnati, Cleveland, Columbus, Denver, Houston, Kansas City, Memphis, Miami-Dade, Phoenix, Pittsburgh, Portland, Richmond, San Antonio,
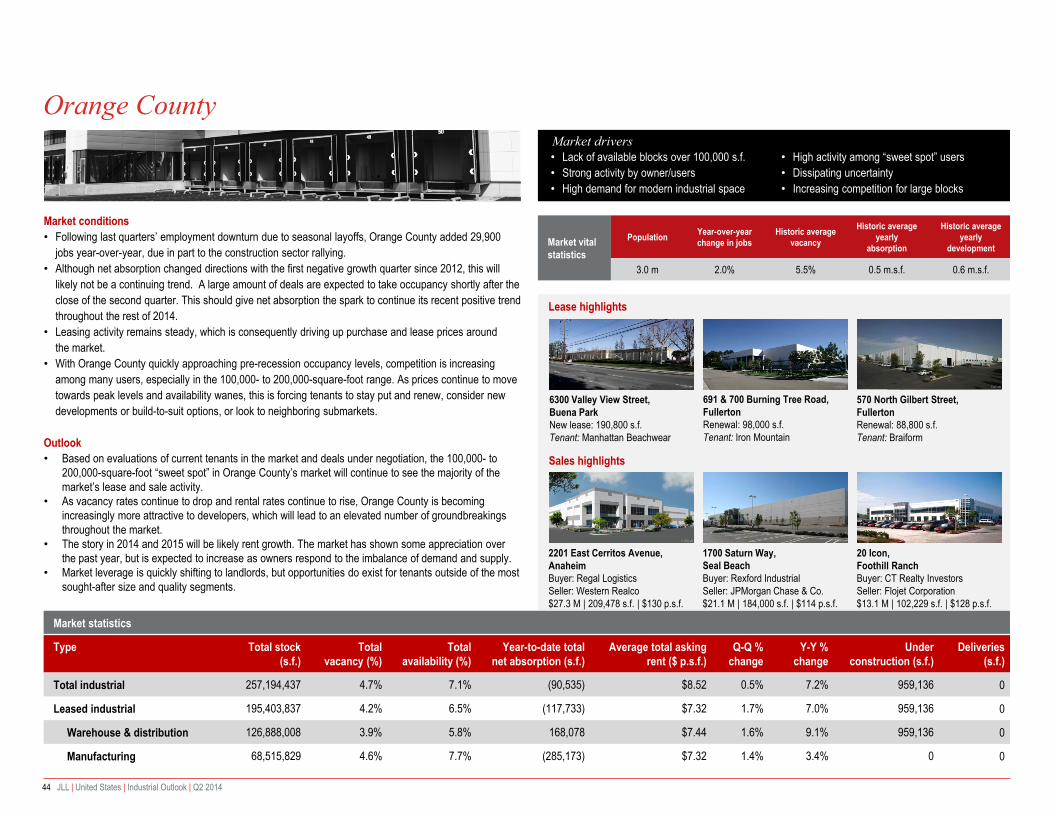
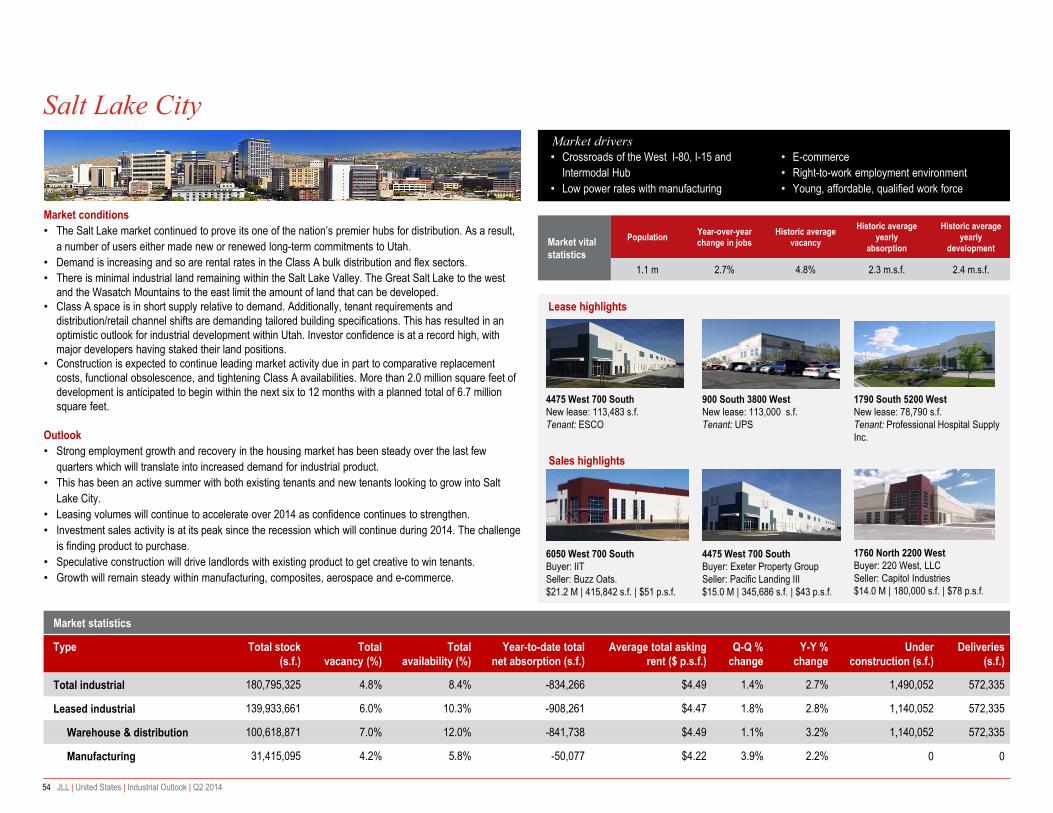
Central New Jersey, Chicago, Long Island, Minneapolis / St. Paul, New York, Orange County (CA), Sacramento, Salt Lake City, Seattle,
Silicon Valley / South Bay
Los Angeles
10 JLL | United States | Industrial Outlook | Q2 2014
United States industrial weather map
0 Average rental % changeyear-over-year*
Average rental % changequarter-over-quarter0
Rents growing(greater than 1.5% growthduring quarter)
Rents stagnant(between -0.5% and 1.5%change during quarter)
Rents falling(greater than 0.5% declineduring quarter)
Rental conditions
Source: JLL Research
2.6 1.9Atlanta
1.1 -0.1 Washington, DC
-2.6 -0.6Boston
-0.3 0.6Charlotte
4.9 1.7Chicago
2.9 3.5Cleveland
9.0 1.8Dallas / Fort Worth
11.6 4.0Denver
4.6 1.2Detroit
1.1 -0.6Broward County
5.0 1.1Houston
11.3 1.7Los Angeles
8.0 -0.2Miami-Dade
5.9 2.2Central New Jersey
6.7 1.8Orlando
-1.0 -1.5Philadelphia/ Harrisburg
4.4 0.0Pittsburgh-3.6 -3.9
Sacramento
9.2 6.6Central Valley
3.7 1.4St. Louis
3.3 0.2Tampa Bay
7.8 0.0Palm Beach
Please note: weather imagery indicates only the direction of movement of rental prices in a particular market and is not designed to indicate favorable or nonfavorable conditions for a specific leasing perspective
10.6 6.6Seattle
0.0 -1.0San Diego
1.2 -0.3Cincinnati / Dayton
5.5 2.5Columbus
-0.7 -1.8Hampton Roads
4.7 -2.3Indianapolis
8.3 5.4Inland Empire
2.0 0.2Kansas City
3.8 0.8Memphis
3.8 -0.6Minneapolis / St. Paul 4.7 -0.3
Northern New Jersey
2.3 1.0Phoenix
4.8 2.6San Antonio
6.0 5.5
Oakland /East Bay
4.2 1.2
Silicon Valley / South Bay
7.2 0.5Orange County
2.2 2.2Portland
2.8 -1.5Richmond
-2.5 -0.3Jacksonville
0.9 -0.4 Baltimore
-5.9 0.4Greensboro / Winston-Salem
0.0 0.0New York
1.8 2.0Las Vegas
7.6 3.0
Reno
2.7 1.4Salt Lake City
Long Island17.6 6.4
0.4 0.9
North Bay
0.01.0Milwaukee
United States industrial rankingsTotal inventory (millions of s.f.)
0 200 400 600 800 1,000 1,200
New YorkPalm Beach
North Bay (California)Hampton RoadsBroward County
South Bay / Silicon ValleyReno / Sparks
RichmondJacksonville
Las VegasSan Antonio
Washington DCOrlando
Central Valley (California)Oakland / East Bay
Miami-DadeLong IslandSan DiegoPittsburgh
Tampa BayBoston
SacramentoBaltimorePortland
MilwaukeeSalt Lake City
Minneapolis / St. PaulDenver
MemphisColumbus
St. LouisCharlotte
Greensboro / Winston-SalemIndianapolis
Cincinnati / DaytonPhoenix
Orange County (California)Central New Jersey
SeattleKansas City
ClevelandNorthern New Jersey
HoustonDetroit
Inland EmpireAtlanta
Dallas / Fort WorthLos Angeles
Philadelphia / HarrisburgChicago
0.0% 2.0% 4.0% 6.0% 8.0% 10.0% 12.0% 14.0%
Total vacancy rates
New YorkLos Angeles
DenverLong Island
Orange County (California)Salt Lake City
PortlandSeattle
Inland EmpireHouston
Dallas / Fort WorthIndianapolisSan Antonio
St. LouisColumbus
Cincinnati / DaytonKansas City
MilwaukeePalm BeachMiami-Dade
Oakland / East BaySan Diego
BostonClevelandPittsburgh
Northern New JerseyCentral New Jersey
Greensboro / Winston-SalemHampton Roads
ChicagoRichmond
South Bay / Silicon ValleyNorth Bay (California)
Philadelphia / HarrisburgCentral Valley (California)
BaltimoreMinneapolis / St. Paul
Reno / SparksWashington DC
DetroitBroward County
CharlotteOrlando
Tampa BayAtlanta
Las VegasJacksonvilleSacramento
PhoenixMemphis
12 JLL | United States | Industrial Outlook | Q2 2014
Y-O-Y rent changes
-6.0% 0.0% 6.0% 12.0% 18.0%
Greensboro / Winston-SalemSacramento
BostonJacksonville
Philadelphia / HarrisburgHampton Roads
CharlotteNew York
San DiegoNorth Bay (California)
BaltimoreMilwaukee
Broward CountyWashington DC
Cincinnati / DaytonLas Vegas
Kansas CityPortlandPhoenixAtlanta
Salt Lake CityRichmondCleveland
Tampa BayMemphisSt. Louis
Minneapolis / St. PaulSouth Bay / Silicon Valley
PittsburghDetroit
Northern New JerseyIndianapolisSan Antonio
ChicagoHouston
ColumbusCentral New JerseyOakland / East Bay
OrlandoOrange County (California)
Reno / SparksPalm BeachMiami-Dade
Inland EmpireDallas / Fort Worth
Central Valley (California)Seattle
Los AngelesDenver
Long Island
YTD net absorption (millions of s.f.)
(2.5) 0.0 2.5 5.0 7.5 10.0
Salt Lake CityLong Island
New YorkMemphis
Northern New JerseyNorth Bay (California)
Orange County (California)Washington DC
South Bay / Silicon ValleyHampton Roads
BostonReno / Sparks
RichmondPalm Beach
OrlandoClevelandBaltimore
Las VegasPittsburgh
Broward CountyJacksonville
MilwaukeeSan Antonio
Greensboro / Winston-SalemIndianapolisMiami-Dade
San DiegoOakland / East Bay
Kansas CityCharlottePortland
Cincinnati / DaytonMinneapolis / St. Paul
SacramentoTampa Bay
SeattleSt. Louis
DenverHouston
DetroitColumbus
Central Valley (California)Central New Jersey
PhoenixChicago
Dallas / Fort WorthPhiladelphia / Harrisburg
AtlantaLos Angeles
Inland Empire
13 JLL | United States | Industrial Outlook | Q2 2014
Atlanta
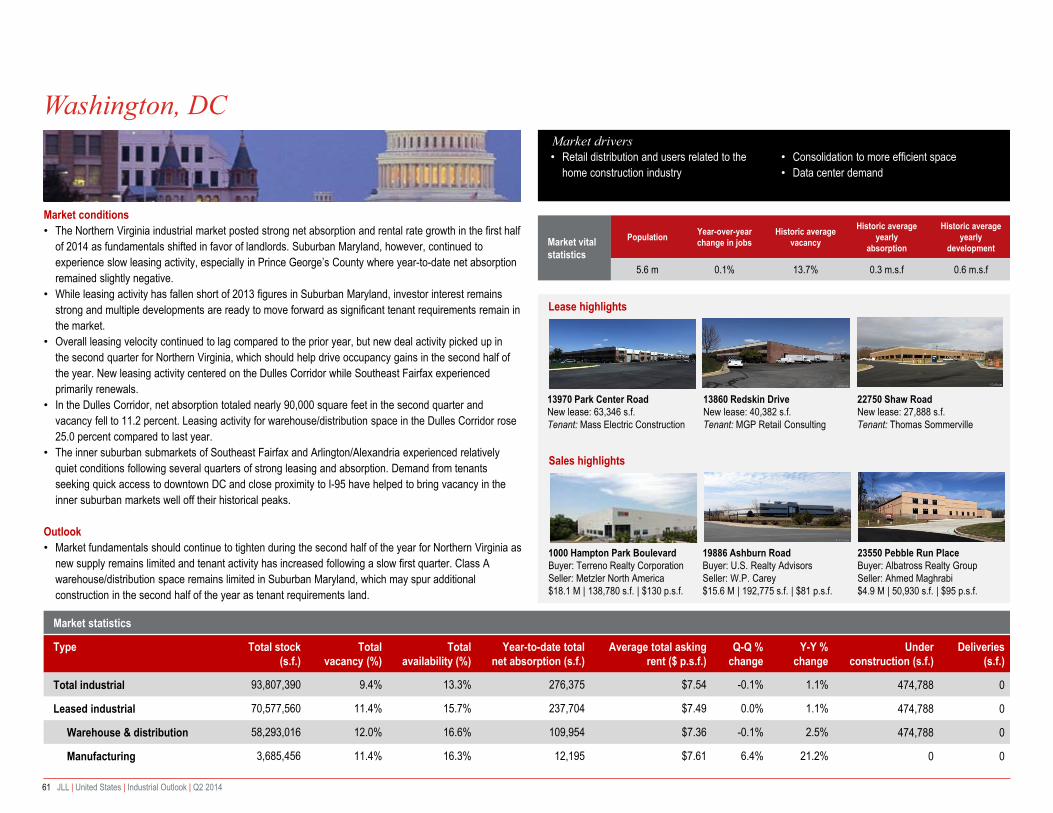
Market conditions• Atlanta saw a slight uptick in the unemployment rate due to recent college graduates seeking to enter the
market, along with interest in summer work generally.• The construction sector saw the most significant growth at an increase of 1.9 percent month-over-month.
The trade, transportation and utilities sector did not see as big of a percent increase, but it still managed to add 3,600 new jobs making the sector make up nearly a quarter of metro Atlanta’s total jobs.
• Competition for Class A bulk space is soaring. The market has not seen such investment activity since pre-recession years. Multiple investors are vying for the same shrinking number of high-quality buildings.
• Inventory of available space continues to diminish as investors buy and lease Class A supply. Not only does this competition spur speculative construction, it also encourages owners to test the market by putting their properties on the market for sale.
• A growing number of speculative projects are planned and under construction. In particular, the south side of the market is heating up, with Kroger’s announcement of a 2.0 million-square-foot facility at the Fort Gillem site as well as partners MetLife and Panattoni’s newly planned 3.0 million-square-foot Lambert Farms Distribution Center.
• The I-20 East submarket picked up speed and saw the most movement at over 1.0 million square feet of absorption this quarter. Marketwide demand is outpacing that of last year.
• Georgia’s ports are enjoying sustained increases in cargo volume. Total TEUs for 2014 through May is 8.0 percent higher than the same time frame of 2013.
Outlook• Even though there were no new deliveries this quarter, the 6.0 million square feet of projects under
construction and even more planned bodes well for new, high quality supply.• In the meantime, expect Class B buildings to see substantial improvements in occupancy performance
and an ability to push rents. • The end of 2014 could see a full shift from a tenant-favorable market to landlord-favorable.
• Fluctuation in commodity prices • Intermodal transportation links• e-commerce distribution and air cargo
• Relatively business-friendly environment• New developer influx• Availability of entitled land
Market conditions• After a sluggish start to the year, leasing and sale activity increased in the second quarter as the
submarkets located north of the Port of Baltimore continued to lead the region.• While leasing activity increased quarter-over-quarter, volume still lagged by 35.0 percent when compared
to the first half of 2013. In the Baltimore Washington Corridor specifically, leasing volume was down nearly 49.0 percent year-over-year as demand from mid-sized tenants in the 30,000- to 100,000-square-foot range was limited.
• I-95 North and Baltimore County East have led the region in occupancy gains with a combined net absorption of over 466,000 square feet. Conditions in the Baltimore Washington Corridor remained mixed with negative net absorption of 113,550 square feet during the quarter. Large move-outs included 114,478 square feet vacated by Terry’s Tire Town at 1790 Crossroads Drive.
• Limited available large blocks of Class A warehouse/distribution product has led tenants to pursue build-to-suit options and new construction for their requirements. In Baltimore County East, construction continued on Reliable Churchill’s new 449,000-square-foot headquarters at Chesapeake Real Estate Group’s Crossroads @ 95 development. In the Baltimore Washington Corridor, limited developable land has resulted in the redevelopment of a manufacturing plant at 8235 Patuxent Range Road for a 250,000-square-foot warehouse/distribution building, which is 80.0 percent preleased to Feld Entertainment.
Outlook• Planned move-ins from a strongly preleased development pipeline will drive considerable net absorption
in the second half of 2014. Limited existing availability of Class A warehouse/distribution will likely lead to an increase in speculative construction.
• With overall vacancy dropping below 10.0 percent, significant rent growth should continue in the coming quarters as market dynamics move in favor of landlords.
504 Advantage WayNew lease: 235,458 s.f.Tenant: Gordon Food Service
6300 Beckley StreetNew lease: 100,000 s.f.Tenant: Cowan Systems
7629 Gambrills Cove RoadBuyer: Principal Real Estate InvestorsSeller: Merritt Properties$26.5 M | 352,850 s.f. | $75 p.s.f.
4803 Hollins Ferry RoadBuyer: AEW Capital ManagementSeller: The Archon Group$31.7 M | 158,400 s.f. | $79 p.s.f.
7448 Candlewood RoadBuyer: Hartz Mountain IndustriesSeller: CBRE Global Investors$18.7 M | 278,505 s.f. | $67 p.s.f.
JLLIndustrial Snapshot ● Q2 2014
Baltimore
15 JLL | United States | Industrial Outlook | Q2 2014
Boston
Market conditions
• The Greater Boston industrial market experienced its strongest leasing quarter of the year, posting 235,061 square feet of positive net absorption.
• Sales activity continues to expand in the Greater Boston industrial market. • The second quarter of the year saw 24 industrial sales transactions from properties larger than 30,000
square feet for a total sales volume of over $129 million; a significant increase from the $93 million of sales transactions seen during the first quarter of 2014.
• The development of build-to-suit projects in Greater Boston is becoming more prevalent, with Sullivan Tire and Cold Storage Solutions at the forefront totaling 300,000 square feet of development.
• The 495/Mass Pike submarket, which exhibited strong growth in the first quarter of the year, continued to be one of the best preforming industrial markets in Greater Boston. Vacancy fell 90 basis points so far this year to 8.3 percent, while availability increased 70 basis points to 15.1 percent.
Outlook• Built-to-suit projects are beginning to materialize as predicted in the previous quarter, due to the strong
leasing activity and declining vacancy and the region’s antiquated supply. • Greater Boston is experiencing the start of a new industrial development cycle. With fundamentals not
seen since the fourth quarter of 2001, we expect to see more investor activity and build-to-suit deals in the near future.
16 JLL | United States | Industrial Outlook | Q2 2014
Broward County / Ft. Lauderdale
Market conditions• Tenant demand remains steady in Broward County. We are tracking over 1.5 million square feet in active
tenant requirements from firms belonging to industry types such as consumer goods, retail, building supplies, aviation and manufacturing.
• In one of the largest deals this year for Broward County, JKG Group signed a lease for 88,000 square feet from Prudential at Quiet Waters Business Park, also in Northeast Broward.
• Increased local consumption, coupled with an improving housing sector, has strengthened market fundamentals in Broward with increased rental rates, declining vacancy and absorption gains.
• TIAA-CREF purchased a 285,000-square-foot building from Levine Properties for $50.5 million. The warehouse, a single tenant building leased by FedEx Ground, is located in Northeast Broward.
• There is moderate demand for new industrial product in Broward, as approximately 50.0 percent of the recently completed Class A buildings (delivered in the last 3-12 months) have been leased.
Outlook• According to the Greater Fort Lauderdale Alliance, the population in Broward County is expected to grow
by 22.0 percent by 2030. This will likely have a positive impact on the industrial market with increased demand for consumer goods and building supplies.
• The economic climate looks positive in Broward County with nonseasonably adjusted unemployment at 5.3 percent, compared to a 6.3 percent national unemployment rate.
• The construction sector is leading the way with a robust 12.7 percent growth rate year-over-year, with goods producing and retail trade (food and beverage / health and personal care stores) also showing positive gains of 6.4 percent and 4.6 percent, respectively. Growth in these business sectors will likely have a positive impact on the industrial market in Broward County in the near term.
• Port Everglades’ new intermodal transfer facility is up and running, allowing cargo to reach 70.0 percent of the U.S. population within four days. This will allow the port to remain competitive while driving tenant demand for industrial space over the long run.
• International trade • Port Everglades • Rebound in housing market
• New developer influx• Active owner-user market• Business assistance / Incentives
1341 West Newport Center DriveBuyer: Cosmo Int’l FragrancesSeller: Wayne Weekley$7.1 M | 84,000 s.f. | $84 p.s.f.
JLLIndustrial Snapshot ● Q2 2014
17 JLL | United States | Industrial Outlook | Q2 2014
Central New Jersey
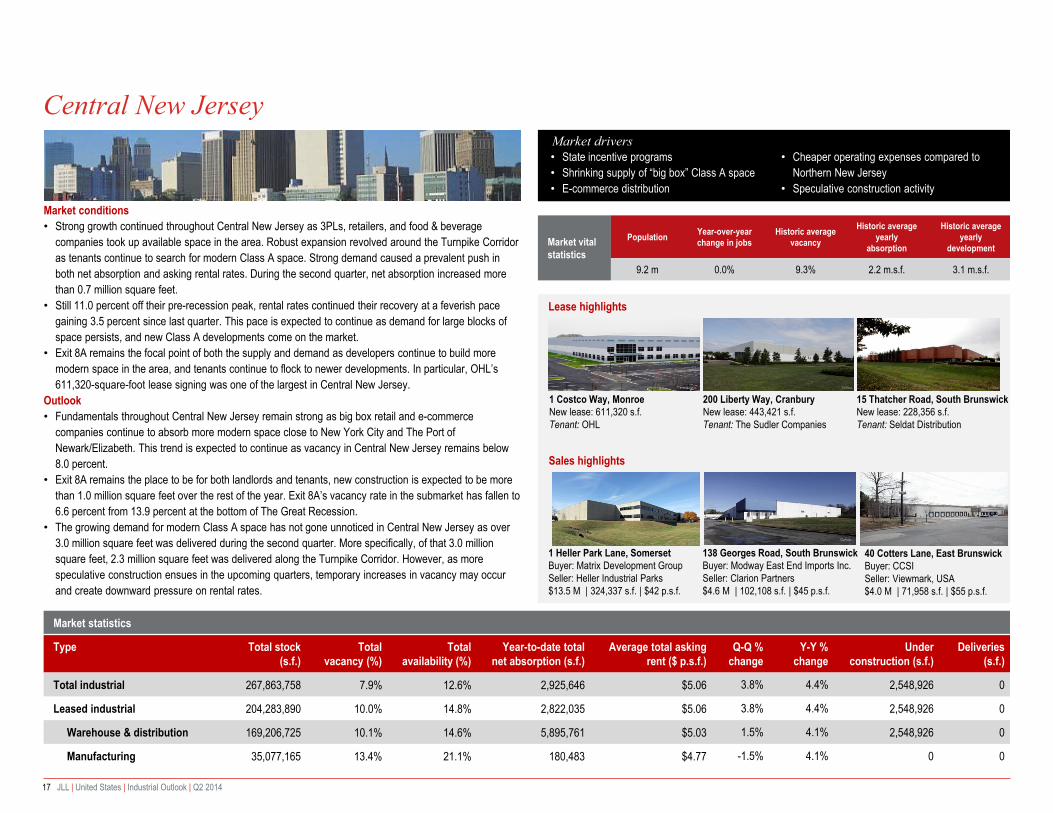
Market conditions• Strong growth continued throughout Central New Jersey as 3PLs, retailers, and food & beverage
companies took up available space in the area. Robust expansion revolved around the Turnpike Corridor as tenants continue to search for modern Class A space. Strong demand caused a prevalent push in both net absorption and asking rental rates. During the second quarter, net absorption increased more than 0.7 million square feet.
• Still 11.0 percent off their pre-recession peak, rental rates continued their recovery at a feverish pace gaining 3.5 percent since last quarter. This pace is expected to continue as demand for large blocks of space persists, and new Class A developments come on the market.
• Exit 8A remains the focal point of both the supply and demand as developers continue to build more modern space in the area, and tenants continue to flock to newer developments. In particular, OHL’s 611,320-square-foot lease signing was one of the largest in Central New Jersey.
Outlook• Fundamentals throughout Central New Jersey remain strong as big box retail and e-commerce
companies continue to absorb more modern space close to New York City and The Port of Newark/Elizabeth. This trend is expected to continue as vacancy in Central New Jersey remains below 8.0 percent.
• Exit 8A remains the place to be for both landlords and tenants, new construction is expected to be more than 1.0 million square feet over the rest of the year. Exit 8A’s vacancy rate in the submarket has fallen to 6.6 percent from 13.9 percent at the bottom of The Great Recession.
• The growing demand for modern Class A space has not gone unnoticed in Central New Jersey as over 3.0 million square feet was delivered during the second quarter. More specifically, of that 3.0 million square feet, 2.3 million square feet was delivered along the Turnpike Corridor. However, as more speculative construction ensues in the upcoming quarters, temporary increases in vacancy may occur and create downward pressure on rental rates.
• State incentive programs• Shrinking supply of “big box” Class A space• E-commerce distribution
• Cheaper operating expenses compared to Northern New Jersey
1 Heller Park Lane, SomersetBuyer: Matrix Development GroupSeller: Heller Industrial Parks$13.5 M | 324,337 s.f. | $42 p.s.f.
Market drivers
200 Liberty Way, CranburyNew lease: 443,421 s.f.Tenant: The Sudler Companies
15 Thatcher Road, South BrunswickNew lease: 228,356 s.f.Tenant: Seldat Distribution
138 Georges Road, South BrunswickBuyer: Modway East End Imports Inc.Seller: Clarion Partners $4.6 M | 102,108 s.f. | $45 p.s.f.
40 Cotters Lane, East BrunswickBuyer: CCSISeller: Viewmark, USA $4.0 M | 71,958 s.f. | $55 p.s.f.
JLLIndustrial Snapshot ● Q2 2014
18 JLL | United States | Industrial Outlook | Q2 2014
Market conditions• Overall vacancy declined for the seventh consecutive quarter to 8.6 percent, the lowest recorded rate in
over eight years. Demand for large block availabilities and owner-occupier purchases led to 1.2 million square feet of positive absorption, bringing year-to-date totals to 2.7 million square feet.
• Continued demand and declining availability of bulk-distribution space contributed to over 9.0 percent year-over-year increase in average asking rents for high-cube space. Overall market rents increased by as much in 12 months; however, the increase was primarily driven by rate hikes for this product type. Smaller multitenant light industrial and manufacturing space saw similar increases, albeit at more modest levels.
• Larger occupiers considering expansion or relocation into this market segment face an increasingly competitive leasing environment with higher market rental rates expected over the near term. This will provide more leverage for landlords in the market, and opportunities for developers to construct speculative projects catered toward specific industry needs.
• The positive momentum is driving increased investor interest in well-positioned, institutional quality leased assets in the Stockton, Lathrop and Tracy submarkets. Increased competition and pricing in the primary coastal markets is pushing capital out to emerging secondary markets like the Central Valley where there is still perceived upside potential for return on investment. As a result, capitalization rates will continue to compress and likely fall to historic low levels for Class A distribution assets.
Outlook • With only a handful of available blocks of distribution space in excess of 200,000 square feet,
developers are beginning to prepare sites for potential speculative construction projects that may yield up to 1.5 million square feet of new distribution space before year-end.
• Tenant spillover from the supply-constrained Bay Area will likely inject additional demand for remaining blocks of space as well as potential slated new construction, yielding further escalation in overall asking and contract rental rates in the near term.
• Declining blocks of bulk-distribution space• Intermodal transportation links• Transnational distribution network
• Relatively business-friendly environment• Proximity to the Port of Oakland• Availability of entitled land
19 JLL | United States | Industrial Outlook | Q2 2014
Market conditions• With another quarter of significant demand, vacancy rates continued to decline in the most established
submarkets. As vacancy tightens, tenants are finding themselves in a landlord-favorable market in most of the premier industrial submarkets.
• Average warehouse distribution asking rents continue to climb quarter-over-quarter and year-over-year. Overall, effective rents increased to $3.66 per square foot. This is the highest mark since the beginning of the recession.
• Demand among investors has grown to a level not previously seen for Charlotte’s industrial market. Multiple large block warehouse / distribution spaces sold in the range of $70.00 per square foot during the quarter.
• Development has picked up steam in 2014, as over 2.0 million square feet of projects are under way with over 90.0 percent of those being speculative. This reveals confidence among investors regarding the long-term health of Charlotte’s market.
• A major win for the region came when Giti Tire, a tire manufacturer headquartered in Singapore, signed on for a 1.8 million-square-foot, build-to-suit manufacturing facility outside of Fort Mill. Not only does this benefit the region’s economy and unemployed population, it stands as a testament for the competitiveness of U.S. manufacturing on the world scale.
Outlook• Interest in newly developed space is continuing to grow as several new speculative projects are under
way. This will give new and existing tenants that value the highest quality warehouse / distribution space an opportunity to prelease.
• Rental rates should continue to increase as metrowide vacancy rates shrink and new construction begins.
• With a limited number of viable 100,000+ square-foot availabilities, the market is left waiting for new development to deliver in order to renew a pipeline of available blocks for lease.
• Growing population is driving up demand• Development underway
648 Wilson StreetNew lease: 806,000 s.f.Tenant: International Auto Logistics
River Walk Business ParkNew lease: 300,000 s.f.Tenant: McKesson Medical
2405 Sam Wilson RoadBuyer: PrologisSeller: Sykes Industrial$17.5 M | 252,206 s.f.
10325 Ridge Creek DriveBuyer: EastGroup PropertiesSeller: Childress Klein Properties$14.5 M | 270,000 s.f.
JLLIndustrial Snapshot ● Q2 2014
Charlotte
20 JLL | United States | Industrial Outlook | Q2 2014
Chicago
Market conditions• Chicago is the second largest warehousing and distribution market in the nation based on square
footage. Market activity remains strong as the stings of the recession are in our rearview mirror. The region continues to see national and regional supply chain decisions ripple through the marketplace as activity from 3PL’s, food & beverage and automotive users have accounted for a healthy component of tenant demand.
• WP Carey took control of the largest single tenant distribution center on the market in May when the firm acquired the recently expanded, 824,000-square-foot, JM Smucker distribution center in University Park from Exeter for $47.2 million.
• Private equity group TPG acquired 10 Chicagoland assets as part of a $375 million, 40-property national portfolio from Prologis. This traded at a 7.0 percent cap rate indicating that cash-flush institutions are willing to pay up to have a footprint in Chicago and gain exposure to an improving market.
• Leasing velocity in I-80 has picked up however some of the larger blocks of space in Minooka and Joliet targeted towards super-regional distributors remain vacant.
Outlook• Chicago’s status as an inland port and center of consumption means baseline demand for warehouse
and distribution space shows little sign of slackening. However, the Southeast Wisconsin counties and the Indianapolis area offer an attractive proposition to businesses that are concerned about the state of Illinois’ precarious financial position.
• Firms with heavy import/export business and intermodal reliant firms continue to seek spaces near the BNSF and UP intermodals near Joliet as transportation costs rise due to tightening federal regulations.
• Redevelopment activity is gaining momentum in infill areas in Niles and inside Interstate 290 and along the Stevenson Expressway. Although the land basis translates into higher lease rates, users are able to save on transportation costs to reach suppliers and customers in the CBD and first ring suburbs.
• Inland port, rail line convergence• E-commerce distribution and air cargo• Consumer products and household goods
• Availability of entitled land• Uptick in speculative development
21 JLL | United States | Industrial Outlook | Q2 2014
Cincinnati
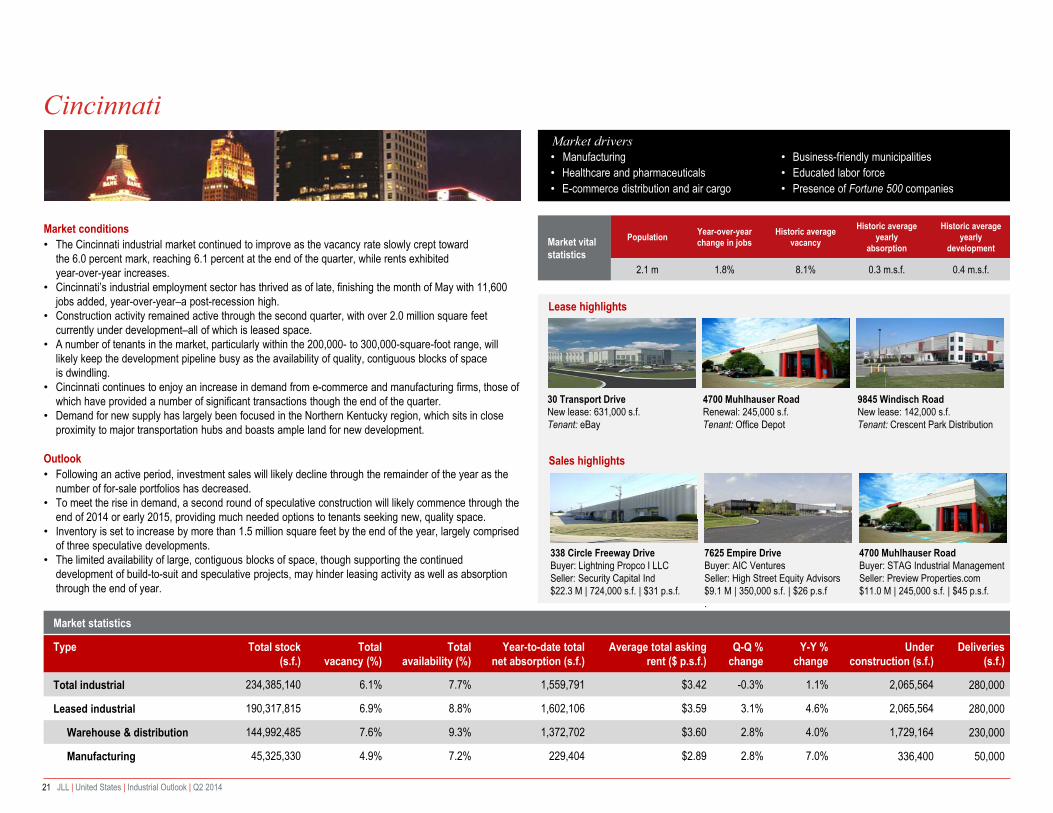
Market conditions• The Cincinnati industrial market continued to improve as the vacancy rate slowly crept toward
the 6.0 percent mark, reaching 6.1 percent at the end of the quarter, while rents exhibited year-over-year increases.
• Cincinnati’s industrial employment sector has thrived as of late, finishing the month of May with 11,600 jobs added, year-over-year–a post-recession high.
• Construction activity remained active through the second quarter, with over 2.0 million square feet currently under development–all of which is leased space.
• A number of tenants in the market, particularly within the 200,000- to 300,000-square-foot range, will likely keep the development pipeline busy as the availability of quality, contiguous blocks of space is dwindling.
• Cincinnati continues to enjoy an increase in demand from e-commerce and manufacturing firms, those of which have provided a number of significant transactions though the end of the quarter.
• Demand for new supply has largely been focused in the Northern Kentucky region, which sits in close proximity to major transportation hubs and boasts ample land for new development.
Outlook• Following an active period, investment sales will likely decline through the remainder of the year as the
number of for-sale portfolios has decreased. • To meet the rise in demand, a second round of speculative construction will likely commence through the
end of 2014 or early 2015, providing much needed options to tenants seeking new, quality space. • Inventory is set to increase by more than 1.5 million square feet by the end of the year, largely comprised
of three speculative developments. • The limited availability of large, contiguous blocks of space, though supporting the continued
development of build-to-suit and speculative projects, may hinder leasing activity as well as absorption through the end of year.
• Manufacturing• Healthcare and pharmaceuticals• E-commerce distribution and air cargo
10601 Memphis AvenueBuyer: Industrial Realty Group Seller: American Greetings$15.5 M | 1.6 m.s.f. | $10 p.s.f.
12930 Darice ParkwayBuyer: STAG IndustrialSeller: Hackman Capital Partners $8.1 M | 163,000 s.f. | $50 p.s.f.
1777 Miller ParkwayBuyer: CPA 18 GlobalSeller: Air Enterprises $7.0 M | 178,000 s.f. | $39 p.s.f.
Market conditions• As of May, total nonfarm employment in Cleveland stood at 1,041,800 workers, representing an increase
of 6,800 jobs or 66 basis points year-over-year. Meanwhile, unemployment decreased to 6.6 percent, down 60 basis points year-over-year. Jobs growth among the industrial employment sectors has been gaining steam over the last year, recording an annualized net gain of 8,200 jobs across the metro in May. And for the fourth consecutive month, all four employment sectors posted gains year-over-year.
• The Cleveland industrial market is comprised of 330.3 million square feet of warehouse, distribution and manufacturing space. Roughly 60.0 percent of which is leased property, while the remaining 40.0 percent is owner-occupied. There is an additional 21.1 million square feet of flex space spread across the market.
• Industrial vacancy has decreased steadily across the Cleveland market over recent years as both the national and regional economic recoveries have taken hold. Industrial vacancy stood at 7.3 percent at the end of second quarter, down 80 basis points year-over-year and down 1.7 percentage points from the first quarter of 2011 when total vacancy reached its most recent high-water mark of 9.1 percent.
• The average asking rent for all leased industrial space across the Cleveland market stood at $3.51 per square foot at the end of first quarter, representing an increase of 2.9 percent year-over-year and a return to levels not seen since the first quarter of 2011.
Outlook• Rents have been steadily rising, albeit marginally. While this might signal a slight shift in leverage toward
the landlord’s favor, only modest gains in rents are forecasted over the coming year. • Demand for modern warehouse space is forecasted to increase distinctly over the coming year as
employers look to add capacity. Developers are still wary of speculative construction, so look for most of this new stock to come online as build-to-suit projects.
• Demand has been increasing with relative consistency since the recession ended and will continue to make small gains over the next few years. Local manufacturers are expected to drive this growth.
23 JLL | United States | Industrial Outlook | Q2 2014
Columbus
• Strategic location within 10 hours of nearly half of U.S. population
• Excellent transportation network
• Skilled workforce and pro-business environment
• Relatively low lease rates
Columbus
Market vital statistics
Population Year-over-year change in jobs
Historic average vacancy
Historic averageyearly
absorption
Historic average yearly
development
1.8 m 0.5% 9.3% 0.7 m.s.f. 3.2 m.s.f.
Lease highlights
Sales highlights
Market drivers
Market conditions• The Columbus industrial market continued its trend of record low vacancies and below-average
unemployment levels in the second quarter–May’s unemployment level of 4.4 percent saw Columbus rank third-lowest in the nation in cities with a population totaling 1.0 million or more.
• Construction activity remains hot, as decreasing vacancy rates and increasing rental rates have supported the rise in number of speculative and build-to-suit projects during the second quarter.
• Available space options remain tight for those tenants in the market seeking greater than 100,000 square feet.
• Rental rates continue to rise as both warehouse and distribution and manufacturing properties experienced year-over-year increases through the second quarter.
Outlook• Downward-trending vacancy rates have set the stage for new development–more than 5.0 million square
feet of leased industrial space is currently under construction.• The Columbus industrial employment sector has boomed as of late, adding over 7,000 jobs year-over-
year through the month of May–its best performance in nine months.• Sinking vacancies have sparked a measured increase in rental rates, a trend that will likely continue as
developers strive to deliver new product to meet demand.• Cap rates will begin to compress as Columbus once again poses an attractive option to investors.• Inventory is set to increase by more than 4.0 million square feet by the end of the year, more than half of
which is speculative space. • Columbus has enjoyed an increase in demand for e-commerce and distribution centers as of late, a trend
that will likely remain steady in the near future.
2750 Creekside ParkwayBuyer: Cabot Properties, Inc.Seller: STRS of Ohio$16.3 M | 516,000 s.f. | $32 p.s.f.
2221-2303 John Glenn AvenueBuyer: TPG Capital, LPSeller: Prologis $8.0 M | 289,000 s.f. | $28 p.s.f
JLLIndustrial Snapshot ● Q2 2014
24 JLL | United States | Industrial Outlook | Q2 2014
Dallas / Fort Worth
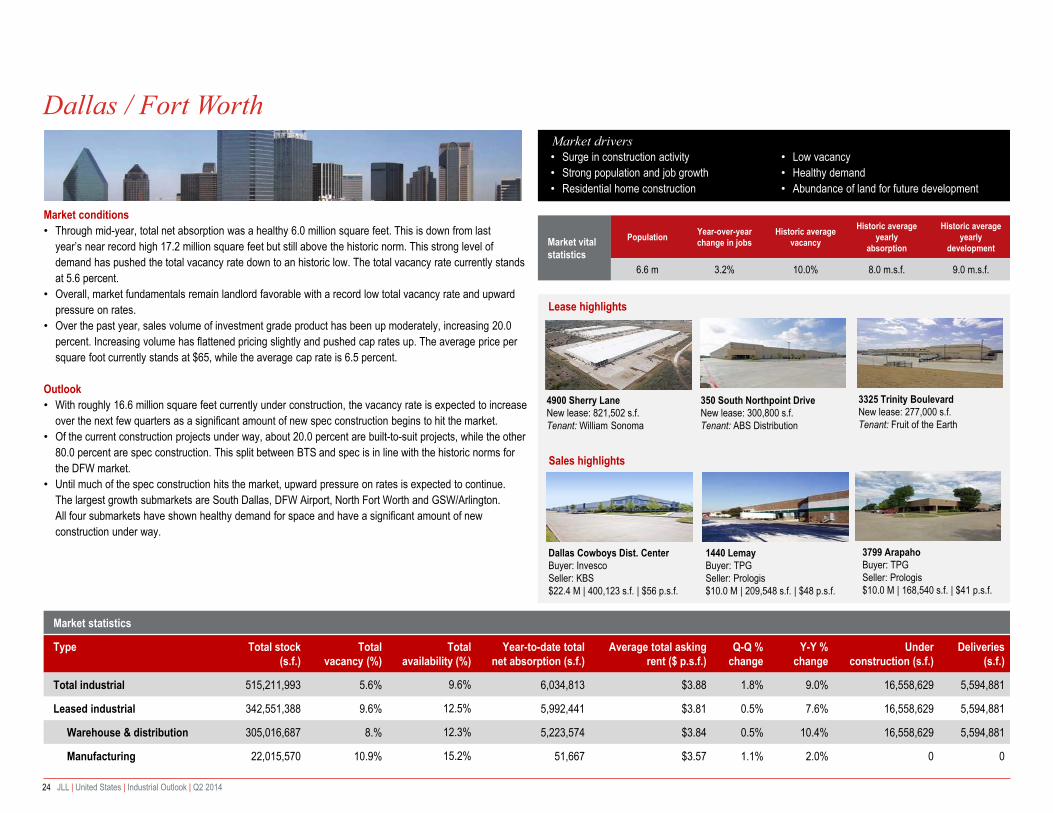
Market conditions• Through mid-year, total net absorption was a healthy 6.0 million square feet. This is down from last
year’s near record high 17.2 million square feet but still above the historic norm. This strong level of demand has pushed the total vacancy rate down to an historic low. The total vacancy rate currently stands at 5.6 percent.
• Overall, market fundamentals remain landlord favorable with a record low total vacancy rate and upward pressure on rates.
• Over the past year, sales volume of investment grade product has been up moderately, increasing 20.0 percent. Increasing volume has flattened pricing slightly and pushed cap rates up. The average price per square foot currently stands at $65, while the average cap rate is 6.5 percent.
Outlook• With roughly 16.6 million square feet currently under construction, the vacancy rate is expected to increase
over the next few quarters as a significant amount of new spec construction begins to hit the market.• Of the current construction projects under way, about 20.0 percent are built-to-suit projects, while the other
80.0 percent are spec construction. This split between BTS and spec is in line with the historic norms for the DFW market.
• Until much of the spec construction hits the market, upward pressure on rates is expected to continue. The largest growth submarkets are South Dallas, DFW Airport, North Fort Worth and GSW/Arlington. All four submarkets have shown healthy demand for space and have a significant amount of new construction under way.
• Surge in construction activity • Strong population and job growth• Residential home construction
• Low vacancy• Healthy demand• Abundance of land for future development
25 JLL | United States | Industrial Outlook | Q2 2014
Denver
Market conditions• Demand from tenants in the 10,000- to 20,000-square-foot range slowed during the second quarter in
favor of some larger requirements, helping to spur even more speculative construction. • A lack of quality space available in the market sparked more discussions regarding the need for new
speculative development; several projects have recently delivered and still more are under construction.• There have been numerous tenants who have opted for build-to-suit buildings, although this trend is
slowing in favor of speculative construction.• A neutral pricing market has generally resulted in landlords offering fewer concessions and less free rent;
however, landlords are still offering some concessions, as they are competing to retain existing and gain new tenants. Rates continued to tick upward with a 8.1 percent increase over the past year.
• There have been very few Class A buildings available to purchase for the past several years, therefore when these opportunities arise, there is very strong interest and high prices paid.
• Class B and C buildings attract interest from value-add buyers, who must purchase at conservative prices and spend substantial money on re-tenanting the building. In addition, they are faced with older, less efficient construction and tenants with local credit, as opposed to national credit.
Outlook• Leasing volume ended the second quarter with nearly 2.5 million square feet leased, bringing year-to-
date leasing activity to 4.3 million square feet. Activity is expected to continue surging in Denver. • Increased rental rates and lower landlord concessions are expected to continue, and many submarkets
are transitioning to landlord-favorable. This is likely to spur additional construction in the near future. • Several buildings delivered during the second quarter, providing some relief and large block availabilities,
especially in the I-70/East submarket where tenant demand is high.• Flex pricing has remained relatively flat over the past few quarters, but positive absorption throughout the
market this year will help push rates up in the coming quarters.
• Oil & gas industry• Intermodal transportation links• Food & beverage industry
• Business-friendly environment• Speculative construction boom• The “green” rush, aka marijuana industry
1701 West 6th AvenueBuyer: Triumph Real Estate Corp.Seller: Sears Holdings Management$16.3 M | 370,820 s.f. | $44 p.s.f.
451 South Andersen StreetBuyer: Stephanie K. StoneSeller: Eva R. Andersen$4.6 M | 66,729 s.f. | $69 p.s.f.
JLLIndustrial Snapshot ● Q2 2014
26 JLL | United States | Industrial Outlook | Q2 2014
Detroit
Market conditions• Absorption has been positive for the past two years, pulling vacancies down to within 2008 levels. The
market has also been seeing fewer large move-outs lately, allowing the recovery to play out as the auto industry ramps up production and drives growth in the local economy.
• Major tenants continue to make leasing decisions in the 100,000- to 250,000-square-foot range and the prospects for net absorption, at least in the next couple of quarters, remain solid.
• There are significant economic barriers to development in Detroit. Even before the downturn, Detroit only saw moderate levels of speculative development. As such, most of the recent construction has been build-to-suit and concentrated in the suburban submarkets.
• Sales activity in the Detroit industrial market has been sluggish thus far this year. Large trades remain extremely rare as well as outside investment dollars. Almost all the recent investment has come from local investors and has been under the $5.0 million mark.
Outlook• Demand growth will continue to favor large, modern product, and when met with fewer move-outs, the
result will be a continued firming of market fundamentals. This is particularly important since the larger products suffer from a significantly higher vacancy rate.
• With a minimal supply pipeline, marginal improvements in demand will result in a tightening of vacancies. Much of the metro’s supply has fallen into obsolescence, making demolitions seem like a good option for improving fundamentals.
• Despite a firming of the market, vacant space is still abundant. As a result, landlords have yet to truly regain the upper hand. While rents have finally ended their declines and are expected to grow over the coming quarters, growth will be modest at best.
• While a firming of market fundamentals will likely coincide with continuing gradual improvements in liquidity, transaction activity is not expected to reach 2007 levels any time soon.
• Concentration of automotive industry• Growth as an international transportation hub• Demand shifting to big box product
• Growth in green and advanced manufacturing• Minimal supply in development pipeline• Market fundamentals slowly tightening
100 Brighton Interior DriveNew lease: 179,000 s.f.Tenant: TG Fluid Systems
55500 Grand River Avenue New lease: 133,000 s.f.Tenant: Hirata Corporation
6300 Hughes DriveBuyer: Headwater HoldingsSeller: CG Emerson Real Estate Group $3.3 M | 158,000 s.f. | $22 p.s.f
10725 Harrison RoadBuyer: Dalfen America CorporationSeller: Westcore Properties $10.9 M | 312,000 s.f. | $35 p.s.f.
JLLIndustrial Snapshot ● Q2 2014
27 JLL | United States | Industrial Outlook | Q2 2014
East Bay / Oakland
Market conditions • Fueled by robust leasing activity and dwindling blocks of available space, tenants face an increasingly
competitive leasing environment as asking rents across the East Bay approach levels last seen in 2006. • With few existing alternatives larger than 50,000 square feet, tenants and landlords are getting creative
with existing and obsolete structures to renovate or improve space to meet their desired criteria. This presents an opportunity for investors and developers to purchase and redevelop commodity Class C product, as long as demand precedes the delivery of projects in the market.
• Traffic through the port of Oakland is trending 1.6 percent year-to-date. Activity is projected to continue its upward trend as suppliers move forward shipments for the holiday season. This will add increased pressure on an already supply-constrained market surrounding the Port and lead to continued rental rate increases on remaining blocks of available space.
• Developers are capitalizing on the surge in demand by breaking ground on a number of speculative development projects that are expected to deliver over the next six to 12 months. In addition, developers have an additional 2.6 million square feet of speculative and build-to-suit projects in the pipeline that are expected to break ground early next year.
• The new construction will come as a reprieve to higher-end manufacturing, e-commerce and retail distributors. Although users can expect to pay a premium for new development, proximity to the Bay Area consumer may trump relocating to inland markets like Solano or the Valley to find options that fit their criteria.
Outlook • Although already approaching historic low levels, vacancy rates are projected to continue to decline
leaving prospective tenants few alternatives in the marketplace. New development will come as a reprieve for some occupiers, but will primarily be focused toward users in the 50,000- to 150,000-square-foot range. Larger distributors may be forced to look outside of the immediate Bay Area to markets in Solano and San Joaquin counties where available options and rental rates are more favorable.
• Food and beverage distributors• Steady trade through Port of Oakland• E-commerce distribution and air cargo
• Reemergence of housing demand• Lack of large blocks and growing regional
2054 Burroughs Avenue Buyer: TerrenoSeller: Service West$13.3 M | 131,250 s.f. | $102 p.s.f.
JLLIndustrial Snapshot ● Q2 2014
28 JLL | United States | Industrial Outlook | Q2 2014
Greensboro / Winston-Salem
Market conditions• The Triad region has traditionally been defined by large textile, tobacco and furniture manufacturers. In
recent years, these industries have struggled as competition has driven production overseas. In response, the Triad has made an effort to diversify from their traditional manufacturing economy and has broadened the industries in which it recruits.
• United Furniture opted to move out of its location in the Union Cross II building for a much larger space at 401 Hanes Mill Road. This left the Union Cross II building vacant; however, a confidential tenant has already leased the entire building.
• With the lure of incentives and North Carolina being a manufacturing-friendly state, Cambro Manufacturing has announced plans for a 220,000-square-foot build-to-suit in the North Carolina Industrial Center.
• Similarly, Ashley Furniture and Ralph Lauren are under way with 1.2 million and 800,000-square-foot, respectively, expansions of their current footprints. Ashley Furniture’s location is nearby its other facilities in Davie County, while Ralph Lauren’s facility is located in I-74 Corporate Park. These expansions will result in the hiring of over 1,000 new employees in the region.
Outlook• Leasing is expected to continue to increase throughout the year as the local economy continues its
recovery. Furthermore, the growing diversification of the Triad industrial market should help stir interest from out-of-market tenants.
• Rental rates will start to increase as vacancy rates reach their lowest point since the recession and new construction begins. Speculative construction should help drive rates across the market, as landlords push their rates closer to asking price while remaining a valued alternative.
• Due to the present demand for quality space, premier 100,000-square-foot and greater warehouse / distribution availabilities should not stay vacant long.
• Growing population • Textiles, tobacco and furniture
401 West Hanes Mill RoadNew lease: 800,000 s.f.Tenant: United Furniture Industries
6550 Judge Adams RoadBuyer: Beacon PartnersSeller: GE Commercial Finance$21.6 M | 520,000 s.f.
Market drivers
1150 Pleasant Ridge RoadRenewal: 263,557 s.f.Tenant: Diebold
100 South Swing RoadBuyer: Procter & GambleSeller: TEVA Pharmaceuticals USA$18.6 M | 483,715 s.f.
JLLIndustrial Snapshot ● Q2 2014
29 JLL | United States | Industrial Outlook | Q2 2014
Hampton Roads
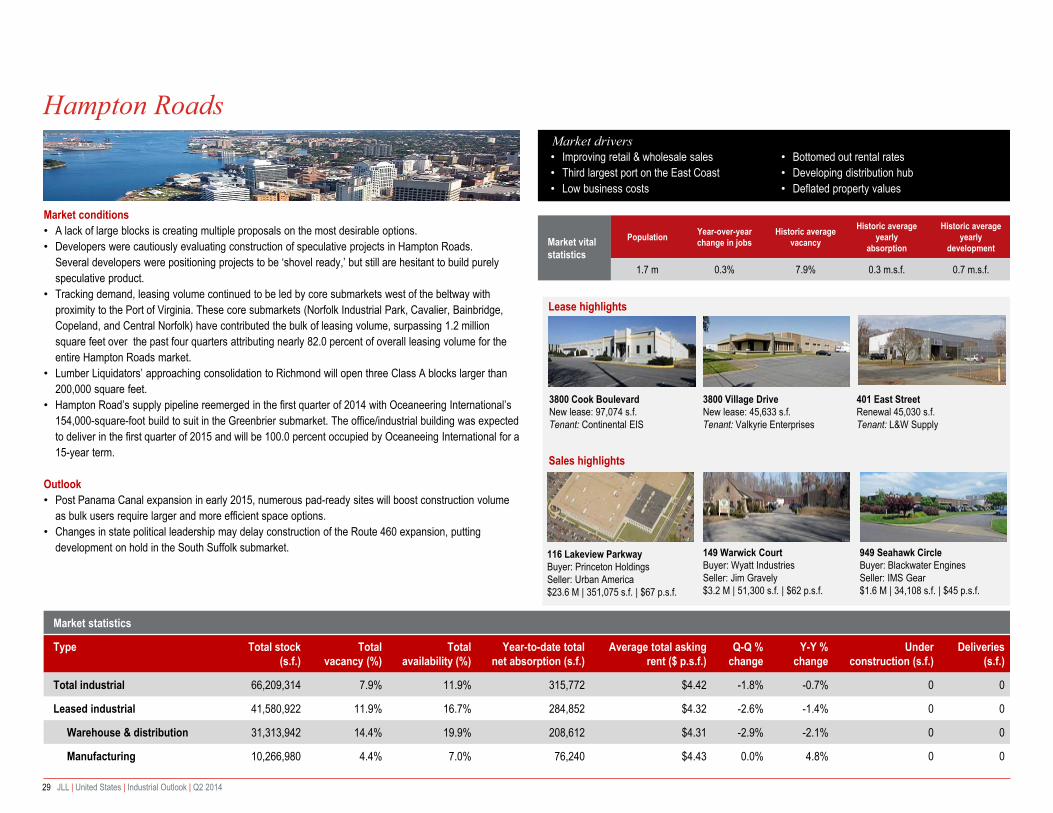
Market conditions• A lack of large blocks is creating multiple proposals on the most desirable options. • Developers were cautiously evaluating construction of speculative projects in Hampton Roads.
Several developers were positioning projects to be ‘shovel ready,’ but still are hesitant to build purely speculative product.
• Tracking demand, leasing volume continued to be led by core submarkets west of the beltway with proximity to the Port of Virginia. These core submarkets (Norfolk Industrial Park, Cavalier, Bainbridge, Copeland, and Central Norfolk) have contributed the bulk of leasing volume, surpassing 1.2 million square feet over the past four quarters attributing nearly 82.0 percent of overall leasing volume for the entire Hampton Roads market.
• Lumber Liquidators’ approaching consolidation to Richmond will open three Class A blocks larger than 200,000 square feet.
• Hampton Road’s supply pipeline reemerged in the first quarter of 2014 with Oceaneering International’s 154,000-square-foot build to suit in the Greenbrier submarket. The office/industrial building was expected to deliver in the first quarter of 2015 and will be 100.0 percent occupied by Oceaneeing International for a 15-year term.
Outlook• Post Panama Canal expansion in early 2015, numerous pad-ready sites will boost construction volume
as bulk users require larger and more efficient space options.• Changes in state political leadership may delay construction of the Route 460 expansion, putting
development on hold in the South Suffolk submarket.
• Improving retail & wholesale sales• Third largest port on the East Coast• Low business costs
• Bottomed out rental rates • Developing distribution hub• Deflated property values
149 Warwick CourtBuyer: Wyatt IndustriesSeller: Jim Gravely$3.2 M | 51,300 s.f. | $62 p.s.f.
JLLIndustrial Snapshot ● Q2 2014
30 JLL | United States | Industrial Outlook | Q2 2014
Houston
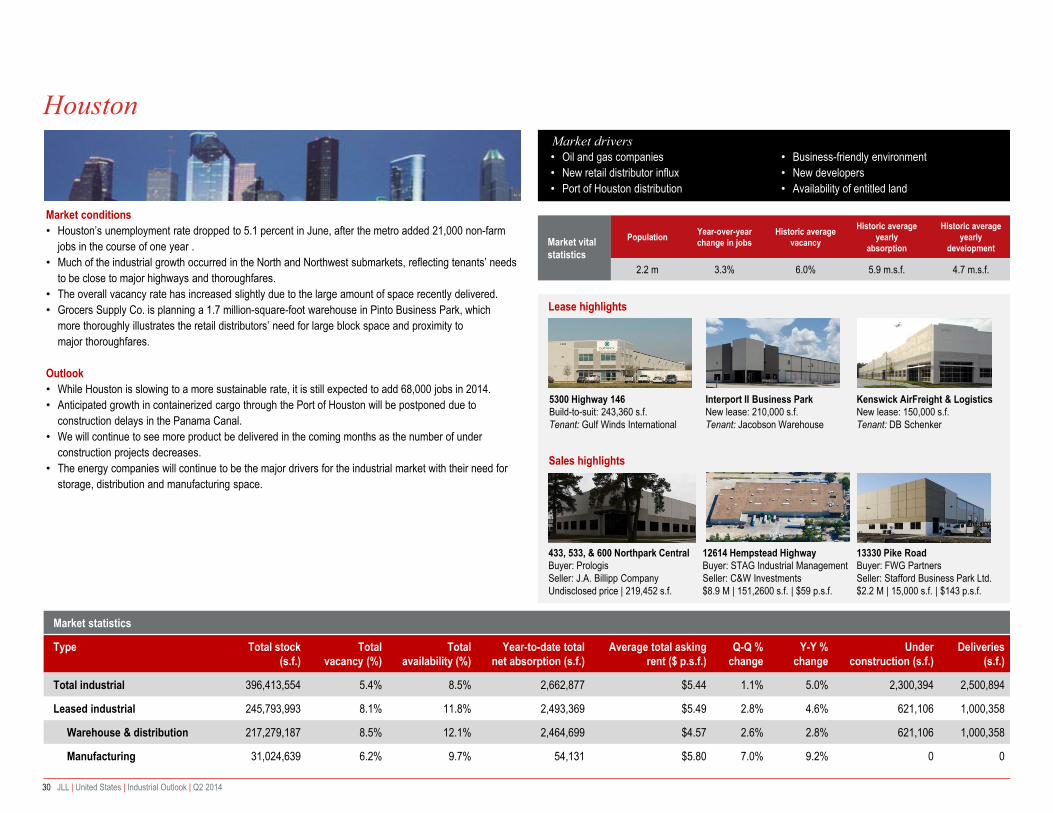
Market conditions• Houston’s unemployment rate dropped to 5.1 percent in June, after the metro added 21,000 non-farm
jobs in the course of one year .• Much of the industrial growth occurred in the North and Northwest submarkets, reflecting tenants’ needs
to be close to major highways and thoroughfares.• The overall vacancy rate has increased slightly due to the large amount of space recently delivered.• Grocers Supply Co. is planning a 1.7 million-square-foot warehouse in Pinto Business Park, which
more thoroughly illustrates the retail distributors’ need for large block space and proximity to major thoroughfares.
Outlook• While Houston is slowing to a more sustainable rate, it is still expected to add 68,000 jobs in 2014.• Anticipated growth in containerized cargo through the Port of Houston will be postponed due to
construction delays in the Panama Canal.• We will continue to see more product be delivered in the coming months as the number of under
construction projects decreases.• The energy companies will continue to be the major drivers for the industrial market with their need for
storage, distribution and manufacturing space.
• Oil and gas companies• New retail distributor influx• Port of Houston distribution
• Business-friendly environment• New developers• Availability of entitled land
13330 Pike RoadBuyer: FWG PartnersSeller: Stafford Business Park Ltd.$2.2 M | 15,000 s.f. | $143 p.s.f.
JLLIndustrial Snapshot ● Q2 2014
31 JLL | United States | Industrial Outlook | Q2 2014
Indianapolis
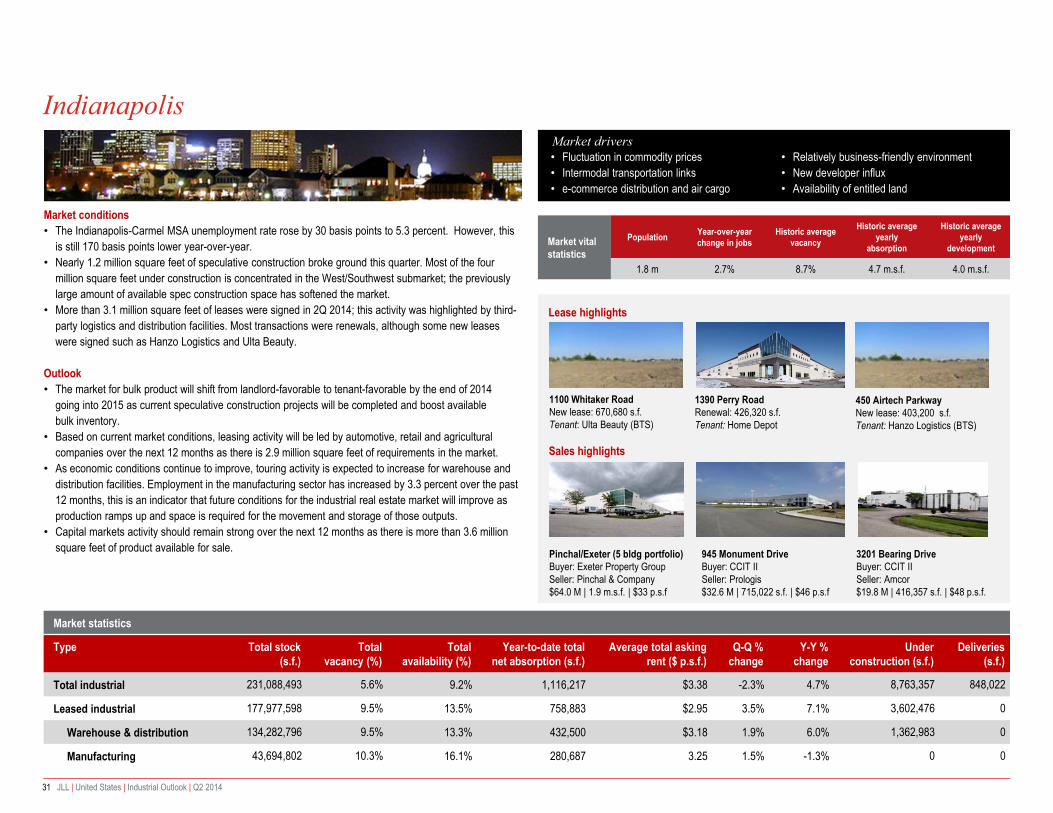
Market conditions• The Indianapolis-Carmel MSA unemployment rate rose by 30 basis points to 5.3 percent. However, this
is still 170 basis points lower year-over-year.• Nearly 1.2 million square feet of speculative construction broke ground this quarter. Most of the four
million square feet under construction is concentrated in the West/Southwest submarket; the previously large amount of available spec construction space has softened the market.
• More than 3.1 million square feet of leases were signed in 2Q 2014; this activity was highlighted by third-party logistics and distribution facilities. Most transactions were renewals, although some new leases were signed such as Hanzo Logistics and Ulta Beauty.
Outlook• The market for bulk product will shift from landlord-favorable to tenant-favorable by the end of 2014
going into 2015 as current speculative construction projects will be completed and boost available bulk inventory.
• Based on current market conditions, leasing activity will be led by automotive, retail and agricultural companies over the next 12 months as there is 2.9 million square feet of requirements in the market.
• As economic conditions continue to improve, touring activity is expected to increase for warehouse and distribution facilities. Employment in the manufacturing sector has increased by 3.3 percent over the past 12 months, this is an indicator that future conditions for the industrial real estate market will improve as production ramps up and space is required for the movement and storage of those outputs.
• Capital markets activity should remain strong over the next 12 months as there is more than 3.6 million square feet of product available for sale.
• Fluctuation in commodity prices • Intermodal transportation links• e-commerce distribution and air cargo
• Relatively business-friendly environment• New developer influx• Availability of entitled land
32 JLL | United States | Industrial Outlook | Q2 2014
Inland Empire
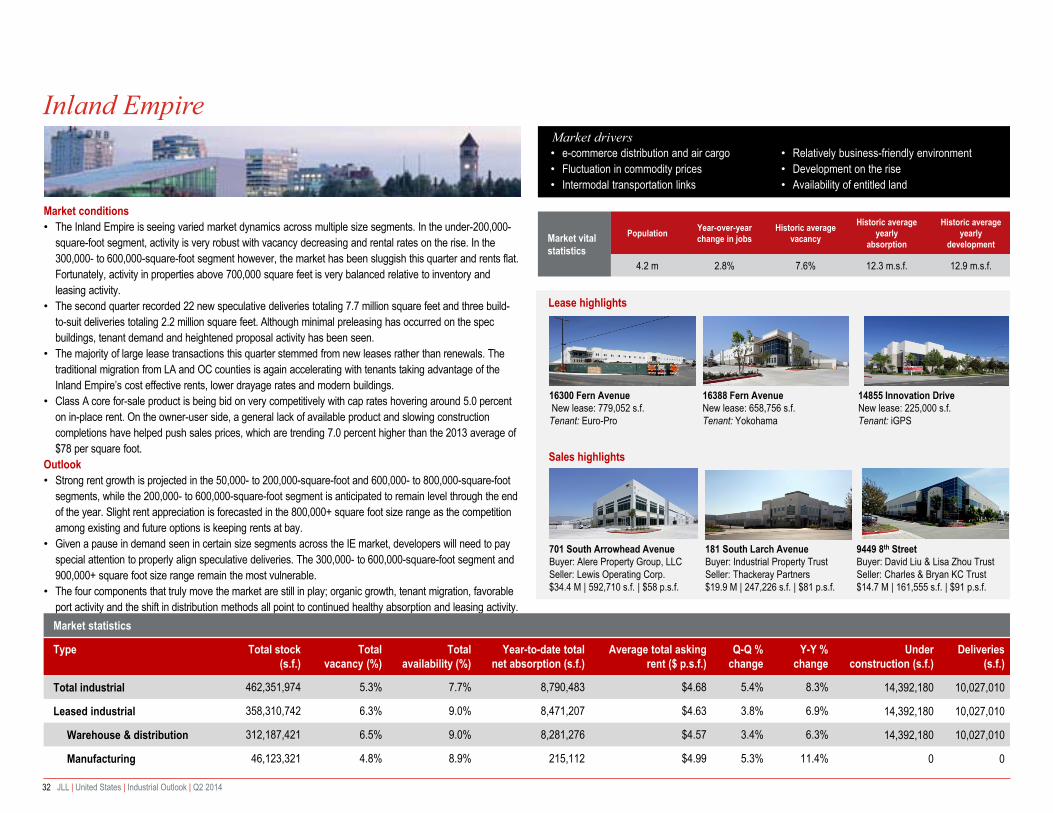
Market conditions• The Inland Empire is seeing varied market dynamics across multiple size segments. In the under-200,000-
square-foot segment, activity is very robust with vacancy decreasing and rental rates on the rise. In the 300,000- to 600,000-square-foot segment however, the market has been sluggish this quarter and rents flat. Fortunately, activity in properties above 700,000 square feet is very balanced relative to inventory and leasing activity.
• The second quarter recorded 22 new speculative deliveries totaling 7.7 million square feet and three build-to-suit deliveries totaling 2.2 million square feet. Although minimal preleasing has occurred on the spec buildings, tenant demand and heightened proposal activity has been seen.
• The majority of large lease transactions this quarter stemmed from new leases rather than renewals. The traditional migration from LA and OC counties is again accelerating with tenants taking advantage of the Inland Empire’s cost effective rents, lower drayage rates and modern buildings.
• Class A core for-sale product is being bid on very competitively with cap rates hovering around 5.0 percent on in-place rent. On the owner-user side, a general lack of available product and slowing construction completions have helped push sales prices, which are trending 7.0 percent higher than the 2013 average of $78 per square foot.
Outlook• Strong rent growth is projected in the 50,000- to 200,000-square-foot and 600,000- to 800,000-square-foot
segments, while the 200,000- to 600,000-square-foot segment is anticipated to remain level through the end of the year. Slight rent appreciation is forecasted in the 800,000+ square foot size range as the competition among existing and future options is keeping rents at bay.
• Given a pause in demand seen in certain size segments across the IE market, developers will need to pay special attention to properly align speculative deliveries. The 300,000- to 600,000-square-foot segment and 900,000+ square foot size range remain the most vulnerable.
• The four components that truly move the market are still in play; organic growth, tenant migration, favorable port activity and the shift in distribution methods all point to continued healthy absorption and leasing activity.
• e-commerce distribution and air cargo• Fluctuation in commodity prices • Intermodal transportation links
• Relatively business-friendly environment• Development on the rise• Availability of entitled land
33 JLL | United States | Industrial Outlook | Q2 2014
Jacksonville
Market conditions• The Jacksonville industrial market continued to fill vacancies during the quarter as 309,741 square feet of
positive total net absorption was recorded, following 410,256 square feet of positive absorption in the first quarter. While positive, the net gain over the last three quarters totaled only 149,791 square feet, due to almost 600,000 square feet added back to the market during the fourth quarter of 2013.
• Overall vacancies ended the quarter at 10.7 percent, down 40 basis points from the first quarter and down 30 points from a year ago. The second quarter rate came in 180 basis points below its five-year moving average.
• Demand for warehouse and distribution space continues to drive the bulk of activity in Jacksonville’s industrial market at the half year mark. Year-to-date, leased warehouse and distribution space has captured roughly 1.0 percent of the total leased industrial stock, which amounts to just over 700,000 square feet of positive absorption.
• In contrast, demand for leased manufacturing space – which makes up just over a quarter of the total manufacturing stock – has been nonexistent during the first half of the year. For the larger property set tracked by JLL (30,000 square feet and up), leasing activity has been nil since the beginning of the year. And although leased manufacturing space experienced 39,000 square feet of positive absorption during the second quarter, this was from deals that were inked in 2013.
Outlook• Given the continued improvement in overall economic conditions in the Central-North Florida region, we
expect industrial market fundamentals to strengthen further as the second half of 2014 gets under way. • Recent port developments will also help spur future demand for industrial space in Jacksonville.
Construction recently broke ground on the Port of Jacksonville’s new intermodal container transfer facility at Dames Port. The new facility, which is expected to be completed during the second half of 2015, will facilitate the direct transfer of cargo containers between vessels and trains, increasing port efficiencies in order to drive more business activity to the area.
• Improving trade volume • Low real estate prices• Port of Jacksonville
• Improving business environment• Growth of neighboring industrial markets• Intermodal connectivity
4055 Deerpark Boulevard Buyer: The Simpson OrganizationSeller: Bradley Associates$14.5 M | 246,818 s.f. | $59 p.s.f.
JLLIndustrial Snapshot ● Q2 2014
34 JLL | United States | Industrial Outlook | Q2 2014
Kansas City
Market conditions• Positive net absorption continued into the second quarter and year-to-date total exceeded 1.2 million
square feet. • Speculative development continues to be prevalent throughout the market with over 2.3 million square
feet in the construction pipeline.• Auto plant suppliers continue to make headlines with the recent announcement of a new 275,000-
square-foot facility in Riverside, Missouri for Martinrea International, Inc.• Logistics Park Kansas City continues to experience brisk development activity with an additional pad site
completed to accommodate a 679,897-square-foot building as well as plans and permitting under way for a minimum 500,000-square-foot spec building.
• Although concessions still exist, market rents continue to increase slightly.
Outlook
• Major announcements absorbing approximately one million square feet anticipated within 60 to 90 days.• Projects experiencing leasing success in speculative buildings intend to continue with additional phases
of development on a speculative basis.• Institutional portfolios currently on the market may trade by year-end 2014.
3400 Western (Shetakis)Buyer: 3400 Western Ave, LLCSeller: Shetakis Trust$5.5 M | 105,000 s.f. | $52 p.s.f.
7000 West Post RoadBuyer: ColeSeller: Quarry Capital$19.4 M | 95,899 s.f. | $202 p.s.f.
Market conditions• The vacancy rate took a dip to 10.5 percent during the second quarter, continuing the ongoing narrative
that increased demand for product in the Las Vegas Valley has been solidly established. • Second quarter lease activity centered in the 50,000- to 100,000-square-foot range and was market-
wide. The remaining large blocks of available space continue to be in play, with one of the two largest blocks of available space to be leased to a well known retailer.
• The largest single availability in the market continues to be a freestanding 214,000-square-foot vacancy in the NE/North Las Vegas submarket, although Prologis will shortly break ground on a 460,000-square-foot, 36-foot clear, Class A facility with planned delivery in the second quarter of 2015.
• With few exceptions, most landlords have now made 5.0 to 10.0 percent upward adjustments on lease rates, primarily in the NE/NLV submarket.
• We are currently tracking approximately 3.1 million square feet of build-to-suit interest in the Las Vegas Valley with nine active prospects—many of which are multi-market searches. Deliveries in the second quarter totaled 220,000 square feet and included a 180,000-square-foot food distribution project for Nicholas & Co. and a 40,000-square-foot expansion for Tapia Brothers.
• Appetite for investment product is high and competition fierce, pushing some sale prices well above replacement cost, something not seen since 2007.
Outlook• Little evidence suggest a slowdown in activity throughout the rest of 2014. We’ll see continued upward
pressure on rents across all product types.• Regionally, the Northeast/North Las Vegas submarket will remain competitive despite upward pressure
on rents, and the Southwest submarket, where rents and pricing are the highest, will continue to primarily serve gaming and “Strip”-related industries.
• Following the announcement made last quarter by Prologis regarding its speculative project at Bay Lake Trail, more developers will commit to breaking ground during the third quarter expanding the amount of deliverable product for 2015.
36 JLL | United States | Industrial Outlook | Q2 2014
Long Island
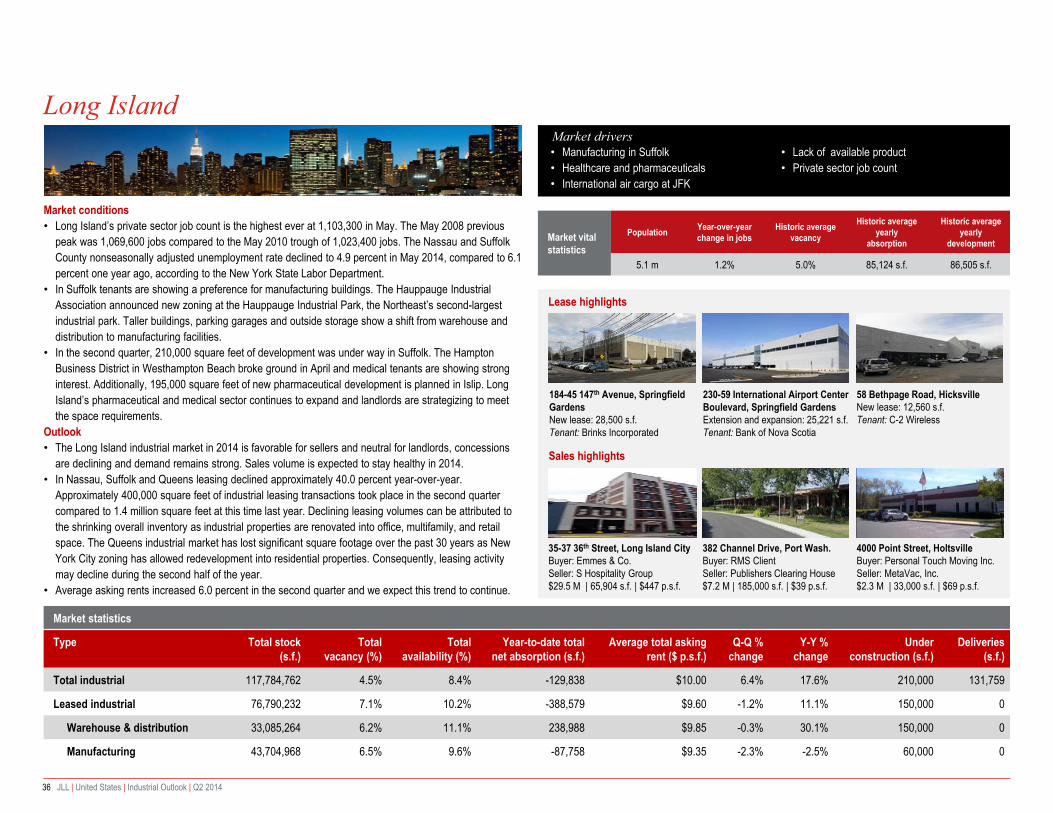
Market conditions• Long Island’s private sector job count is the highest ever at 1,103,300 in May. The May 2008 previous
peak was 1,069,600 jobs compared to the May 2010 trough of 1,023,400 jobs. The Nassau and Suffolk County nonseasonally adjusted unemployment rate declined to 4.9 percent in May 2014, compared to 6.1 percent one year ago, according to the New York State Labor Department.
• In Suffolk tenants are showing a preference for manufacturing buildings. The Hauppauge Industrial Association announced new zoning at the Hauppauge Industrial Park, the Northeast’s second-largest industrial park. Taller buildings, parking garages and outside storage show a shift from warehouse and distribution to manufacturing facilities.
• In the second quarter, 210,000 square feet of development was under way in Suffolk. The Hampton Business District in Westhampton Beach broke ground in April and medical tenants are showing strong interest. Additionally, 195,000 square feet of new pharmaceutical development is planned in Islip. Long Island’s pharmaceutical and medical sector continues to expand and landlords are strategizing to meet the space requirements.
Outlook• The Long Island industrial market in 2014 is favorable for sellers and neutral for landlords, concessions
are declining and demand remains strong. Sales volume is expected to stay healthy in 2014. • In Nassau, Suffolk and Queens leasing declined approximately 40.0 percent year-over-year.
Approximately 400,000 square feet of industrial leasing transactions took place in the second quarter compared to 1.4 million square feet at this time last year. Declining leasing volumes can be attributed to the shrinking overall inventory as industrial properties are renovated into office, multifamily, and retail space. The Queens industrial market has lost significant square footage over the past 30 years as New York City zoning has allowed redevelopment into residential properties. Consequently, leasing activity may decline during the second half of the year.
• Average asking rents increased 6.0 percent in the second quarter and we expect this trend to continue.
• Manufacturing in Suffolk • Healthcare and pharmaceuticals• International air cargo at JFK
• Lack of available product• Private sector job count
184-45 147th Avenue, Springfield GardensNew lease: 28,500 s.f.Tenant: Brinks Incorporated
35-37 36th Street, Long Island City Buyer: Emmes & Co. Seller: S Hospitality Group$29.5 M | 65,904 s.f. | $447 p.s.f.
Market drivers
230-59 International Airport Center Boulevard, Springfield Gardens Extension and expansion: 25,221 s.f.Tenant: Bank of Nova Scotia
58 Bethpage Road, Hicksville New lease: 12,560 s.f.Tenant: C-2 Wireless
382 Channel Drive, Port Wash.Buyer: RMS Client Seller: Publishers Clearing House $7.2 M | 185,000 s.f. | $39 p.s.f.
4000 Point Street, Holtsville Buyer: Personal Touch Moving Inc.Seller: MetaVac, Inc. $2.3 M | 33,000 s.f. | $69 p.s.f.
JLLIndustrial Snapshot ● Q2 2014
37 JLL | United States | Industrial Outlook | Q2 2014
Los Angeles
Market conditions• The overall vacancy rate in the Los Angeles market diminished to 4.0 percent, reaching its lowest point
since the first quarter of 2008. As space options are dwindling and demand for modern warehouse facilities remains strong throughout the county, decision makers are expressing an increased sense of urgency to lock down space.
• The second quarter saw a mix of sizeable renewals as well as significant new transactions and expansions from a varied tenant mix.
• Quality Class B product is seeing heightened leasing activity; consequently, inventory of this caliber in excess of 100,000 square feet is shrinking to past peak levels, particularly in the port-adjacent South Bay submarket.
• Purchase opportunities for both investment and owner-user properties remain highly constrained, producing near-peak pricing with the potential for beyond-peak rents in the near term.
• Investors are now considering acquisitions outside of the core markets, thanks to sustained leasing activity and significant vacancy decreases in the most popular markets.
Outlook• Continued rent increases are projected in leading submarkets, particularly in quality, Class B product
given current inventory constraints and high tenant demand levels. • The competition for quality product bodes well for both landlords and sellers as negotiating power is in
their favor and fewer concessions will be required to secure tenants in quarters to come.• Although no decisions have yet been made regarding the current contract negotiation between the
International Longshore and Warehouse Union and the Pacific Maritime Association (which expired July 1), the forecast is positive as no reports of disruption or slowdowns have been reported thus far. This is of particular significance as the Ports of Los Angeles and Long Beach handle more than 40.0 percent of U.S. imports and drive industrial demand in many L.A. submarkets.
• Strengthening TEU counts in both ports and relative stabilization in the long-stagnant airfreight sector support near-term optimism.
6100 Garfield AvenueNew lease: 615,000 s.f.Tenant: 99 Cent Only Stores
5301-5303 Rivergrade RoadBuyer: AEW Capital ManagementSeller: LBA Realty$37.4 M | 635,566 s.f. | $117 p.s.f.
Market drivers
2201 East CarsonRenewal: 521,856 s.f.Tenant: Sony
1650 South Central AvenueRenewal: 418,344 s.f.Tenant: St. George Logistics
2030-2060 East 7th StreetBuyer: Shorenstein Properties LLCSeller: Imperial Toy Corp$35.0 M | 300,542 s.f. | $116 p.s.f.
13235 Golden State RoadBuyer: Reyes Holdings LLCSeller: Allied Beverages, Inc.$31.0 M | 220,087 s.f. | $140 p.s.f.
JLLIndustrial Snapshot ● Q2 2014
38 JLL | United States | Industrial Outlook | Q2 2014
Memphis
Market conditions• While the market cooled off in Q2 from Q1, tenant activity is up significantly over this time a year ago. • Supply of Class A bulk space is at minimum and rental rates are increasing in that product type. Mid-
sized space and Class B demand is increasing and rents while lagging behind Class A are going up. • Memphis had over 3.3 million square feet delivered in 2013 and has over 3.9 million square feet currently
under construction.• Panattoni began building a 1.0 million-square-foot design build for Volvo during the quarter with
completion expected by year-end. Nike is expanding its newly constructed 1.1 million-square-foot facility by another 1.3 million square feet.
• IDI continues to be the most active speculative developer in Memphis and they are experiencing positive results and activity from their newly constructed assets. Prologis and Panattoni both commenced construction on speculative buildings during the quarter.
• Exeter, Hillwood and IIT are the most active buyers, with each acquiring several million square feet over the past couple of years.
Outlook.• Rents will continue to increase in both Class A and B assets throughout the remainder of 2014.• Leasing volumes will continue to accelerate in 2014 as corporate confidence continues to strengthen.• The gap between asking and effective rates have tightened throughout 2014 and will get tighter through
the end of the year.• The market will continue to shift towards being landlord-favorable after being tenant-favorable for a
number of years. • There continues to be more investor demand for Class A product than supply. Investor demand for Class
B will increase throughout 2014 due to tenant activity increasing significantly.
• Busiest cargo airport in North America • Five Class I rail lines• $1.2B spent on rail infrastructure
• 3rd busiest trucking corridor in U.S.• 4th largest inland port in U.S.• Home to FedEx WorldHub
Memphis
Market vital statistics
Population Year-over-year change in jobs
Historic average vacancy
Historic averageyearly
absorption
Historic average yearly
development
1.3 m 0.9% 13.0% 2.7 m.s.f. 2.9 m.s.f.
Market drivers
Lease highlights
Sales highlights
5166 Pleasant HillRenewal: 648,758 s.f.Tenant: CEVA Logistics
39 JLL | United States | Industrial Outlook | Q2 2014
Miami-Dade
Market conditions• Tenant confidence continues to remain strong with several new-to-market tenants with larger blocks of
space leasing up, as evidenced by Amazon.com signing a full-building lease with KTR to occupy 336,000 square feet at Miami Int’l Distribution Center in Airport West.
• Although many leases have been signed, there is a steady flow of touring activity from new users in Airport West and Medley.
• Approximately 80.0 percent of the industrial product delivered in the past four quarters is leased, demonstrating that flight-to-quality remains a strong trend.
• In the largest deal this year to date, CEVA Logistics renewed 365,000 square feet with Clarion Partners in Airport North.
• Investor competition is high for quality industrial assets in the metro. In Medley, Morgan Stanley purchased two properties totaling 344,000 square feet at Flagler Station, paying $40.5 million for the recently constructed warehouse buildings.
Outlook• Primary drivers of growth for this market will continue to be foreign trade, tourism and residential
construction, fueled by local consumption-related demand and population growth, impacting building supply companies and consumer goods distributors.
• The “Faster is Fresher” campaign has been launched at PortMiami to encourage growers and shippers to send their produce through Miami instead of Philadelphia. With this, we anticipate a growing need for additional refrigerated and freezer warehouse space.
• The new billion-dollar tunnel project linking PortMiami to the interstate has been delayed by two months due to malfunctioning exhaust fans and a leaking pipe, but it is expected to open to traffic in early August 2014. This should improve cargo traffic by connecting the MacArthur Causeway to Dodge Island and by providing direct access between the seaport and highways I-395 and I-95.
• Tourism & hospitality• Increased residential construction• International trade / local consumption
• Foreign capital • New developer influx• Miami Int’l Airport & PortMiami
11200 Northwest 138th StreetBuyer: Income Property TrustSeller: Prologis$4.1 M | 41,000 s.f. | $100 p.s.f.
Miami-Dade
JLLIndustrial Snapshot ● Q2 2014
40 JLL | United States | Industrial Outlook | Q2 2014
Milwaukee
Market conditions• Tenant and occupier demand on the manufacturing side is strong while warehouse space maintains
stability in the marketplace.• Milwaukee industrial remained steady as the second quarter came to a close. • Some of the new developments in the pipeline are in the Kenosha and Racine area, but in Milwaukee
County, Wispark LLC has plans for a 220-acre business park in Oak Creek and in Washington County the Village of Germantown and MLG Development have a proposed 192-acre business park in consideration.
• The dearth of available space here has pushed landlords to be thinking twice about free rent and tenant improvements (although some still offer it); the anticipation is that fewer, rather than greater, concessions are in line for the future.
Outlook• Concessions given by the landlord will become less now that supply of space has tightened and demand
has improved. Leasing volumes will increase as the year progresses.• Area wide vacancy will push downward based on an increase in leasing velocity during the next couple
of quarters.• Both the state and local levels have offered favorable incentives such as tax increment financing districts
which have enabled Milwaukee manufacturers to re-shore and build expanding workforce sectors.• As such, the vacancy rate will dwindle throughout the next couple of quarters.• As momentum for new construction picks up within certain submarkets; developers are seeking more
land to keep up with the demand. • Success in recapitalization by investors could lead to more opportunities for selling off investment
properties as interest increases.
• Consumer products and household goods• Manufacturing
• Business-friendly environment• New developer entering market
10001 South Howell Avenue New lease: 305,065 s.f.Tenant: Joy Global
700 West North Shore Drive Buyer: Medline Industries Inc Seller: Triad Group Inc $7.1 M | 285,000 s.f. | $25 p.s.f.
Market drivers
9630-9650 South 54th Street Renewal: 87,000 s.f.Tenant: BD Medical
12000 West Wirth Street New lease: 36,960 s.f.Tenant: Johnson Controls
2800 West Custer Avenue Buyer: Jonco Industries Seller: Rock-Tenn Converting Co $1.6 M | 202,592 s.f. | $8 p.s.f.
Three building portfolioBuyer: ABC Investor LLCSeller: CenterPoint Properties $27.3 M | 1.2 m.s.f. | $23 p.s.f.
JLLIndustrial Snapshot ● Q2 2014
41 JLL | United States | Industrial Outlook | Q2 2014
Minneapolis / St. Paul
Market conditions• The Minneapolis-St. Paul MSA saw its unemployment rate decrease 10 basis points to 4.0 percent in
May, the lowest unemployment rate among U.S. metro areas with at least one million residents. A total of 62,400 industrial-using jobs have now been added since hitting a recessionary low in February 2010 andMay marked the 44th month in a row with year-over-year industrial-using job gains locally.
• Vacancy rates are near 15-year lows and quality industrial product is in high demand from both a tenant and an investor perspective. Tenant demand is being driven by the healthy job growth in the industrial-using sectors. Job growth is also fueling investor demand, along with cheap and plentiful debt and higher yields relative to primary markets.
Outlook• In addition to the 750,000 square feet of speculative bulk product already delivered to the local market
this year, 2.5 million square feet of additional speculative construction is either under way or set to commence prior to the end of 2014. Nearly 70.0 percent of the new speculative product will have 32-foot clear heights and the average building size is 156,000 square feet.
• Many question whether demand will be strong enough to support the large amount of speculative product being constructed, particularly since a number of large users with specialized space requirements have recently announced or begun construction on build-to-suit projects. In fact, more than 2 million square feet of build-to-suit projects are either under construction or set to begin construction before the end of the year, including projects by FedEx, Wurth Adams, Room & Board, Bayer CropScience, Perbix and Ruan Transportation Management Systems.
• Minneapolis-St. Paul is rising to the forefront as an established multitenant data center market. By mid-2014, the Twin Cities will have 543,000 square feet of multitenant data center space. The recent entry of multiple established data center providers coupled with expansions and upgrades by existing providers will increase market availabilities for larger, wholesale colocation or powered shell end-users. Developers increasingly recognize that the Twin Cities data center market has been underserved from a supply perspective in comparison to other emerging markets such as Denver and Phoenix, both of which have smaller GDPs and half the number of Fortune 500 companies.
• Substantial increase in construction activity• Limited modern bulk space• Strong Medical Technology community
• Home to 18 Fortune 500 companies• Educated and skilled workforce• Active Agricultural and related companies
7601 North Northland DriveBuyer: Altus PropertiesSeller: ASB Capital Management$9.4 M | 111,660 s.f. | $84 p.s.f.
Market drivers
11225 Xeon StreetNew lease: 146,000 s.f.Tenant: Life Fitness
Dean Lakes BoulevardNew lease: 135,000 s.f. (BTS)Tenant: Bayer CropScience
501 Shenandoah DriveBuyer: Elm Tree FundsSeller: Scannell Properties$24.4 M | 175,000 s.f. | $139 p.s.f
9201 West Broadway AvenueBuyer: Artis REITSeller: Duke Realty Corporation$4.5 M | 73,000 s.f. | $62 p.s.f.
* Note: Flex / office showroom not included
JLLIndustrial Snapshot ● Q2 2014
42 JLL | United States | Industrial Outlook | Q2 2014
North Bay, California
Market conditions• The rapid recovery of the wine industry and organic growth of other industries in the region have been
key drivers for the Napa and Solano county industrial market in recent quarters. Overall vacancy sits at 8.6 percent, down from 9.2 percent 12 months prior.
• Rental rates held steady sustaining pre-recession levels. At the end of the second quarter asking rents were $0.45 per square foot, NNN across all product types, the same rate as the period 12 months prior.
• Total net absorption declined by 154,981 square feet during the quarter, the first negative value since the third quarter of 2011. The decline was attributed to one major vacancy at 1000 Vaughn Road in Dixon of 209,350 square feet by Gymboree and another moderately large vacancy of 45,650 square feet in Fairfield by DBI Beverage at 237 Lopes Road. Several leases are expected to commence by year-end, including ICON Aircraft’s new 137,000-square-foot headquarters location in Vacaville and Saxco International’s 471,000-square-foot build-to-suit in Fairfield, leading to further vacancy declines and provide additional leverage for landlords over the near term.
Outlook• Developers have already responded to growing demand and are coming on line with new speculative
developments over the coming quarters. Panattoni Development Co. has a 270,000-square-foot rail-served warehouse building in the planning stages, expected to break ground this summer in American Canyon. Dennis Paulley’s 531 Technology Way is nearly complete; a 103,000-square-foot warehouse building still available for lease. Greenwood Business Park in Napa has began construction on phase I of the 226,044-square–foot warehouse with intent to start phase II, a 78,731-square-foot separate component, in the coming quarters located on the corner of Devlin Road and Airport Boulevard.
• Food and beverage distributors• High capacity water supply & sewer systems• Re-emergence of housing demand
• Lack of large blocks and growing regional demand from bulk distributors
43 JLL | United States | Industrial Outlook | Q2 2014
Northern New Jersey
Market conditions• Northern New Jersey picked up the tepid pace set in first quarter of year. Thanks in part to the signing of
several large leases in the Meadowlands, and strong demand throughout Bergen County, net absorption turned to positive for the second quarter.
• Landlords throughout Northern New Jersey have remained bullish and continue to raise their asking rental rates. Since the second quarter of 2013, asking rents have increased 4.1 percent. Similarly, concessions have decreased, and lease terms have increased as landlords look to lock in higher rents for greater periods of time.
• Even though space has historically been tight around The Port of Newark/Elizabeth, vacancy rates were driven upward by two speculative buildings that were delivered during the second quarter 2014. Within the Port submarket, Clarion Partners completed its 277,244-square-foot Dowd Avenue project in Elizabeth. The Morris Companies’ delivered its 352,000-square-foot warehouse at 60 Lister Avenue in Newark.
• Leasing activity surged ahead throughout many Bergen County submarkets. Both the Northwestern Bergen and the Central Bergen submarkets recorded vacancy declines in excess of 200 basis points. This can be attributed to demand from small entrepreneurial tenants that continue to grow.
Outlook• Strong market fundamentals endure as Northern New Jersey vacancy rates remained below 8.0 percent
and rental rates continued to push toward their pre-recession peaks. The Port submarket’s elevated vacancy rate is expected to stabilize over the year, as large built-to-suit projects are delivered in following quarters.
• Space in the coming quarters is expected to become tighter as leasing activity picks up throughout the second half of the year; which is typically more active than the first half of the year. This could leave many tenants in the market with few options when current leases expire.
• State incentive programs• Limited available Class A stock• Low supply of “big box” space
100 Meadowlands Parkway, Secaucus New lease: 450,000, s.f.Tenant: Ferguson Supply
400 South 2nd Street, Elizabeth Buyer: North American TerminalsSeller: Heller Industrial Parks $8.1 M | 78,600 s.f. | $103 p.s.f.
Market drivers
5 Empire Boulevard, South Hackensack New lease: 135,000 s.f.Tenant: Icon Eyewear
201 Bay Avenue, Elizabeth Renewal: 119,521 s.f.Tenant: Urban Express
100 Raskulincez Road, Carteret Buyer: LM Foods Seller: B & KOL, LLC$4.5 M | 71,480 s.f. | $63 p.s.f.
50 Williams Drive, Ramsey Buyer: Prestige MotorsportsSeller: BRD Associates $6.2 M | 75,000 s.f. | $83 p.s.f.
JLLIndustrial Snapshot ● Q2 2014
44 JLL | United States | Industrial Outlook | Q2 2014
Orange County
Market conditions• Following last quarters’ employment downturn due to seasonal layoffs, Orange County added 29,900
jobs year-over-year, due in part to the construction sector rallying.• Although net absorption changed directions with the first negative growth quarter since 2012, this will
likely not be a continuing trend. A large amount of deals are expected to take occupancy shortly after the close of the second quarter. This should give net absorption the spark to continue its recent positive trend throughout the rest of 2014.
• Leasing activity remains steady, which is consequently driving up purchase and lease prices around the market.
• With Orange County quickly approaching pre-recession occupancy levels, competition is increasing among many users, especially in the 100,000- to 200,000-square-foot range. As prices continue to move towards peak levels and availability wanes, this is forcing tenants to stay put and renew, consider new developments or build-to-suit options, or look to neighboring submarkets.
Outlook• Based on evaluations of current tenants in the market and deals under negotiation, the 100,000- to
200,000-square-foot “sweet spot” in Orange County’s market will continue to see the majority of the market’s lease and sale activity.
• As vacancy rates continue to drop and rental rates continue to rise, Orange County is becoming increasingly more attractive to developers, which will lead to an elevated number of groundbreakings throughout the market.
• The story in 2014 and 2015 will be likely rent growth. The market has shown some appreciation over the past year, but is expected to increase as owners respond to the imbalance of demand and supply.
• Market leverage is quickly shifting to landlords, but opportunities do exist for tenants outside of the most sought-after size and quality segments.
• Lack of available blocks over 100,000 s.f.• Strong activity by owner/users • High demand for modern industrial space
• High activity among “sweet spot” users• Dissipating uncertainty• Increasing competition for large blocks
45 JLL | United States | Industrial Outlook | Q2 2014
Orlando
Market conditions• Orlando’s industrial market continues to strengthen amid improving economic conditions, which is driving
demand for industrial space in the metro area. During the second quarter, overall total net absorption was 378,971 square feet or 0.4 percent of the total stock, more than reversing the first quarter net loss of 1,301 square feet.
• Year-to-date, total net absorption stood at 377,670 square feet, which was down compared to previous years due to a drop in demand during the first quarter. With that, the overall vacancy rate came in at 10.0 percent, down 50 basis points from the second quarter of 2013.
• Consistent demand over the past few past years – overall total net absorption has been positive in the last 12 out of 13 quarters – has led to increasingly higher asking rates. At the close of the quarter, total average asking rates were up 7.2 percent from a year ago, continuing the trend of strong year-over-year rent growth recently.
• The second quarter average asking rate of $4.62 per square foot was 3.2 percent higher than its five-year moving average, but 2.6 percent below its 10-year moving average.
• Robust rental rate appreciation and steady demand growth, along with a dwindling supply of newer space, has driven new speculative development in recent quarters. Currently, out of the nine industrial projects tracked by JLL that are were recently completed or are currently under construction, eight were speculative developments.
Outlook• As we shift to the second half of 2014 we expect fundamentals in Orlando’s industrial market to continue
to improve. Recent indicators, such as new speculative development, robust rental rate appreciation and consistent demand growth are all the signs of a growing market.
• As economic conditions improve and generate new demand for industrial space, landlords (especially landlords of more modern spaces) will continue to experience more favorable conditions in the second half of 2014.
• Tourism• Defense manufacturing and research• Pharmaceutical manufacturing and distribution
• Homebuilders and construction• e-commerce and air cargo• Availability of entitled land
2290 Premier RowBuyer: FortressSeller: HDG Mansur$8.0 M | 106,440 s.f. | $75 p.s.f.
JLLIndustrial Snapshot ● Q2 2014
46 JLL | United States | Industrial Outlook | Q2 2014
Palm Beach
Market conditions• Much like the rest of South Florida, Palm Beach has experienced tighter market fundamentals, as
vacancy dropped 120 basis points from the previous quarter while absorbing 1.4 percent of the total stock so far this year.
• Despite the increased demand, average asking rents have declined this quarter, particularly for manufacturing blocks of space due to lack of high-quality, Class A manufacturing buildings. Manufacturing rates are down 13.9 percent since the first quarter and a staggering 27.0 percent since this time last year.
• Boca Distribution Center was sold by Prologis for $7.2 million. The buyer was Industrial Property Trust (IPT) and the 72,000-square-foot building is 100.0 percent leased.
• The industrial gains in Palm Beach County can be attributed to a positive economic climate, especially with regard to the construction sector which has seen a 10.2 percent increase from the previous year.
• McCraney Property Company is under way on two speculative, Class A warehouse/distribution buildings totaling 100,000 square feet at Vista Business Park. The buildings are located at Okeechobee Boulevard and Jog Road in West Palm Beach and are the first new projects at the park since 2009.
Outlook• The speculatively planned inland port projects that are expected to deliver over the next 15 to 20 months,
juxtaposed with the All Aboard Florida high-speed rail service proposed in South Florida, will likely support rising tenant demand in the county.
• As the unemployment rate continues to fall (currently at 6.1 percent) and the housing sector stabilizes, local consumption is expected to rise further, fueling the demand from industrial users such as home-building supply firms and furniture distributors.
• Demand for higher quality industrial product will prompt several opportunities for build-to-suit and major speculative projects at vacant land sites, as seen in West Palm Beach at Vista Business Park.
1 Kane LaneBuyer: Gladstone CommercialSeller: Kane Warehousing955,535 s.f. | $40 p.s.f.
Market conditions• The Philadelphia market posted strong results throughout the second quarter with more than 3.0 million
square feet of total net absorption. Vacancy remained stable at 8.6 percent. • Construction is still playing an important role in market activity. The second quarter marked the highest
construction deliveries in more than two years, and the projects came to market 92.7 percent preleased. • Leasing activity was up from the previous quarter and the market saw several large blocks of leased up.
These blocks of space will begin to see occupancy over the next several quarters; adding to net absorption. Despite several large blocks of space, in the form of new vacancies and speculative deliveries, coming to market over the same time period, vacancy should remain stable through strong leasing and preleased construction deliveries.
• There were only four investment sales during the second quarter as a result of limited actionable opportunities. Velocity has been slow due to a buy and hold mentality, but offerings are highly liquid due to significant investment interest in the market. New benchmarks for one-off assets are being set on a quarterly basis as a result. The sales totaled 2.4 million square feet and averaged $74 per square foot and 6.25 cap rates for Class A assets.
Outlook• Limited Class A availabilities, tightening Class B availabilities, and competition for well located, entitled
development sites is expected to begin pushing rental rates and sales pricing past historical highs. The market’s low vacancy rate should remain stable or even decline while continuing to grow in size at a record pace through new construction. Small- to mid-sized tenants are also expected to play growing roles in the demand for space.
JLLIndustrial Snapshot ● Q2 2014
48 JLL | United States | Industrial Outlook | Q2 2014
Phoenix
Market conditions• Total net absorption across all industrial product in Phoenix reached 4.6 million square feet in the second
quarter, surpassing the total net absorption of the entire year in 2013.• The current spike in absorption was largely driven by build-to-suit activity that was delivered this quarter.• Phoenix, especially in the Southwest Valley, continues to struggle to fill several vacant, large blocks of
space that are larger than 250,000 square feet. A large portion of the demand continues to be driven by small- to mid-sized tenants across the valley.
• The large absorption gains helped drive vacancy lower in the second quarter despite an active development pipeline.
• More than 1.3 million square feet of development has broken ground in the Southwest, accounting for 50.0 percent of construction in the valley.
Outlook• Phoenix’s economy is steadily moving forward every quarter, but has yet to reach its pre-recessionary
peak. As the manufacturing sector slowly improves, Phoenix’s positive economic growth is expected to continue through the latter half of the year.
• Intel and Apple have both invested in large manufacturing facilities which may help stimulate that lagging sector of the economy.
• Phoenix’s competitive edge lies in its favorable demographics and lower business costs compared to neighbors such as California. New activity stemming from outside of the state will help drive Phoenix’s growth through the forecast horizon.
• Transportation links to California markets • Favorable business environment• Low natural disaster risk
• Young, affordable, qualified work force• Right-to-work employment environment• Large developable land inventory
4550 West Watkins StreetNew lease: 181,760 s.f.Tenant: Omco Solar
1755 South 75th AvenueBuyer: LBA RealtySeller: Buzz Oates Enterprises$28.0 M | 682,291 s.f. | $41 p.s.f.
Market drivers
2592 East Hannah RoadRenewal: 201,666 s.f.Tenant: Kuehne and Nagel
3401 West Papago StreetNew lease: 88,488 s.f.Tenant: HBI International
1666 North McClintock DriveBuyer: ARCP FE Tempe AZSeller: Tempe BTS$16.1 M | 146,142 s.f. | $110 p.s.f.
109 North 37th AvenueBuyer: Ashley FurnitureSeller: Cobalt Industrial REIT$13.8 M | 208,835 s.f. | $66 p.s.f.
JLLIndustrial Snapshot ● Q2 2014
49 JLL | United States | Industrial Outlook | Q2 2014
Pittsburgh
Market conditions• Pittsburgh’s industrial fundamentals were largely unaffected by the recession and are in solid condition.
The oversupply and big tenant move-outs common elsewhere in recent years have bypassed this metro. • Energy exploration continues to have a positive effect on Pittsburgh’s industrial market as the drilling,
processing, storage and transportation of natural gas remains strong. • Big deals were sparse in Pittsburgh over the course of 2013 and leasing activity is not expected to
increase dramatically over the next few quarters. • Although numerous large blocks of space exist, very little is premium space. Consequently, larger users
in the market will be limited to renewals or built-to-suit projects. • Gordon Food Service broke ground on a 420,000-square-foot distribution center at the Findlay Industrial
Park. The project marks Pittsburgh’s first major industrial development since 2009. The facility is scheduled to open in Spring 2015 and is expected to eventually employ up to 300 people.
• CSX Corporation announced plans to build a $50.0 million intermodal facility on 70 acres in Stowe Township. CSX is currently finalizing the planning and permitting process. Acquisition of the site is expected to take place early next year with construction beginning in 2015.
Outlook• While the tight vacancy rate will prompt some construction over the forecast, only modest demand growth
is expected, which will curb developers from adding a significant amount of new supply to the market. • Asking rents are expected to continue their gradual growth within key submarkets including North, West,
Westmoreland and Washington. Declining fundamentals in other submarkets though will keep the metro-wide average asking rent relatively unchanged over the next few quarters.
• Tenants will continue to seek flexibility to allow them to properly navigate the uncertain global economy.• Sales volume is forecasted to be flat during the second half of 2014 since limited quality product is
for sale.
• Oil and natural gas exploration• Topography presents development challenges• Limited large blocks of premium space
• Resilient healthcare & finance sectors• Relative strength of metro economy• Growth in value-add manufacturing
102 Technology DriveNew lease: 62,000 s.f.Tenant: National Oilwell Varco
One 21st StreetBuyer: CoosemansSeller: Consumer Fresh Produce $3.7 M | 87,000 s.f. | $43 p.s.f.
1900 Route 51Buyer: Mcneilly Realty Associates Seller: Dick Corporation$1.9 M | 61,000 s.f. | $32 p.s.f.
JLLIndustrial Snapshot ● Q2 2014
50 JLL | United States | Industrial Outlook | Q2 2014
Portland
Market conditions• Industrial employment growth, specifically in manufacturing and construction, continues to decrease
availability of industrial space in the Portland region, driving vacancy to 5.1 percent, the lowest level since the mid-1990s.
• The market saw robust net absorption during the second quarter, bringing year-to-date totals to nearly 1.4 million square feet, excluding flex, on pace to exceed demand for any year during the past five.
• Rents in the region are inching up as well, with overall industrial rents up 2.2 percent year-over-year as market momentum clearly shifts to the landlord, especially for tenants seeking modern functional space.
• The current market environment is prompting a string of new development activity and the construction pipeline has increased dramatically over the past quarter. Over 500,000 square feet of industrial product delivered during the second quarter, bringing the deliveries year-to-date above 2013 total deliveries.
• Of significance is the pickup in speculative development activity with several new projects expected to break ground before year’s end.
• In addition to a hearty leasing atmosphere, investor interest in the market remains strong, though sales volume remains muted due to limited product availability. The largest sale of the quarter was Stockbridge Capital’s acquisition of the IIT Airport Way portfolio, which contained 13 properties totaling over 475,000 square feet and sold for $35.8 million.
Outlook• With vacancy at a historic low and only three new developments in the pipeline set to deliver by the end
of 2014, the pattern of increasing rents and decreasing vacancy will continue throughout the year. • The pendulum has clearly swung in favor of landlords and owners as tenants and users struggle to find
functional, well-located options for their businesses. This leverage will continue until significant speculative construction delivers to the market.
• Market conditions are making Portland’s Industrial market increasingly favorable to investors and sales activity is expected to pick up as existing owners try to anticipate the market’s pricing peak.
• Strong traded-sector economy• Growing trend of regional distribution centers • Dwindling supply of functional space
• Appetite for institutional-grade product• Diverse pool of small- and mid-size users• Construction pipeline filling
4630 NE 166th AveNew lease: 65,800 s.f.Tenant: Pathfinder Logistics
Cross Dock Truck TerminalBuyer: Winkler Development Seller: North American Terminals$13.2 M | 96,007 s.f. | $137 p.s.f.
Lake Oswego Corporate CenterBuyer: Micro Systems EngineeringSeller: Wattumull Properties$14.0 M | 158,000 s.f. | $89 p.s.f..
JLLIndustrial Snapshot ● Q2 2014
* Note: Flex not included
51 JLL | United States | Industrial Outlook | Q2 2014
Reno / Sparks
Market conditions• Reno was flat in the second quarter. There was 185,405 square feet of negative net absorption. The
vacancy rate was 9.3 percent. TRIC vacancy increased to 9.8 percent, while Central Reno declined to 3.7 percent. South Reno and S. Lyon County experienced minor negative absorption (again).
• Major landlords are pushing rental rates. Most available large block space is being quoted at an average of $3.84 per square foot, on a NNN basis. Smaller spaces from 25,000 to 100,000 square feet average $5.50 per square foot, on a NNN basis.
• There are two buildings under construction: The Zulily building in TRIC, and 395 Logisticenter in the North Valleys market.
• Rental rates vary based upon area, building condition, power, clear height, loading and other factors. With both activity and absorption increasing, the market continues to move to landlords’ favor.
• Larger transactions include the Chewy sublease in TRIC and ITS Logistics in Sparks.
Outlook• Dermody Properties’ spec construction of a 624,000-square-foot distribution facility indicates a high level
of confidence that Reno will continue to grow and attract new tenants. The building is designed to accommodate e-commerce users.
• Zulily’s and SanMar’s build-to-suits will deliver in the fourth quarter. • Toys ”R” Us was successful in its 303,000-square-foot sublease; Chewy, a pet foot distributor, took
occupancy of the space this quarter. • Landlords are gaining leverage due to improving occupancy, costs for tenant improvements and changes
in the credit markets, as well as changes to the credit-worthiness of tenants. • Most industrial space users will likely see increasing rents over the next few years.
• Leverage shifting to landlords• Few options for large block space• Speculative development in the pipeline
52 JLL | United States | Industrial Outlook | Q2 2014
Richmond
Market conditions• The second quarter of 2014 produced the highest levels of leasing recorded in the past 12 quarters with
over 1.3 million square feet signed.• The largest contributor to overall volume was by Hewett Packard's 425,000-square-foot renewal at 7001
Technology Boulevard, which placed over 300,000 square feet back on the market in the East End. Due to high demand for modern, high-bay product, the bulk of this surplus space was immediately absorbed by Premier Fixtures and Syncreon, leasing a combined 281,445 square feet at the Class A asset in the second quarter as well.
• High demand for quality space and lack of construction in the Richmond market pushed Class A vacancy down to 4.4 percent since peak levels of 13.6 percent recorded in the second quarter of 2009.
• Major announcements continued to make headlines with Shandong Tranlin Paper Co’s decision to invest $2.0 billion for a new manufacturing facility in Chesterfield County. Encompassing 650 acres, this facility removed a large development parcel out of the Richmond inventory, leaving a majority of prime sites concentrated in the White Oak Technology Park and the Meadowville Technology Park.
Outlook• Expect development centered around large-scale technology and commerce parks with existing
infrastructure. Speculative construction will be concentrated in smaller parks with immediate access to major interstates.
• Several large, Class A leases were in negotiations in the first quarter which will continue to contract vacancy in this class segment.
• Medline’s consolidation to its new distribution center in the I-95/I-295/Rt-10 Corridor will open a 116,000-square-foot block in the Southwest Quadrant upon completion.
• Above-average state & local incentives • Highly skilled, low cost labor force • Developing high-tech manufacturing
• Low cost of living • Proximity to Port of Virginia and DC• Right-to-work state
53 JLL | United States | Industrial Outlook | Q2 2014
Sacramento
Market conditions• The industrial real estate sector continued to tighten during the second quarter with increased tenant
demand, declining blocks of space, and rising asking rental rates. Leverage has largely shifted into the hands of landlords in most primary and secondary submarkets, particularly among distribution and light industrial assets where supply is increasingly limited.
• Overall vacancy declined for the fifth consecutive quarter to 11.1 percent. Class A bulk distribution, excluding the Lincoln submarket, sat at 7.9 percent at the end of the quarter with only a handful of available alternatives larger than 100,000 square feet.
• Smaller occupiers seeking less than 15,000 square feet continue to enjoy tenant-favorable conditions with multiple lease-ready options to choose from. However, landlords are beginning to react to improving market conditions by increasing asking rental rates for light industrial and distribution warehouse space.
• Year-to-date absorption topped 1.6 million square feet, and is on par to surpass levels achieved in 2013. Demand was diverse and characterized by both leasing and user sale activity. The top five transactions in the quarter were all over 100,000 square feet, indicating continued traction from occupiers in this segment of the market.
Outlook• Regional developers are beginning to take the idea of speculative construction more seriously as they
witnessed the landscape of available product dwindle and asking rates increase back to pre-recession pricing. Areas with development-ready land, like Southport in West Sacramento, stand to benefit over the next six to 12 months as current demand leaves prospective tenants with few viable options to choose from.
• Sales & service-related users • Availability of Class A product• Big box demand
54 JLL | United States | Industrial Outlook | Q2 2014
Salt Lake City
Market conditions• The Salt Lake market continued to prove its one of the nation’s premier hubs for distribution. As a result,
a number of users either made new or renewed long-term commitments to Utah.• Demand is increasing and so are rental rates in the Class A bulk distribution and flex sectors.• There is minimal industrial land remaining within the Salt Lake Valley. The Great Salt Lake to the west
and the Wasatch Mountains to the east limit the amount of land that can be developed. • Class A space is in short supply relative to demand. Additionally, tenant requirements and
distribution/retail channel shifts are demanding tailored building specifications. This has resulted in an optimistic outlook for industrial development within Utah. Investor confidence is at a record high, with major developers having staked their land positions.
• Construction is expected to continue leading market activity due in part to comparative replacement costs, functional obsolescence, and tightening Class A availabilities. More than 2.0 million square feet of development is anticipated to begin within the next six to 12 months with a planned total of 6.7 million square feet.
Outlook• Strong employment growth and recovery in the housing market has been steady over the last few
quarters which will translate into increased demand for industrial product. • This has been an active summer with both existing tenants and new tenants looking to grow into Salt
Lake City. • Leasing volumes will continue to accelerate over 2014 as confidence continues to strengthen. • Investment sales activity is at its peak since the recession which will continue during 2014. The challenge
is finding product to purchase.• Speculative construction will drive landlords with existing product to get creative to win tenants.• Growth will remain steady within manufacturing, composites, aerospace and e-commerce.
• Crossroads of the West I-80, I-15 and Intermodal Hub
• Low power rates with manufacturing
• E-commerce• Right-to-work employment environment• Young, affordable, qualified work force
Salt Lake City
Market vital statistics
Population Year-over-year change in jobs
Historic average vacancy
Historic averageyearly
absorption
Historic average yearly
development
1.1 m 2.7% 4.8% 2.3 m.s.f. 2.4 m.s.f.
Lease highlights
Sales highlights
900 South 3800 West New lease: 113,000 s.f.Tenant: UPS
4475 West 700 SouthBuyer: Exeter Property GroupSeller: Pacific Landing III$15.0 M | 345,686 s.f. | $43 p.s.f.
Market drivers
1790 South 5200 West New lease: 78,790 s.f.Tenant: Professional Hospital Supply Inc.
4475 West 700 SouthNew lease: 113,483 s.f.Tenant: ESCO
1760 North 2200 WestBuyer: 220 West, LLCSeller: Capitol Industries $14.0 M | 180,000 s.f. | $78 p.s.f.
6050 West 700 SouthBuyer: IITSeller: Buzz Oats.$21.2 M | 415,842 s.f. | $51 p.s.f.
55 JLL | United States | Industrial Outlook | Q2 2014
San Antonio
Market conditions• Leasing activity has been vigorous throughout the year, with vacancy now down more than 300 basis
points from the same period last year• A new study by Forbes named San Antonio the fourth best city for manufacturing jobs, with five-year
growth in this sector topping 11 percent• Construction is steady, with only one new project delivered in the third quarter – a new facility for an
affiliate of Caterpillar, Inc. A handful of projects are slated for delivery in the next few months, and new product coming online is nearly 100 percent pre-leased.
• Average asking rents rose again in the third quarter, demonstrating consistent growth over the last few quarters.
• Leasing activity remains concentrated in the northern submarkets and outlying counties.
Outlook• Leasing volume has grown throughout the course of the year, as tenant confidence has grown in the local
market. However, lease concessions remain commonplace as the market continues a slow and steady recovery from the national recession.
• Most of the recent deliveries, as well as current construction, have been concentrated in the northern area of the city, where leasing and corporate activity are robust.
• Local activity among some industrial titans is strong, with Caterpillar, Toyota and Boeing grabbing headlines and ramping up local business in recent months.
• Sales volume has yet to show a significant increase, and substantial activity is not expected until early to mid-2013, at the earliest.
• Diverse, counter-cyclical business sectors• Proximity to major interstate highways• Corporate manufacturing activity
• Eagle Ford Shale activity• Business-friendly environment• Attractive local and state incentives
San Antonio
Market vital statistics
Population Year-over-year change in jobs
Historic average vacancy
Historic averageyearly
absorption
Historic average yearly
development
2.2 m 2.5% 8.0% 1.7 m.s.f. 1.3 m.s.f.
Lease highlights
Sales highlights
Market drivers
Market conditions• For the 12 months ending in June, San Antonio added 22,500 jobs, for a year-over-year growth rate of
2.5 percent.• Unemployment in San Antonio ended the quarter at 4.7 percent, a significant improvement from the city’s
5.9 percent unemployment rate at the same time last year, and far lower than the national average of 6.1 percent.
• Sales activity was slow during the quarter, and the transactions to the right reflect deal closings from the first three months of the year.
Outlook • The Eagle Ford Shale continues to drive strong, and significant vacancies in the industrial market
remain scarce.• With limited availability in existing industrial projects and high preleasing requirements at most proposed
developments, tenants in the market are increasingly exploring build-to-suit options. • Though there are several large requirements circling the market, the majority of the deals being signed
are for smaller tenants.
Thousand Oaks Business Park IIINew lease: 57,000 s.f.Tenant: Sun Action Trackers
56 JLL | United States | Industrial Outlook | Q2 2014
San Diego
Market conditions• San Diego’s recovery continued to gain momentum, with industrial market fundamentals improving in the
second quarter. Moreover, industries closely tied to the demand of industrial product saw notable growth this past year; trade, transportation and utilities added 3,500 jobs and manufacturing was up 1,700 jobs.
• Following strong absorption throughout 2013 and the start of 2014, net absorption declined dramatically this quarter. The second quarter posted 277,482 square feet of positive net absorption, a 71.3 percent decline from last quarter. However, given sustained absorption gains, vacancy continued to decrease across all industrial product types. With 6.5 percent vacant, direct vacancy is lower than pre-recession levels, when it averaged around 7.5 percent.
• Flex/R&D space continues to be of interest to many investors; nearly 60.0 percent of this quarter’s sales were flex/R&D space suggesting that many investors are banking on continued growth of the region’s knowledge and science-based industries.
• With minimal new spec development in the pipeline for San Diego’s industrial market, tenants will have to choose among existing properties to meet their needs this year. Though, as firms continue to expand, occupiers’ growing requirements will help drive vacancy rates even lower and push rents up, propelling San Diego further along its road to recovery.
Outlook• Overall industrial rents have not recovered to historic peak levels, but with the supply-constrained
conditions and growing demand for space, rents are expected to continue toward their recovery. All other market fundamentals continue to improve, indicating a strengthening of the industrial market over the remainder of the year.
• Technology and biotechnology firms will continue to expand, diminishing vacancy in flex / R&D space. Submarkets in the North Cities will see most of this growth as they are historically the hubs for technology and life sciences firms.
• Small-box market to cater to local tenants’ needs
• Well-educated, local workforce
• VC funding points towards sustained growth in biotech and life science industries
810 Dexter Avenue N Buyer: Holland Partner GroupSeller: Alexandria Real Estate$19.0 M | 1.4 acres | $201 p.s.f./Land
Market drivers
Macy's Distribution CenterNew lease: 527,118 s.f.Tenant: Macy's
Kent Valley I Distribution CenterNew lease: 145,871 s.f.Tenant: Richardo Beverly Hills
2302 West Valley Highway NBuyer: Smart Markets FundSeller: Morgan Stanley$14.1 M | 167,023 s.f. | $84 p.s.f.
418 Valley Avenue NWBuyer: DCT Industrial Trust Seller: Haub Family Revocable Trust$22.9 M | 237,686 s.f. | $96 p.s.f.
Market conditions• Overall activity within the industrial market remained strong in Q2 2014. Year-to-date absorption
exceeded 2.1 million square feet and additional new development was delivered to the market.• Demand from small- to mid-sized users remains strong and there are still a number of large tenants
looking for space. Smaller tenants still have a number of options in the market, but larger tenants are vying for large blocks of space in newly constructed buildings, since there are currently few existing options for them. Development is primarily taking place in the Southend due to low vacancy and high tenant demand in the area.
• The investment market has been centered around off-market deals and buyers positioning for land acquisitions and future development. Owners have kept an eye on the improving market conditions but have been reluctant to take their properties to market as they anticipate the peaking cycle. However, institutional investors have taken notice of the strong market fundamentals in the Seattle-Bellevue market and have been aggressive in acquiring both existing product, typically through unsolicited offers, as well as land in order to develop new product in the near-mid term.
Outlook• Tenant demand will stay strong for the foreseeable future and new development will continue through
2016. Rental rates will continue to rise, but as significant development hits the market, the increase in rental rates will start to level off.
• Looking forward, the most recent employment forecast from the Puget Sound Economic Forecaster called for job growth of 2.5 percent in 2014, substantially higher than the 1.6 percent expected nationwide. Growth is expected to remain at an impressive rate of 2.2 percent in 2015.
• Boeing, in recent months, has taken actions that will help strengthen the overall industrial market. The decision in Q1 to keep its 777X production line in Puget Sound is going to lead them to develop a 1.1 million-square-foot complex in Everett. This deal will help secure thousands of Washington jobs within Boeing and will also help to retain thousands of additional jobs with third-party contractors and subsidiaries. Boeing has also been actively leasing flex space in the Northend market, helping to drive down vacancy rates in the area.
JLLIndustrial Snapshot ● Q2 2014
58 JLL | United States | Industrial Outlook | Q2 2014
South Bay / Silicon Valley
• Rapid employment growth• Growing net migration• Strong business environment
1001 Ridder Park DriveNew lease: 124,592 s.f.Tenant: Spansion
2220 Martin AvenueBuyer: Menlo EquitiesSeller: McClellan Real Estate Co.$12.5 M | 91,502 s.f. | $137 p.s.f.
495 East Brokaw RoadBuyer: Tung Tai GroupSeller: Barry Turkus$5.8 M | 78,980 s.f. | $73 p.s.f.
Market conditions• Technology and high-tech manufacturing continue to be the primary driver for the South Bay industrial
market, stemming from the robust employment growth in this market segment over the past 18 months. As a result, overall vacancy declined for the fourth consecutive quarter to 8.5 percent, down from 9.5 percent in the first quarter of 2013.
• Despite the limited number of large blocks, no warehouse or manufacturing space is currently in the pipeline. Developers are much more focused on office and R&D projects in the San Jose and Mountain View submarkets, a higher yield play than traditional industrial development.
• The Fremont submarket is benefiting from a spillover of demand for high-tech manufacturing users that in some cases are being pushed out of the San Jose market by office-using tenants. Its proximity to the burgeoning tech hub and availability of land makes it an ideal location for developers looking to capitalize on growing demand from this segment of the market.
• Investment activity has slowed for warehouse and manufacturing space, but some opportunistic investors are buying obsolete industrial assets with intentions to raze the existing property and redevelop the site into office, R&D or mixed-use in hopes to capitalize on the strong demand from both tech tenants and the influx of new residents in the market.
Outlook• Rents will continue their upward climb, driven by steady demand and lack of available space. • Demand for high-tech manufacturing as a result of reshoring and start-up activity in the Bay Area will
drive demand for new development and renovation projects. However, competition for available land may lean in favor of higher-end office uses, leading developers to focus their industrial efforts on the Fremont submarket where a number of related projects are already under way.
• Increased competition within the manufacturing segment will put pressure on rates, especially as the sector concentration intensifies in the longer term.
59 JLL | United States | Industrial Outlook | Q2 2014
St. Louis
Market conditions• The industrial market absorbed 2.3 million square feet in the first half of the year, the best two quarter
total since the second half of 2012. • Twelve consecutive quarters of positive absorption have lowered the vacancy rate to a post-recession
low of 5.6 percent. The shrinking vacancy rate is putting upward pressure on rental rates. Asking rates are up 3.7 percent year-over-year.
• Modern bulk and bulk buildings absorbed 1.8 million square feet thus far in 2014. • A lack of new supply continues to limit options for large users that are looking for modern bulk and
bulk facilities. • Employment for the industrial occupying sectors is picking up as well. Since the beginning of 2014,
manufacturing employment has risen by 4,000 jobs, or 3.5 percent, the largest increase since 1995. As manufacturing levels continue to rise, they will have a positive impact on the industrial real estate market as more product is warehoused before being shipped.
Outlook• With limited supply and increasing demand conditions, a speculative modern bulk building will break
ground in the third quarter. • Consumer nondurables and food and beverage companies should continue to be at the front of leasing
activity the rest 2014; these two industries account for nearly 32.1 percent of the total square footage in the market.
• As the economy continues to improve the smaller firms are becoming more active. The current composition of tenants in the market for the metro area is heavily weighted by tenants in the 50,000- to 249,000-square-foot range. Those requirements represent 70.2 percent of the active tenants in the market and 41.3 percent of total square footage.
60 JLL | United States | Industrial Outlook | Q2 2014
Tampa
Market conditions• Unemployment rates are declining throughout Tampa Bay, albeit at a slower pace than the rest of the
major markets in Florida. At 5.9 percent, the Tampa Bay area’s unemployment rate is higher than the Florida average and is on par with the United States.
• Payroll growth was a full percentage point faster in Tampa Bay than the national average in 2013. • Economic growth continues to propel Tampa’s industrial markets forward as large, national credit-tenant
requirements are becoming more commonplace and institutional capital is making its way into the metro.• Year-to-date, Tampa has seen 1.3 percent of its total inventory absorbed. The leased sector, excluding
manufacturing, has seen 2.3 percent occupancy growth year-to-date and near 6.0 percent year-over-year rent growth.
• Pinellas County, typically a small user market with lagging market dynamics, has seen fundamentals quickly turn around over the last six months as an unprecedented number of users with requirements over 100,000 square feet have begun touring and/or executing leases in the market.
Outlook• As vacancy is subsiding and conditions are tightening across the metro, space scarcity is again on the
horizon; spawning a rebirth of speculative development. Opportunistic institutional developers are recognizing the increased demand from large users due to the cost advantages users have identified with occupying new, more efficient space.
• As the market becomes more landlord-favorable, we expect construction to increase. Hillsborough County is now on the verge of a market surge.
• Same-day delivery through e-commerce channels is having a notable impact as Amazon.com has a 1.1 million-square-foot distribution facility under construction in the Eastside submarket.
• Increase in housing starts• Hospital and medical equipment manufacturing
and distribution
• e-commerce distribution and air cargo• Intermodal transportation links• Availability of entitled land
1802 Jim Johnson Road Buyer: C&S Wholesale Grocers Seller: Food Lion $22.0 M | 836,771 s.f. | $26 p.s.f.
Market drivers
11316 46th Street NRenewal: 128,844 s.f.Tenant: Central Garden and Pet
5300 East Adamo DriveRenewal: 40,000 s.f.Tenant: ClimateCorp
245 Deen Still RoadBuyer: CabotSeller: Gray Matters Charitable Fndtn $16.0 M | 298,754 s.f. | $54 p.s.f.
4506 Acline Drive EBuyer: Gramercy Property TrustSeller: Trident Capital Group $9.5 M | 175,820 s.f. | $54 p.s.f..
JLLIndustrial Snapshot ● Q2 2014
61 JLL | United States | Industrial Outlook | Q2 2014
Washington, DC
Market conditions• The Northern Virginia industrial market posted strong net absorption and rental rate growth in the first half
of 2014 as fundamentals shifted in favor of landlords. Suburban Maryland, however, continued to experience slow leasing activity, especially in Prince George’s County where year-to-date net absorption remained slightly negative.
• While leasing activity has fallen short of 2013 figures in Suburban Maryland, investor interest remains strong and multiple developments are ready to move forward as significant tenant requirements remain in the market.
• Overall leasing velocity continued to lag compared to the prior year, but new deal activity picked up in the second quarter for Northern Virginia, which should help drive occupancy gains in the second half of the year. New leasing activity centered on the Dulles Corridor while Southeast Fairfax experienced primarily renewals.
• In the Dulles Corridor, net absorption totaled nearly 90,000 square feet in the second quarter and vacancy fell to 11.2 percent. Leasing activity for warehouse/distribution space in the Dulles Corridor rose 25.0 percent compared to last year.
• The inner suburban submarkets of Southeast Fairfax and Arlington/Alexandria experienced relatively quiet conditions following several quarters of strong leasing and absorption. Demand from tenants seeking quick access to downtown DC and close proximity to I-95 have helped to bring vacancy in the inner suburban markets well off their historical peaks.
Outlook• Market fundamentals should continue to tighten during the second half of the year for Northern Virginia as
new supply remains limited and tenant activity has increased following a slow first quarter. Class A warehouse/distribution space remains limited in Suburban Maryland, which may spur additional construction in the second half of the year as tenant requirements land.
• Retail distribution and users related to the home construction industry
• Consolidation to more efficient space• Data center demand
23550 Pebble Run PlaceBuyer: Albatross Realty GroupSeller: Ahmed Maghrabi$4.9 M | 50,930 s.f. | $95 p.s.f.
13970 Park Center RoadNew lease: 63,346 s.f.Tenant: Mass Electric Construction
22750 Shaw RoadNew lease: 27,888 s.f.Tenant: Thomas Sommerville
19886 Ashburn RoadBuyer: U.S. Realty AdvisorsSeller: W.P. Carey$15.6 M | 192,775 s.f. | $81 p.s.f.
Sales highlights
1000 Hampton Park BoulevardBuyer: Terreno Realty CorporationSeller: Metzler North America$18.1 M | 138,780 s.f. | $130 p.s.f.
JLLIndustrial Snapshot ● Q2 2014
62 JLL | United States | Industrial Outlook | Q2 2014
Canada
63 JLL | United States | Industrial Outlook | Q2 2014
The Canadian economy grew by a mere 1.2 percent during the first quarter of 2014, while growth was revised down to 2.7 percent for the fourth quarter of 2013. The unseasonably harsh weather conditions were only partially responsible for the underperformance, as weakness was felt across all expenditure components. Household spending was a major contributor to economic growth in the first quarter of 2014; however, households continued to increase their debt and pushed the debt-to-income ratio well above the historical average. According to RBC, Canada’s economy is anticipated to grow at 2.4 percent and 2.7 percent in 2014 and 2015, respectively, driven by a lower Canadian dollar and an anticipated strengthening of foreign demand.
The weakened Canadian dollar will provide an additional boost to the economy as global demand continues to improve, yet much of Canada’s economic growth will hinge on the United States’ ability to prosper without the Federal Reserve’s quantitative easing (QE) stimulus policy, which is expected to end in October 2014 if economic indicators continue to improve. The Federal Reserve has purchased approximately $4 trillion in Treasury bonds and mortgage-backed assets since it launched the QE program in 2009.
There are continued signs of a soft landing for the Canadian housing market as both sales and construction activity are expected to slow in 2014. Low interest rates have spurred vast construction activity in recent years and consequently oversupplied the market. Housing starts are expected to decline to 163,600 starts in 2014 for a third straight year of decline from 187,000 starts in 2013 and 214,000 starts in 2012. Canada’s housing sector is anticipated to provide limited support to the economy in 2014 and 2015. The projected increase in interest rates will exert pressure on housing affordability, help moderate building activity, slow sales and stabilize pricing.
The federal government recently announced the approval of the Northern Gateway pipeline, which is subject to 209 conditions and further talks with aboriginal communities. The Northern Gateway will carry an average 525,000 barrels of oil per day from Alberta to British Columbia’s northern coast for export to refineries in California and Asia. Construction on the Northern Gateway could begin as early as 2015 and is anticipated to take roughly three years to complete. The project is expected to contribute over $300 billion to Canada’s GDP over the next 30 years.
In early June, the Bank of Canada announced it would keep the overnight interest rate unchanged at 1.0 percent for the 45th consecutive month. Total CPI inflation reached the 2.0 percent target sooner than anticipated largely due to the temporary effects of higher energy prices and exchange rate pass-through; however, Core CPI remains significantly below its 2.0 percent target. In June, the Canadian unemployment rate increased 10 basis points to a six-month high of 7.1 percent.
A total of 72,000 jobs have been added since June 2013, the lowest year-over-year gain since February 2010.
Canada
64 JLL | United States | Industrial Outlook | Q2 2014
Canada industrial property clock
Toronto, Canada
Peaking market
Falling market
Rising market
Bottoming market
Montréal
Calgary, Saskatoon
Ottawa
Edmonton
Vancouver
65 JLL | United States | Industrial Outlook | Q2 2014
Greater Vancouver AreaGreater Vancouver Area
JLL
Market drivers
North America Industrial Outlook ● Q2 2014
• Real GDP positive growth• BC exports• Port Metro Vancouver growth
• Completion of new construction• Efficient distribution facilities• Strata properties
Market drivers
Economic OverviewBritish Columbia's (B.C) economy is expected to surpass the rate of growth achieved in 2013 as the first half of 2014 posted positive growth. Real GDP is forecasted to accelerate to 2.1 percent in 2014, an increase of 40 basis points from 2013’s forecasted figure. In June, the B.C unemployment rate edged up 10 basis points to 6.2 percent due to an increase in the labor participation rate, despite an increase in employment by 6,700 jobs. Exports are expected to drive growth in 2014, as the first half of 2014 experienced strong export growth in shipments to the United States, South Korea, Hong Kong and India, compared to the same period a year earlier. Preliminary work on the multi-billion dollar liquefied natural gas (LNG) projects will provide some support to the housing market in 2014, however, housing starts will remain flat at 27,800.
Quarter In ReviewMetro Vancouver showed signs of a balanced market over the second quarter of 2014 as total availability increased by 20 basis points to 3.3 percent from the previous quarter. In March, Port Metro Vancouver went on strike which created some interruption in the movement of goods and services in B.C. However, the interruption had little effect on the demand for industrial space as the market as a whole garnered 906,756 square feet in positive net absorption this quarter. The significant transactions that occurred were Quick As A Wink Courier leasing 127,500 square feet at 18111 Blundell Road in Richmond and Spicers Canada Limited leasing 68,220 square feet at 2500 Vauxhall Place, Richmond.
The industrial sale and investment market shows a number of interested buyers searching for quality product to own; however, there is little supply to meet the demand for efficient buildings with ample parking and truck maneuvering, high ceilings and multiple loading doors. Industrial sales highlights over the last quarter included the purchase of the 12111 Riverside Way in Richmond for $16.6 million by Canasia Toys & Gifts Inc., and the user purchase of 80 & 84 Golden Drive, Coquitlam by Rockstad Power Corporation. Strata sales continue to remain strong as small- to mid-bay users look to own their space rather than lease and take advantage of the low interest rate environment.
Market vital statistics
Population Jobless rateHistorical average
availability
Historical average yearly
absorption
Value of industrial building permits
2.5 m 6.2% 3.2% 2.0 m.s.f. $160.9 m
Lease highlights
Sales highlights
18111 Blundell Road, RichmondNew lease: 127,500 s.f.Tenant: Quick As A Wink Courier
12111 Riverside Way, RichmondBuyer: Canasia Toys & Gifts Inc. Seller: Panasonic Canada Inc. $16.6 M | 123,623 s.f. | $124 p.s.f.
66 JLL | United States | Industrial Outlook | Q2 2014
Greater Toronto
Quarter in reviewIn the second quarter, leasing activity in the Greater Toronto Area (GTA) recorded 235,000 square feet of positive net absorption. The overall availability rate for the market increased slightly by 10 basis points to 4.5 percent. Currently at $5.79 per square foot, average asking net rent has been increasing for seven straight quarters as a result of strong leasing demand and limited supply of viable options.
In response to the positive outlook for the industrial market and persistently low interest rates, REITs have shown signs of revival by acquiring $235 million of industrial assets in 2014 to date. However, this figure is still down 65.0 percent from the $680 million recorded during the first half of 2013. Landlords are taking advantage of the current high pricing and selling off less desirable assets in their portfolios. With almost no transactions of Class A assets this year, the average investment sales’ cap rate has climbed to 6.8 percent.
Key drivers of demand in the GTA market remain logistics, retail and consumer goods. Online retail spending in Canada has increased by 9.0 percent from 2012 to 2013 and is expected to grow another 64.0 percent by 2018. Retailors with an e-commerce component are increasingly mindful of delivery speeds and will drive the demand for warehousing, fulfilment and distribution centers in the core GTA markets.
Eight speculative construction projects totaling 3.4 million square feet are currently under way in the GTA, the majority of which are located in the GTA West submarket. This new inventory is expected to contribute to only a modest rise in availability as it represents less than 1.0 percent of the total market inventory. Given the escalating costs of construction, land and development charges, most current and proposed construction is starting at 300,000 square feet so that developers can achieve desired returns.
OutlookStable rent growth, low availability and dwindling tenant leverage are on the horizon for the remainder of 2014 and into 2015. For developers, absolute diligence in pricing, design and delivery timing continues to be critical. It appears most institutional developers are taking a prudent approach and waiting to see the rate of absorption of recent completions before fully committing to build on spec. The current pace of construction is likely to continue as three of eight developments have been partially or fully leased prior to completion. The remaining five are expected to be absorbed within 12 months of completion.
• Warehousing• Retail distribution centers• E-commerce
• Consumer products• 3PL
Greater Toronto
Market vital statistics
Population Year-over-year change in jobs
Historic average availability
Historic averageyearly
absorption
Value of industrial building
permits (YTD)
6.1 m 0.4% 5.4% 2.9 m.s.f. $224.5 m
Lease highlights
Sales highlights
Market statistics
Submarket Total stock (s.f.)
Total availability (%) Year-to-date total net absorption (s.f.)
Average net asking rent ($ p.s.f.)
Q-Q % change
Y-Y % change
Largest contiguous option for lease (s.f.)
Largest contiguous option for sale (s.f.)
Toronto Central 263,318,923 3.4% 1,599,202 $5.37 1.9% 2.1% 353,922 300,000
Toronto East 46,565,836 4.7% 60,870 $5.12 -2.3% -3.6% 313,500 411,000
Toronto North 179,291,661 3.3% 1,236,877 $6.32 -2.0% 5.5% 289,258 320,099
Toronto West 367,817,565 5.9% -90,663 $5.91 1.2% 1.9% 895,308 188,683
67 JLL | United States | Industrial Outlook | Q2 2014
Greater Montréal AreaGreater Montréal AreaMarket drivers• Rightsizing and maximization of space• Data center requirements• Government tax credit programs
• E-commerce growth• Major infrastructure projects (highways)• Demand for premium distribution centers
Market drivers
Lease highlights
Sales highlights
6375 Picard, Saint-HyacintheNew lease : 176,070 s.f.Tenant: Barry Callebaut Canada Inc.
5757 Cypihot, Saint-LaurentRenewal: 99,364 s.f.Tenant: Transport of Montréal
Market conditionsThe GMA leasing market continued to weaken in the second quarter of the year. We maintain our belief that pre-election momentum is continuing to have lagging repercussions on the industrial market with users’ and investors’ levels of confidence remaining unstable. As expected, absorption remained negative, it did however improve slightly from the first quarter of the year; it was recorded at negative 423,787 square feet in Q2 2014. Across the GMA, the availability rate also rose slightly to 7.3 percent from 7.2 percent in the previous quarter. There is currently 22.7 million square feet available for lease in the GMA of which 53.0 percent are multitenant buildings, 46.0 percent are single-tenant and less than 2.0 percent are industrial condos.
It’s interesting to note that as the industrial leasing market has decelerated since the beginning of the year, sublease space on the market has increased in the GMA. Rightsizing and maximization of space are also important factors affecting this trend. Slower leasing velocity pushed average rental rates to decrease across the GMA closing the quarter at $5.62 per square foot net and $8.78 per square foot gross, representing a 1.8 percent decrease from Q1 2014. In submarkets such as Laval and the South Shore, where properties are typically newer, rental rates are higher because infrastructure costs are passed onto the tenants. The majority of current market movements are favoring tenants so landlords continue to offer inducement packages such as free rent to retain and attract tenants.
OutlookWe have noticed elevated demand for data centre requirements, distribution centers (particularly for companies in the food industry) and an increased presence of transport companies in the market over the past months. Regardless of the market slowdown, we expect to see ongoing demand for buildings–typically above 50,000 square feet–from third party logistics companies (3PLs).
Market vital statistics
PopulationYear-over-
year change in jobs
Historical average
availability
Historical average yearly
absorption
Value of industrial building permits
(2013)
3.8 m -0.01% 6.8% -482,290 s.f. $122.6 m
Submarket Total inventory (s.f.)
Number of buildings
Under construction (s.f.) Total availability Quarterly
5655 Pierre de Coubertin, Montréal Buyer: 4453417 canada incSeller: 9297-9947 Québec Inc. $5.0 M | 130,145 s.f. | $38 p.s.f.
JLLNorth America Industrial Outlook ● Q2 2014
68 JLL | United States | Industrial Outlook | Q2 2014
Mexico
69 JLL | United States | Industrial Outlook | Q2 2014
Mexico
Economy Mexico’s 2014 GDP forecast was recently adjusted to 2.7 percent (from 3.9 percent). Though several analysts doubt it will actually reach that level. The slow pace of public investment, modest growth in the U.S. economy and Mexico’s latest tax reforms (which are limiting consumer spending) are the main reasons. Mexican government bonds are at an all-time low. Interest rates are at historic lows, while private sector access to market financing has continued an upward trend, without evidence of overheating. Delinquent debt rates are now growing. Real estate prices have meanwhile just kept up with consumer prices. The Peso - Dollar foreign exchange rate has moved down marginally to 12.97, compared to first quarter’s close of 13.07. According to the Mexican National Institute of Statistics and Geography (INEGI), the unemployment rate at the end of the second quarter of 2014 was 5.1 percent, a six-basis-point increase from last quarter. Mexico’s Central Bank reserves closed second quarter at US$190.3 billion, setting another historical record after growing by more than 2.0 percent in the quarter. Annual inflation for 2014 is forecasted to be 3.66 percent. From March 2013 to March 2014 it was 4.97 percent, April 2013 to 2014 it was 4.27 percent and May 2013 to 2014 it was 3.92 percent. Mexico´s trading this semester totaled US$385.6 billion, with US$192.7 billion coming from exports—of which US$169.96 billion was non-oil related; 94.0 percent of these were manufactured goods. Ten percent of imports were from capital investments, namely machinery.
Overall Mexico industrial real estate market overview The first half of 2014 was very good to Mexico’s industrial market. Total Class A stock grew by 1.2 percent relative to first quarter. Turning to the region, the North experienced a slight recovery in vacancy rates, while product was added to the market and rental rates held firm. Net absorption was notable in Ciudad Juarez, Monterrey and Saltillo Ramos Arizpe. KIA announced construction of an OEM (Auto Manufacturer Assembly Plant) at Monterrey’s Pesqueria Municipality. Some border markets such as Tijuana and Nuevo Laredo had slight vacancy declines. The Bajío Region continues to attract investors and tenants for a broad number of businesses, particularly the auto industry: BMW announced it will soon start an OEM in San Luis Potosí, while a Mercedes Benz / Infinity / Nissan joint venture OEM for a US$1.4 billion investment for a new plant was also announced in Aguascalientes. Vacant space is very hard to come by in the Central Region; Puebla, Toluca and Mexico City have very low vacancies and their rents have had consistent growth. Puebla has had land purchases near the Audi Plant at San José Chiapa, but some large developers continue searching for land for a supplier park.
Turning to capital markets activity, Prologis was able to place a FIBRA (REIT), and FIBRA UNO placed a US$2.0 billion follow-on. A few income-producing industrial portfolios are in escrow and
undergoing the due diligence process. Also, we know of more than a few users who want to buy the space they lease.
Mexico’s market statistics
Northern Region Speculative construction continued in the Monterrey Metro Area this semester, where absorption was the highest in the country with 2.4 million square feet. For the first half of 2014, Nuevo Laredo’s space deliveries were 440,000 square feet and net absorption was 258,000 square feet—important for a city that has been generally quiet. Reynosa also saw net absorption of 497,982 square feet. In Ciudad Juarez, absorption was also quite notable with 1.5 million square feet (or 2.4 percent of the submarket’s stock taken in just six months), some construction is in process, and 778,713 square feet was delivered. The Saltillo-Ramos Arizpe submarket continues to grow, driven by the automotive industry, 656,883 square feet delivered year-to-date, and 909,525 square feet has been absorbed (or almost 4.0 percent of this submarket’s stock). In Tijuana, 400,000 square feet has been absorbed, 263,000 square feet delivered in the semester and vacancy decreased to 7.2 percent. Lease rates in in the North Region have not shown variations.
Central Region Mexico City’s development activity is leading the country and real estate fundamentals are strong. Land for new developments is scarce and vacancy is historically low, meaning new product rental rates are increasing. Almost all speculative buildings with international standards have been preleased; this semester’s new deliveries, mostly speculative space, totaled 2.2 million square feet. Most of this space is driven by distribution centers, but some food manufacturers have also been actively leasing space.
Toluca and Puebla have historically low vacancy rates and developers are actively searching for land. Puebla has benefited from the production increase at the VW plant and the arrival of Audi’s suppliers. More than 215,000 square feet has been added to Puebla’s stock over the past six months.
Bajío Region Bajío remains very active with the inauguration of Mazda and Honda plants in the region. This semester almost 1.2 million square feet was added to Aguascalientes’ stock as Nissan finished its second plant. A new Mercedes Benz / Infinity / Nissan US$1.4 billion dollar project was just
70 JLL | United States | Industrial Outlook | Q2 2014
announced at the same Aguascalientes complex. BMW also announced construction of an OEM in San Luis Potosí. A number of developers have been attracted by new tenants looking for space; other non-automotive manufacturers with space needs are capturing their interest, too. The region’s vacancy rate slightly increased to 3.6 percent, while rents are increasing in the majority of cities. Regardless of all of this investment, we do not expect a large increase in prices in the long run, as the Bajío area is relatively flat and water is available. Developers continue to work on balancing demand with supply, and land will be available for years to come.
Something to watch Mexico’s economy is set for growth as important reforms have been approved that will drive investment in the country and create jobs. Crime has been controlled for years now in Tijuana, and for the last two years in Ciudad Juárez. Only the State of Tamaulipas’ cities continue to be a challenge (Reynosa, Nuevo Laredo and Matamoros). New manufacturing plants for BMW, KIA and Mercedes/Infinity have been confirmed.
Outlook On the capital markets side, income-producing portfolios are being traded at cap rate levels slightly above 8.0 percent. Buyers are carefully assessing opportunities. FIBRA’s (Mexican REITS) continue to raise real estate investment funds from the public and the pension funds. Prologis had a successful IPO in June and FIBRA UNO placed one more “Follow On” of more than US$2 billion at the end of June. Market caps for FIBRAS with industrial components are as follows (as of August 4, 2014): Fibra Uno is valued at US$9,825 million, Prologis Mx is valued at US$1,331 million, Macquarie at US$1,202 million, VESTA at $1,112 U.S. million (Vesta is not a FIBRA, it is a publicly traded company) and Terrafina at US$862 million.
71 JLL | United States | Industrial Outlook | Q2 2014
Mexico industrial property clock
Reading the clock Peaking markets: Trends in the Central Region are similar to last quarter’s: Vacancy is very low, land is scarce and rents are increasing. Mexico City’s semester deliveries totaled 2.2 million square feet and most buildings were preleased; there is a high volume of industrial space in the pipeline. We expect rents to stabilize or decrease slightly by the end of 2014. Puebla submarkets are experiencing demand for manufacturing space that cannot be satisfied. Guanajuato is receiving business from the recent inaugurations of the Mazda and Honda plants. We do not expect rents to grow too much in the Bajio area, as land and water are available and supply and demand should remain relatively balanced.
Rising markets: Aguascalientes is receiving suppliers to meet manufacturing demand for the new Nissan plant and the Mercedes/Infinity joint venture OEM. Mercedes/Infinity and BMW will soon break ground in Aguascalientes and San Luis Potosí. Investments in the area are occurring, with a preference for new facilities. Saltillo-Ramos Arizpe submarkets continue to receive manufacturing-
related tenants, and new deliveries totaled 900,000 square feet. Monterrey attracts manufacturers and new completions are finding tenants; this was the strongest market in the country this semester, absorbing 2.4 million square feet. KIA also announced a new 300,000-car OEM there. Tijuana absorbed 400,000 square feet this semester. Ciudad Juarez, which clamped down on crime two years ago, has favorably changed its situation and absorbed 370,000 square feet this quarter. Year-to-date, it has absorbed 1.5 million square feet.
Bottoming markets: Although there have been local expansions and lease renewals in Nuevo Laredo, Reynosa and Matamoros, it is only in Reynosa that developers are building on a speculative basis since demand exists for very large boxes, and there are presently none available. This is moving Reynosa into the “Rising Market” grouping. Chihuahua City is getting active due to the aerospace sector. Foreign investment has been announced to launch in Chihuahua State in 2014/2015.
72 JLL | United States | Industrial Outlook | Q2 2014
Market Total stock (s.f.) Vacancy rate Availability rate YTD net absorption (s.f.) Q2 2014 average rent YTD deliveries
Rent growth will be uneven at the market level. Namely, those markets that have seen recent upticks in net absorption and transaction volume will lag behind more mature corridors.
JLL (NYSE:JLL) is a professional services and investment management firm offering specialized real estate services to clients seeking increased value by owning, occupying and investing in real estate. With annual revenue of $4 billion, JLL operates in 75 countries worldwide. On behalf of its clients, the firm provides management and real estate outsourcing services for a property portfolio of 3 billion square feet and completed $99 billion in sales, acquisitions and finance transactions in 2013. Its investment management business, LaSalle Investment Management, has $47.6 billion of real estate assets under management. For further information, visit www.jll.com.
JLL’s research team delivers intelligence, analysis and insight through market-leading reports and services that illuminate today’s commercial real estate dynamics and identify tomorrow’s challenges and opportunities. Our more than 400 global research professionals track and analyze economic and property trends and forecast future conditions in over 60 countries, producing unrivalled local and global perspectives. Our research and expertise, fueled by real-time information and innovative thinking around the world, creates a competitive advantage for our clients and drives successful strategies and optimal real estate decisions.
About JLL Research
Craig S. Meyer, SIOR President Americas Industrial Brokerage +1 424 294 3460 [email protected] License #: 00586344
United States
Mexico (Mexico City) Mexico (Monterrey)
Canada
Mexico (Tijuana)
Aaron Ahlburn Senior Vice President Director of Research Industrial & Logistics +1 424 294 3437 [email protected]