120


Banco Nacional de Desenvolvimento Econômico e Social

the dti


Source: CSID calculations using Quantec data
0.00.30.50.81.01.31.51.82.02.32.52.83.03.33.53.8
Mot
or v
ehic
les,
part
s &
acc
esso
ries
Leat
her &
leat
her p
rodu
cts
Pape
r & p
aper
pro
duct
s
Foot
wea
r
Text
iles
Oth
er ch
emic
als &
man
-mad
e fib
ers
Furn
iture
Food
Basic
che
mic
als
Elec
tric
al m
achi
nery
& a
ppar
atus
Prin
ting,
pub
lishi
ng &
rec
orde
d m
edia
Mac
hine
ry &
equ
ipm
ent
Rubb
er p
rodu
cts
Oth
er tr
ansp
ort e
quip
Met
al p
rodu
cts e
xcl. m
achi
nery
Plas
tic p
rodu
cts
Cons
truc
tion
Wea
ring a
ppar
el
Basic
iron
& st
eel
TV, r
adio
& c
omm
equ
ip
Prof
essio
nal &
scie
ntifi
c eq
uip
Woo
d &
woo
d pr
oduc
ts
Coke
& re
fined
pet
role
um p
rodu
cts
Glas
s & g
lass
pro
duct
s
Non-
met
allic
min
eral
s
Beve
rage
s
Basic
non
-ferr
ous m
etal
s
Toba
cco
Cate
ring
& a
ccom
mod
atio
n se
rvic
es
Excl
. med
ical
, den
tal &
vet
erin
ary s
ervi
ces
Com
mun
icat
ion
Med
ical
, den
tal &
vet
erin
ary
serv
ices
Agric
ultu
re
Oth
er m
anuf
actu
ring
Tran
spor
t & st
orag
e
Elec
tric
ity, g
as &
wat
er
Busin
ess s
ervi
ces
Who
lesa
le &
reta
il tr
ade
Min
ing
Gove
rnm
ent s
ervi
ces
Fina
ncia
l ser
vice
s
Oth
er p
rodu
cers

Source: CSID calculations using Quantec data
0.0
2.0
4.0
6.0
8.0
10.0
12.0Ca
terin
g &
acc
omm
odat
ion
serv
ices
Oth
er p
rodu
cers
Med
ical
, den
tal &
vet
erin
ary
serv
ices
Gove
rnm
ent s
ervi
ces
Agric
ultu
re
Wea
ring a
ppar
el
Excl
. med
ical
, den
tal &
vet
erin
ary s
ervi
ces
Furn
iture
Text
iles
Food
Woo
d &
woo
d pr
oduc
ts
Leat
her &
leat
her p
rodu
cts
Foot
wea
r
Who
lesa
le &
reta
il tr
ade
Mac
hine
ry &
equ
ipm
ent
Prin
ting,
pub
lishi
ng &
rec
orde
d m
edia
Met
al p
rodu
cts e
xcl. m
achi
nery
Cons
truc
tion
Com
mun
icat
ion
Mot
or v
ehic
les,
part
s &
acc
esso
ries
Beve
rage
s
Prof
essio
nal &
scie
ntifi
c eq
uip
Glas
s & g
lass
pro
duct
s
Pape
r & p
aper
pro
duct
s
Non-
met
allic
min
eral
s
Rubb
er p
rodu
cts
Toba
cco
Elec
tric
al m
achi
nery
& a
ppar
atus
TV, r
adio
& c
omm
equ
ip
Plas
tic p
rodu
cts
Oth
er tr
ansp
ort e
quip
Oth
er ch
emic
als &
man
-mad
e fib
ers
Min
ing
Basic
iron
& st
eel
Oth
er m
anuf
actu
ring
Tran
spor
t & st
orag
e
Basic
che
mic
als
Basic
non
-ferr
ous m
etal
s
Coke
& re
fined
pet
role
um p
rodu
cts
Busin
ess s
ervi
ces
Elec
tric
ity, g
as &
wat
er
Fina
ncia
l ser
vice
s
38 31 20

Source: CSID calculations using Quantec data

Source: SARB
-400000
-200000
0
200000
400000
600000
800000
1000000
1994 1995 1996 1997 1998 1999 2000 2001 2002 2003 2004 2005 2006 2007 2008 2009 2010 2011
Agriculture, Foresty and Fishing Mining and QuarryingManufacturing Electricity, Gas and WaterConstruction (Contractors) Wholesale and Retail Trade, Catering and AccommodationTransport, Storage and Communication Finance, Insurance, Real Estate and Business ServicesBalance on Current Account
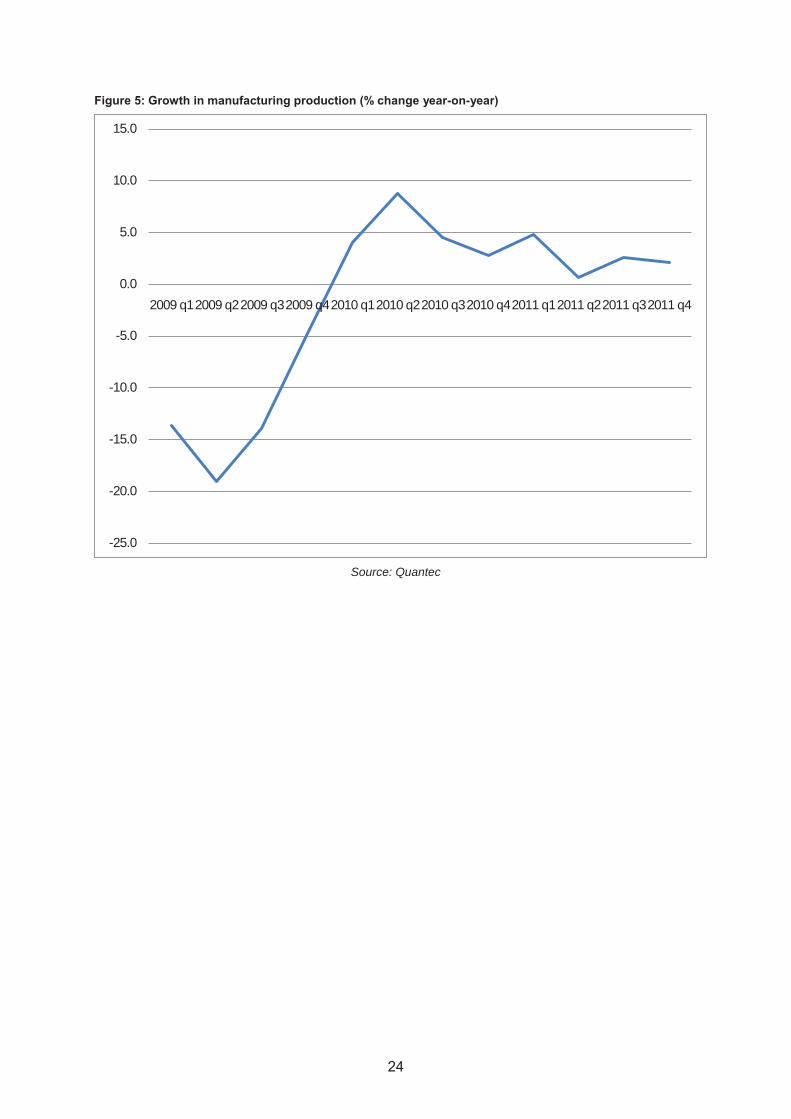
Source: Quantec
-25.0
-20.0
-15.0
-10.0
-5.0
0.0
5.0
10.0
15.0
2009 q1 2009 q2 2009 q3 2009 q4 2010 q1 2010 q2 2010 q3 2010 q4 2011 q1 2011 q2 2011 q3 2011 q4

Source: Quantec
-25.0
-20.0
-15.0
-10.0
-5.0
0.0
5.0
10.0
15.0
0.0
20.0
40.0
60.0
80.0
100.0
120.0
140.0
Manufacturing production (Index 2005=100) Manufacturing growth (% change y-o-y)

Source: SARB
Source: Quantec
-40000
-30000
-20000
-10000
0
10000
20000
30000
1Q20
003Q
2000
1Q20
013Q
2001
1Q20
023Q
2002
1Q20
033Q
2003
1Q20
043Q
2004
1Q20
053Q
2005
1Q20
063Q
2006
1Q20
073Q
2007
1Q20
083Q
2008
1Q20
093Q
2009
1Q20
103Q
2010
1Q20
113Q
2011
Agriculture, Forestry and Fishing Mining Manufacturing

Source: The Economist
-2.00
-1.00
0.00
1.00
2.00
3.00
4.00
5.00
6.00
7.00
8.00
9.00
10.00
11.00
1995 1996 1997 1998 1999 2000 2001 2002 2003 2004 2005 2006 2007 2008 2009 2010
South Africa Developed Country Average Developing / Transition Country AverageSource: Economist

Source: SARB
Source: Stats SA
0
50
100
150
200
250
300
Q1 2008
Q2 2008
Q3 2008
Q4 2008
Q1 2009
Q2 2009
Q3 2009
Q4 2009
Q1 2010
Q2 2010
Q3 2010
Q4 2010
Q1 2011
Q2 2011
Q3 2011
General government Public corporations
Private business enterprises


oo


ooo
o
o


o
ooo

o

Source: BER Manufacturing Survey
Source: Statistics SA, Labour Force Survey (2005-2011); own calculations
74
74
73
69
67
67
65
64
62
62
61
58
56
55
50
49
42
25
54
47
56
63
62
34
36
48
63
53
49
22
23
47
56
55
0 10 20 30 40 50 60 70 80
Wood
Basic Metals
Electrical Machinery
Paper
Transport
Fabricated Metal Products
Non-Metal Minerals
Clothing
Manufacturing Total
Machinery
Beverages
Food
Textiles
Plastics
Chemicals
Furniture
Printing & Publishing
2010 2007

Source: Statistics SA, Labour Force Survey (2005-2011); own calculations
High level skills comparisons 2005 vs 2011 (% of high level skills on overall employment in 2005 & 2011)
Sept 0510.97%
Sept 1114.21%
Sept 05
Sept 11
Middle level skills comparisons 2005 vs 2011 (% of middle level skills on overall employment in 2005 & 2011)
Sept 0558.42%Sept 11
57.47% Sept 05
Sept 11
Artisans comparisons (2005 vs 2011)(Number employed (000))
Sept 051869
Sept 111655
Sept 05
Sept 11


o
oooo
ooooooo

oooo


inter alia,

prima facie


![2020 Final IPVS - Idaho · 1/1/2020 · )huwlol]hu pdqxidfwxulqj )lehujodvv progv )lvk surfhvvlqj )lvklqj jhdu frpphufldo )orru fryhulqj frqwudfwru pdfklqhu\ dqg htxlsphqw )orru](https://static.documents.pub/doc/80x56/5fb12fcb89d7df51dd4771fc/2020-final-ipvs-idaho-112020-huwlolhu-pdqxidfwxulqj-lehujodvv-progv-lvk.jpg)


