Industrial Policy and Development in Ethiopia: Evolution and Current Performance Mulu Gebreeyesus UNU-MERIT, Maastricht Presentation at the “Learning to Compete (L2C): Accelerating Industrial Development in Africa” conference organized by UNU-WIDER June 24-25, 2013, Helsinki, Finland
Transcript
Industrial Policy and Development in Ethiopia: Evolution and Current
Performance
Mulu Gebreeyesus UNU-MERIT, Maastricht
Presentation at the “Learning to Compete (L2C): Accelerating Industrial
Development in Africa” conference organized by UNU-WIDER June 24-25, 2013, Helsinki, Finland
Introduction • Revival of interest in industrial policy among academics
(e.g. Rodrik, 2004; Hausmann and Rodrik, 2006; Cimoli et al., 2010; Lin and Chang, 2009, Lin and Monga, 2011)
• Controversies still remain – Functional versus selective intervention – Comparative advantage following versus Comparative
advantage defying (e.g. Lin and Chang, 2009) – The nature of state and business relationships (e.g.
Hausmann and Rodrik, 2006) • Also renewed interest and reintroduction of industrial
policy in many developing countries (e.g. Africa) • Yet, little systematic evidence on the process and
outcome of recent attempts to reintroduce industrial policy in Africa
• The aim of this study is to examine the choices, implementation process, and outcome of the Ethiopian recent industrial policy – Ethiopia is one of the few African countries that
have formulated and implemented a full-fledged industrial policy (IDS) since the early 2000s
– Gov’t has shown extraordinary commitment & ownership. (implementing through subsequent development plans
and various sub-sector strategies)
– The outcomes so far are appear to be mixed
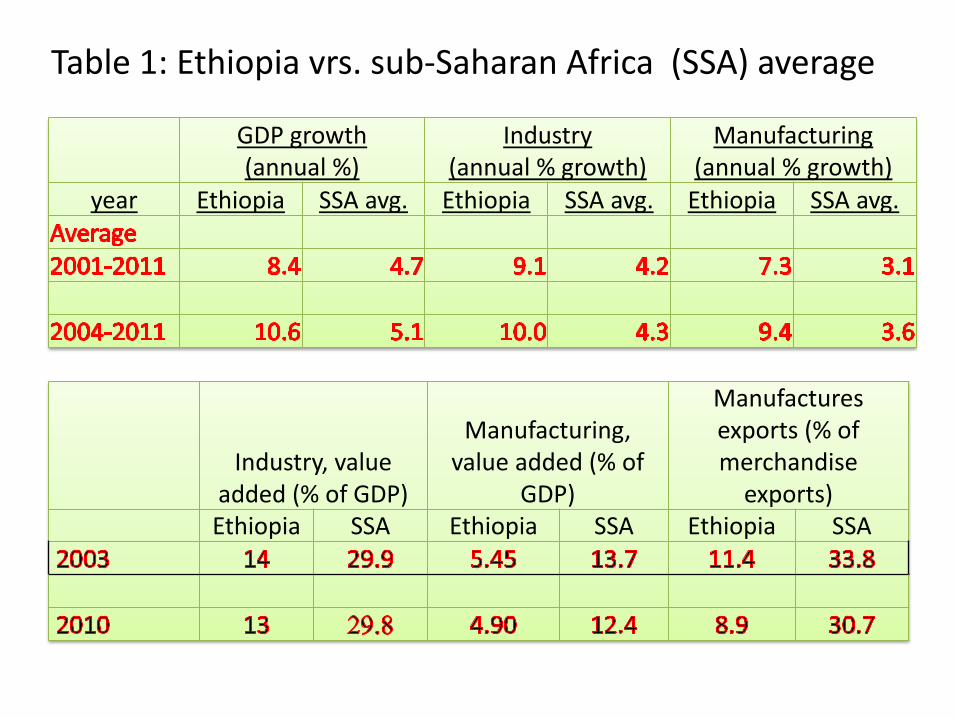
GDP growth (annual %)
Industry (annual % growth)
Manufacturing (annual % growth)
year Ethiopia SSA avg. Ethiopia SSA avg. Ethiopia SSA avg.
Table 1: Ethiopia vrs. sub-Saharan Africa (SSA) average
Industry, value added (% of GDP)
Manufacturing, value added (% of
GDP)
Manufactures exports (% of merchandise
exports) Ethiopia SSA Ethiopia SSA Ethiopia SSA
Evolution: Industrial policy & development
• In Ethiopia, modern manufacturing factories emerged in 1920s (As of 1927 about 25 were set up mostly by foreigners)
• the sector started to get momentum in the 1950s (after brief disruption in the WWII period)
• The 1950s also marked by start of a comprehensive plan to promote the country’s industrial & economic development
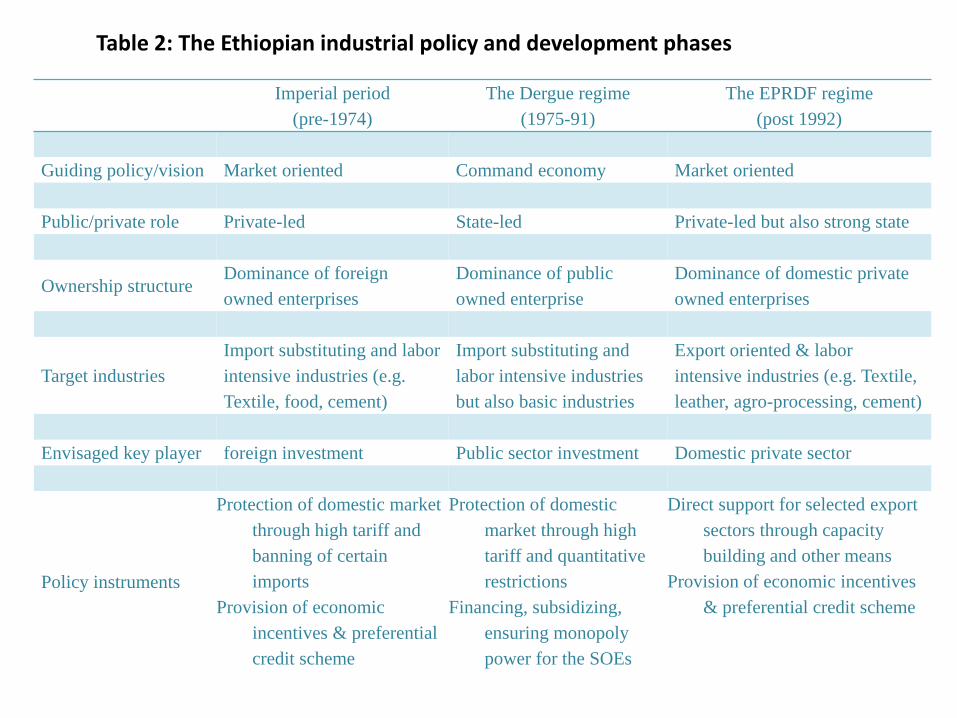
• Ethiopia has seen three regimes over the last eight decades – Imperial regime (up to 1974) – Dergue regime (1974-91) – EPRDF-led regime (since 1991)
• Successive regimes adopted different policies for the development of industry
The imperial regime (up to 1974) • Between 1958-73 three successive development
plans were implemented • The implementation of the initiatives attracted
foreign investors and boost the manufacturing sector (World Bank, 1985). But by the end of the Imperial regime ... – The overall industrial base was weak – The manufacturing sector characterized by dual
structure – The modern sector constituted few hundreds of
factories employing no more than 60,000 people • And dominated by import substituting light industries and
foreign ownership
The Dergue regime (1974 to 1991) • No specific industrial policy per se until mid-1980s, but
– nationalized most of the MLSM enterprises – declared “a socialist economic policy’ – put various restrictions on the private sector & market – Nationalized enterprises SOEs reorganized under state
corporations The manufacturing sector shrunk and the private
sector virtually reduced into micro & small manufacturing activity
• Ten Year Perspective Plan 1984/85-1993/94 – Public investment program an indicative portfolio of
projects and production targets
The EPRDF-led government (since 1991)
• The first decade (1991-99) marked by various reforms reversing the command economy
• Implemented three phases of IMF/WB sponsored reform programs • In 1998 government adopted Export Promotion Strategy
• A full-fledged Industrial Development Strategy (IDS) was formulated in 2002/03 – Concretized into action by various sub-sector strategies and
by the successive development plans such as; • Sustainable Development and Poverty Reduction Program (SDPRP)
2002/03-2004/05 and • the Plan of Action for Sustainable Development and Eradication of
Poverty (PASDEP) 2005/06-2009/10. • The Growth and Transformation Plan (GTP) 2010/11-15/16
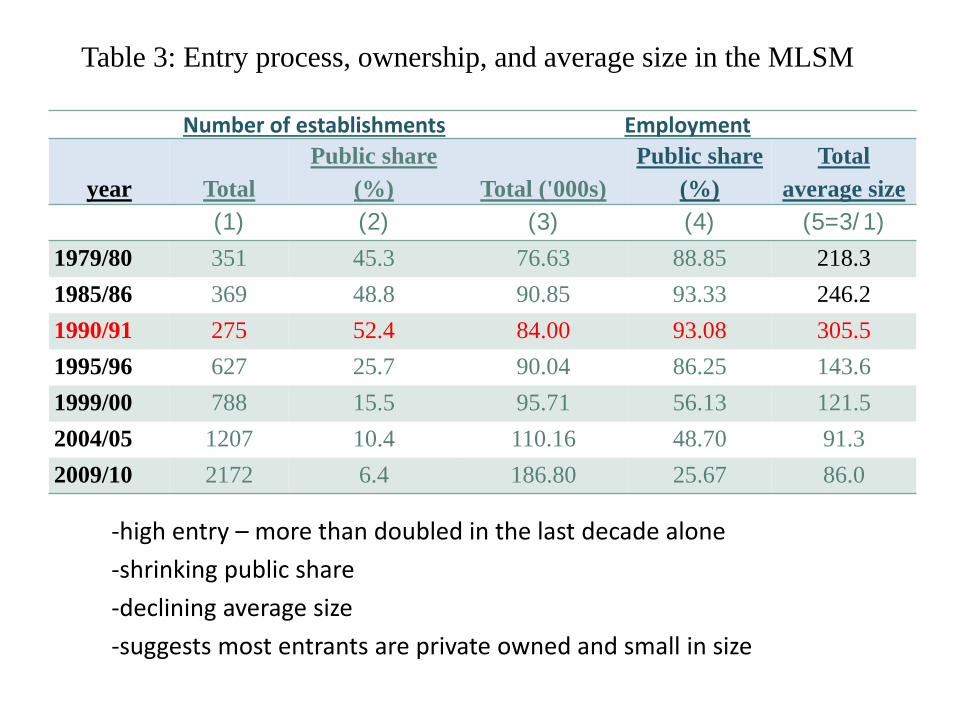
-high entry – more than doubled in the last decade alone -shrinking public share -declining average size -suggests most entrants are private owned and small in size
Number of establishments employment Value added
fixed capital
per labor
Value added
per labor TFP Firm size category by employees number
Table 2: Manufacturing size distribution (2007/08)
The present industrial policy (IDS) principles and practices
The IDS principles • The IDS is based on a broader development vision - ADLI
– The philosophy of ADLI is that agriculture development plays a leading role in the industrialization process by preparing various conditions for full-fledged industrialization
Primary principle of IDS is the linkage b/n industry & agriculture
• Other principles – Export oriented sectors should lead the industrial
development and be given priority – Labor intensive sectors also be given priority to maximize
employment – Public-private partnership – gov’t not merely as a facilitator
but also as a leadership • Recognizes the private sector as engine of growth but makes
distinction between ‘rent seeking’ and ‘developmental’ capitalists
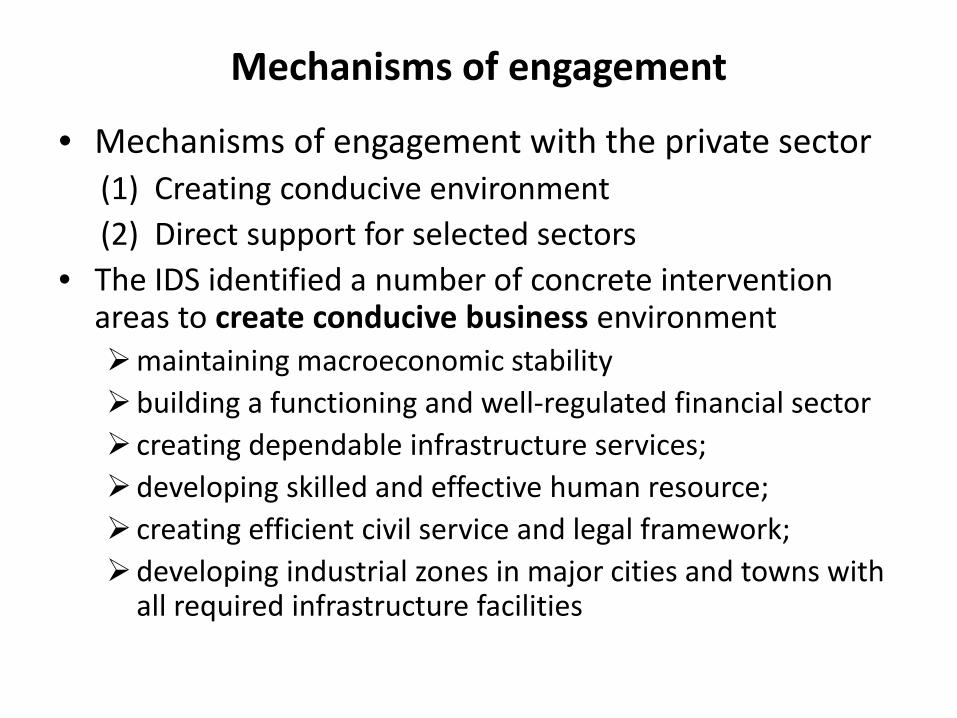
Mechanisms of engagement
• Mechanisms of engagement with the private sector (1) Creating conducive environment (2) Direct support for selected sectors
• The IDS identified a number of concrete intervention areas to create conducive business environment maintaining macroeconomic stability building a functioning and well-regulated financial sector creating dependable infrastructure services; developing skilled and effective human resource; creating efficient civil service and legal framework; developing industrial zones in major cities and towns with
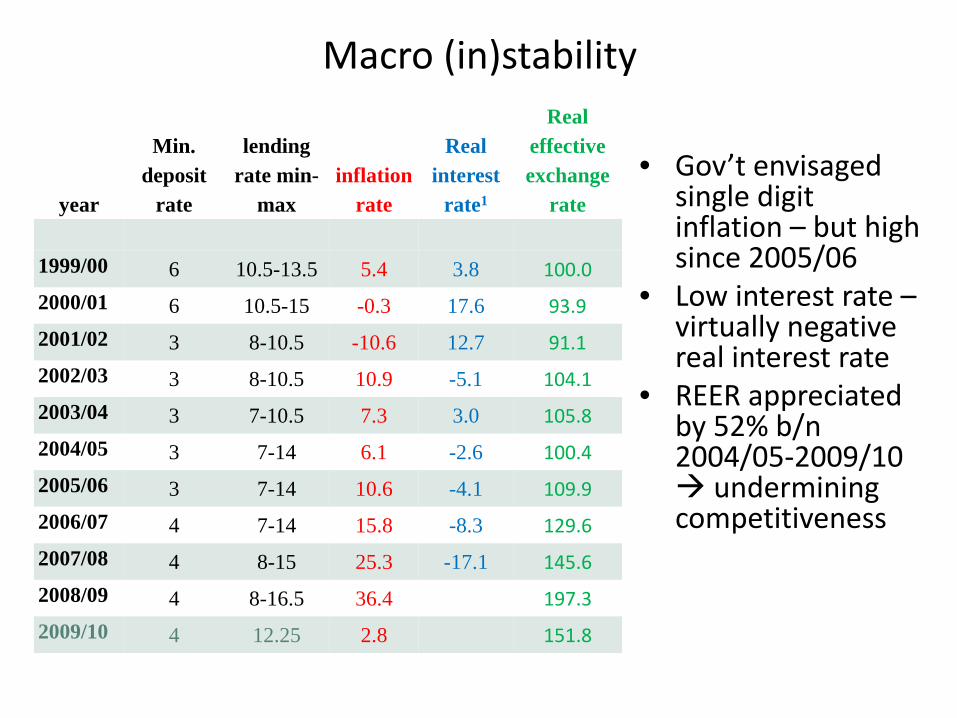
• Gov’t envisaged single digit inflation – but high since 2005/06
• Low interest rate – virtually negative real interest rate
• REER appreciated by 52% b/n 2004/05-2009/10 undermining competitiveness
Institutional and regulatory reforms • Ethiopia implemented a wide range of institutional reforms
since the early 2000s – established competition policy – Revision of business registration – revision to the investment code, – modernizing the tax regime and introduced value-added tax (VAT), – Partially reforming the customs administration – Established public-private consultative forums
• Civil Service Reform Program (CSRP) a key initiative – Service Delivery Improvement Policy (PSIP) was key component
and was introduced in priority Ministries and agencies that interface directly with the private sector
– It promoted Business Process Engineering (BPR) as management initiative
Service delivery substantially improved
Table 5: Trends in the Doing Business Rankings: Ethiopia
Time Period Indicators 2008 2009 2010 2011 2012
Ease of Doing Business Ease of Doing Business – Rank (1, 183 worst) 116 107 104 111 127 Doing Business - Starting a Business – rank 118 93 89 99 163
Doing Business - Closing a Business – rank 74 77 82 89 117
Trading Across Borders - Doing Business (1, 155 worst) DB - Trading across borders rank 152 159 157 157 161 DB - No. of documents for export 8 8 8 7 7 DB - Days for export 46 49 44 42 42 DB - Cost to export (US$ per container) 2087 1,940 1890 1760 2160
Some reversals in reforms and ranking • The post-2010 fall in the country ranking of doing business is
mainly associated with the gov’t recent moves to introduce and enforce a number of erratic regulations
• Foreign exchange shortages gov’t shutdown 94 warehouse of coffee exporters • Soaring inflation futile effort through price caps
revised the business registration (reduce monopoly in imports) - Similar actions in relation to land and customs administrations • Starting 2011 private banks are forced to purchase NBE bonds
with 27% of their lendable capital to finance massive public investments Leading to crowding out of the private sector
• Reducing confidence and policy predictability
Sectoral policies • The 2003 IDS declared priority sectors for
government direct support – textile and garment; – meat, leather and leather products; – other agro-processing industries (e.g. sugar and sugar
related industries), – construction – micro and small enterprises (MSEs)
• The list of priority sectors has been updated through time. – the flower industry and some import substituting
industries (such as metal and engineering, chemical and pharmaceutical) were sequentially added
Sectoral policies cont. • Targets and accompanying government supports were
explicitly stated in the country five-year development plans
• Government provided extensive support largely directed at the exporting firms and industries – economic incentives, – capacity building, – cluster development and – direct public investment
• National Export Development Committee, chaired by the Prime Minster sets export and productivity targets
Direct support in practice: three industry cases
• The textile and leather (hereafter, T&L) industries are the two most preferred export industries that received enduring attention of the Ethiopian policy makers
• The flower industry emerged spontaneously but with the full support of the government it became successful and a celebrated export industry
The T&L industries
• Government set ambitious targets for the T&L sectors each to generate US$ 500 million by the end of 2009/10
• In the textile sector – massive investment from the private sector worth of US$ 1.6
billion was envisaged – It was also planned to create self-sufficiency in fabrics – the government planned to invest directly in the textile sector
including through joint venture with foreign investors. • The leather sector
– The main direction of the leather industry plan was to change the mix of exports toward processed and finished goods.
– it was planned to upgrade the capacity of tanneries and the finished products to produce finished leather products
• Discouraging H&S export imposing above 150% tax
T&L cont.
• Government made sector specific capacity building efforts in addition to the general support programs given to all exporters.
• Two sector specific institutions were setup to support, coordinate and guide the private sector in the T&L sectors; – Textile Industry Development Institute (TIDI) and – Leather Industry Development Institute (LIDI)
• Sector special training centers were established under them – Ethiopian Leather and Leather Products Technology Institute (ELLPTI) – Textile and Apparel Institute (TAI) were also established
• Various additional support programs was introduced to improve the international competitiveness of these industries such as; – benchmarking, – institutional twining, – marketing search, and – kaizen
Export performance indicators (T&L) • Export performance of the T&L unsatisfactory • By the end of the PASDEP period the actual exports were;
– Textiles only 8% of the USD 500 target – H&L 23% of USD 273 million target – Other leather products 3.7% of USD 227 million target
• Comparing with the base year 2004/05 the growth of textile exports was in fact impressive – four fold up to 2010 and even further by 2011
• A recent study on the light manufacturing in Ethiopia (Dinh, et al., 2012) indicate that – The most obstacle for the apparel sector is poor trade logistics
and accompanied by absence of competitive input industries (textiles)
– the most binding constraint in the leather export is the shortage of quality processed leather
The flower industry • The dynamics of the flower industry is different from other
priority sectors • In the mid-1990s two domestic private entrepreneurs started
the experimentation • Towards the end of 2002, the government became aware of
the big opportunity through lobbying efforts of the private sector
• The gov’t decided to get engaged in promoting the sector. – Targets were set (1000 ha under flower production - end of
five years) – To support the scaling-up gov’t came in with a multi-faceted
support, focusing on: land, long-term credit, and air transport coordination.
26
The flower cont. • The flower industry start to take-off around 2004,
following the active engagement of the government • It deomonestrated extraordinary growth and in 2008;
– Number of farms reached 81 – Land covered reached 1200 ha – Above 50,000 employment (direct) – The fourth foreign currency generator – The country became 5th largest non-EU exporter
to the EU market of cut-flower – It became the second largest exporter in SSA, next
to Kenya
189.0
121.0
1.0 9.1 11.8
71.0
0.0
20.0
40.0
60.0
80.0
100.0
120.0
140.0
160.0
180.0
200.0million USD
year
Fig. 4: Ethiopia; exports of selected products 1997-2011
Cut flowers and foliage Row Hides and Skinsleather articles & footwear Textile & clothing
EMERGING AND REMAINING ISSUES
1. Are the goals yet achieved? Mixed outcome!
• Since 2003/04, GDP and all sub-sectors grew 10% or more – But industry contribution to GDP remain stagnant (≤14%)
• More than doubled of the country export earnings – But diversification mainly outside manufacturing
• High entry of firms into the manufacturing sector; – but new entrants mostly small dual structure continues – but new entrants mostly domestic oriented export
• Increasing import dependence and weak domestic linkages – Exports increasingly constrained by lack of quality of
inputs in domestic market despite efforts to address them
• A regular review of the policies and instruments need to be instituted with the aim of identifying emerging bottlenecks.
• And more importantly policies need to be framed
with a view of addressing constraints along the whole value chain and also horizontal linkages
2. Choice of champion activities/products
• Why has the flower industry has been successful but not the T&L industries that received the most attention long before?
• Three alternative views regarding identification of potential products – (i) no need for the officials to select products beforehand
but create a general support mechanism in which eligible pioneer would bid and compete for it
– (ii) government should make in depth study, select priority sectors and provide support for potential entrants
– (iii) government might still have priority list but should be flexible enough to pick winners in the self-discovered sectors
• The Ethiopian experience supports view (iii) • But one needs to introduce mechanism to
elicit valuable information from the private sector on the potential industries through continuous consultations (Hausman and Rodrik, 2003) – Engaging into continuous experimentation for the
emergence of that would be ‘champion’ export product
3. The nature of public-private partnership • The Ethiopian industrial policy made a distinction b/n ‘developmental’ and
‘rent seeking’ private sector – Gov’t provides generous incentives and support programs to build the
private sector capacity (carrots) – At times (particularly recently) it has introduced a number of measures
(sticks) alleging to ‘discipline’ the ‘rouge’ private sector increasing tension and policy uncertainties around the private sector.
• Yet a number of issues arise regarding the effectiveness of the instruments – How much rent and how long should the private sector in the selected
sectors be given to bear fruits? – What form of relationship should be instituted between the
government and the private sector? – How do you create an environment that maximize the social benefits
and limit rent-seeking?
The nature cont.
• There are critics that the instruments (carrot and stick) are not transparent and the policy makers tend to ‘patronize’ the private sector instead of encouraging competition & innovation
• There is also emerging concern that the public investment expansion is dwarfing the private sector (e.g. credit & foreign exchange availability) – “the public investment rate of Ethiopia is the third highest in the world,
while the private investment rate is the sixth lowest.” World Bank 2013
• Vibrant private sector is critical for the effectiveness of industrial policy, thus, the gov’t need to address the above and other emerging issues