JOURNAL OF TEXTILES AND POLYMERS, VOL. 6, NO. 2, JUNE 2018 117 Overview of Ethiopian Textile Industry Bewuket Teshome Wagaye * and Gashaw Ashagre Walle Abstract- The overarching objective is to investigate the status of Ethiopian Textile Industry. Primary data were collected through observation, personal and telephone interviews. Besides, secondary data were compiled from company documents and research institutes. The data were analyzed using simple statistical tools and inductive and deductive reasoning. The major findings are: the cultivated land is 3.7% with a productivity of 19.8 ql/ha; the combined ginning capacity is 1,031 ton/day; the daily performance of spinning mills is 386.4 ton and the capacity of composite and knitting mills is 578,576 meters per day of fabric. The trend indicates that there is a negative trade balance. Despite these facts, there is a large area of land suitable for cotton cultivation, tremendous trainable labor force and a conducive policy for the expansion of textile industry. Keywords: cultivated, productivity, ginning, trade, labor I. INTRODUCTION E thiopia’s history in textiles began in 1939 in Dire Dawa city [1]. The textile industry encompasses cotton producing, ginning, spinning, weaving, knitting, dyeing and finishing, and garment. The total land suitable for producing cotton is 3 million ha. However, only around 3.7% is utilized [2], implying untapped potential [3]. After the cotton is harvested, the lion’s share goes to 21 ginning factories (four roller ginning and 17 saw ginning). All lint is supplied to textile mills, whereas the cotton seed is used for seed, oil producing and fodder. At present, there are 38 textile factories. Most of them are owned by government producing mostly work-wear garments for the domestic market [3]. In addition, there are around 84 garment factories mostly located around Addis Ababa [4]. The government gives special attention for the development of the textile sector. As such various stakeholders are established. Ethiopian Cotton Producers, B. Teshome Wagaye and G. Ashagre Walle Ethiopian Institute of Textile and Fashion Technology, Bahir Dar, Ethiopia. Correspondence should be addressed to B. Teshome e-mail: [email protected]Ginners and Exporters Association is an autonomous local NGO that acts on behalf of its members. The other is Ethiopian Textile Industry Development Institute (ETIDI), established under the Ministry of Industry to enhance the capacity of textile and apparel manufacturing sectors. Ethiopian Textile and Garment Manufacturers Association has a special focus on technical issues, marketing and policy. The other important stakeholder is Ethiopian Ministry of Agriculture [5]. Moreover, there are higher educational institutions producing personnel having technical knowledge and skills – the most notable being Ethiopian Institute of Textile and Fashion Technology established since 1963 [6]. The global market has become increasingly accessible to countries such as Ethiopia. New export opportunities are created through initiatives such as the African Growth and Opportunity Act (AGOA), the Common Market of Eastern and Southern Africa (COMESA) and bilateral trade agreements established with Western countries. Ethiopia is also part of “Everything But Arms” program providing access to the EU market for Lesser Developed Beneficiary Countries [5]. The country has a large pool of trainable manpower. Land is available on a leasehold basis to attract foreign investment. Regional governments are expected to allocate land to investors within 60 days of receiving applications. The government is willing to negotiate with individual business to provide incentives for capital investment. Besides, Ethiopia is politically stable [7]. However, one of the threats is the substitution of cotton cultivation by sesame and sugarcane. Hence, the land cultivated by cotton and its production is reduced. Nevertheless, this is a temporary problem caused by conflict of interest deviating from the vision of the government. II. COTTON CULTIVATION IN ETHIOPIA Cotton is cultivated all over the country. The total land cultivated in 2012 was 111,886 ha with an average production of 19.8 ql/ha. 62% of seed cotton is produced by Afar and Amhara regions. 23.57% of cotton is produced by small scale farmers, while 76.43% by large scale companies Industrial Report
Transcript
JOURNAL OF TEXTILES AND POLYMERS, VOL. 6, NO. 2, JUNE 2018 117
Overview of Ethiopian Textile Industry
Bewuket Teshome Wagaye* and Gashaw Ashagre Walle
Abstract- The overarching objective is to investigate the status of Ethiopian Textile Industry. Primary data were collected through observation, personal and telephone interviews. Besides, secondary data were compiled from company documents and research institutes. The data were analyzed using simple statistical tools and inductive and deductive reasoning. The major findings are: the cultivated land is 3.7% with a productivity of 19.8 ql/ha; the combined ginning capacity is 1,031 ton/day; the daily performance of spinning mills is 386.4 ton and the capacity of composite and knitting mills is 578,576 meters per day of fabric. The trend indicates that there is a negative trade balance. Despite these facts, there is a large area of land suitable for cotton cultivation, tremendous trainable labor force and a conducive policy for the expansion of textile industry.
Ethiopia’s history in textiles began in 1939 in Dire Dawa city [1]. The textile industry encompasses cotton
producing, ginning, spinning, weaving, knitting, dyeing and finishing, and garment. The total land suitable for producing cotton is 3 million ha. However, only around 3.7% is utilized [2], implying untapped potential [3]. After the cotton is harvested, the lion’s share goes to 21 ginning factories (four roller ginning and 17 saw ginning). All lint is supplied to textile mills, whereas the cotton seed is used for seed, oil producing and fodder.
At present, there are 38 textile factories. Most of them are owned by government producing mostly work-wear garments for the domestic market [3]. In addition, there are around 84 garment factories mostly located around Addis Ababa [4].
The government gives special attention for the development of the textile sector. As such various stakeholders are established. Ethiopian Cotton Producers,
B. Teshome Wagaye and G. Ashagre WalleEthiopian Institute of Textile and Fashion Technology, Bahir Dar, Ethiopia.
Correspondence should be addressed to B. Teshomee-mail: [email protected]
Ginners and Exporters Association is an autonomous local NGO that acts on behalf of its members. The other is Ethiopian Textile Industry Development Institute (ETIDI), established under the Ministry of Industry to enhance the capacity of textile and apparel manufacturing sectors. Ethiopian Textile and Garment Manufacturers Association has a special focus on technical issues, marketing and policy. The other important stakeholder is Ethiopian Ministry of Agriculture [5]. Moreover, there are higher educational institutions producing personnel having technical knowledge and skills – the most notable being Ethiopian Institute of Textile and Fashion Technology established since 1963 [6].
The global market has become increasingly accessible to countries such as Ethiopia. New export opportunities are created through initiatives such as the African Growth and Opportunity Act (AGOA), the Common Market of Eastern and Southern Africa (COMESA) and bilateral trade agreements established with Western countries. Ethiopia is also part of “Everything But Arms” program providing access to the EU market for Lesser Developed Beneficiary Countries [5].
The country has a large pool of trainable manpower. Land is available on a leasehold basis to attract foreign investment. Regional governments are expected to allocate land to investors within 60 days of receiving applications. The government is willing to negotiate with individual business to provide incentives for capital investment. Besides, Ethiopia is politically stable [7].
However, one of the threats is the substitution of cotton cultivation by sesame and sugarcane. Hence, the land cultivated by cotton and its production is reduced. Nevertheless, this is a temporary problem caused by conflict of interest deviating from the vision of the government.
II. COTTON CULTIVATION IN ETHIOPIACotton is cultivated all over the country. The total land cultivated in 2012 was 111,886 ha with an average production of 19.8 ql/ha. 62% of seed cotton is produced by Afar and Amhara regions. 23.57% of cotton is produced by small scale farmers, while 76.43% by large scale companies
Industrial Report
118 JOURNAL OF TEXTILES AND POLYMERS, VOL. 6, NO. 2, JUNE 2018
through mechanized farming. The two major upland cotton varieties used are Delpine 90 and Acala SG2. The main customers of the seed cotton are ginning factories. There are also large numbers of hand spinners consuming a small portion of seed cotton [2].
III. GINNING Seed cotton is processed by roller gins (78%) and saw gins (22%). The installed capacity is 1,031 ton/day [3] with a ginning out-turn of 36%. The regional distribution of ginneries is: Oromia (24%), Amhara (20%), Addis Ababa (19%), Afar (18%) and others (19%) [2].
Ginneries are facing multifaceted problems. Poor quality seed cotton is the major impasse. Marketing is done via bargaining as there is no cotton grading. Since it is on weight basis, ginners cannot buy cotton based on quality parameters. Consequently, farmers spray water, add soil and other contaminants for the sake of adding weight to gain more market value. Seed cotton is packed using jute and polypropylene bags and is transported to ginneries by open trucks exposing it for further contamination and trash. These practices cause poor quality cotton to be processed resulting in unwanted expenses and loss of productive time in ginning, and hence deterioration of spinning mills’ performance [2].
IV. TEXTILE SECTOREthiopian textile sector is one of the rapidly growing industries in Africa. The government gives priority to the sector with various initiatives for investment. Hence, local and foreign investors are joining the sector. The textile industry comprises two interrelated segments: the organized mill sector and the decentralized handloom sector. The organized mill sector consists of 19 medium-to large-scale vertically integrated mills; 15 weaving, knitting and dyeing mills; and 4 spinning mills. The decentralized
handloom and power-loom sectors comprise thousands of small fabric-weaving, and dyeing and printing units [4]. Yarn Production: There are more than 297,600 spindles and 15,728 rotors installed for manufacturing cotton and blended yarns. The installed capacity of the mills is 386.4 tons of yarn per day with an average count of 20 Ne. 90% of the mills spin cotton for their weaving section and to the international market. 10% of the mills produce blended yarns, most of which are polyester-cotton blend. Moreover, there are 2 sewing thread factories [4]. Fabric Production: There are more than 35 mills producing woven and knitted fabrics for export and domestic market. The overall installed capacity is 1,100 shuttleless and 500 shuttle weaving machines. The production of fabrics is about 578,576 m/day, the majority of which is processed into finished fabrics, whereas the remaining is sold as grey cloth [4].Dyeing and Finishing: Fabric dyeing and finishing segment is technologically underdeveloped leading to low product quality. Besides, it creates immense environmental pollution because the majority of factories do not have effluent treatment plants. Lack of investment has hurt its competitiveness and has limited the ability to supply quality fabrics for domestic and international markets.
V. TEXTILE MARKET AND TRADE The global home textile market retail value is enormous. It was USD 42.33 billion in 2013 and is expected to reach USD 117.10 billion in 2018 [8]. However, Ethiopia’s economic growth has not been benefiting from it. Recently, due to the priority given to the sector, the quality of textile products is improving and items are being sold in domestic as well as international markets. Successive government policies have consistently encouraged measures to exploit comparative advantages to increase exports. The target for textiles’ export for the year 2010–2015 was set USD 1 billion. It was planned to attain this goal through capacity
Export market revenue ($ million)
No.
Product type
Year
2010/11 2011/12 2012/13 2013/14 2014/15
1 Yarn 9.14 8.89 23.46 28.15 12.20
2 Fabric 22.95 8.28 9.60 6.32 9.20
3 Garment 26.75 63.09 61.00 72.15 72.00
4 Handloom products 3.36 4.36 4.92 4.73 4.60
Total 62.20 84.62 98.98 111.35 98.00
TABLE IETHIOPIA’S TEXTILES EXPORT BY ITEM
Source: ETIDI performance report from the year 2010–2015
TESHOME AND ASHAGRE: OVERVIEW OF ETHIOPIAN TEXTILE INDUSTRY 119
building, expansion of existing factories, completion of factories under erection and attracting new investment [7]. However, during this period, the achieved revenue was below the target (USD 455.15 million). The details of export revenue achieved during the five year period are given in Table I.
The above data show that foreign exchange earnings have a robust yearly growth except in 2015. Unfortunately, the trend of yearly export earnings in percentage is decreasing.
The share of textiles out of the total merchandise exports in 2014 was 3.4% [9] compared to 1.9% in 2010 [10]. Its impact on the nations GDP in 2014 was 0.23% [11]. The export value of textiles in 2012 was 4% of the total trade of 2.99 billion [12]. This was slightly less than the 4.8% achieved in the previous year out of a total trade of 2.88 billion. The total trade increased in 2012, while the foreign exchange earnings of textiles decreased.
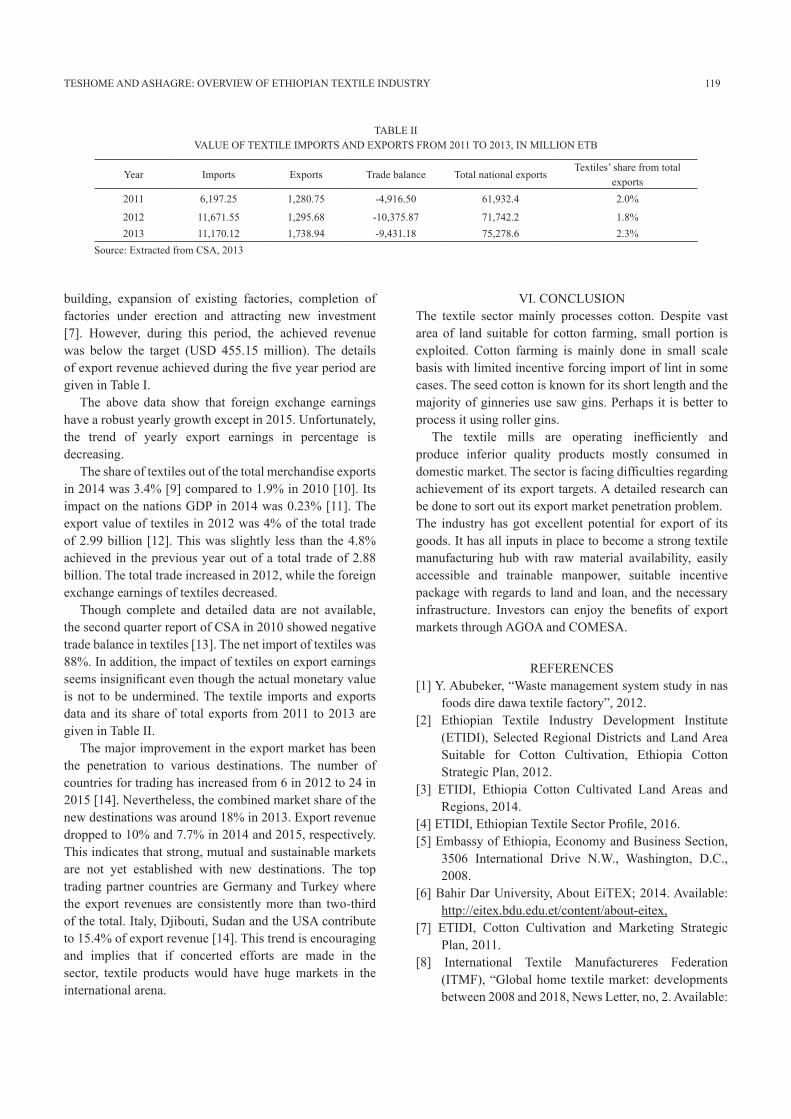
Though complete and detailed data are not available, the second quarter report of CSA in 2010 showed negative trade balance in textiles [13]. The net import of textiles was 88%. In addition, the impact of textiles on export earnings seems insignificant even though the actual monetary value is not to be undermined. The textile imports and exports data and its share of total exports from 2011 to 2013 are given in Table II.
The major improvement in the export market has been the penetration to various destinations. The number of countries for trading has increased from 6 in 2012 to 24 in 2015 [14]. Nevertheless, the combined market share of the new destinations was around 18% in 2013. Export revenue dropped to 10% and 7.7% in 2014 and 2015, respectively. This indicates that strong, mutual and sustainable markets are not yet established with new destinations. The top trading partner countries are Germany and Turkey where the export revenues are consistently more than two-third of the total. Italy, Djibouti, Sudan and the USA contribute to 15.4% of export revenue [14]. This trend is encouraging and implies that if concerted efforts are made in the sector, textile products would have huge markets in the international arena.
VI. CONCLUSIONThe textile sector mainly processes cotton. Despite vast area of land suitable for cotton farming, small portion is exploited. Cotton farming is mainly done in small scale basis with limited incentive forcing import of lint in some cases. The seed cotton is known for its short length and the majority of ginneries use saw gins. Perhaps it is better to process it using roller gins.
The textile mills are operating inefficiently and produce inferior quality products mostly consumed in domestic market. The sector is facing difficulties regarding achievement of its export targets. A detailed research can be done to sort out its export market penetration problem.The industry has got excellent potential for export of its goods. It has all inputs in place to become a strong textile manufacturing hub with raw material availability, easily accessible and trainable manpower, suitable incentive package with regards to land and loan, and the necessary infrastructure. Investors can enjoy the benefits of export markets through AGOA and COMESA.
REFERENCES [1] Y. Abubeker, “Waste management system study in nas
foods dire dawa textile factory”, 2012.[2] Ethiopian Textile Industry Development Institute
(ETIDI), Selected Regional Districts and Land Area Suitable for Cotton Cultivation, Ethiopia Cotton Strategic Plan, 2012.
[3] ETIDI, Ethiopia Cotton Cultivated Land Areas and Regions, 2014.
[4] ETIDI, Ethiopian Textile Sector Profile, 2016.[5] Embassy of Ethiopia, Economy and Business Section,
3506 International Drive N.W., Washington, D.C., 2008.
[6] Bahir Dar University, About EiTEX; 2014. Available: http://eitex.bdu.edu.et/content/about-eitex,
[7] ETIDI, Cotton Cultivation and Marketing Strategic Plan, 2011.
[8] International Textile Manufactureres Federation (ITMF), “Global home textile market: developments between 2008 and 2018, News Letter, no, 2. Available:
Year Imports Exports Trade balance Total national exports Textiles’ share from total
[13] Central Statistical Agency, External Merchandise Trade Statistics, Second Quarter, 2010. The Federal Democratic Republic of Ethiopia, Addis Ababa. Available: