Industrialization: trends and transformations Trade and industrialization have reinforced each other. At the international level, trade has allowed countries to specialize between industry and other sectors, between different branches of industry, and increasingly even between different stages in production. Trade has provided access to critical industrial inputs, including technology, for coun- tries incapable of producing them. Expanded de- mand for exports has spurred technological devel- opment and industrial production. In turn, the ad- vent of new industrial technologies has shaped the pattern of specialization and hence the pattern of trade. At the national level, domestic trade has allowed specialization between economic sectors and within industry. Again, new technologies and in- dustrial progress have altered the internal pattern of specialization and trade. In the other direction, increased domestic trade has provided the de- mand to stimulate the introduction of new technol- ogies and further industrialization. The first two parts of this chapter trace some key developments in technology, international special- ization, and international trade. Together, these have led to today's integrated system of global trade and industrial production. This historical re- view highlights the influence of government poli- cies toward trade and ends by discussing the per- formance of developing countries in this global system since the 1960s. The third part of the chap- ter discusses the changes in economic structure that have typically resulted from the interaction of technology, specialization, and trade over the course of industrialization. The fourth part dis- cusses the factors that appear to have contributed to the more successful industrialization experi- 38 ences in the period before World War II. The chap- ter serves as historical background for the analyses of industrialization since World War II in later chapters. Although industry, broadly defined, in- cludes mining, construction, electricity, gas, and water, in addition to manufacturing, this chapter focuses more on manufacturingthe most dy- namic and usually the largest industrial subsector. Global industrialization in historical perspective International specialization has evolved beyond the old pattern by which industrialized countries exported manufactures to the developing coun- tries in exchange for primary commodities. Today, some of the world's most successful exporters of manufactures are developing countries; many of their exports go to industrialized countries, from which they in turn import manufactures. Among industrialized countries, this two-way trade in manufacturesintraindustry trade as it is com- monly calledhas reached the point where com- parisons of comparative advantage are meaningful only at the level of finely disaggregated product categories. Much of this intraindustry trade re- flects the specialization that has accompanied in- dustrialization. Production of a single good now commonly spans several countries, with each country in this "global factory" performing tasks in which it has a cost advantage (see Figure 3.1). Some of these changes in international speciali- zation and trade are no doubt responses to govern- ment policy. But, on the whole, they reflect the natural economic processes that have shaped in- dustrialization from the start.
Transcript
Industrialization: trends and transformations
Trade and industrialization have reinforced eachother. At the international level, trade has allowedcountries to specialize between industry and othersectors, between different branches of industry,and increasingly even between different stages inproduction. Trade has provided access to criticalindustrial inputs, including technology, for coun-tries incapable of producing them. Expanded de-mand for exports has spurred technological devel-opment and industrial production. In turn, the ad-vent of new industrial technologies has shaped thepattern of specialization and hence the pattern oftrade.
At the national level, domestic trade has allowedspecialization between economic sectors andwithin industry. Again, new technologies and in-dustrial progress have altered the internal patternof specialization and trade. In the other direction,increased domestic trade has provided the de-mand to stimulate the introduction of new technol-ogies and further industrialization.
The first two parts of this chapter trace some keydevelopments in technology, international special-ization, and international trade. Together, thesehave led to today's integrated system of globaltrade and industrial production. This historical re-view highlights the influence of government poli-cies toward trade and ends by discussing the per-formance of developing countries in this globalsystem since the 1960s. The third part of the chap-ter discusses the changes in economic structurethat have typically resulted from the interaction oftechnology, specialization, and trade over thecourse of industrialization. The fourth part dis-cusses the factors that appear to have contributedto the more successful industrialization experi-
38
ences in the period before World War II. The chap-ter serves as historical background for the analysesof industrialization since World War II in laterchapters. Although industry, broadly defined, in-cludes mining, construction, electricity, gas, andwater, in addition to manufacturing, this chapterfocuses more on manufacturingthe most dy-namic and usually the largest industrial subsector.
Global industrialization in historicalperspective
International specialization has evolved beyondthe old pattern by which industrialized countriesexported manufactures to the developing coun-tries in exchange for primary commodities. Today,some of the world's most successful exporters ofmanufactures are developing countries; many oftheir exports go to industrialized countries, fromwhich they in turn import manufactures. Amongindustrialized countries, this two-way trade inmanufacturesintraindustry trade as it is com-monly calledhas reached the point where com-parisons of comparative advantage are meaningfulonly at the level of finely disaggregated productcategories. Much of this intraindustry trade re-flects the specialization that has accompanied in-dustrialization. Production of a single good nowcommonly spans several countries, with eachcountry in this "global factory" performing tasksin which it has a cost advantage (see Figure 3.1).
Some of these changes in international speciali-zation and trade are no doubt responses to govern-ment policy. But, on the whole, they reflect thenatural economic processes that have shaped in-dustrialization from the start.
Figure 3.1 Global manufacturing: the component network for the Ford Escort (Europe)
Note: Final assembly takes place in Halewood (United Kingdom) and Saarlouis (Federal Republic of Germany).Source: Dicken 1986, figure 9.9, p. 304.
Austria
Tires, radiatorand heaterhoses
Japan
The rise of modern industrialization:the mid-i 700s to 1820
Although historians differ on details, the consen-sus is that industrialization began in Britain around
the middle of the eighteenth century. Innovationsin the spinning and weaving of cotton greatlyboosted productivity; cotton output increased ahundredfold from about 1760 to 1827, and cottontextiles overtook wool manufacturing to become
39
SwitzerlandStarter, alternator,
Underbody cone and rollercoating, bearings, wind-speedometer screen washergears pump
Figure 3.2 Historical trends in the growth ofreal GDP and exports in selected countries,1720-1985
Percent10
oExports
8
6
2
FL1
1720- 1820-1820 1870
Note: Accurate historical data for world exports and GDP aredifficult to obtain, so the chart shows average growth rates for sixmajor industrial countries: France, Germany, Italy, Japan, theUnited Kingdom, and the United States. For exports, the growthrate for 1720- 1820 includes only France and the United Kingdom;the average for 1820-70 includes France, Germany, the UnitedKingdom, and the United States. The GDP growth rates have thesame coverage, except that the first period is 1700-1820 instead of1720-1820, and the United States is excluded from both the firstand second periods. More comprehensive world data are pro-vided for the period since World War H in Figure 3.3.Source: For 1720-1979: Maddison 1982, tables 3.2 and 3.7. For1979-85: for GDP, World Bank data; for exports, IMF, Interna-tional Financial Statistics.
the leading manufacturing product. Most of thisgrowth may be attributed to specialization com-bined with simple modifications to existing pro-cesses. Adam Smith, writing The Wealth of Nationsin the 1770s, emphasized specialization and the di-vision of labor, not the introduction of machines,as the basis for higher productivity. The innova-tion that allowed coal to be used in smelting ironand James Watt's improvement of the Newcomensteam engine between 1776 and 1781 were mile-stones in the development of industrial machinery.But it took several decades for these innovations tobe incorporated into production on a wide scaleand to make the factory the symbol of manufactur-ing industry.
40
These innovations are now generally thought tohave sparked the Industrial Revolution, but it isunlikely that people at that time would have re-garded them as revolutionary. Output in Britishagriculture and handicrafts had been expandingfor about 300 years. In contrast with continentalEurope, Britain had eliminated internal customsbarriers as well as most guild and state monopolyrestrictions on production by the early 1700s. Thebill of exchange, deposit banking, and insurancewere well developed, and there had also beensteady improvements in roads, rivers, and canals.Rising agricultural productivity had increased in-comes and expanded the domestic market forother goods. The enclosure of common villagelands had pushed labor from the farms and in-creased the number of people who depended onthe market for food.
Throughout the period, domestic trade boomed,and an additional boost in demand came from in-creasing foreign trade. The expansion of demandgave impetus, within the relatively free enterpriseenvironment that prevailed, to a series of innova-tions in production. An important pre-IndustrialRevolution example was the putting-out system intextiles. Merchant-entrepreneurs supplied materi-als to textile weavers in the villages, bought backthe finished cloth, and sold it to domestic con-sumers or to export merchants. Ultimately, as thegrowth of demand for manufactures exceeded thegrowth of the labor force, the specialization andlabor-saving inventions that are generally ac-knowledged to have constituted the first industrialrevolution followed.
The transport revolutions, the spread ofindustrialization, and the emergence of a globalmarket: 1820 to 1870
After the innovations in cotton textiles, iron smelt-ing, and the steam engine, industrialization cen-tered on steel, railways, and steamships fromabout 1820 to 1870. Railways integrated nationalmarkets and stimulated demand for iron and steel.With steel and steam power, bigger and more reli-able ships could be built. Freight costs dropped,which enabled such previously remote areas as theAmerican Midwest to produce bulky agriculturalproducts for distant markets in Europe. Belgium,France, Germany, and the United States began toindustrialize in this period. Europe, the UnitedStates, Canada, Argentina, and Australia werelinked by international trade in agricultural pro-duce, raw materials, and manufactured products.
The spread of industrialization to the Europeancontinent was facilitated by important institutionalreforms and the removal of many of the restric-tions that had hindered domestic commerce. By1820, Europe had emerged from the French Revo-lution and the Napoleonic wars that followed it. InFrance, tariffs and tolls on domestic trade, as wellas guild restrictions on the choice of occupation,were abolished immediately after the Revolution.These reforms were soon followed by a standard-ized system of weights and measures (the metricsystem) and new legal codes protecting propertyrights. The Napoleonic wars helped diffuse thiswave of liberalism and reform to other parts ofEuropeBelgium, the Netherlands, Switzerland,Italy, and much of Germany. In Germany, afteryears of effort, barriers to domestic trade weregreatly reduced in 1834 by the creation of theZoilverein, a customs union among the differentGerman states.
The United Kingdom, the United States, andmany of the European countries also adoptedmore liberal external trade policies between 1820and 1870. Initially, the United Kingdom, the leaderin industrial technology, prohibited exports of ma-chinery and the emigration of skilled workers. ButBritish entrepreneurs and craftsmen could befound in Belgium, France, and other Europeancountries, often using smuggled machinery to pro-duce textiles and engineering products. Realizingthe futility of the prohibition, the United Kingdomremoved the legal barriers against emigration ofskilled workers (in 1825) and against exports ofmachinery (in 1842). Thereafter, British entrepre-neurs, workers, and financiers helped to developrailways and coal mining in Europe and elsewhere.Subsequently, the United Kingdom abolished theNavigation Acts, which had restricted interna-tional shipping; and with the repeal of the restric-tions on grain imports (the Corn Laws) in 1846, itmoved to free trade. Protective tariffs were re-placed with revenue tariffs, which were graduallyreduced to an average of 5.8 percent by 1880.
The United States began a series of tariff reduc-tions in 1840, and by 1857 most rates were at orbelow 24 percent. But an increasing need for gov-ernment revenue, especially during the Civil War,led to several tariff increases. After the Civil Warended in 1865, tariff increases continued for pro-tection purposes.
France embarked on a policy of reducing tariffsand eliminating import prohibitions around 1852,which culminated in the Cobden-Chevalier freetrade treaty of 1860 between France and the United
Kingdom. This treaty liberated French industrialdevelopment from reliance on expensive domesticcoal and iron. French industry and railways, whichnow had access to cheaper and better coal, iron,and steelthe basic industrial raw materials of thaterawere able to develop rapidly. In Germany, theimport duties levied by the Zoliverein in 1834 weremuch lower than those in other European coun-tries at the time. Duties on manufactured imports,for example, were about 10 percent in Germany.But these were steadily increased in the 1840s. TheCobden-Chevalier treaty between France and theUnited Kingdom and agitation by German freetraders prompted a series of tariff reductions inGermany in the 1860s. By 1873 all duties levied forprotective purposes had been removed in favor ofmoderate duties levied for revenue purposes.
Economic liberalism between 1820 and 1870, to-gether with the transport revolutions wrought byrailways and steamships, boosted world outputand international trade (see Figure 3.2). Still, morethan three quarters of the world's industrial pro-duction in 1870 was accounted for by four coun-tries: the United Kingdom (about 32 percent), theUnited States (about 23 percent), Germany (about13 percent), and France (about 10 percent).
The second industrial revolutionand the waning of liberalism: 1870 to 1913
The next forty-three years-1870 to 1913saw ma-jor advances in science and technology. The inven-tion of the Gilchrist-Thomas process, which al-lowed steel to be made from iron ore of highphosphorus content, propelled the industrial de-velopment of countries with extensive deposits ofphosphoric ores, such as Germany and Sweden.Other innovations in this periodelectricity, re-frigeration, organic chemicals, the internal com-bustion engine, the transatlantic telegraph, andthe radioare commonly regarded as the basis of a"second industrial revolution." Some of them re-inforced the trend toward greater physical integra-tion of world markets: refrigeration, for example,made it possible to ship frozen meat from Australiato London by the 1880s.
This second revolution differed from the earlierone in two important ways. Technological ad-vances became more dependent on scientific re-search that was systematically organized in firmsand universities for commercial application. Ger-many, later joined by the United States, led theway. Also, for the first time, industrial growth inthe industrialized countries became partly depen-
41
dent on supplies from elsewhere: raw materialsneeded by the new technologies (for example,bauxite, petroleum, and rubber) and ingredientsfor new alloys (for example, tungsten, nickel, andchromium) now had to be supplemented with sup-plies from outside the group of industrializedcountries. As a result, many countries were ush-ered into global industrialization as suppliers ofindustrial raw materials. Since many of theseproducts had no economic value until the newtechnologies created demand for them, people inthese areas were now presented with additionalincome opportunities. But along with these in-come opportunities came colonization for many ofthe new suppliers in Africa and Asia. This histori-cal link between participation in internationaltrade and colonization influenced the choice of in-dustrialization and trade strategies in many of theformer colonies after World War II.
Despite advances in technology, output in theindustrialized countries grew only slightly fasterthan it had between 1820 and 1870, and the growthrate of exports fell (Figure 3.2). One reason for thiswas the onset of protectionism in the late 1870s.The United States had increased tariffs to help fi-nance its Civil War. After the war the tariffs weremaintained and even increased to protect both ag-riculture and industry. In Germany, where tariffson most imports had been abolished by 1877, agri-cultural producers complaining of "cheap" wheatfrom America and iron and steel producers facingdeclining prices caused free trade to be abandonedin 1879. Protectionist forces in France quickly fol-lowed Germany's example, led again by farmerscomplaining about imports of cheap Americanwheat. Other countries did the same, which led toa series of tariff wars in Europe.
A number of countries joined the "industrialleague" between 1870 and 1913, including Russiaand Japan. The state played a more active role inthe industrialization of these two countries, partic-ularly in the development of infrastructure, than itdid in the countries that had industrialized earlier.Nevertheless, the experience of Russia and Japanparalleled Western Europe's in some respects.Both countries embarked on major reforms thatremoved restrictions on domestic markets andhelped spur domestic commerce. Serfdom wasabolished in Russia in 1861, and judicial, adminis-trative, tax, and monetary reforms followed in thelate 1860s. In the mid-1880s the domestic marketwas integrated by the expansion of the railways.
Reforms in Japan were even more far-reaching.After more than 260 years in virtual autarky, Japan
42
was forced in the 1850s to open up to foreign trade.The country was compelled to sign a treaty that foryears (1858-98) put a 5 percent ceiling on the tariffsthat it could levy on imports. Partly in reaction tothis, the old Tokugawa Shogunate that had ruledJapan for centuries was overthrown, the Meiji Em-peror was restored in 1868 as head of a centralizedstate, and a series of reforms was begun. Guildswere eliminated, feudalism was abolished, andprivate property rights to land were established.People were now free to choose their trade or occu-pation: they could produce any crop or commodityand could buy and sell land freely. Taxation wasreformed and made uniform across the country.Internal tolls on the movement of goods and re-strictions on the movement of people were abol-ished; so too were prohibitions on the exports ofrice, wheat, copper, and raw silk. These reformsare generally acknowledged to have been majorcatalysts in early Japanese industrialization.
The collapse of liberalism and of the globalmarket: 1913 to 1950
Economic liberalism, waxing from 1820 to around1870, and waning between 1870 and 1913, waspractically moribund from 1913 to about 1950. Dur-ing these years there were two world wars andfrequent trade wars, the severest economic depres-sion in history occurred, the socialist approach toindustrialization emerged, and several countriesthat had previously served the world trading sys-tem as suppliers of primary products (Argentinaand Brazil to name just two) adopted an industrial-ization strategy that emphasized import substitu-tion behind high protective barriers.
Even within some of the major capitalist indus-trialized countries, the market lost ground. Thecartelization of German industry, which hadstarted around the last quarter of the nineteenthcentury, greatly intensified in the years betweenthe two world wars. Industrial cartels started inthe United States at about the same time as in Ger-many, but unlike in Germany were promptly out-lawed. Nevertheless, a wave of mergers resultedin significant concentration in U.S. industry. Inter-national trade also became restricted as the indus-trialized countries adopted restrictive and preda-tory commercial policies around the GreatDepression years of the 1930s. Tariff wars andquantitative restrictions became common. TheUnited States passed the Smoot-Hawley Tariff Act,which created high protective tariffs. The UnitedKingdom and France retreated from multilateral
trade, each emphasizing trade within its colonialempire at the expense of outside countries. Ger-many created an elaborate mechanism of bilater-al payments and exchange controls for its tradewith central and southern Europe and with SouthAmerica.
Although the period from 1913 to 1950 inheritedmany technological innovations from the earlierperiod of industrialization and contributed manyof its own, their diffusion was delayed by the polit-ical and economic turmoil. The growth of outputdropped, and there was an even greater fall in thegrowth of international trade (Figure 3.2).
Global industrialization after World War II
By the mid-1950s postwar reconstruction was vir-tually complete, and the world economy entered aperiod of unprecedented output and trade expan-sion (Figure 3.2). Manufacturing led the way inboth output and export growth (see Figure 3.3). Asin the nineteenth century, exports grew faster thanoutput.
Postwar growth in manufacturing was fueled byan explosion of new products, new technologies,liberalization of international trade, and increasingintegration of the world economy. Assembly lineproduction, the internal combustion engine andthe automobile, electricity and the consumer dura-bles that came with itall of them predating thewarwere given a push by the postwar release ofpostponed consumer spending. There were en-tirely new technological advances as well: syn-thetic materials, petrochemicals, nuclear energy,jet aircraft, and computers and electronic products(notably television). And great strides were madein telecommunications technologies, microelec-tronics, and robotics. The impact of microelec-tronics and robots on production processes is po-tentially so great that many observers believe theworld is now on the threshold of a "third indus-trial revolution."
As before, some of the new technologies assistedthe physical integration of world markets. The jetaircraft cut travel time. Telecommunications madeit easier for multinational corporations to coordi-nate subsidiaries in different countries. The associ-ated electronic media helped shape a world marketwith increasingly similar consumer tastes. Tradeliberalization among industrialized market econo-mies under the General Agreement on Tariffs andTrade (see Chapter 8) helped to create a global en-vironment that was conducive to the developmentand diffusion of the new technologies.
F;.gure 3.3 Postwar growth in world outputand exports
Growth rate by sector
Agriculture
1965-73
1973-85
Manufacturing
1965-73
1973-85
Mining
1965-73
1973-85
2 0 2 4 6 8 10Percent
Manufacturing output and exports
Index (1950 = 100)1,500
Source: GATT 1986b.
OutputExports
Three other developments marked the pattern ofglobal industrialization in the postwar period.First, the appearance of a nonmarket alternative toindustrialization in Eastern Europe and elsewhere(see Box 3.1); second, decolonization in Asia, Af-rica, and the Caribbean; and third, the rise of themultinational corporation to prominence in worldproduction and trade in manufactures.
43
Box 3.1 Industrialization and trade in nonmarket economies
Industrialization in the Soviet Union and other non-market economies has evolved differently from theother cases reviewed in this chapter. These countrieshave suppressed market transactions domestically andhave engaged in relatively little foreign trade, evenamong themselves. Spontaneous responses to eco-nomic incentives have contributed little to either tech-nological change or specialization among economicunits. The Central Plan prepared by the governmenthas attempted to determine most economic activities.State control of the means of production has been a keyfeature of this economic system. The Soviet Union pio-neered it in 1928, and after World War lIthe socialistcountries of Eastern Europe and elsewhere adopted it.
Statistics on these economies are difficult to obtain.In addition, because relative prices in these economiesdo not reflect relative scarcities, data on GDP, total in-vestment, domestic consumption, industrial output,and so forthall of which must rely on relative pricesfor aggregationare difficult to interpret. Neverthe-less, it is quite clear that the Soviet Union and some ofthe nonmarket economies have made tremendousprogress in industrialization, especially since WorldWar II. According to calculations by Western econo-mists, Soviet GNP grew at an average annual rate of6.7 percent from 1929 to the mid-1950s; 6.1 percent in1953-65; 5.3 percent in 1966-70; 3.8 percent in 1971-75;2.7 percent in 1976-80; and 2.4 percent in 1981-85. Inview of the statistical problems, these estimates are de-batable. But, if they are reasonably accurate, they sug-gest that in the two decades following World War II(1950 to 1970), only Japan and Germany, among theindustrial market economies, grew faster. Growth inthe other nonmarket economies during this period wasalso rapid, although generally not so rapid as that inthe Soviet Union and not sustained over such longperiods.
Much of this growth occurred in industry. Govern-ment control of the means of production allowed thesecountries to channel large shares of output to invest-ment in industry. The large investment efforts involvedmeant that in many of the countries consumption percapita had to be constrained by the state for long pe-riods. Nevertheless, the heavy investments togetherwith the large pools of labor available initially resultedin rapid industrial expansion.
But the industrial sectors that appeared in theseeconomies quickly lost dynamism, owing to the inher-ent rigidities in central planning. For instance, for mostfirms the Central Plan specifies what to produce, whichinputs to use, where to obtain them, and where to sendthe outputs. Hence, most firms have had little libertyor incentive to innovate or diversify input sources (in-
cluding imports) so as to reduce costs. At the sametime, however, each firm is generally assured of a mar-ket regardless of quality, since other firms are requiredby the plan to take its outputs and final consumershave no options. Hence, there is little incentive formost firms, especially those producing nonmilitaryproducts, to improve upon their products, to maintainthe goodwill of customers, or to develop new markets(including export markets).
Some Western experts claim that total factor produc-tivity growth (see explanation in Box 3.3) in the SovietUnion has been negative since the mid-1970s. Giventhe difficulty of getting access to detailed and accuratedata on the Soviet economy, however, this assessmentof total productivity growth is not beyond dispute.What is beyond dispute is the fact that by the mid-1970s many economists and policymakers within theSoviet Union and other nonmarket economies hadopenly recognized the inefficiencies in their industrialsectors. Most of the countries then began opening upmore to foreign trade with the industrial market econo-mies, with technology acquisition the primary motive.Poland entered into a number of industrial cooperationagreements with Western firms (such as InternationalHarvester). Other East European nonmarket econo-mies, as well as China, entered into similar agree-ments, although in most cases more conservatively.The Soviet Union eventually also began increasingtrade with the industrial market economies. Soviet im-ports from the industrial market economies expandedat about 17 percent a year in the first half of the 1970s.Some experts estimate that technological imports in the1970s may have added about 0.5 percent a year to theSoviet industrial growth rate. Recently (1987) the So-viet Union adopted a policy that allows joint ventureswith foreign firms inside the Soviet Union.
There are, however, potential problems with a policyof opening up more to foreign trade while still main-taining a rigid system of central planning. Increasedimports ultimately require more exports to pay forthem, and so domestic firms should have the flexibilityto seek and respond quickly to export opportunities.Lack of such flexibility and also of a price system thatreflects relative scarcity has already contributed to bal-ance of payments difficulties in some of the nonmarketeconomies that have opened up their foreign trade,especially Poland. Several countries (for example,Hungary and China) are now trying to relax some oftheir restrictions on domestic market transactions inorder to promote efficiency and innovation. These re-forms are complicated and delicate, but the potentialeconomic gains appear to be considerable.
44
Figure 3.4 Share of offshore assemblyproducts in total manufactured imports bythe United States from selected developingeconomies, 1973-85(percent)
Note: Data are averages for the period. Manufactured productsare defined here as Standard International Trade Classification(SITC) categories 5,6,7,8, and 9, less 68.
Total value of the finished product.Gross value minus the value of material components that
originated in the United States.Source: U.S. International Trade Commission and UnitedNations.
Decolonization
Many of the countries emerging from colonialismin the postwar period chose an industrial develop-ment strategy that emphasized import substitutionbehind high government protectionsimilar to thestrategy adopted by Argentina, Brazil, Turkey, andother independent developing countries in the1930s. Several factors contributed to the appeal ofthis approach. First, during the turbulent yearsspanning the world wars, countries that had spe-cialized as exporters of primary products foundtheir access to export markets and to manufacturedimports reduced. Their terms of trade fell drasti-cally. This is what had prompted Argentina andothers to take the protective import substitutioncourse in the 1930s. In the first two decades afterWorld War II, predictions of a secular decline in the
terms of trade against primary products were com-mon, and many of the newly independent coun-tries thought it sensible to shift quickly to indus-tries. Second, many people in the new countriesassociated specialization in primary commoditieswith their previous colonial status. To them, inde-pendence called for breaking away from the colo-nial economic system. Many also believed thatprotection granted through government restric-tions on imports had played a significant role inthe early industrialization of Europe, North Amer-ica, and Japan. In addition, inspired by the SovietUnion's rapid industrialization, several of thenewly independent countries combined importsubstitution with government ownership, plan-ning, and production. In these countries, govern-ments sought to restrict domestic trade, unlike inEurope and Japan where early industrializationhad been assisted by the easing of restrictions ondomestic trade.
Countries pursuing the import substitution strat-egy typically started by producing final manufac-tures to replace imports. Many enjoyed initialbursts in the growth of manufacturing. But sinceproduction usually required imported intermedi-ate and capital goods, sustained industrial growthdepended on the expansion of exports to providethe necessary foreign exchange. Countries thatmade an early transition to export expansion, suchas the Republic of Korea, sustained their industrialgrowth. Many others did not make the transition.They stayed in the protective import substitutionphase and their industrial development was re-tarded.
Multinationals
Multinational corporations in manufacturing dateback as far as the nineteenth century (Singer, aU.S. firm, established a factory in Glasgow in 1867to manufacture sewing machines), and those inprimary commodities date back even farther. But itis only since the 1960s that multinationals havebecome major actors in shaping world industrial-ization. Today, between 25 and 30 percent of theworld's stock of foreign direct investmentthechannel for multinationals' investmentsis in de-veloping countries; about 40 percent of this is inthe manufacturing sector. Manufacturing multina-tionals have been attracted to some of the largedeveloping countries, especially in Latin America,because of trade policies that restricted imports offinal manufactures. But in many other countries,especially those in Southeast Asia, the attraction
45
has been the availability of semiskilled industriallabor at low cost. Some developing countries de-rive a significant part of their manufacturing ex-ports from local subsidiaries of multinationals. Al-though data for recent years are not available, inthe middle and late 1970s the share of multina-tionals in manufactured exports from Korea andMexico was around 30 percent. In Brazil the sharewas more than 40 percent, and in Singapore morethan 90 percent.
Multinationals have made it easier for some de-veloping countries to begin exporting manufac-tures without going through an initial phase of im-port substitution. Some of these corporations havelocated in developing countries with the principalaim of producing in order to export to their homeand other markets. Typically, this has occurredwhen the production processes have become rou-tine and thus require large inputs of semiskilledlabor. Locating in developing countries then allowsthe multinational firms to reduce labor costs.
Beginning in the late 1960s several multina-tionals began rationalizing their global production.Whereas before, most foreign subsidiaries hadproduced finished products, often with technolog-ical and intermediate inputs from the parent com-pany, now all the subsidiaries were increasinglylinked into a unified production process. Each per-formed only those aspects of the manufacturingprocess in which it had a comparative advantage.New subsidiaries were in some cases set up in de-veloping countries to perform the labor-intensiveactivities. This system is not always confined totransactions among subsidiaries of the samemultinational. Sometimes the arrangements arebetween locally owned companies and foreign-owned companies. The foreign-owned companiesare not always multinationals, and sometimes theymay not even be based in the domestic economy.The arrangement is known as international sub-contracting. Sometimes the terms "offshore as-sembly" and "sourcing" are used. Figure 3.4shows the share of offshore assembly products intotal manufactured imports by the United Statesfrom four developing economies. Exemption fromduties of the value of U.S. components in the off-shore assembly imports has encouraged U.S. firmsto use this arrangement. Similar arrangements oc-cur between manufacturing firms in other industri-alized countries and producers in developingcountries.
An important form of subcontracting, especiallyin textiles, is an arrangement whereby firms basedin the industrialized countries provide design
46
specifications to producers in developing coun-tries, purchase the finished products, then sellthem at home and abroad. This is akin to theputting-out system in textiles which was adoptedin preindustrial England. With modern transportand communications, it probably is no more diffi-cult for today's merchants to organize a putting-out system between New York and Hong Kong, orbetween Tokyo and Seoul, than it was for the earlyEnglish merchants to organize their putting-outsystem between London and the surrounding vil-lages.
Postwar performance of developing countries
As a group, the developing countries still haveonly a small share in world manufacturing output,but their output and exports of manufactures havenonetheless grown more rapidly than those of theindustrial countries since the 1960s (see Tables 3.1and 3.2). No developing economy figured amongthe world's top thirty exporters of manufacturedproducts in 1965. Twenty years later Hong Kongand the Republic of Korea were among the topfifteen, with export shares close to those of Swe-den and Switzerland. Singapore and Brazil wereamong the top twenty, with export shares close tothose of Denmark and Finland. Although this per-formance occurred during a period of unprece-dented real growth in world output and trade inmanufactured products, it is remarkable that de-veloping countries sustained their progress evenwhen the world economy slowed after 1973. More-over, manufactured exports from developingcountries have become more sophisticated (see Ta-ble 3.3). Developing countries have diversifiedfrom traditional labor-intensive products (such astextiles) or those based on natural resources (suchas crude petrochemicals, cork, and paper) to chem-icals and engineering products.
There are now fears that microelectronics androbotics will reduce the labor-cost advantagewhich the developing countries have exploited toexpand their role in world manufacturing. Similarfears about the effects of machinery on employ-ment in earlier times proved unfounded. Increas-ing mechanization displaced some workers, but italso introduced new opportunities that led in thelong run to higher employment. The same couldbe true of the long-run impact of microelectronicsand robotics on industrialization in developingcountries. Box 3.2 discusses the effect of techno-logical change in textiles and clothingtwo indus-tries that are of special importance to industrializa-tion in developing countries.
Table 3.1 Shares of production and exports of manufactures by country group, 1965, 1973, and 1985
Table 3.2 Growth in production and exports of manufactures by country group, 1965-73,1973-85, and 1965-85
Note: Figures in parentheses are the SITC categories for the respective product group.Developing countries' exports of the listed product as a share of developing countries' total exports of manufactured products defined as SITC categories
5, 6, 7, and 8, less 68.The rate of growth of developing countries' exports of the listed product during 1970-84 in constant dollars.Total manufacturing exports less traditional manufactured exports.Rest of nontraditional exports.
Source: Murray (background paper).
47
Table 3.3 Structure of manufactured exports from developing countries, 1970-84
Share of developingcountries' exports
Growthrate'
Description 1970 1984 1970-84
Traditional manufactured exportsLabor-intensive
Textiles and apparel (84 and 65) 31.3 24.8 11.8Footwear (85) 1.8 2.9 18.2Other labor-intensive (61 and 83) 2.9 2.3 11.6Total 36.0 30.0 12.4
Box 3.2 Technical change and comparative advantage: the case of textiles and clothing
Developing countries that have embarked on a path ofefficient industrialization have often done so partlythrough the export of simple, labor-intensive manufac-tures, in particular clothing and textiles, to industrialmarket economies. But rapid technical change in suchindustries has led to a new form of export pessimism.
Surprisingly, perhaps, the textile industrynot nor-mally considered a leading industryhas consistentlyregistered higher-than-average labor productivitygains in the industrial market economies in recent dec-ades. These gains have been brought about by a seriesof labor-saving innovations since World War II: the ra-tionalization of production in more specialized factor-ies, dramatically higher speeds in spinning, weaving,and knitting (helped in part by the growing use of syn-thetic fibers), and the introduction of radical, new tech-niques (open-end spinning, shuttleless weaving, non-woven fabrics, tufted carpets, and so on). In the 1960smany textile industrialists predicted a sharp reversal ofcomparative advantage in favor of the advanced indus-trialized countries.
These predictions turned out to be not entirely right,but not entirely wrong. By and large, innovations intextiles did succeed in halting the further loss of com-parative advantage in the high-wage industrializedcountriesby means of a substantial reduction in laborcontent. The textile industries of Germany, Italy, andthe United States are, unlike their clothing industries,broadly competitive (although they still cling to protec-tion). The reversal in comparative advantage was in-complete for several reasons. Firmsespecially inEuropefound that the market would not allow themto produce standardized textiles on the scale thatwould justify the most capital-intensive equipment. Inaddition, the wage gap between the industrial market
economies and the developing economies remained solarge that a broad range of techniques could exist sideby side.
The clothing industry was never able to make similarstrides in productivity because of the inherent obsta-cles to automating the functions of a machinist manip-ulating a soft, limp fabric. But thanks to the promise ofmicroelectronics, clothing industrialists are now begin-ning to echo the textile industrialists of the 1960s.
A recent study sought to assess the likely impact ofmicroelectronics on developing countries' comparativeadvantage in clothing (Hoffman 1985). This studyfound signs of an increasing rate of innovations inclothing machinery, most of them based on microelec-tronics. Recent innovations promised substantial sav-ings in material and labor costs, as well as other advan-tages (such as time saving) in the preassembly phase ofproduction (when fabrics are cut). In the assembly(or sewing) phasewhich accounts for a significantlylarger share of total costs than preassembly-productivity gains from microelectronics were also pos-sible, but on a less dramatic scale. The productivitygains in both stages required costly capital investment,a minimum scale of efficient operation larger than thatof the normal size of firm in this industry, increasingmanagerial sophistication, andin some casesa lossof flexibility. The study judged that, given the prob-lems in adopting the new technology, its rate of diffu-sion would be slow in the coming decade, and the newtechnologies might not reach their maximum impactuntil the first years of the next century. The study con-cluded that protection by the industrial countrieswould remain the more immediate threat to develop-ing countries' exports.
Not all of the developing countries have pro-gressed at the same rate, however. Some havedone far better than others. Figure 3.5 comparesproduction and exports of manufactures for forty-three economies before and after 1973. Because ofdifferences in the degree of distortion in exchangerates and in relative sectorál prices, comparisonsbased on the dollar value of manufactured produc-tion mean little. Export shares are more revealing.By 1985, the forty-three economies accounted fortwo-thirds of manufactured exports from develop-ing countries; the first fifteen alone accounted forabout 60 percent. Chapters 4 through 7 attempt toexplain why recent performance has varied sowidely from country to country. The rest of thischapter discusses the economic processes that
48
have been common to most industrializations andtries to draw some lessons from the period beforeWorld War II.
Industrialization and structural change
Typically, the share of manufacturing in GDP hasrisen in the early phase of industrialization. After atime, however, it has tended to fall, while thebasic underlying forces of industrializationtechnological change, specialization, and tradehave continued to propel output per capita up-ward. Thus, for most countries, the ratio of (a) theshare of manufacturing (or of industry) in GDP to(b) GDP per capita follows an inverted U as indus-trialization proceeds (see Figure 3.6). This same
relationship emerges, although not as clearly,when the ratio is compared across different coun-tries at a single point in time (see Figure 3.7). Theshare of services has also tended to rise over time;its upward trend lasts longer than that of manufac-turing. Agriculture's share in output gradually de-clines to accommodate the increased share of in-
Figure 3.5 Indicators of industrial performance of developing economies
1973 Rankings
Hong KongRepublic of KoreaYugoslaviaSingaporeIndiaBrazilMexicoArgentinaPakistanGreeceMalaysiaThailandColombiaPhilippinesEgyptTurkeyJamaicaMoroccoZimbabweGuatemalaEl SalvadorDominican RepublicTunisiaSierra LeoneCosta RicaVenezuelaZaireTrinidad and TobagoCôte d'IvoireIndonesiaAlgeriaKenyaUruguayNigeriaTanzaniaSn LankaChileSenegalGhanaCyprusCameroonPeruBotswana
o equal to or more than 15.0o 10.0 to less than 15.00 7.5 to less than 10.0o 5.0 to less than 7.5O 0.0 to less than 5.0U less than 0.0
1966-73Share
Growth Growth of manu-in manu- in man u- factu redfactu ring factu red exports
value added exports (1973)b
U 0 0 1. Hong KongU U U 2. Republic of KoreaU U 0 3. SingaporeU U U 4. BrazilU U 0 5. YugoslaviaU U 6.IndiaU U 7. MalaysiaU D U 8. MexicoU 0 U 9. TurkeyU 0 U 10. Philippineso 0 U 11. ThailandO U U 12. Indonesia0 U U 13. Greeceo 0 U 14. Pakistan0 U 0 15. Argentinao 0 U 16. MoroccoU 0 U 17. Tunisia0 U U 18. ColombiaU U U 19. EgyptU U U 20.PeruU U U 21. Sri LankaU 0 U 22. BotswanaU U U 23. VenezuelaU U U 24. ZimbabweU U U 25. JamaicaU U U 26. Trinidad and TobagoU U U 27. UruguayU U U 28. Costa RicaU U 29. ChileU U 0 30. GuatemalaU U U 31. CyprusU 0 U 32. Côte d'IvoireU 0 U 33. Dominican Republico 0 U 34. El SalvadorO U U 35. Kenyao U 36. CameroonU 0 U 37. SenegalU U U 38. ZaireU U U 39. Algeria0 U U 40. Sierra LeoneO U U 41. TanzaniaU U U 42. NigeriaU 0 U 43. Ghana
equal to or more than 10.0o 5.0 to less than 10.0o 2.5 to less than 5.0o 0.5tolessthan2.5U 0.2tolessthan0.5U less than 0.2
dustry and services. Similar trends occur in thesectoral distribution of employment.
Initial discussion of these long-term trends(Cohn Clark in 1940 and Simon Kuznets in the1950s and 1960s) were confined mainly to the in-dustrialized countries. Since then, a number ofscholars, notably Hollis Chenery, have studied
1985 Ranking'
1973 -85Share Change in
Growth Growth of manu- share ofin manu- in manu- factu red manufacturedfacturing factu red exports exports from
value added exports (1985)' 1973 to 1985
+++
+
Based on the share in manufactured exports from developing economies.Share of manufactured exports from developing economies.The + sign indicates that the share in 1985 is greater than in 1973, and the - symbol indicates that the share in 1985 is smaller than in 1973.
Growth rates (percent) Export share (percent)
49
U U 0U U 00 U UU U UU U UU U UU U U0 U UO U UU U UU 0 UU U UO U UU U UU U 0U 0 UU U UU U UU U UU U UU U UU U UU U UU U Uo U Uo U 0U 0 UO 0 UO U UU U 00 0 0U U UU U UU 0 UU U 0U U UU U UU U UU U 0U U UU U UU U UU U U
Figure 3.6 Historical relationship betweenGDP per capita and the share of industryin GDP in selected industrial countries,1870-1984
Share of industry in GDP (percent)a60
50
40
30
20
10
0
50
Germany"
France
United Kingdom
United States
Japan
0 50 100 150 200 250 300
Index of real GDP per capita (1965 = 100)
Note: The six data points shown for each country represent thefollowing approximate time periods: (from left to right) 1870,1913, 1950, 1965, 1975, and 1984.
Industry includes manufacturing, mining, and construction.Data for 1950 onward refer to the Federal Republic of Ger-
many.Source: Kuznets 1957, appendix table 2; Maddison 1982, tables A4and B2; and World Bank data.
post-World War II trends in developing countries,extending the analyses to trends within industry(see Box 3.3.). The economic explanations behindthe long-term trends rest, on the supply side, ontechnological change and its differential impactson economic sectors, the induced specializations,and the resulting trade and flow of resourcesamong and within sectors. On the demand side,the pattern of consumption changes with incomegrowth, and this induces changes in the structureof production.
In the early phases of industrialization, greateruse of machinery, especially in manufacturing, in-creases labor productivity and output. As industri-alization continues, further increases in labor pro-ductivity reduce the growth of industry's demandfor labor. In the early phases, high growth of em-ployment in industry is made possible by low
growth in agricultural employment; in the laterphases, high growth of employment in services ismade possible by lower growth in industrial andagricultural employment.
Agricultural productivity and industrialization
Agriculture's reduced share in GDP has, in manycountries, coincided with higher agricultural out-put and productivity. Britain experienced large in-creases in agricultural productivity in the secondhalf of the eighteenth century, before its industrialrevolution. Europe and North America wentthrough a similar process later. Japan substantiallyincreased its agricultural yields around the secondhalf of the 1800s.
Increasing agricultural productivity facilitates in-dustrialization in at least four ways:
Higher rural incomes raise the demand formanufactures along with the demand for othergoods. Moreover, because the share of food in totalexpenditure tends to decline as income rises, risingrural incomes also lead to a larger proportion of in-comes being spent on manufactures.
Rising agricultural productivity increases thesupply of agricultural raw materials for industry.
Additional foreign exchange made possible byincreased agricultural exports can be used to im-port inputs for industry. Higher farm incomesfrom increased agricultural productivity can alsogenerate additional savings, which can then bemade available for investment in industry. Japan'ssuccess in its transition to rapid industrial growthin the early twentieth century was partly due to itssuccess in mobilizing agricultural savings. Agricul-ture financed 27 percent of nonagricultural invest-ment from 1888 to 1902, and 23 percent from 1903to 1922. In the earlier period two-thirds of the in-vestment was channeled through the public sector,courtesy of the land tax. In the later period thisshare fell to a quarter (the private sector accountedfor the rest).
Rising farm productivity initially allows newentrants to the labor force to be employed outsideagriculture. Later, it allows labor to be releasedfrom agriculture and to be fed without sharp risesin domestic food prices or recourse to large andunsustainable imports of food.
The sen.'ice sector and industrialization
Growth in the share of services tends to persistlonger than growth in the share of manufacturingas industrialization proceeds. Much of the growth
Figure 3.7 Relationship between GD? per capita and the share of manufacturing value added in GD!'in selected economies, 1984
PhilippinesEgypt /
Zimbabwe//UruguayBrazil
Turkey \4
Bolivia PeruChile
Zambia)
in the share of services reflects the increasing spe-cialization and urbanization that come with indus-trialization. First, the factorythe symbol ofindustrializationrequires a vast, but less visibleservice infrastructure to function effectively. Trans-portation, distribution, communications, finance,and insurance, to name just a few, are all servicesthat have to expand to facilitate industrial growth.Second, some services (for example, cleaning, in-formation processing, advertising, and so forth)that previously were performed in-house by in-dustrial firms have progressively been contractedto firms in the service sector. Third, just as thehigher income demand elasticity for manufactures(compared with agricultural products) spurs therapid growth of manufacturing output in the earlyphases of industrialization, so the higher incomedemand elasticity for services (compared withmanufactures) encourages the growth of services
in later phases of industrialization. Fourth, in-creasing labor demand leads to the commercializa-tion of domestic services, as housewives and otherdomestic workers join the formal labor force. Ac-tivities that previously fell outside the statisticsthus begin to boost the recorded output of ser-vices. Fifth, urbanization, which accompanies in-dustrialization, requires additional services: police,sanitation, city administration, and so forth.
Since service occupations, on the whole, are lessamenable to automation, an increase in the valueof service output would normally require more la-bor input than an increase of equal value in theoutput of industry. This explains why the share ofservices in employment rises faster than the shareof services in GDP.
These factors account for the shift toward ser-vices within the individual economy. Growingintegration in the world economy has added
51
- ThailandPakistan
SSenegal Colombia.
SMorocco
IndiaS Sri Lanka Jordan
SKenya Tunisia
Indonesia- Bangladesh
/ s NigeriaCôte d'Ivoire
Sudan
Share40
30
Developing economy
Industrial economy
of manufacturing value added in GDP (percent)
ofRepublic
Korea
Areentina Singapore
Mexico Italy./ Hong Kong ,
BelgiumFederal Republic of Germany
Aistria s Japan
FranceFinland United States S
Tanzania
T Ghana 20 -, Spain
Venezuela Israelj
Netherlands Sweden
AustraliaSomaliaGreece New Zealand
Denmark * Canada
Zaire Malaysia United NorwayKingdom10
Algeria
0
0 2 4 6 8 10 12 14
GDP per capita (thousands of dollars)
Box 3.3 Statistical studies of economic growth and industrialization
Statistical studies of economic growth fall into twobroad categories. One category extends the celebratedClark-Kuznets studies to a large number of industrialand developing countries. The aim is to describe stan-dard patterns of growth in economic sectors and acrossdifferent branches of manufacturing. Another categorytries to account for the different sources of economicgrowth and to isolate the contribution of rising produc-tivity.
The studies that seek to establish standard patternsfocus on income per capita. They postulate that as con-sumers' incomes increase, their demands shift from
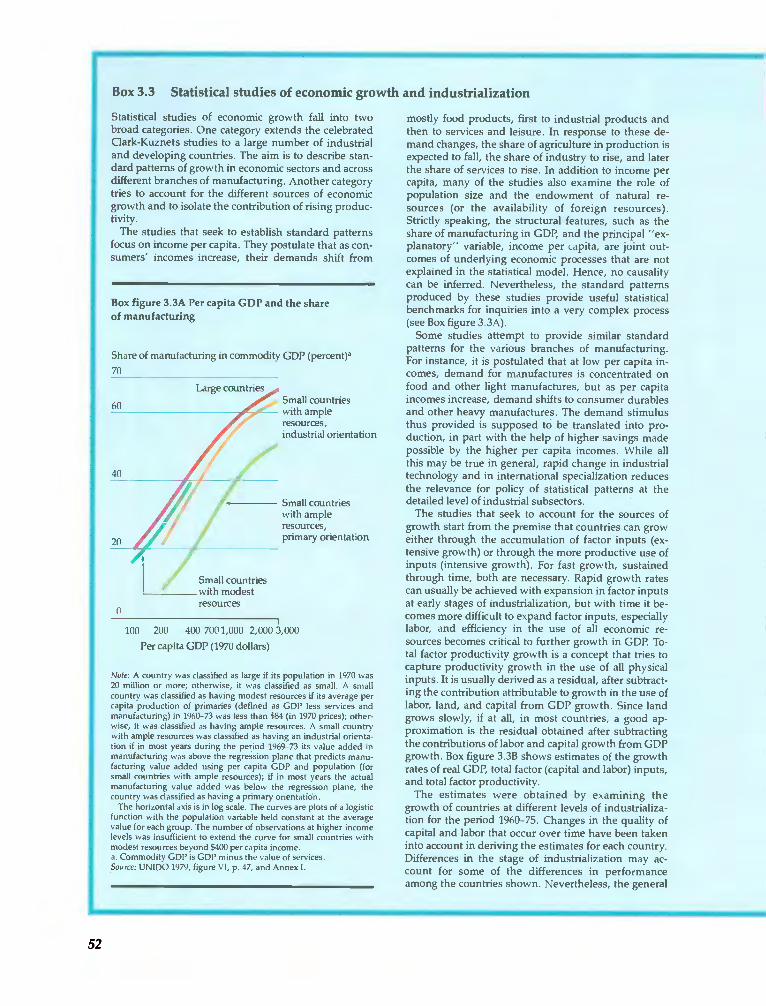
Box figure 3.3A Per capita GDP and the shareof manufacturing
Share of manufacturing in commodity GDP (percent)a70
60
40
20
Large countries
Small countrieswith modestresources
0
100 200 400 7001,000 2,000 3,000
Per capita GDP (1970 dollars)
Note: A country was classified as large if its population in 1970 was20 million or more; otherwise, it was classified as small. A smallcountry was classified as having modest resources if its average percapita production of primaries (defined as GDP less services andmanufacturing) in 1960-73 was less than $84 (in 1970 prices); other-wise, it was classified as having ample resources. A small countrywith ample resources was classified as having an industrial orienta-tion if in most years during the period 1969-73 its value added inmanufacturing was above the regression plane that predicts manu-facturing value added using per capita GDP and population (forsmall countries with ample resources); if in most years the actualmanufacturing value added was below the regression plane, thecountry was classified as having a primary orientation.
The horizontal axis is in log scale. The curves are plots of a logisticfunction with the population variable held constant at the averagevalue for each group. The number of observations at higher incomelevels was insufficient to estend the curve for small countries withmodest resources beyond $400 per capita income.a. Commodity GDP is GDI' minus the value of services.Source: UNIDO 1979, figure VI, p. 47, and Annex I.
Small countrieswith ampleresources,industrial orientation
Small countrieswith ampleresources,primary orientation
mostly food products, first to industrial products andthen to services and leisure. In response to these de-mand changes, the share of agriculture in production isexpected to fall, the share of industry to rise, and laterthe share of services to rise. In addition to income percapita, many of the studies also examine the role ofpopulation size and the endowment of natural re-sources (or the availability of foreign resources).Strictly speaking, the structural features, such as theshare of manufacturing in GDP, and the principal "ex-planatory" variable, income per capita, are joint out-comes of underlying economic processes that are notexplained in the statistical model. Hence, no causalitycan be inferred. Nevertheless, the standard patternsproduced by these studies provide useful statisticalbenchmarks for inquiries into a very complex process(see Box figure 3.3A).
Some studies attempt to provide similar standardpatterns for the various branches of manufacturing.For instance, it is postulated that at low per capita in-comes, demand for manufactures is concentrated onfood and other light manufactures, but as per capitaincomes increase, demand shifts to consumer durablesand other heavy manufactures. The demand stimulusthus provided is supposed to be translated into pro-duction, in part with the help of higher savings madepossible by the higher per capita incomes. While allthis may be true in general, rapid change in industrialtechnology and in international specialization reducesthe relevance for policy of statistical patterns at thedetailed level of industrial subsectors.
The studies that seek to account for the sources ofgrowth start from the premise that countries can groweither through the accumulation of factor inputs (ex-tensive growth) or through the more productive use ofinputs (intensive growth). For fast growth, sustainedthrough time, both are necessary. Rapid growth ratescan usually be achieved with expansion in factor inputsat early stages of industrialization, but with time it be-comes more difficult to expand factor inputs, especiallylabor, and efficiency in the use of all economic re-sources becomes critical to further growth in GDP. To-tal factor productivity growth is a concept that tries tocapture productivity growth in the use of all physicalinputs. It is usually derived as a residual, after subtract-ing the contribution attributable to growth in the use oflabor, land, and capital from GDP growth. Since landgrows slowly, if at all, in most countries, a good ap-proximation is the residual obtained after subtractingthe contributions of labor and capital growth from GDPgrowth. Box figure 3.3B shows estimates of the growthrates of real GDP, total factor (capital and labor) inputs,and total factor productivity.
The estimates were obtained by examining thegrowth of countries at different levels of industrializa-tion for the period 1960-75. Changes in the quality ofcapital and labor that occur over time have been takeninto account in deriving the estimates for each country.Differences in the stage of industrialization may ac-count for some of the differences in performanceamong the countries shown. Nevertheless, the general
52
picture conveyed by the figure is valid. Japan and theRepublic of Korea have achieved high GDP growthrates through higher growth rates in both factor inputsand factor productivity. In contrast, the high GDPgrowth rates of Brazil and Venezuela have been basedmainly on the growth of factor inputs. Furthermore,the figure shows that although factor inputs grew atabout the same rate in Argentina and Colombia, thelatter's real GDP growth was about 2 percent higher
Box figure 3.3B Total factor productivity and real GDP growth in selected countries, 1960-75
Real GDP growth (percent)
12
11
10
9
8
7
6
5
4
3
2
I
0
than Argentina'sthe result of differences in produc-tivity growth.
Like the patterns-of-growth approach, the sources-of-growth approach does not provide explanations;rather it provides a useful way of viewing the outcomeof the complex process of economic growth. Some re-cent studies (Chenery, Robinson, and Syrquin 1986)have attempted to encompass the two methodologieswithin a single framework.
7
6
5
4
3
2
I
0
Note: Real GDP growth is the sum of the contributions from total factor input growth and total factor productivity growth. The closer a point istothe total factor productivity growth axis, the greater the relative contribution of productivity to real GDP growth. As one moves horizontallytoward the total factor input growth axis, the relative contribution of productivity to real GDP growth falls and that of factor inputs rises.Source: Adapted from Chenery, Robinson, and Syrquin 1986, figure 2-2.
53
an international dimension. Several developingcountries (for example, Brazil, Mexico, the Repub-lic of Korea, and Singapore) have been able to sup-ply the relatively labor-scarce industrialized coun-tries with labor-intensive manufactures at lowerprices. Although the industrialized countries havesometimes tried to resist this trend, they have alsoadjusted to it, partly by increasing their exports ofservices such as banking, insurance, engineering,computer software, and marketing.
Structural change within manufacturing
World industrialization initially centered on tex-tiles, later moved to iron, steel, and engineeringproducts based on steel, then to chemicals, electri-cal products, and, finally, to today's electronic andmicroelectronic products. Most of the countriesthat industrialized before World War II followedthis product sequence, at least as far as electricalproducts. Is this pattern of change within the sin-gle sector of manufacturing as inevitable as the oneby which agriculture first gives way to manufactur-ing and then manufacturing itself gives way toservices?
Textiles are preeminent in the early phase of in-dustrialization mainly because clothing is a goodfor which there is growing demand in countrieswith low, but rising, income levels. In addition,most countries have a long history of textile pro-duction by artisans. Moreover, until quite recently,textiles technologies have been simple and stable.All in all, then, it was natural for most countries tobegin industrializing by producing textiles (Box3.2). The same factors also explain the early im-portance of leather goods, food processing, furni-ture, ceramics, building materials, and householdutensils.
By the time most of today's developing countriesstarted to industrialize (in the postwar period), thechoice of products and processes in manufacturingwas much wider and the world much more inte-grated. Countries could choose not to follow theproduct sequence that had occurred in the prewarperiod. For example, it was possible to create anengineering industry without producing iron andsteel and to produce chemicals without refiningpetroleum. Nonetheless, some developing coun-tries, emulating the previous generation of indus-trializers, built steel mills, refineries, factories pro-ducing consumer durables, and other heavy (or"late") industries. Some of these enterprises sur-vive only with the aid of high protective barriers.
As the industrialized countries moved from tex-
54
tiles to heavier industries, they had to rely on big-ger plants to reap economies of scale. This too ischanging. It is now profitable to produce steel inmills with a capacity of around half a million tons;in the old integrated steel mills, plants of less than2 million tons were inefficient. In the microelec-tronics industry, efficient plants can be muchsmaller than in the older branches of manufac-turing.
Lessons from industrialization experiencesbefore World War II
What are the lessons to be drawn from the experi-ences of countries which have followed a success-ful path to industrialization? This section examinesfive of the most important issues: the initialconditionscountry size, population size, and re-source endowment; policies toward domestic andforeign trade; education; transportation and com-munications infrastructure; and the institutionaland macroeconomic background.
Initial conditions
A country with a large domestic market is in abetter position to establish industrial plants thattake advantage of economies of scale. Since dis-tance between countries in many cases confers nat-ural protection to domestic firms, everything elsebeing equal, a country with a larger domestic mar-ket can begin industrializing earlier than one witha smaller domestic market. A large geographicalsize and a large population can, together, producea large domestic market, unless agricultural pro-ductivity is exceptionally low. Hence, a large coun-try with a large population can industrialize earlier.But this has not always been the case.
Although the United Kingdom is a small coun-try, its growing agricultural productivity in theearly 1700s supported an increasing populationand provided an expanded domestic market thathelped spur the Industrial Revolution. Japan, asmall country with a relatively large population,went through a similar process. Switzerland hasindustrialized successfully despite its smallness insize and population. By contrast, Australia and Ar-gentina are both large countries. In the late nine-teenth and early twentieth centuries, their popula-tions were expanding. In 1895, the per capitaincome of Argentina was as high as that of Ger-many, Holland, and Belgium; Australia's washigher, exceeding that of the United States. Yetneither country industrialized in the nineteenth
century, and neither is among today's major in-dustrial countries.
A rich endowment of natural resources may pro-vide a country with the financial means to importforeign technology and with the high incomes tosupport a large domestic market for industrialproducts. But several of the countries that becamerich from natural resources were slow to industri-alize. In the sixteenth century, Spain was the rich-est country in Europe, thanks mainly to the min-eral resources of South America. But Spain did notinitiate the Industrial Revolution, and the greatsurge in industrialization in eighteenth- andnineteenth-century Europe largely passed it by.
Domestic and foreign trade policies
Many of the countries that industrialized success-fully in the nineteenth century first acquired tech-nology through imports, then rapidly moved toproducing manufactures for export. Policies thatallowed opportunities on foreign markets to becommunicated to domestic producers, that al-lowed domestic resources to move freely in re-sponse to the opportunities, and that comple-mented existing resources through education,training, and infrastructure all contributed to thesuccess.
Unrestricted domestic trade was a precursor ofBritain's industrial revolution. Many other Euro-pean countries and Japan began their industrializa-tion with reforms that liberalized their domestictrade. Foreign trade policies, however, were incon-sistent. Episodes of free tradesuch as those in theUnited Kingdom after 1846, in France during the1860s, in Germany in the 1830s and 1860s, and inthe United States during the 1840s and 1850swere mixed with periods of restrictions on trade.The aims of foreign trade policy varied widely, too.In some cases foreign trade restrictions arose froma desire to protect domestic industry. Examples in-clude British restrictions on machinery exports un-til 1842 and tariff increases in Germany in the 1840sand in the United States after the Civil War. Atother times, import restrictions were prompted bythe desire to protect agriculture. This was the moti-vation behind Britain's Corn Laws, the increases inGerman and French tariffs in the 1870s, and theSmoot-Hawley tariffs in the United States in 1930.In Germany, France, and the United States, how-ever, the tariffs were also extended to cover manu-factured imports. In other cases, import restric-tions were adopted with the balance of paymentsin mind.
It is unclear how these shifts of foreign tradepolicyliberal followed by protectionist, and viceversashaped industrialization before World WarII. Domestic markets were generally competitive,so inefficiencies arising from protectionism mayhave been reduced, particularly in countries withlarge internal markets such as Germany and theUnited States. What is clear is that imports werethe main channel of new technology in the initialstages of industrialization in each country exceptthe United Kingdom. Furthermore, exports pro-vided a powerful demand stimulus; the countrieswhose exports grew rapidly achieved the fastestoverall economic growth.
Education, skills formation, and technology adaptation
The transition from a primarily agricultural andtrading economy to an industrial economy has re-quired, at least in the initial stages, an increase inthe skills of the labor force. To use foreign technol-ogy effectively, producers must examine thechoices available, make intelligent selections, andadapt them to local conditions (see Box 3.4). All ofthis calls for education.
More than general education is required, buthigh achievements at the frontiers of science arenot. Science played a minor role in the first indus-trial revolution in Britain. Scientific excellenceplayed an important role in Germany's rise to in-dustrial prominence in the nineteenth century, butits system of polytechnical institutes, which taughtbasic industrial skills, probably mattered more.The United States and Japan both rose to worldindustrial leadership by copying and modifyingforeign technologies. (Until the early 1900s theUnited States trailed behind the United Kingdom,France, and Germany in major scientific discov-eries, but not in practical innovations and inven-tions.)
State support for technical education made sig-nificant contributions to French and German in-dustrialization. The United States broadly emu-lated the German system of technical education. Inaddition, its government established a system offinancial support for research in universities. Pri-vate industry also maintained research laboratoriesthat sometimes received public support. Althoughsome of these laboratories conducted original re-search, one of their main tasks has been to spotinnovations elsewhere and provide the expertisethat makes rapid imitation possible. Japan has alsoshown a strong and continuing commitment to ed-ucation. By 1870 it had achieved a literacy rate that
55
Box 3.4 Technology acquisition and adaptation: the experiences of Japanand the United States
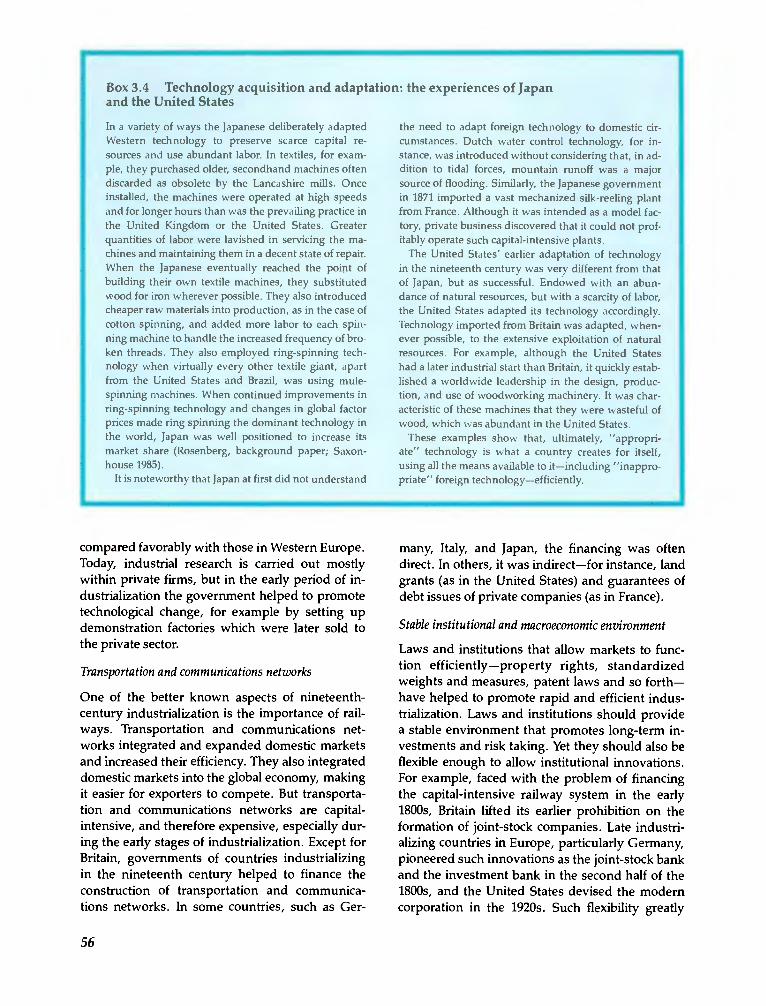
In a variety of ways the Japanese deliberately adaptedWestern technology to preserve scarce capital re-sources and use abundant labor. In textiles, for exam-ple, they purchased older, secondhand machines oftendiscarded as obsolete by the Lancashire mills. Onceinstalled, the machines were operated at high speedsand for longer hours than was the prevailing practice inthe United Kingdom or the United States. Greaterquantities of labor were lavished in servicing the ma-chines and maintaining them in a decent state of repair.When the Japanese eventually reached the point ofbuilding their own textile machines, they substitutedwood for iron wherever possible. They also introducedcheaper raw materials into production, as in the case ofcotton spinning, and added more labor to each spin-fling machine to handle the increased frequency of bro-ken threads. They also employed ring-spinning tech-nology when virtually every other textile giant, apartfrom the United States and Brazil, was using mule-spinning machines. When continued improvements inring-spinning technology and changes in global factorprices made ring spinning the dominant technology inthe world, Japan was well positioned to increase itsmarket share (Rosenberg, background paper; Saxon-house 1985).
It is noteworthy that Japan at first did not understand
the need to adapt foreign technology to domestic cir-cumstances. Dutch water control technology, for in-stance, was introduced without considering that, in ad-dition to tidal forces, mountain runoff was a majorsource of flooding. Similarly, the Japanese governmentin 1871 imported a vast mechanized silk-reeling plantfrom France. Although it was intended as a model fac-tory, private business discovered that it could not prof-itably operate such capital-intensive plants.
The United States' earlier adaptation of technologyin the nineteenth century was very different from thatof Japan, but as successful. Endowed with an abun-dance of natural resources, but with a scarcity of labor,the United States adapted its technology accordingly.Technology imported from Britain was adapted, when-ever possible, to the extensive exploitation of naturalresources. For example, although the United Stateshad a later industrial start than Britain, it quickly estab-lished a worldwide leadership in the design, produc-tion, and use of woodworking machinery. It was char-acteristic of these machines that they were wasteful ofwood, which was abundant in the United States.
These examples show that, ultimately, "appropri-ate" technology is what a country creates for itself,using all the means available to itincluding "inappro-priate" foreign technologyefficiently.
compared favorably with those in Western Europe.Today, industrial research is carried out mostlywithin private firms, but in the early period of in-dustrialization the government helped to promotetechnological change, for example by setting updemonstration factories which were later sold tothe private sector.
Transportation and communications networks
One of the better known aspects of nineteenth-century industrialization is the importance of rail-ways. Transportation and communications net-works integrated and expanded domestic marketsand increased their efficiency. They also integrateddomestic markets into the global economy, makingit easier for exporters to compete. But transporta-tion and communications networks are capital-intensive, and therefore expensive, especially dur-ing the early stages of industrialization. Except forBritain, governments of countries industrializingin the nineteenth century helped to finance theconstruction of transportation and communica-tions networks. In some countries, such as Ger-
56
many, Italy, and Japan, the financing was oftendirect. In others, it was indirectfor instance, landgrants (as in the United States) and guarantees ofdebt issues of private companies (as in France).
Stable institutional and macroeconomic environment
Laws and institutions that allow markets to func-tion efficientlyproperty rights, standardizedweights and measures, patent laws and so forthhave helped to promote rapid and efficient indus-trialization. Laws and institutions should providea stable environment that promotes long-term in-vestments and risk taking. Yet they should also beflexible enough to allow institutional innovations.For example, faced with the problem of financingthe capital-intensive railway system in the early1800s, Britain lifted its earlier prohibition on theformation of joint-stock companies. Late industri-alizing countries in Europe, particularly Germany,pioneered such innovations as the joint-stock bankand the investment bank in the second half of the1800s, and the United States devised the moderncorporation in the 1920s. Such flexibility greatly
assisted industrialization.Industrialization requires large investments in
machines and infrastructure, especially in its earlystages. Moreover, one of the most importantmeans by which technological innovations havebeen incorporated in production has been invest-ment in new machines. Macroeconomic policies inthe countries industrializing in the nineteenth cen-tury encouraged domestic savings and thus pro-vided the funds required for investment. They alsomade foreigners, especially the British and theFrench, willing to provide loans and direct invest-ments.
Conclusion
Initial conditions of size, population, and naturalresources may influence the timing and pattern of
early industrialization, but further progress alongthe path is greatly influenced by government pol-icy. Provision of infrastructure and education hasbeen important. A stable institutional and macro-economic environment and domestic and foreigntrade policies which allowed producers and factorsof production to respond to incentives have beencrucial. Much has changed since World War II, butthe essence of industrialization is as it was before:the interaction of technological change, specializa-tion, and trade. Some of the policies that provedsuccessful in the years before World War II maynot be applicable today. But the key to success isstifi to choose policies that allow economies to uti-lize this interaction fully to their advantage. Thechapters that follow discuss what this means fortoday's developing countries.