Deutsche Bank Markets Research Asia Hong Kong Energy Oil & Gas Industry Oil & Gas Demand - China Date 3 July 2013 Periodical No pick up in sight The data is important - so we publish it: ________________________________________________________________________________________________________________ Deutsche Bank AG/Hong Kong Deutsche Bank does and seeks to do business with companies covered in its research reports. Thus, investors should be aware that the firm may have a conflict of interest that could affect the objectivity of this report. Investors should consider this report as only a single factor in making their investment decision. DISCLOSURES AND ANALYST CERTIFICATIONS ARE LOCATED IN APPENDIX 1. MICA(P) 054/04/2013. David Hurd, CFA Research Analyst (+852) 2203 6242 [email protected]Top picks Sinopec (0386.HK),HKD5.33 Buy Reliance Industries (RELI.BO),INR871.30 Buy ONGC (ONGC.BO),INR322.30 Buy Companies Featured Sinopec (0386.HK),HKD5.33 Buy 2012A 2013E 2014E P/E (x) 6.4 6.9 6.4 EV/EBITDA (x) 4.0 3.6 3.6 Price/book (x) 0.9 0.9 0.8 ONGC (ONGC.BO),INR322.30 Buy 2012A 2013E 2014E P/E (x) 8.3 11.4 9.7 EV/EBITDA (x) 3.6 4.4 3.9 Price/book (x) 1.7 1.9 1.7 Reliance Industries (RELI.BO),INR871.30 Buy 2012A 2013E 2014E P/E (x) 13.9 13.6 12.0 EV/EBITDA (x) 9.5 10.3 9.3 Price/book (x) 1.5 1.6 1.4 We source our data from China's National Bureau of Statistics. We make no adjustments to the data. China's apparent oil demand grew by 4.8% in 2012 to 9.25 mm b/d. Demand growth was slower than our initial 5.8% estimate as GDP growth of 7.7% was slower than DB's initial (1Q12) 8.2% estimate. China’s LT oil demand growth to GDP growth ratio is between 0.68 - 0.73x (Figure 27). DB China economist Jun Ma recently lowered his 2013e GDP to 7.9% from 8.2%. This sort of GDP growth rate (7.9%) would imply China oil demand of 5.3 to 5.7%. We have lowered our China oil growth demand forecast for 2013 to 5.3% from an initial 2013 estimate of 5.9%. No growth in sight China’s apparent demand for crude (Figure 4) fell -0.5% year-on-year Jan-May 2013. Looking at monthly Y/y numbers (Figure 5) there is not even a glimmer of a pending pick-up in China’s crude oil demand. Oddly enough, China’s apparent demand for oil products (Figure 4) grew 5.4% Y/y Jan–May 2013. Negative demand growth of crude oil; positive demand growth of oil products – crude inventories must be making up the difference. Is the government drawing off its SPR? It will be interesting to watch how long this pattern can persist. Oil import growth (Figure 10) fell -2% Y/y Jan-May 2013. Average oil import growth over the past 5-years has been +10.76% pa and negative oil import growth has not been seen since 2001. Domestic production of natural gas (Figure 17) has fallen -3.5% Y/y Jan-May 2013 vs. an average domestic production growth rate of 10.2% pa 2008-2012. Demand for natural gas in China (Figure 17) is running low single digits (4.6% Y/y Jan-May 2013) vs. an average 17.5% pa since 2008. We suspect however that China’s demand for natural gas could be turning a corner as Y/y monthly growth numbers (Figure 18) rose 17.1% and 12.1% in April and May respectively. The only redeeming factors of growth in the China oil and gas complex seem to be a 1% Y/y growth rate in domestic oil production Jan-May 2013 and 21% Y/y growth rate in China’s fuel oil demand Jan-May 2013. The Fuel Oil demand growth is puzzling as shipping in Asia is flat on its back while thermal power demand (Figure 26) is up a miserly 5.9% Y/y Jan-May. Where is the fuel oil demand coming from? PetroChina’s perfect storm - China’s natural gas numbers (Figures 16-18): We are showing negative domestic natural gas production growth (-3.5%) yet growing natural gas imports via pipelines (+31%) and LNG imports (+29.9%). PetroChina’s domestic natural gas production is profitable; its imports of piped gas and LNG lose money on every molecule imported. It’s a perfect storm: less profitable domestic production more loss making imports. Expensive gas imports are all under take-or-pay contracts. Slowing domestic natural gas demand can only be offset by slower domestic production growth as import volumes are set in stone.
Deutsche Bank does and seeks to do business with companies covered in its research reports. Thus, investors should be aware that the firm may have a conflict of interest that could affect the objectivity of this report. Investors should consider this report as only a single factor in making their investment decision. DISCLOSURES AND ANALYST CERTIFICATIONS ARE LOCATED IN APPENDIX 1. MICA(P) 054/04/2013.
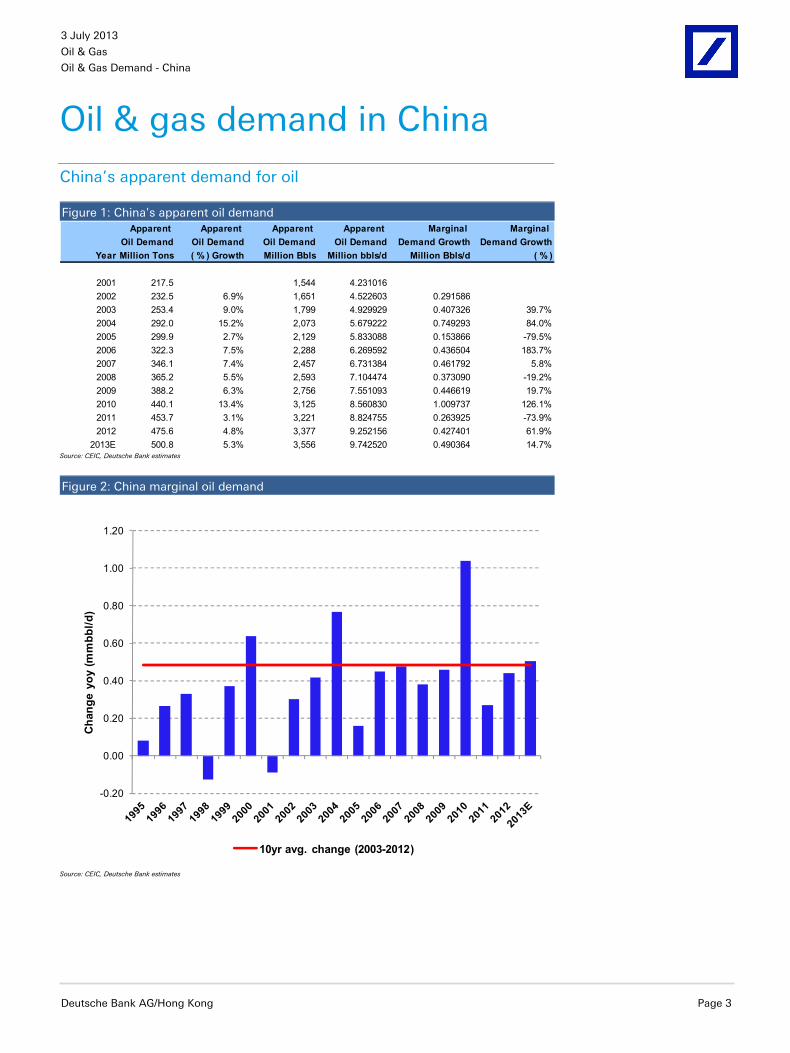
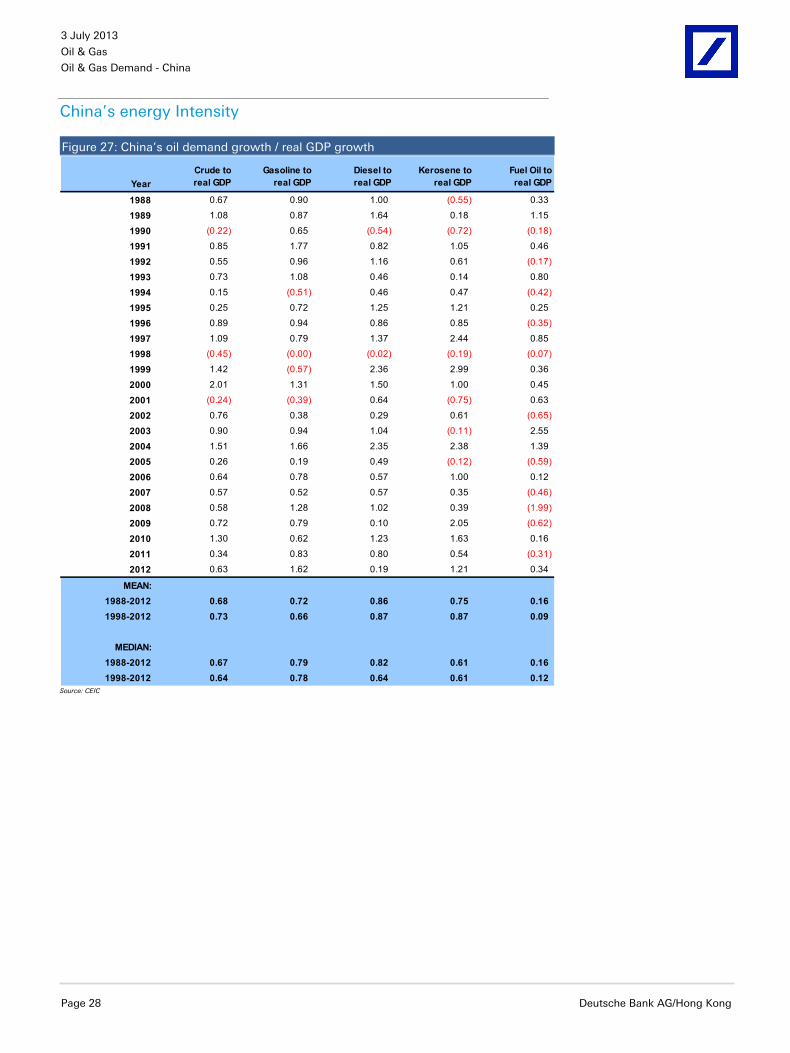
We source our data from China's National Bureau of Statistics. We make noadjustments to the data. China's apparent oil demand grew by 4.8% in 2012 to9.25 mm b/d. Demand growth was slower than our initial 5.8% estimate asGDP growth of 7.7% was slower than DB's initial (1Q12) 8.2% estimate.China’s LT oil demand growth to GDP growth ratio is between 0.68 - 0.73x(Figure 27). DB China economist Jun Ma recently lowered his 2013e GDP to7.9% from 8.2%. This sort of GDP growth rate (7.9%) would imply China oildemand of 5.3 to 5.7%. We have lowered our China oil growth demandforecast for 2013 to 5.3% from an initial 2013 estimate of 5.9%.
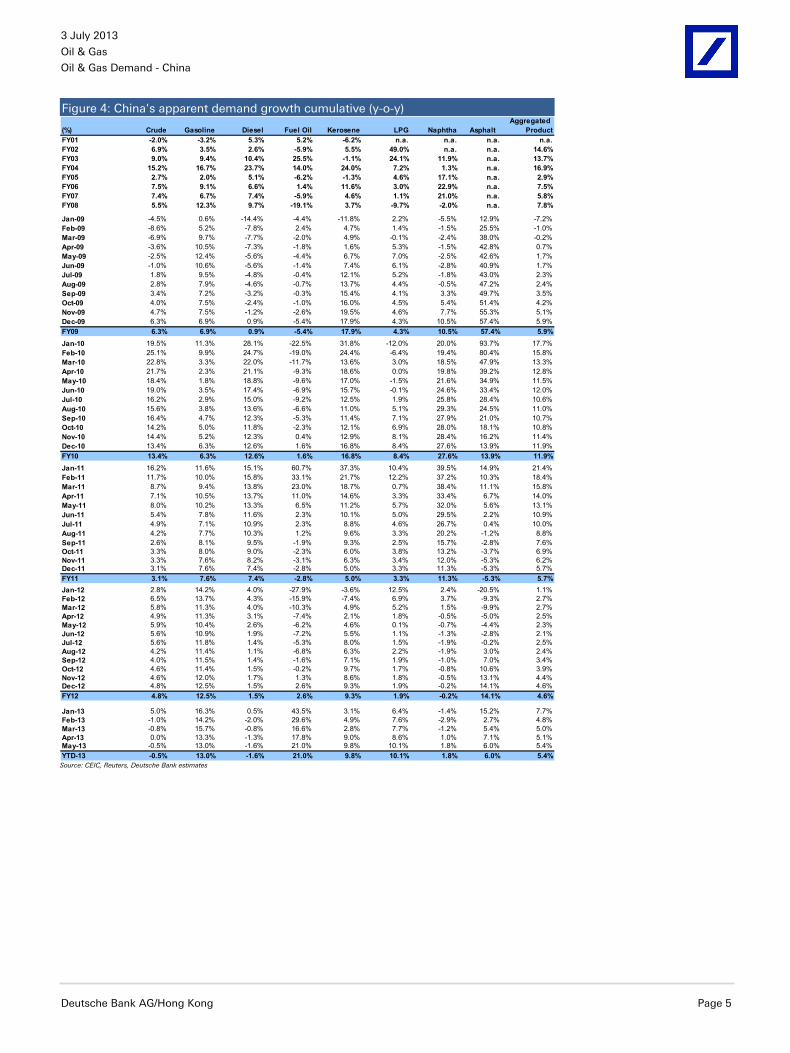
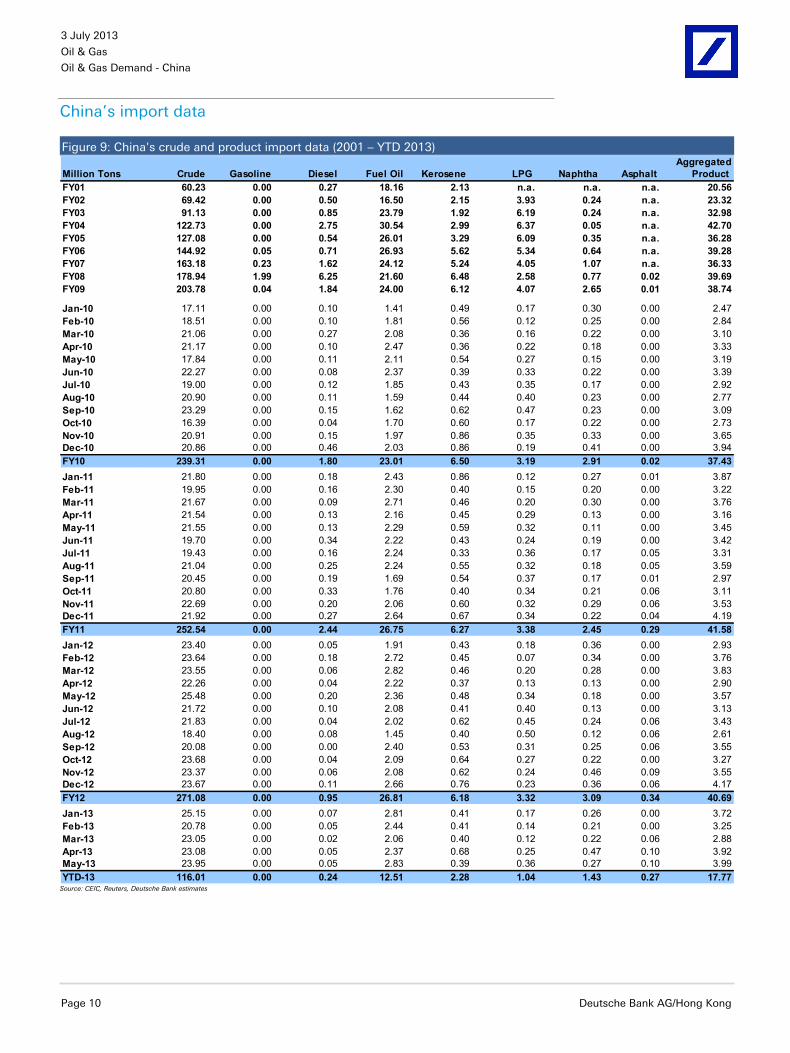
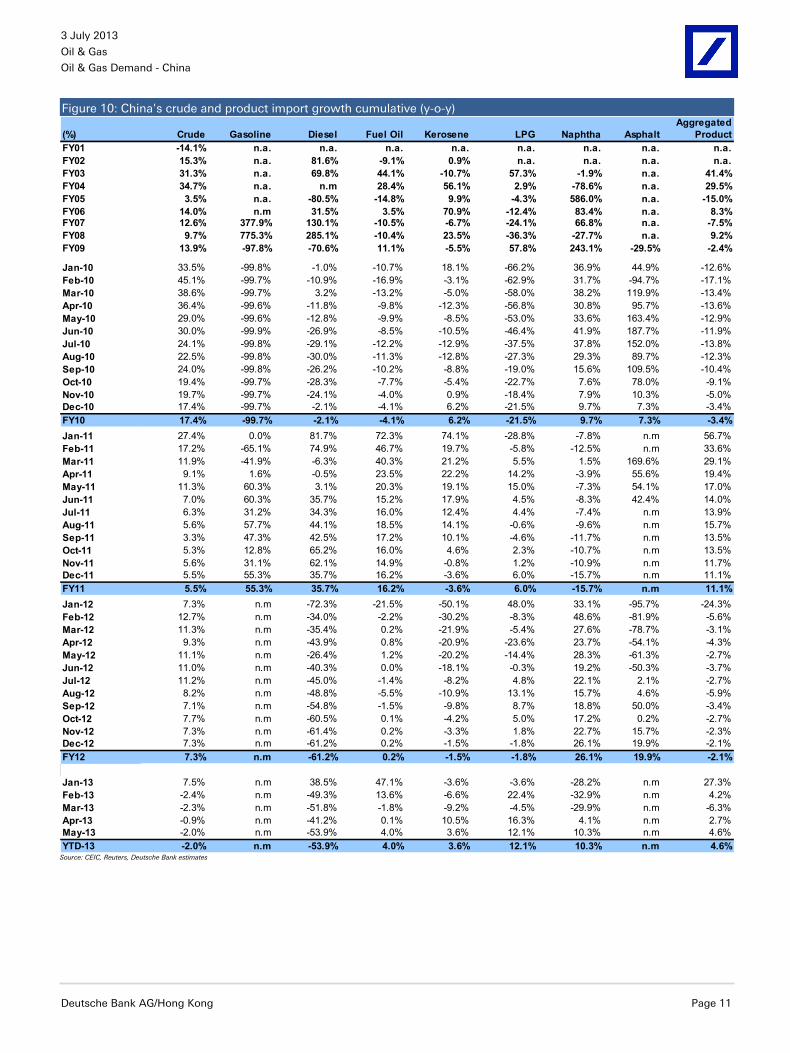
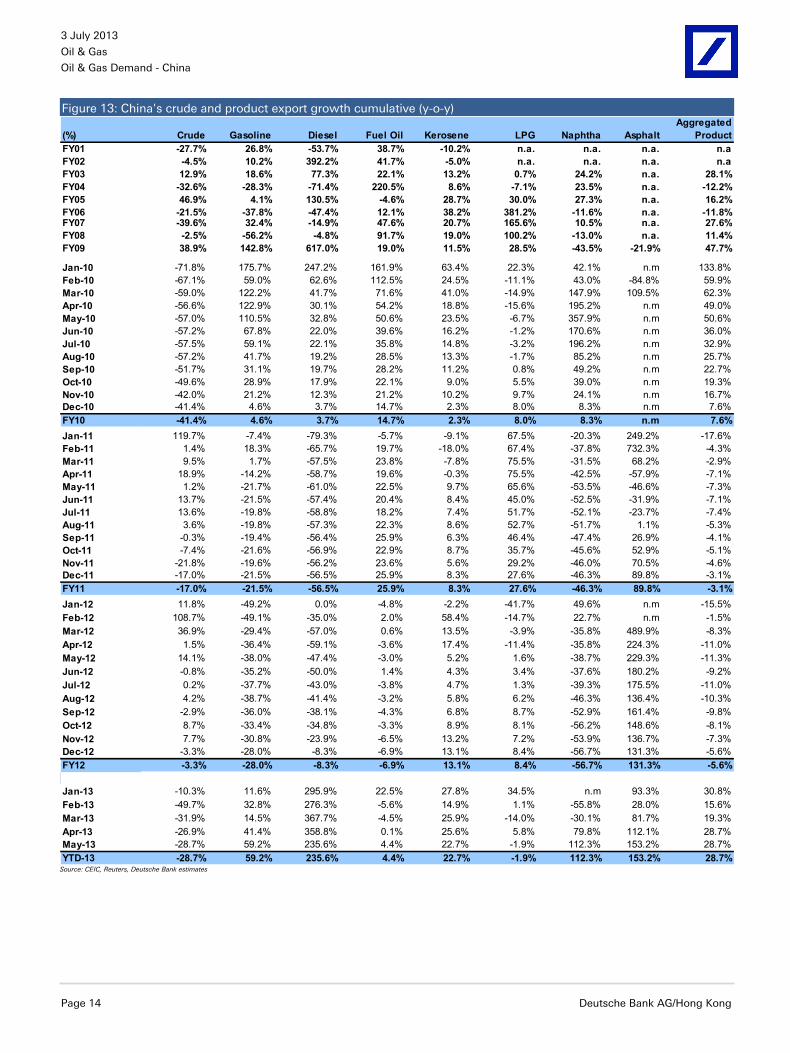
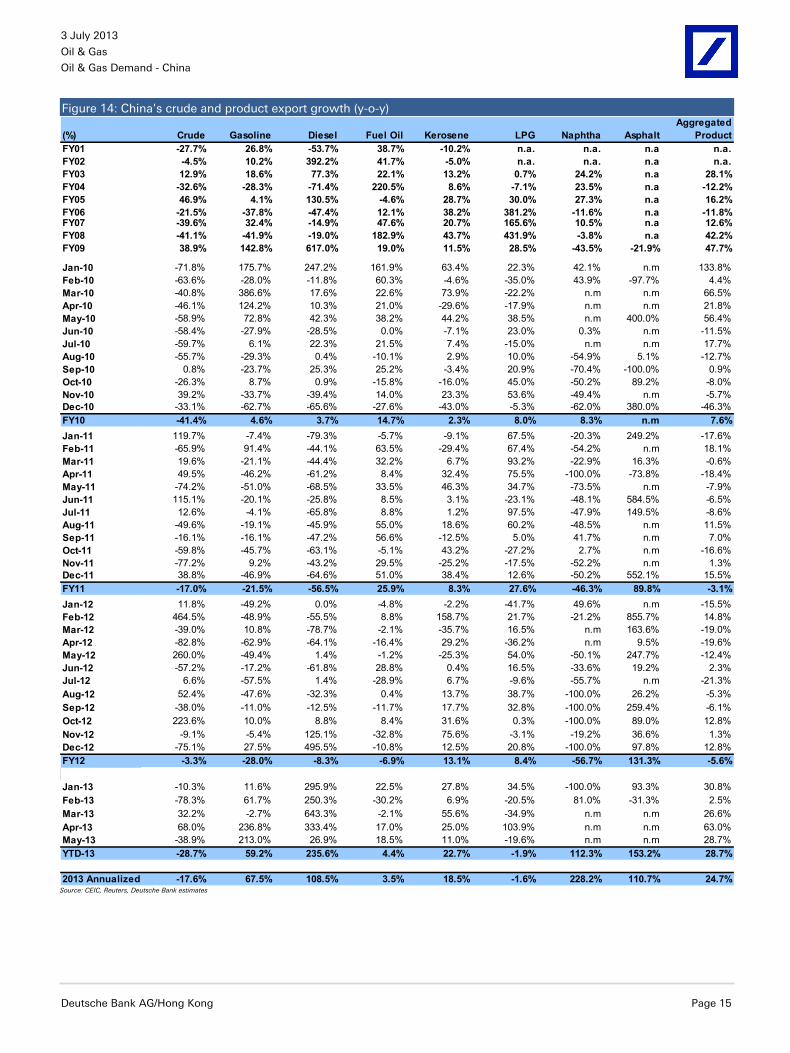
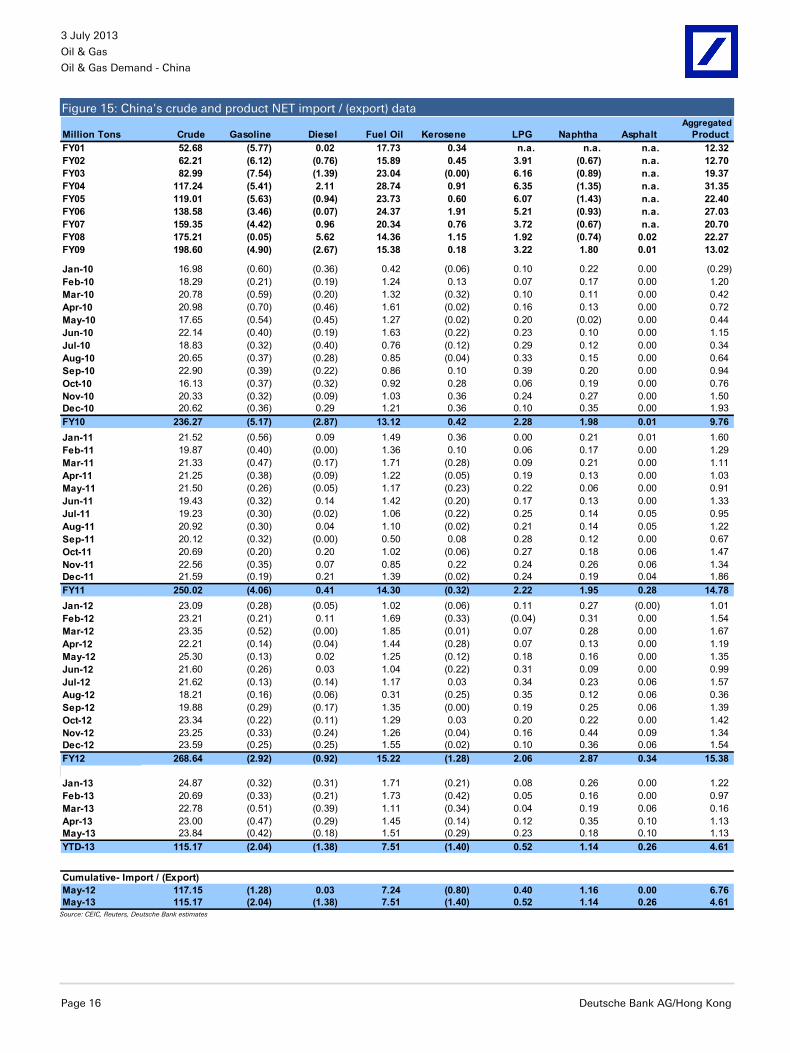
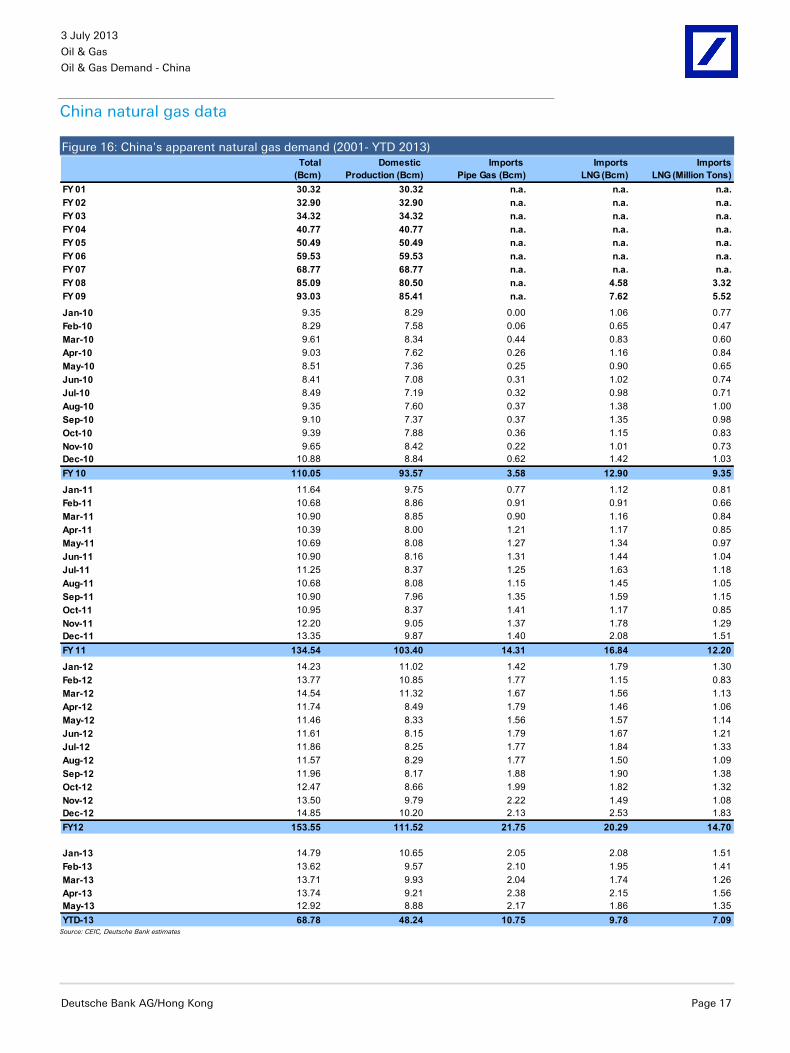
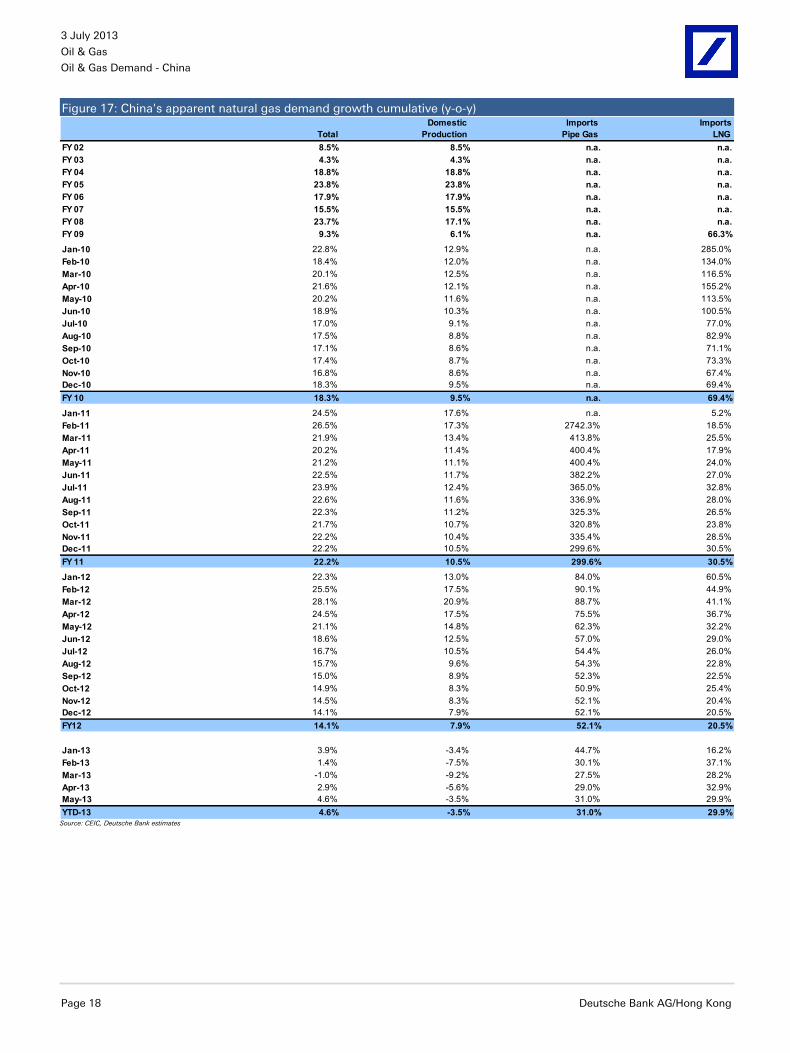
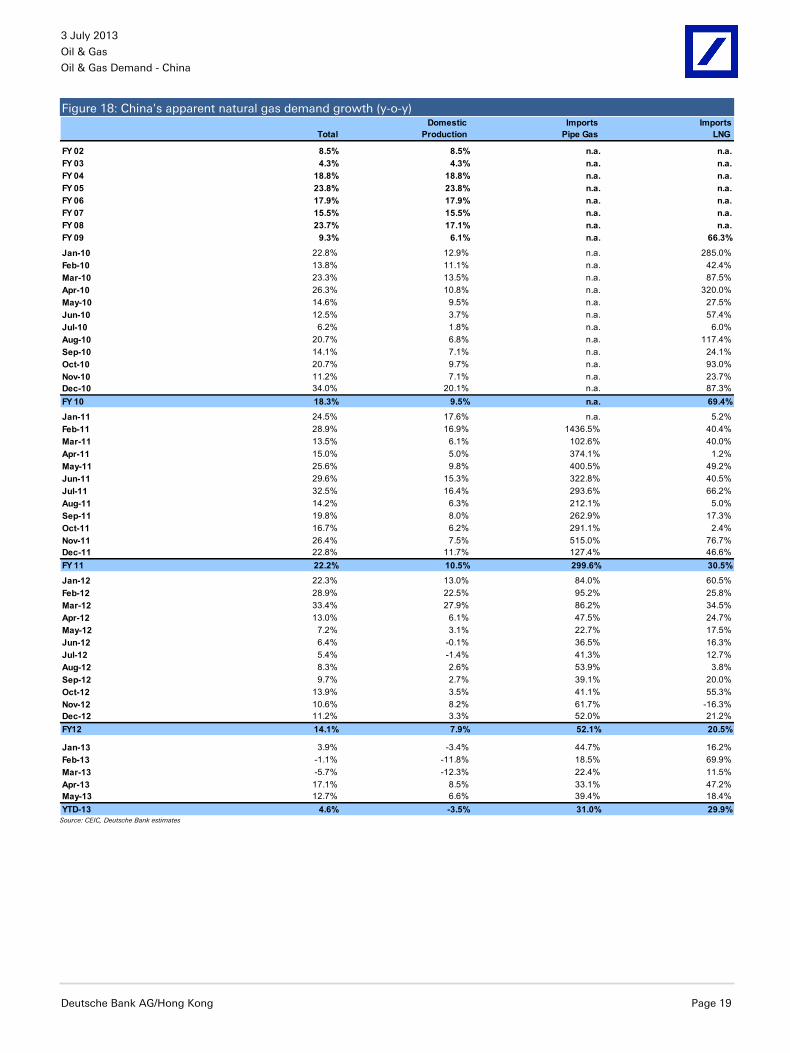
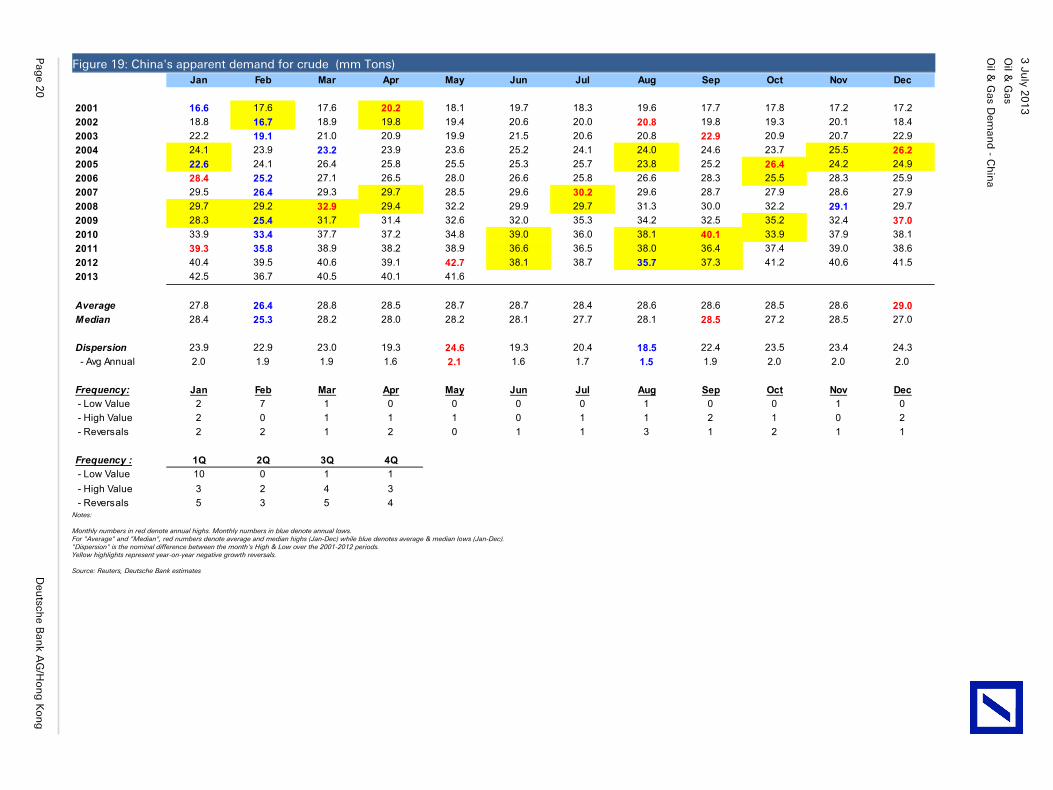
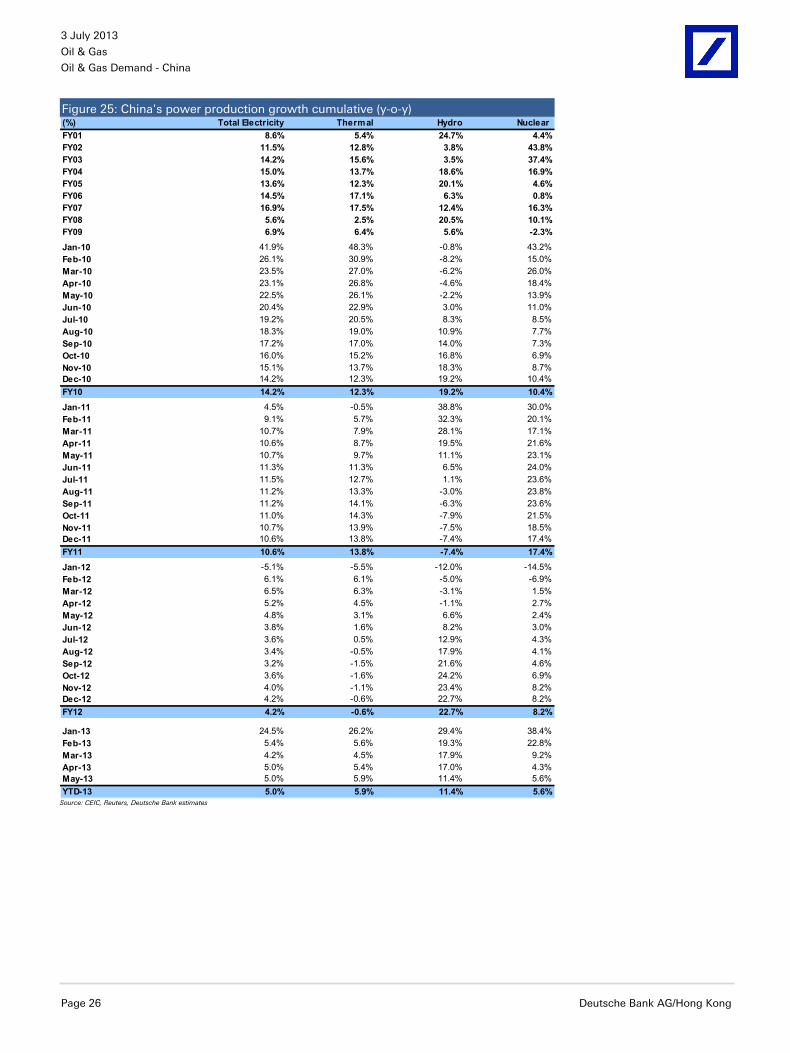
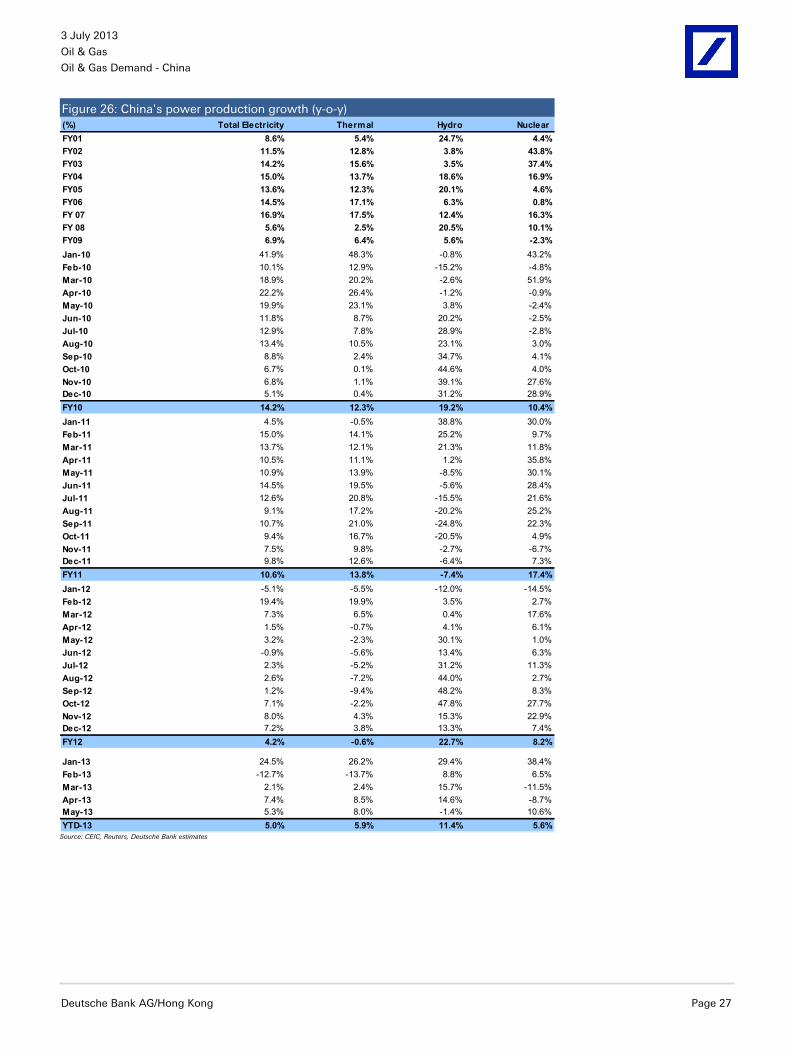
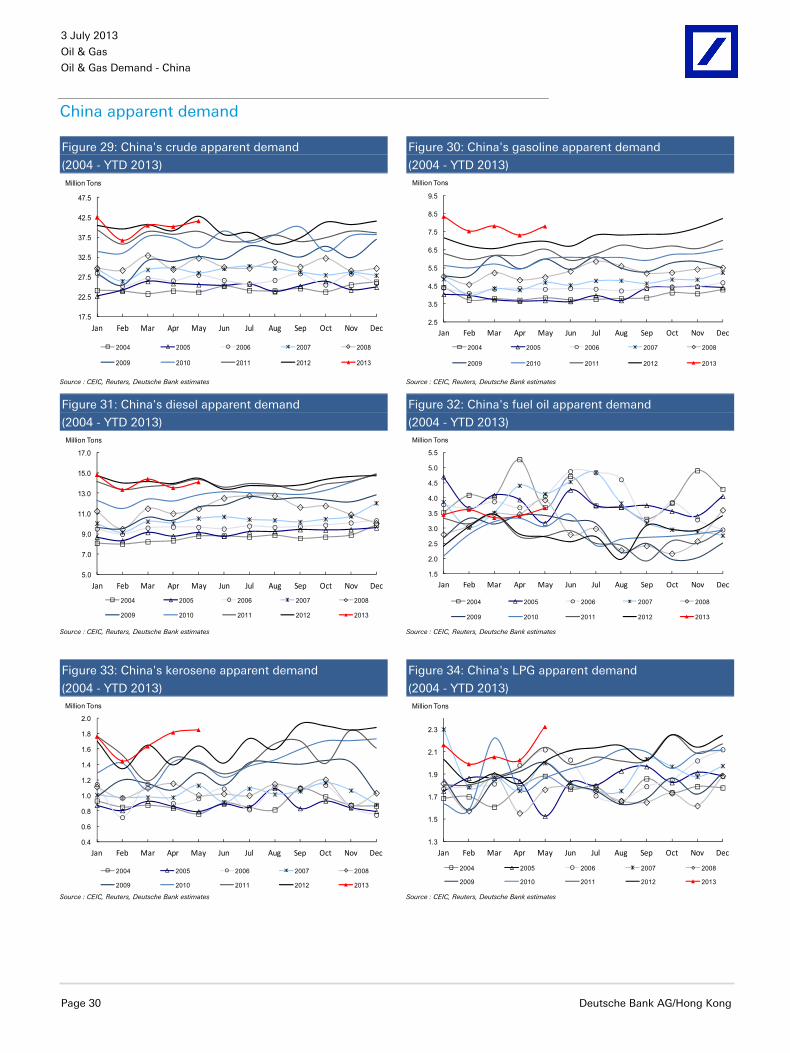
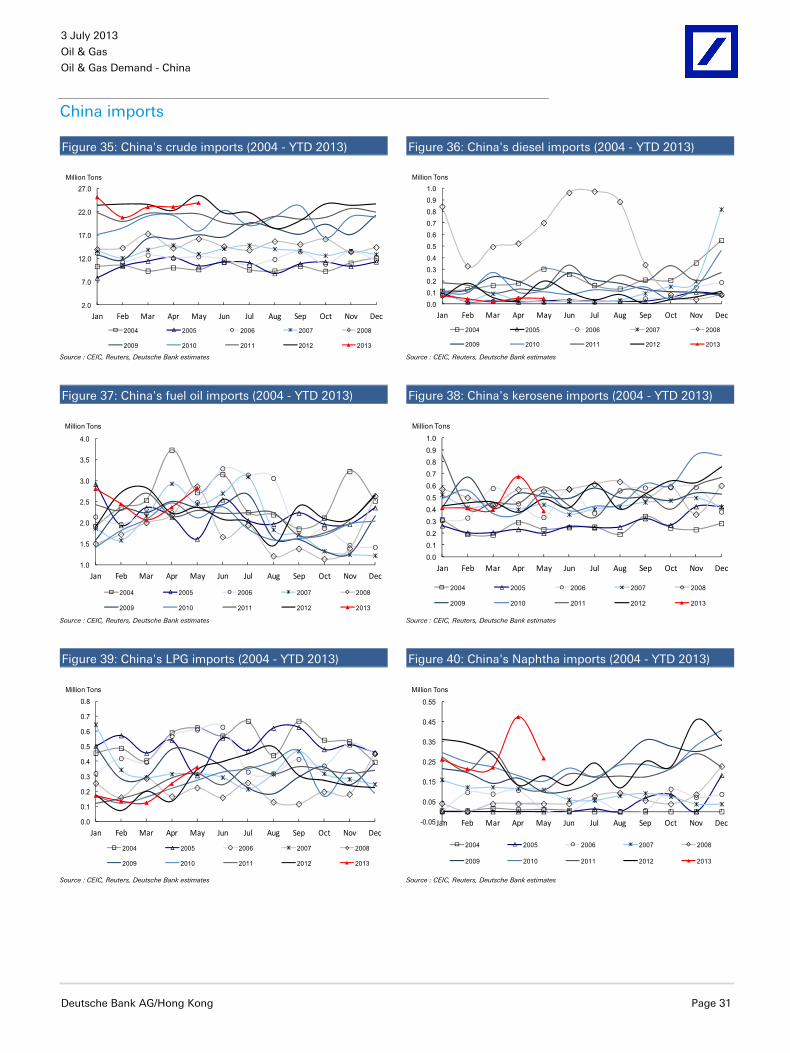
No growth in sight China’s apparent demand for crude (Figure 4) fell -0.5% year-on-year Jan-May 2013. Looking at monthly Y/y numbers (Figure 5) there is not even a glimmer of a pending pick-up in China’s crude oil demand. Oddly enough, China’s apparent demand for oil products (Figure 4) grew 5.4% Y/y Jan–May 2013. Negative demand growth of crude oil; positive demand growth of oil products – crude inventories must be making up the difference. Is the government drawing off its SPR? It will be interesting to watch how long this pattern can persist. Oil import growth (Figure 10) fell -2% Y/y Jan-May 2013. Average oil import growth over the past 5-years has been +10.76% pa and negative oil import growth has not been seen since 2001. Domestic production of natural gas (Figure 17) has fallen -3.5% Y/y Jan-May 2013 vs. an average domestic production growth rate of 10.2% pa 2008-2012. Demand for natural gas in China (Figure 17) is running low single digits (4.6% Y/y Jan-May 2013) vs. an average 17.5% pa since 2008. We suspect however that China’s demand for natural gas could be turning a corner as Y/y monthly growth numbers (Figure 18) rose 17.1% and 12.1% in April and May respectively. The only redeeming factors of growth in the China oil and gas complex seem to be a 1% Y/y growth rate in domestic oil production Jan-May 2013 and 21% Y/y growth rate in China’s fuel oil demand Jan-May 2013. The Fuel Oil demand growth is puzzling as shipping in Asia is flat on its back while thermal power demand (Figure 26) is up a miserly 5.9% Y/y Jan-May. Where is the fuel oil demand coming from?
PetroChina’s perfect storm - China’s natural gas numbers (Figures 16-18): We are showing negative domestic natural gas production growth (-3.5%) yet growing natural gas imports via pipelines (+31%) and LNG imports (+29.9%). PetroChina’s domestic natural gas production is profitable; its imports of piped gas and LNG lose money on every molecule imported. It’s a perfect storm: less profitable domestic production more loss making imports. Expensive gas imports are all under take-or-pay contracts. Slowing domestic natural gas demand can only be offset by slower domestic production growth as import volumes are set in stone.
3 July 2013
Oil & Gas
Oil & Gas Demand - China
Page 2 Deutsche Bank AG/Hong Kong
Table Of Contents Page
Oil & gas demand in China ............................................................. 3 China’s apparent demand for oil ........................................................................................ 3 China oil and product production ....................................................................................... 7 China’s import data .......................................................................................................... 10 China export data ............................................................................................................. 13 China natural gas data ...................................................................................................... 17 China’s electricity data ..................................................................................................... 25 China’s energy Intensity ................................................................................................... 28 China apparent demand ................................................................................................... 30 China imports ................................................................................................................... 31 China exports .................................................................................................................... 32 China exports, power production ..................................................................................... 33
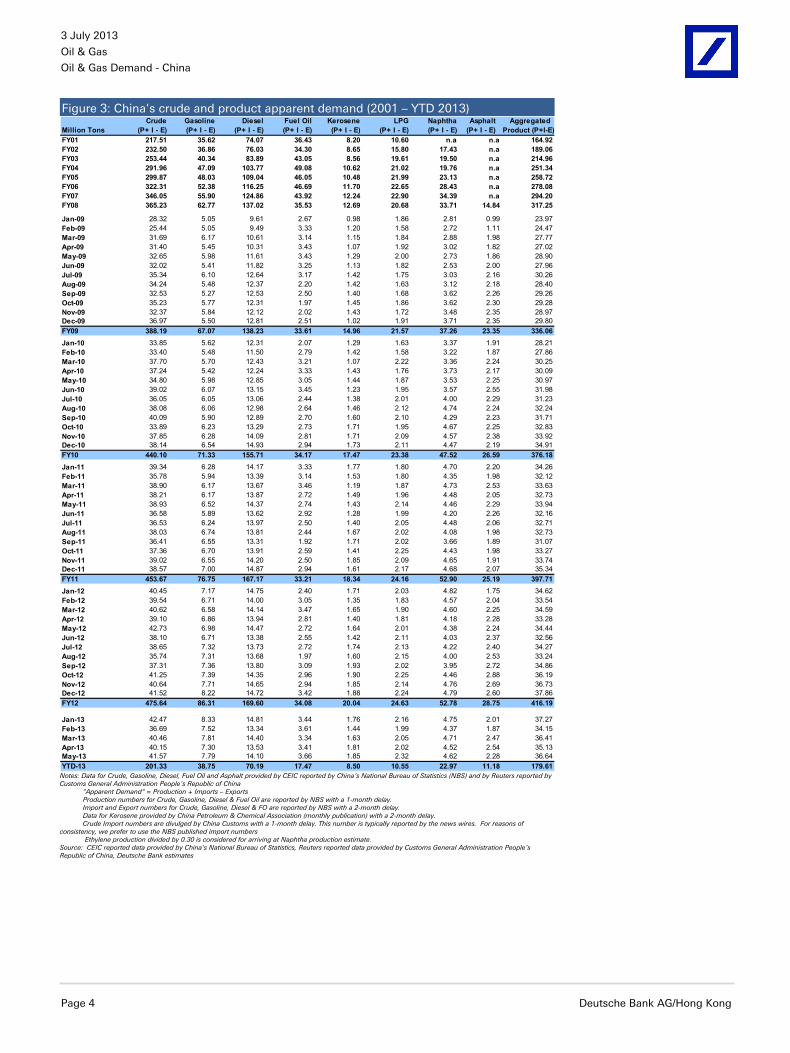
Notes: Data for Crude, Gasoline, Diesel, Fuel Oil and Asphalt provided by CEIC reported by China’s National Bureau of Statistics (NBS) and by Reuters reported by Customs General Administration People’s Republic of China "Apparent Demand" = Production + Imports – Exports Production numbers for Crude, Gasoline, Diesel & Fuel Oil are reported by NBS with a 1-month delay. Import and Export numbers for Crude, Gasoline, Diesel & FO are reported by NBS with a 2-month delay. Data for Kerosene provided by China Petroleum & Chemical Association (monthly publication) with a 2-month delay. Crude Import numbers are divulged by China Customs with a 1-month delay. This number is typically reported by the news wires. For reasons of consistency, we prefer to use the NBS published import numbers Ethylene production divided by 0.30 is considered for arriving at Naphtha production estimate. Source: CEIC reported data provided by China's National Bureau of Statistics, Reuters reported data provided by Customs General Administration People’s Republic of China, Deutsche Bank estimates
Frequency: Jan Feb Mar Apr May Jun Jul Aug Sep Oct Nov Dec - Low Value 2 7 1 0 0 0 0 1 0 0 1 0 - High Value 2 0 1 1 1 0 1 1 2 1 0 2 - Reversals 2 2 1 2 0 1 1 3 1 2 1 1
Frequency : 1Q 2Q 3Q 4Q - Low Value 10 0 1 1 - High Value 3 2 4 3 - Reversals 5 3 5 4
Notes: Monthly numbers in red denote annual highs. Monthly numbers in blue denote annual lows. For "Average" and "Median", red numbers denote average and median highs (Jan-Dec) while blue denotes average & median lows (Jan-Dec). "Dispersion" is the nominal difference between the month's High & Low over the 2001-2012 periods. Yellow highlights represent year-on-year negative growth reversals. Source: Reuters, Deutsche Bank estimates
Oil &
Gas D
eman
d - C
hin
a
Oil &
Gas
3 Ju
ly 2013
Deu
tsche B
ank A
G/H
on
g K
on
g
Pag
e 21
Figure 20: China's apparent demand for crude
Average Annual Average Peak TroughAnnual Median High - Low Trough Peak Trough Demand Demand Demand
Notes: "Adj MEAN" does not include outliers in red. Sources: IMF - GDP in constant prices from "World Economic & Financial Surveys", BP Statistical Review - Oil Consumption
3 July 2013
Oil & Gas
Oil & Gas Demand - China
Page 30 Deutsche Bank AG/Hong Kong
China apparent demand
Figure 29: China's crude apparent demand
(2004 - YTD 2013)
Figure 30: China's gasoline apparent demand
(2004 - YTD 2013)
17.5
22.5
27.5
32.5
37.5
42.5
47.5
Jan Feb Mar Apr May Jun Jul Aug Sep Oct Nov Dec
Million Tons
2004 2005 2006 2007 2008
2009 2010 2011 2012 2013
2.5
3.5
4.5
5.5
6.5
7.5
8.5
9.5
Jan Feb Mar Apr May Jun Jul Aug Sep Oct Nov Dec
Million Tons
2004 2005 2006 2007 2008
2009 2010 2011 2012 2013
Source : CEIC, Reuters, Deutsche Bank estimates Source : CEIC, Reuters, Deutsche Bank estimates
Figure 31: China's diesel apparent demand
(2004 - YTD 2013)
Figure 32: China's fuel oil apparent demand
(2004 - YTD 2013)
5.0
7.0
9.0
11.0
13.0
15.0
17.0
Jan Feb Mar Apr May Jun Jul Aug Sep Oct Nov Dec
Million Tons
2004 2005 2006 2007 2008
2009 2010 2011 2012 2013
1.5
2.0
2.5
3.0
3.5
4.0
4.5
5.0
5.5
Jan Feb Mar Apr May Jun Jul Aug Sep Oct Nov Dec
Million Tons
2004 2005 2006 2007 2008
2009 2010 2011 2012 2013
Source : CEIC, Reuters, Deutsche Bank estimates Source : CEIC, Reuters, Deutsche Bank estimates
Figure 33: China's kerosene apparent demand
(2004 - YTD 2013)
Figure 34: China's LPG apparent demand
(2004 - YTD 2013)
0.4
0.6
0.8
1.0
1.2
1.4
1.6
1.8
2.0
Jan Feb Mar Apr May Jun Jul Aug Sep Oct Nov Dec
Million Tons
2004 2005 2006 2007 2008
2009 2010 2011 2012 2013
1.3
1.5
1.7
1.9
2.1
2.3
Jan Feb Mar Apr May Jun Jul Aug Sep Oct Nov Dec
Million Tons
2004 2005 2006 2007 2008
2009 2010 2011 2012 2013
Source : CEIC, Reuters, Deutsche Bank estimates Source : CEIC, Reuters, Deutsche Bank estimates
Source : CEIC, Reuters, Deutsche Bank estimates Source : CEIC, Reuters, Deutsche Bank estimates
3 July 2013
Oil & Gas
Oil & Gas Demand - China
Deutsche Bank AG/Hong Kong Page 33
China exports, power production
Figure 47: China's naphtha exports (2004 - YTD 2013) Figure 48: China's power production (2004 - YTD 2013)
-0.1
0.0
0.1
0.1
0.2
0.2
0.3
0.3
0.4
Jan Feb Mar Apr May Jun Jul Aug Sep Oct Nov Dec
Million Tons
2004 2005 2006 2007 2008
2009 2010 2011 2012 2013
`
75.0
125.0
175.0
225.0
275.0
325.0
375.0
425.0
Jan Feb Mar Apr May Jun Jul Aug Sep Oct Nov Dec
Million Tons
2004 2005 2006 2007 2008
2009 2010 2011 2012 2013
Source : CEIC, Reuters, Deutsche Bank estimates Source : CEIC, Reuters, Deutsche Bank estimates
3 July 2013
Oil & Gas
Oil & Gas Demand - China
Page 34 Deutsche Bank AG/Hong Kong
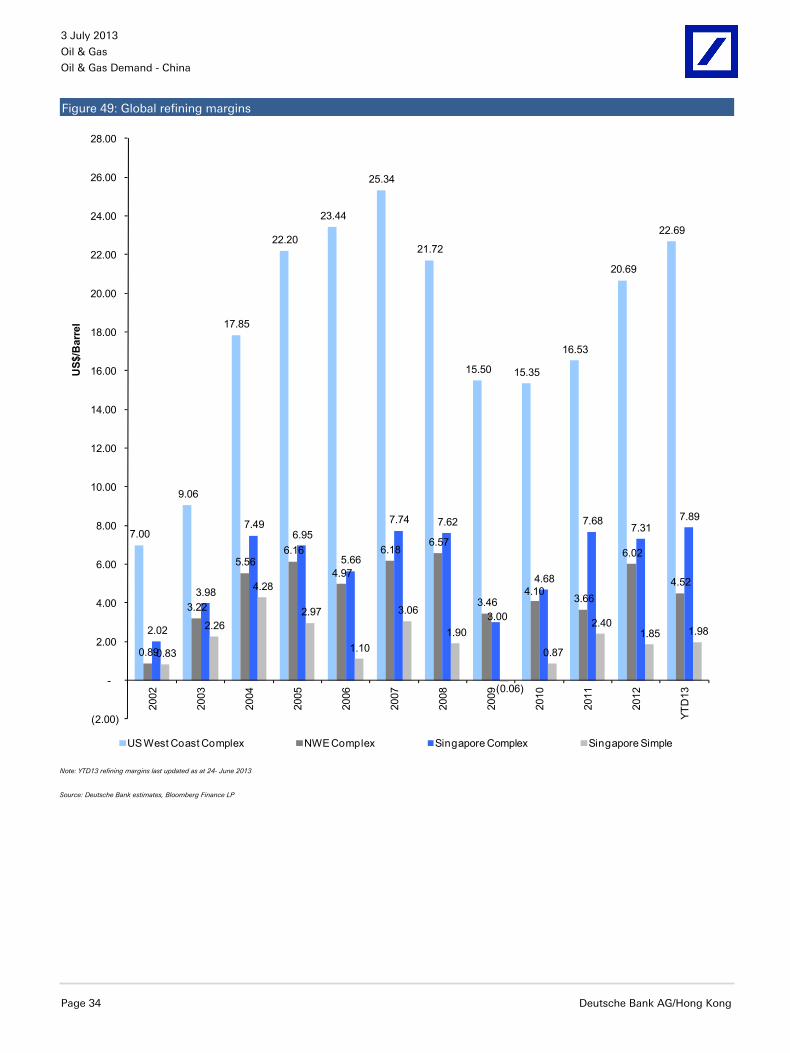
Figure 49: Global refining margins
7.00
9.06
17.85
22.20
23.44
25.34
21.72
15.50 15.35
16.53
20.69
22.69
0.89
3.22
5.56 6.16
4.97
6.18 6.57
3.46 4.10
3.66
6.02
4.52
2.02
3.98
7.49 6.95
5.66
7.74 7.62
3.00
4.68
7.68 7.31
7.89
0.83
2.26
4.28
2.97
1.10
3.06
1.90
(0.06)
0.87
2.40 1.85 1.98
(2.00)
-
2.00
4.00
6.00
8.00
10.00
12.00
14.00
16.00
18.00
20.00
22.00
24.00
26.00
28.00 20
02
2003
2004
2005
2006
2007
2008
2009
2010
2011
2012
YTD
13
US$
/Bar
rel
US West Coast Complex NWE Complex Singapore Complex Singapore Simple
Note: YTD13 refining margins last updated as at 24- June 2013
Source: Deutsche Bank estimates, Bloomberg Finance LP
3 July 2013
Oil & Gas
Oil & Gas Demand - China
Deutsche Bank AG/Hong Kong Page 35
The author of this report wishes to acknowledge the contribution made by Dilini Gunawardane, employee of Amba Research Lanka Private Ltd, a third-party provider to Deutsche Bank of offshore research support services.
3 July 2013
Oil & Gas
Oil & Gas Demand - China
Page 36 Deutsche Bank AG/Hong Kong
Appendix 1
Important Disclosures Additional information available upon request
China Oilfield Services 2883.HK 14.78 (HKD) 2 Jul 13 1 *Prices are sourced from local exchanges via Reuters, Bloomberg and other vendors. Data is sourced from Deutsche Bank and subject companies
Important Disclosures Required by U.S. Regulators
Disclosures marked with an asterisk may also be required by at least one jurisdiction in addition to the United States. See Important Disclosures Required by Non-US Regulators and Explanatory Notes.
1. Within the past year, Deutsche Bank and/or its affiliate(s) has managed or co-managed a public or private offering for this company, for which it received fees.
7. Deutsche Bank and/or its affiliate(s) has received compensation from this company for the provision of investment banking or financial advisory services within the past year.
8. Deutsche Bank and/or its affiliate(s) expects to receive, or intends to seek, compensation for investment banking services from this company in the next three months.
14. Deutsche Bank and/or its affiliate(s) has received non-investment banking related compensation from this company within the past year.
Important Disclosures Required by Non-U.S. Regulators
Please also refer to disclosures in the Important Disclosures Required by US Regulators and the Explanatory Notes.
1. Within the past year, Deutsche Bank and/or its affiliate(s) has managed or co-managed a public or private offering for this company, for which it received fees.
7. Deutsche Bank and/or its affiliate(s) has received compensation from this company for the provision of investment banking or financial advisory services within the past year.
17. Deutsche Bank and or/its affiliate(s) has a significant Non-Equity financial interest (this can include Bonds, Convertible Bonds, Credit Derivatives and Traded Loans) where the aggregate net exposure to the following issuer(s), or issuer(s) group, is more than 25m Euros.
Special Disclosures
11. Deutsche Bank AG and/or an affiliate(s) acted as a Financial Advisor to PetroChina Company Limited on the acquisition of the entire share capital of Singapore Petroleum Company.
For disclosures pertaining to recommendations or estimates made on securities other than the primary subject of this research, please see the most recently published company report or visit our global disclosure look-up page on our website at http://gm.db.com/ger/disclosure/DisclosureDirectory.eqsr
3 July 2013
Oil & Gas
Oil & Gas Demand - China
Deutsche Bank AG/Hong Kong Page 37
Analyst Certification
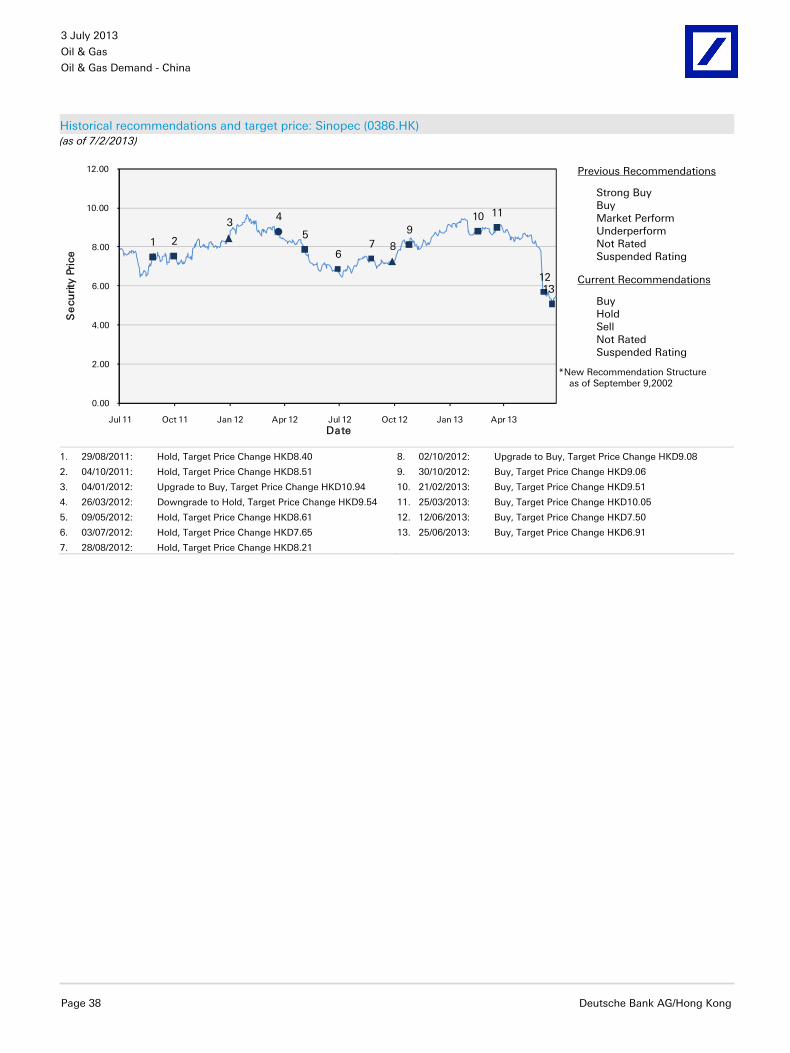
The views expressed in this report accurately reflect the personal views of the undersigned lead analyst about the subject issuers and the securities of those issuers. In addition, the undersigned lead analyst has not and will not receiveany compensation for providing a specific recommendation or view in this report. David Hurd Historical recommendations and target price: PetroChina (0857.HK) (as of 7/2/2013)
12
3 4 5 6 78
9 10 11
12
0.00
2.00
4.00
6.00
8.00
10.00
12.00
14.00
Jul 11 Oct 11 Jan 12 Apr 12 Jul 12 Oct 12 Jan 13 Apr 13
Se
curit
y Pr
ice
Date
Previous Recommendations
Strong Buy Buy Market Perform Underperform Not Rated Suspended Rating
Current Recommendations
Buy Hold Sell Not Rated Suspended Rating
*New Recommendation Structure as of September 9,2002
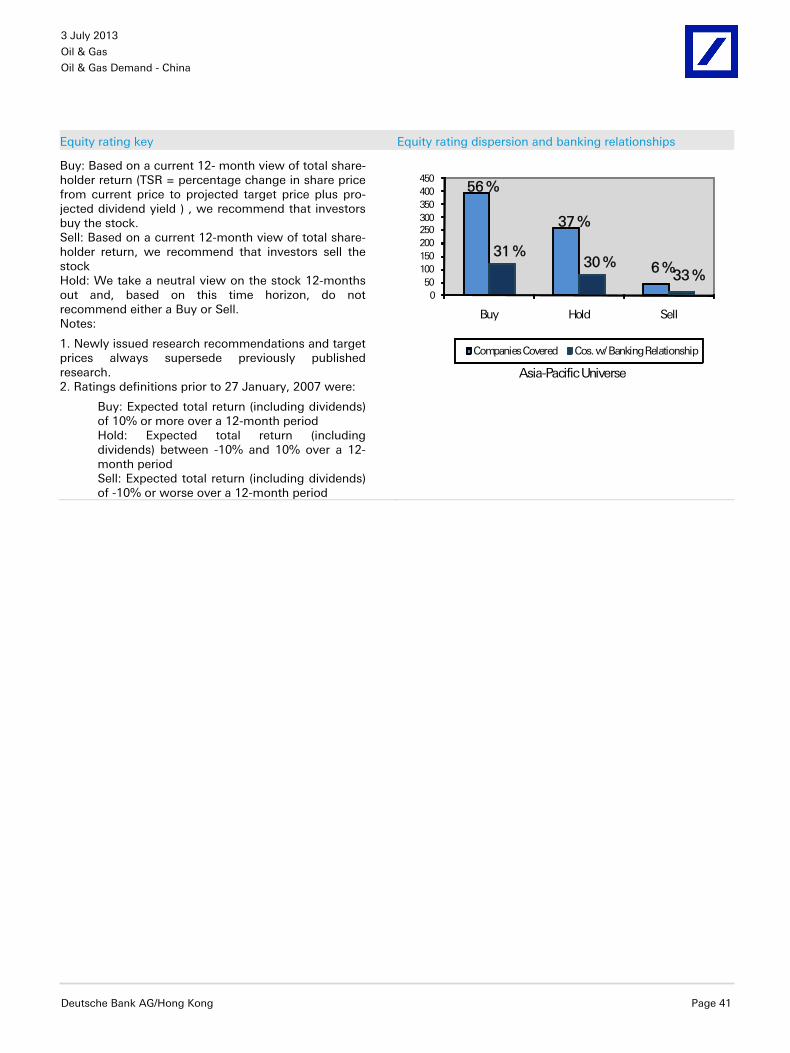
Equity rating key Equity rating dispersion and banking relationships
Buy: Based on a current 12- month view of total share-holder return (TSR = percentage change in share pricefrom current price to projected target price plus pro-jected dividend yield ) , we recommend that investorsbuy the stock. Sell: Based on a current 12-month view of total share-holder return, we recommend that investors sell thestock Hold: We take a neutral view on the stock 12-monthsout and, based on this time horizon, do notrecommend either a Buy or Sell. Notes:
1. Newly issued research recommendations and targetprices always supersede previously publishedresearch. 2. Ratings definitions prior to 27 January, 2007 were:
Buy: Expected total return (including dividends)of 10% or more over a 12-month period Hold: Expected total return (includingdividends) between -10% and 10% over a 12-month period Sell: Expected total return (including dividends)of -10% or worse over a 12-month period
56 %
37 %
6 %31 %
30 %33 %
050
100150200250300350400450
Buy Hold Sell
Asia-Pacific Universe
Companies Covered Cos. w/ Banking Relationship
3 July 2013
Oil & Gas
Oil & Gas Demand - China
Page 42 Deutsche Bank AG/Hong Kong
Regulatory Disclosures
1. Important Additional Conflict Disclosures
Aside from within this report, important conflict disclosures can also be found at https://gm.db.com/equities under the "Disclosures Lookup" and "Legal" tabs. Investors are strongly encouraged to review this information before investing.
2. Short-Term Trade Ideas
Deutsche Bank equity research analysts sometimes have shorter-term trade ideas (known as SOLAR ideas) that are consistent or inconsistent with Deutsche Bank's existing longer term ratings. These trade ideas can be found at the SOLAR link at http://gm.db.com.
3. Country-Specific Disclosures
Australia and New Zealand: This research, and any access to it, is intended only for "wholesale clients" within the meaning of the Australian Corporations Act and New Zealand Financial Advisors Act respectively. Brazil: The views expressed above accurately reflect personal views of the authors about the subject company(ies) and its(their) securities, including in relation to Deutsche Bank. The compensation of the equity research analyst(s) is indirectly affected by revenues deriving from the business and financial transactions of Deutsche Bank. In cases where at least one Brazil based analyst (identified by a phone number starting with +55 country code) has taken part in the preparation of this research report, the Brazil based analyst whose name appears first assumes primary responsibility for its content from a Brazilian regulatory perspective and for its compliance with CVM Instruction # 483. EU countries: Disclosures relating to our obligations under MiFiD can be found at http://www.globalmarkets.db.com/riskdisclosures. Japan: Disclosures under the Financial Instruments and Exchange Law: Company name - Deutsche Securities Inc. Registration number - Registered as a financial instruments dealer by the Head of the Kanto Local Finance Bureau (Kinsho) No. 117. Member of associations: JSDA, Type II Financial Instruments Firms Association, The Financial Futures Association of Japan, Japan Investment Advisers Association. Commissions and risks involved in stock transactions - for stock transactions, we charge stock commissions and consumption tax by multiplying the transaction amount by the commission rate agreed with each customer. Stock transactions can lead to losses as a result of share price fluctuations and other factors. Transactions in foreign stocks can lead to additional losses stemming from foreign exchange fluctuations. "Moody's", "Standard & Poor's", and "Fitch" mentioned in this report are not registered credit rating agencies in Japan unless “Japan” or "Nippon" is specifically designated in the name of the entity. Reports on Japanese listed companies not written by analysts of Deutsche Securities Inc. (DSI) are written by Deutsche Bank Group’s analysts with the coverage companies specified by DSI. Russia: This information, interpretation and opinions submitted herein are not in the context of, and do not constitute, any appraisal or evaluation activity requiring a license in the Russian Federation.
GRCM2013PROD029688
David Folkerts-Landau Global Head of Research
Marcel Cassard
Global Head CB&S Research
Ralf Hoffmann & Bernhard Speyer Co-Heads
DB Research
Guy Ashton Chief Operating Officer
Research
Richard Smith Associate Director Equity Research
Asia-Pacific
Fergus Lynch Regional Head
Germany Andreas Neubauer
Regional Head
North America Steve Pollard
Regional Head
International locations
Deutsche Bank AG Deutsche Bank Place Level 16 Corner of Hunter & Phillip Streets Sydney, NSW 2000 Australia Tel: (61) 2 8258 1234
Deutsche Bank AG Große Gallusstraße 10-14 60272 Frankfurt am Main Germany Tel: (49) 69 910 00
Deutsche Bank AG Filiale Hongkong International Commerce Centre, 1 Austin Road West,Kowloon, Hong Kong Tel: (852) 2203 8888
Deutsche Securities Inc. 2-11-1 Nagatacho Sanno Park Tower Chiyoda-ku, Tokyo 100-6171 Japan Tel: (81) 3 5156 6770
Deutsche Bank AG London 1 Great Winchester Street London EC2N 2EQ United Kingdom Tel: (44) 20 7545 8000
Deutsche Bank Securities Inc. 60 Wall Street New York, NY 10005 United States of America Tel: (1) 212 250 2500
Global Disclaimer The information and opinions in this report were prepared by Deutsche Bank AG or one of its affiliates (collectively "Deutsche Bank"). The information herein is believed to be reliable and has been obtained from public sources believed to be reliable. Deutsche Bank makes no representation as to the accuracy or completeness of such information.
Deutsche Bank may engage in securities transactions, on a proprietary basis or otherwise, in a manner inconsistent with the view taken in this research report. In addition, others within Deutsche Bank, including strategists and sales staff, may take a view that is inconsistent with that taken in this research report.
Opinions, estimates and projections in this report constitute the current judgement of the author as of the date of this report. They do not necessarily reflect the opinions of Deutsche Bank and are subject to change without notice. Deutsche Bank has no obligation to update, modify or amend this report or to otherwise notify a recipient thereof in the event that any opinion, forecast or estimate set forth herein, changes or subsequently becomes inaccurate. Prices and availability of financial instruments are subject to change without notice. This report is provided for informational purposes only. It is not an offer or a solicitation of an offer to buy or sell any financial instruments or to participate in any particular trading strategy. Target prices are inherently imprecise and a product of the analyst judgement.
As a result of Deutsche Bank’s March 2010 acquisition of BHF-Bank AG, a security may be covered by more than one analyst within the Deutsche Bank group. Each of these analysts may use differing methodologies to value the security; as a result, the recommendations may differ and the price targets and estimates of each may vary widely.
In August 2009, Deutsche Bank instituted a new policy whereby analysts may choose not to set or maintain a target price of certain issuers under coverage with a Hold rating. In particular, this will typically occur for "Hold" rated stocks having a market cap smaller than most other companies in its sector or region. We believe that such policy will allow us to make best use of our resources. Please visit our website at http://gm.db.com to determine the target price of any stock.
The financial instruments discussed in this report may not be suitable for all investors and investors must make their own informed investment decisions. Stock transactions can lead to losses as a result of price fluctuations and other factors. If a financial instrument is denominated in a currency other than an investor's currency, a change in exchange rates may adversely affect the investment. Past performance is not necessarily indicative of future results. Deutsche Bank may with respect to securities covered by this report, sell to or buy from customers on a principal basis, and consider this report in deciding to trade on a proprietary basis.
Unless governing law provides otherwise, all transactions should be executed through the Deutsche Bank entity in the investor's home jurisdiction. In the U.S. this report is approved and/or distributed by Deutsche Bank Securities Inc., a member of the NYSE, the NASD, NFA and SIPC. In Germany this report is approved and/or communicated by Deutsche Bank AG Frankfurt authorized by the BaFin. In the United Kingdom this report is approved and/or communicated by Deutsche Bank AG London, a member of the London Stock Exchange and regulated by the Financial Services Authority for the conduct of investment business in the UK and authorized by the BaFin. This report is distributed in Hong Kong by Deutsche Bank AG, Hong Kong Branch, in Korea by Deutsche Securities Korea Co. This report is distributed in Singapore by Deutsche Bank AG, Singapore Branch or Deutsche Securities Asia Limited, Singapore Branch, and recipients in Singapore of this report are to contact Deutsche Bank AG, Singapore Branch or Deutsche Securities Asia Limited, Singapore Branch in respect of any matters arising from, or in connection with, this report. Where this report is issued or promulgated in Singapore to a person who is not an accredited investor, expert investor or institutional investor (as defined in the applicable Singapore laws and regulations), Deutsche Bank AG, Singapore Branch or Deutsche Securities Asia Limited, Singapore Branch accepts legal responsibility to such person for the contents of this report. In Japan this report is approved and/or distributed by Deutsche Securities Inc. The information contained in this report does not constitute the provision of investment advice. In Australia, retail clients should obtain a copy of a Product Disclosure Statement (PDS) relating to any financial product referred to in this report and consider the PDS before making any decision about whether to acquire the product. Deutsche Bank AG Johannesburg is incorporated in the Federal Republic of Germany (Branch Register Number in South Africa: 1998/003298/10). Additional information relative to securities, other financial products or issuers discussed in this report is available upon request. This report may not be reproduced, distributed or published by any person for any purpose without Deutsche Bank's prior written consent. Please cite source when quoting.