22
Industry information K Coetzee August 2013
| Date post: | 13-Dec-2015 |
| Category: |
Documents |
| Upload: | cornelia-parks |
| View: | 219 times |
| Download: | 4 times |

Industry information
K Coetzee
August 2013
Contents
• International economy• International dairy situation• SA economic situation• SA dairy situation

Global growth
• Slight improvement in 2013/ 2014
• Developing countries grow at higher rate
Source: WEO update , July 2013
2010 2011 2012 2013 20140
1
2
3
4
5
6
7
8
World Advanced economies
Developing economies South Africa
% G
DP
gro
wth
/ BB
P g
roei

FAO food price indices, Jan-10 – Jul-13
• Increase in grain prices in 2012
• Followed by dairy prices from mid-2012 and in the first quarter of 2013
Source: FAO, 2013
Jan-10 Jul-10 Jan-11 Jul-11 Jan-12 Jul-12 Jan-13 Jul-13100
150
200
250
300
Food Meat Dairy Cereals
Ind
ex (
2002
- 2
004
= 1
00)

Global milk production
0%
1%
2%
3%
4%
5%
0
100
200
300
400
500
600
700
2007 2008 2009 2010 2011 2012%
Mil.
To
nn
es
Cows' milk Annual growth
Source: IDF, November 2012

Production growth 2013 vs 2012
• Europe– 3 months -1,4%
• USA– 4 months =0,2%
• Australia– 5 months – 7,0%
• New Zealand– 3 months -4,2%
• Argentina– 3 months -9,6%
Source: CNIEL July 2013

Global demand
• Stable in spite of:– Economic conditions
• Global exports up 6% on 2011• China demand growth high
Source: CNIEL, July2013

GlobalDairytrade® Sale price index Dec 2012 – Aug 2013
• Prices firmed from mid-2012
• Sharp increase since February 2013
• Reasons• Drought in NZ• Slow start to EU
season• Low stock levels• Period of
adjustment after sharp increase.
Source: gDt Index, August 2013
4-Dec
-12
15-D
ec-1
2
26-D
ec-1
2
6-Ja
n-13
17-J
an-1
3
28-J
an-1
3
8-Feb
-13
19-F
eb-1
3
2-M
ar-1
3
13-M
ar-1
3
24-M
ar-1
3
4-Apr-1
3
15-A
pr-13
26-A
pr-13
7-M
ay-1
3
18-M
ay-1
3
29-M
ay-1
3
9-Ju
n-13
20-J
un-13
1-Ju
l-13
12-J
ul-13
23-J
ul-13
3-Aug-1
31000
1100
1200
1300
1400
1500
1600
1700
1800
Inde
ks (M
aart
201
0 =
1000
)

International prices, Jan-07 – Jul 13
• Dairy prices at all-time record level
• Fonterra sales prices showed slight decrease
Source: USDA, July 2013; Reserve Bank, 2013
Jan-07 Oct-07 Jul-08 Apr-09 Jan-10 Oct-10 Jul-11 Apr-12 Jan-1310,000
15,000
20,000
25,000
30,000
35,000
40,000
45,000
50,000
55,000
Butter/ Botter SMP/ AMP Cheddar FMP/ VMP
Rand
per
ton

International producer prices, June 2013
• Higher producer prices in most countries
• Subsidies still play major role
• Price based on 4,2% butterfat, 3,4% protein.
Source: LTO, August 2013; IFCN, 2012; MPO, 2013
New Zealand
South Africa
USA
Netherlands
England
Germany
Denmark
France
Ireland
Belgium
Italy
Finland
0 1 2 3 4 5 6 7
Producer price Direct subsidiesRand per litre

SA economic activity
• Co-incident indicator show continuing growth
• Leading indicator recovered from July 2012 low
Jan-10 Jul-10 Jan-11 Jul-11 Jan-12 Jul-12125
130
135
140
145
150
155
160
165
170
Leading indicator Co-incident indicator
Ind
ex (
2000
= 1
00)
Source: SA Reserve Bank, August 2013

Economic growth
• 2012 growth varied between 1,2% and 3,1%
• Weak growth in first quarter of 2013.
Source: Stats SA, June 2013
10-1 10-2 10-3 10-4 11-1 11-2 11-3 11-4 12-1 12-2 12-3 12-4 13-10
0.5
1
1.5
2
2.5
3
3.5
4
4.5
5
An
nu
alis
ed
gro
wth
ra
te (
%)
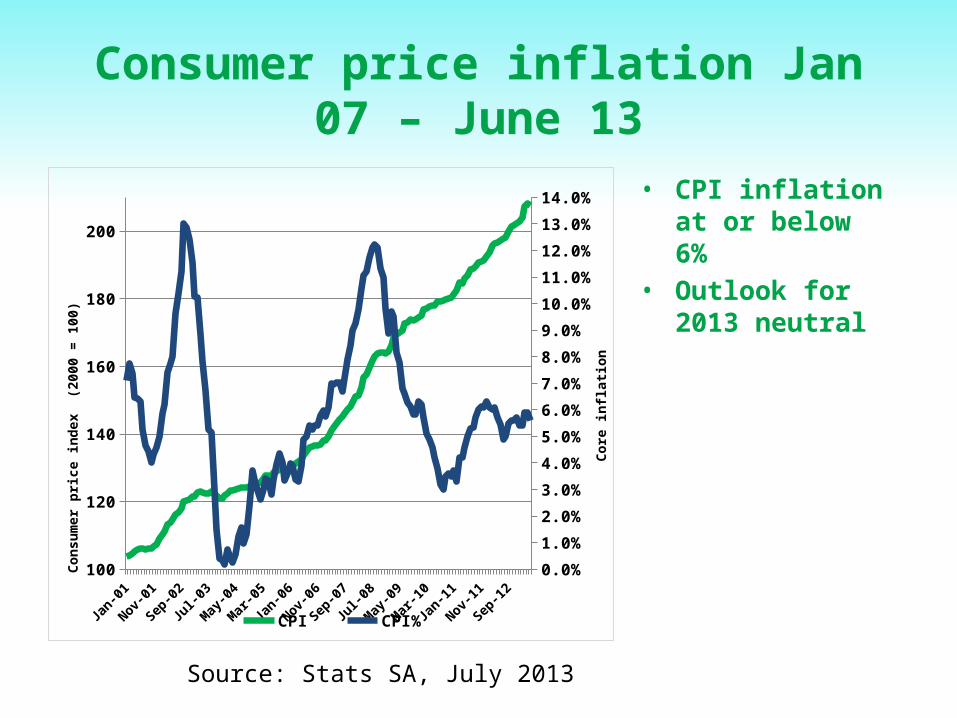
Consumer price inflation Jan 07 – June 13
• CPI inflation at or below 6%
• Outlook for 2013 neutral
Source: Stats SA, July 2013
Jan-0
1
Jan-0
2
Jan-0
3
Jan-0
4
Jan-0
5
Jan-0
6
Jan-0
7
Jan-0
8
Jan-0
9
Jan-1
0
Jan-1
1
Jan-1
2100
120
140
160
180
200
0.0%
1.0%
2.0%
3.0%
4.0%
5.0%
6.0%
7.0%
8.0%
9.0%
10.0%
11.0%
12.0%
13.0%
14.0%
CPI CPI%
Co
nsu
mer
pri
ce i
nd
ex
(200
0 =
100
)
Co
re i
nfl
atio
n

Interest rates, Jan 98 – June 13
0
5
10
15
20
25
30
%
Prime rate "Real rate Rate of inflation
• Prime rate low• Real rate at
lowest level since 2009
• Very little upwards pressure
Source: Stats SA, July 2013

Household income and debt
17
19
21
23
25
42
52
62
72
82
PC
Dis
po
sab
le i
nco
me
)
% D
eb
tt
Debt as % of income Real per capita income
• Steady improvement in income
• Lower consumer debt
• More affordable debt
• Unsecured debt !
Source: SA Reserve Bank, June 2013

Retail sales growth, Jan 08 – May 13
• Positive since 2012
• Volatile growth• Between 2% and
6%
Source: Stats SA, May 2013
-8.0%
-6.0%
-4.0%
-2.0%
0.0%
2.0%
4.0%
6.0%
8.0%
10.0%
12.0%
Ye
ar
on
ye
ar
gro
wth
(%
)

Monthly raw milk production trend, Jan 2011 – March 2013
• Milk production• 2011 = 2 639 Mil.L.• 2012 = 2 757 Mil. L.
Jan – Jun 13 1274Mil.L. (-0,1%)
• Jan – April 2013 –final
• May – June 2013 - preliminary.
• Feb 2012 = 29 days
Source: 2011, 2012, Jan – Apr 13 Milk SA returns; May – Jun 13, Milk SA estimate
Jan Feb Mar Apr May Jun Jul Aug Sep Oct Nov Dec 170 000
190 000
210 000
230 000
250 000
270 000
2 010 2 011 2012 2013*
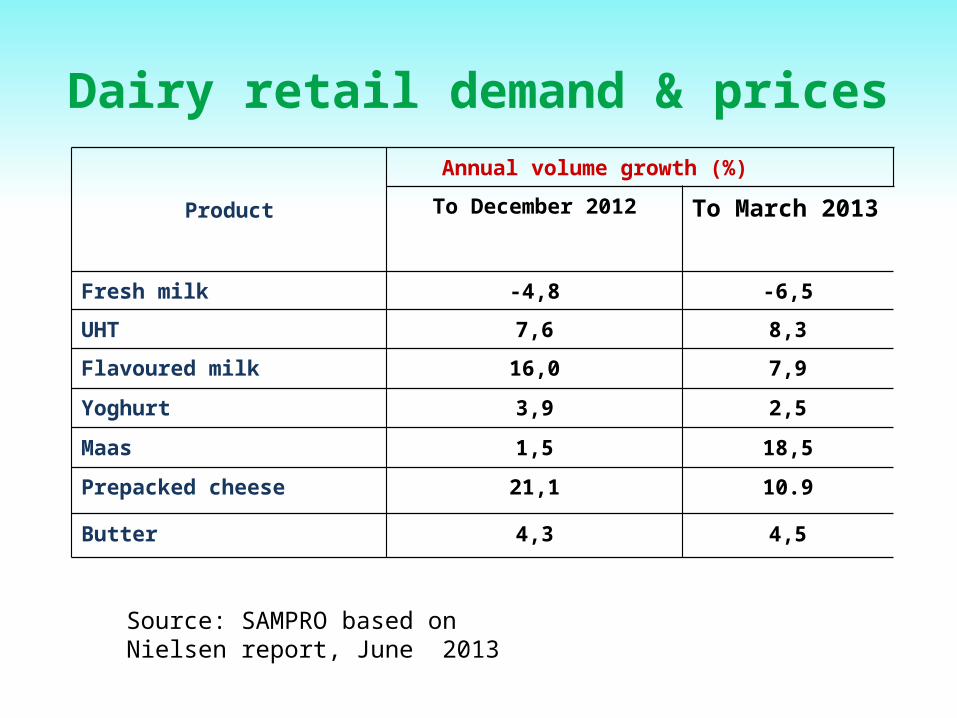
Dairy retail demand & prices
Product
Annual volume growth (%)
To December 2012 To March 2013
Fresh milk -4,8 -6,5
UHT 7,6 8,3
Flavoured milk 16,0 7,9
Yoghurt 3,9 2,5
Maas 1,5 18,5
Prepacked cheese 21,1 10.9
Butter 4,3 4,5
Source: SAMPRO based on Nielsen report, June 2013

Cumulative net imports of dairy products
Source: SARS as supplied by SAMPRO
Jan Feb Mar Apr May Jun Jul Aug Sep Oct Nov Dec-20
20
60
100
140
180
2010 2011 2012 2013
Mill
ion
litre
milk
equ
ival
ent

Milk: feed price ratio, Jan 03 – July 13
• Historic low Jan 13
• Slight improvement since caused by lower grain prices
Jan-0
3
Jan-0
4
Jan-0
5
Jan-0
6
Jan-0
7
Jan-0
8
Jan-0
9
Jan-1
0
Jan-1
1
Jan-1
2
Jan-1
30.8
1
1.2
1.4
1.6
1.8
2
2.2
Milk
:fe
ed
pri
ce
ra
tio
Source: MPO calculations; Feed = 70% YM1, 30% Soy, Safex nearest month prices, producer price MPO survey
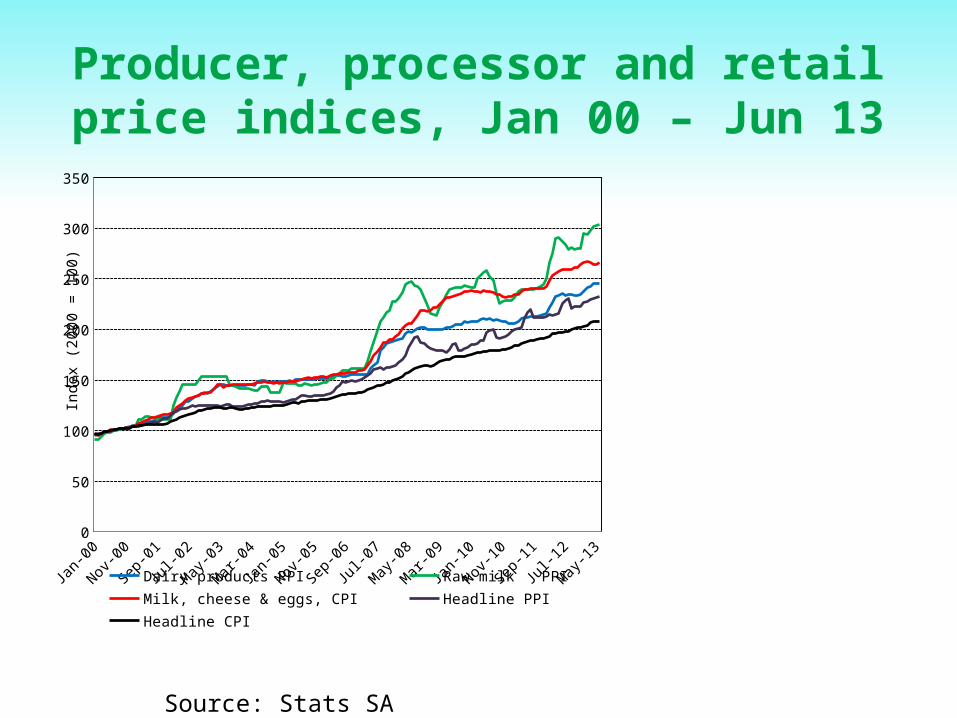
Producer, processor and retail price indices, Jan 00 – Jun 13
Source: Stats SA
Jan-00 Jan-02 Jan-04 Jan-06 Jan-08 Jan-10 Jan-120
50
100
150
200
250
300
350
Dairy products PPI Raw milk PPI Milk, cheese & eggs, CPI
Headline PPI Headline CPI
Inde
x (2
000
= 1
00)

Retail price 2 litre milk, Jan 00 – Jun 13
Jan-00Jan-01Jan-02Jan-03Jan-04Jan-05Jan-06Jan-07Jan-08Jan-09Jan-10Jan-11Jan-123
4
5
6
7
8
9
10
Retail price/Kleinhandelprys
Ran
d p
er l
itre


