19
June 2016 Energy Equipment & Services Industry Insights and Happenings

1
June 2016
E n e r g y E q u i p m e n t & S e r v i c e s
Industry Insights and Happenings
2
Report SummaryINDUSTRY COMMENTARY
• Crude prices continue to dominate the industry’s outlook
– Recent rally in prices driven by outages and strong crude demand have led to projections for a potential bottoming in services activity
• 1Q results in the OFS space were downbeat, but management teams ex-pressed optimism that a recovery is in its early stages and may begin to be realized in 2017
– Despite the rally in commodity prices, producers are largely prioritizing balance sheet stabilization over incremental drilling activity
– However, maintenance capital expenditures have remained relatively in-sulated from spending cuts
• On the M&A front, the big news in May was the termination of the planned Halliburton-Baker Hughes merger less than a month after the US DOJ sued to block the transaction. HAL paid BHI a $3.5B termination fee
– More generally, M&A activity seems to have picked up via PE-backed restructurings
– Cerberus-backed Keane acquired Trican’s US business for in excess of 30% of replacement cost
TABLE OF CONTENTS:
• Recent Transactions
• Articles We enjoyed
• Commodity Prices
• Rig Counts
• Public Comparables
CONTACTS:
Ted KinsmanManaging [email protected](303) 572-6013
Samuel L. Hill Managing Directorhill@headwatersmb. com214.457.4832
Tim McEuenSr. Vice [email protected](303) 962-5778
Luis Moya Vice [email protected]
www.headwatersmb.com
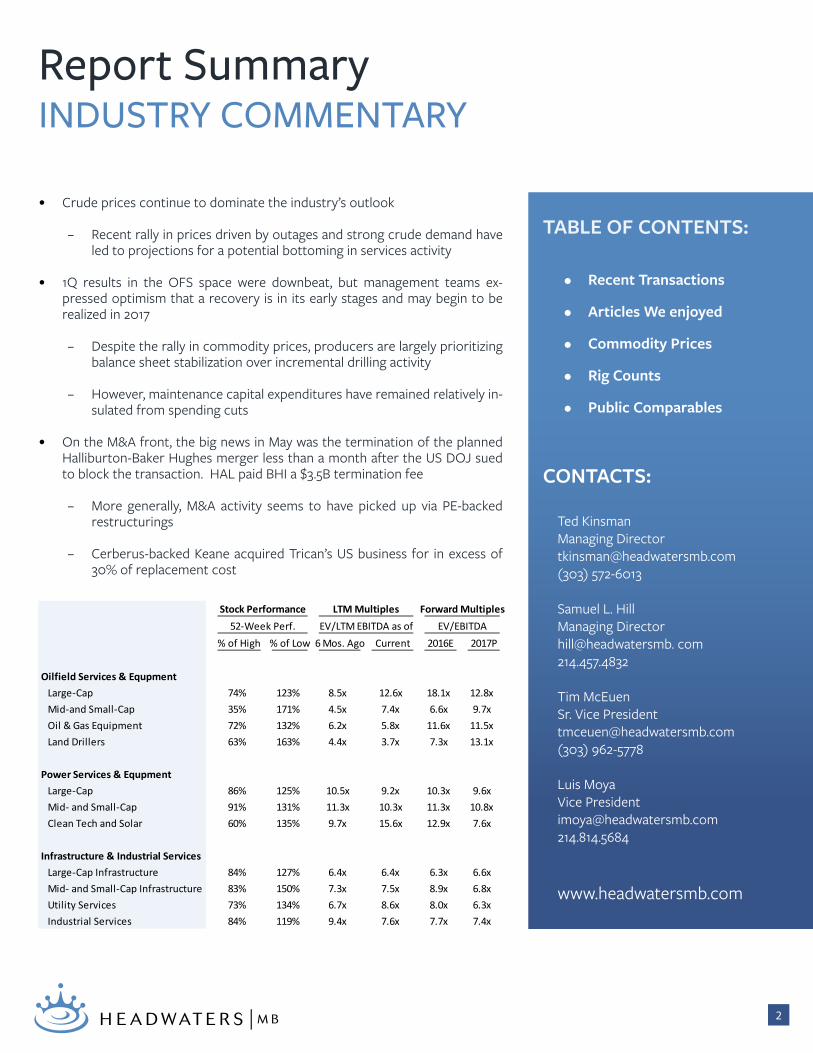
% of High % of Low 6 Mos. Ago Current 2016E 2017P
Oilfield Services & EqupmentLarge-Cap 74% 123% 8.5x 12.6x 18.1x 12.8xMid-and Small-Cap 35% 171% 4.5x 7.4x 6.6x 9.7xOil & Gas Equipment 72% 132% 6.2x 5.8x 11.6x 11.5xLand Drillers 63% 163% 4.4x 3.7x 7.3x 13.1x
Power Services & EqupmentLarge-Cap 86% 125% 10.5x 9.2x 10.3x 9.6xMid- and Small-Cap 91% 131% 11.3x 10.3x 11.3x 10.8xClean Tech and Solar 60% 135% 9.7x 15.6x 12.9x 7.6x
Infrastructure & Industrial ServicesLarge-Cap Infrastructure 84% 127% 6.4x 6.4x 6.3x 6.6xMid- and Small-Cap Infrastructure 83% 150% 7.3x 7.5x 8.9x 6.8xUtility Services 73% 134% 6.7x 8.6x 8.0x 6.3xIndustrial Services 84% 119% 9.4x 7.6x 7.7x 7.4x
Forward MultiplesEV/EBITDA52-Week Perf.
LTM MultiplesEV/LTM EBITDA as of
Stock Performance
3
Industry UpdateRECENT TRANSACTIONS
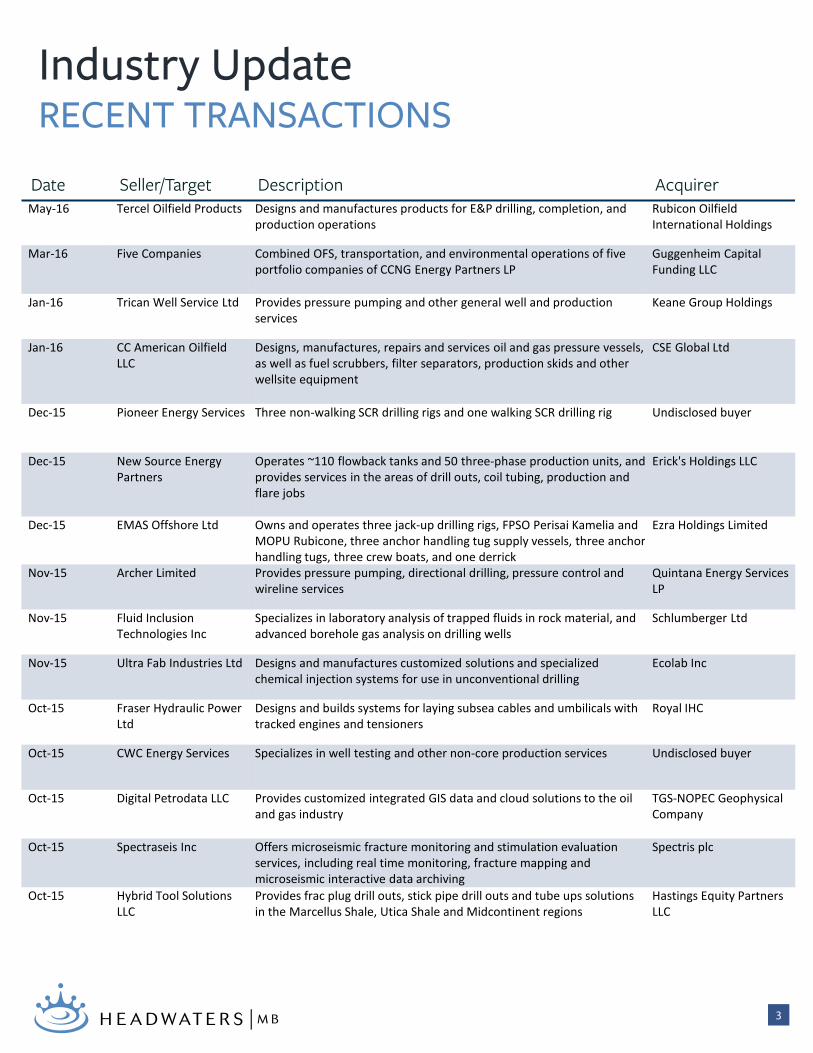
Date Seller/Target Description AcquirerMay-16 Tercel Oilfield Products Designs and manufactures products for E&P drilling, completion, and
production operationsRubicon Oilfield International Holdings
Mar-16 Five Companies Combined OFS, transportation, and environmental operations of five portfolio companies of CCNG Energy Partners LP
Guggenheim Capital Funding LLC
Jan-16 Trican Well Service Ltd Provides pressure pumping and other general well and production services
Keane Group Holdings
Jan-16 CC American Oilfield LLC
Designs, manufactures, repairs and services oil and gas pressure vessels, as well as fuel scrubbers, filter separators, production skids and other wellsite equipment
CSE Global Ltd
Dec-15 Pioneer Energy Services Three non-walking SCR drilling rigs and one walking SCR drilling rig Undisclosed buyer
Dec-15 New Source Energy Partners
Operates ~110 flowback tanks and 50 three-phase production units, and provides services in the areas of drill outs, coil tubing, production and flare jobs
Erick's Holdings LLC
Dec-15 EMAS Offshore Ltd Owns and operates three jack-up drilling rigs, FPSO Perisai Kamelia and MOPU Rubicone, three anchor handling tug supply vessels, three anchor handling tugs, three crew boats, and one derrick
Ezra Holdings Limited
Nov-15 Archer Limited Provides pressure pumping, directional drilling, pressure control and wireline services
Quintana Energy Services LP
Nov-15 Fluid Inclusion Technologies Inc
Specializes in laboratory analysis of trapped fluids in rock material, and advanced borehole gas analysis on drilling wells
Schlumberger Ltd
Nov-15 Ultra Fab Industries Ltd Designs and manufactures customized solutions and specialized chemical injection systems for use in unconventional drilling
Ecolab Inc
Oct-15 Fraser Hydraulic Power Ltd
Designs and builds systems for laying subsea cables and umbilicals with tracked engines and tensioners
Royal IHC
Oct-15 CWC Energy Services Specializes in well testing and other non-core production services Undisclosed buyer
Oct-15 Digital Petrodata LLC Provides customized integrated GIS data and cloud solutions to the oil and gas industry
TGS-NOPEC Geophysical Company
Oct-15 Spectraseis Inc Offers microseismic fracture monitoring and stimulation evaluation services, including real time monitoring, fracture mapping and microseismic interactive data archiving
Spectris plc
Oct-15 Hybrid Tool Solutions LLC
Provides frac plug drill outs, stick pipe drill outs and tube ups solutions in the Marcellus Shale, Utica Shale and Midcontinent regions
Hastings Equity Partners LLC
4
M&A Report 1Q 2016 | Add-Ons Hit Record Level
As PE firms have looked lower in the value chain to find plat-form deals, add-ons have continued to make up a larger and larger share of buyouts, climbing consecutively each. As PE firms have looked lower in the value chain to find platform deals, add-ons have continued to make up a larger and larg-er share of buyouts, climbing consecutively each of the last 7 years and now up to 59.1% in the recent quarter. Median deal size of add-on acquisitions nearly halved in the quarter to $35.3 million, on the low side of recent history, again speaking to a shift from GPs to hunt for smaller deals they can combine to build well-rounded companies.
Pitchbook | M&A Report 1Q 2016
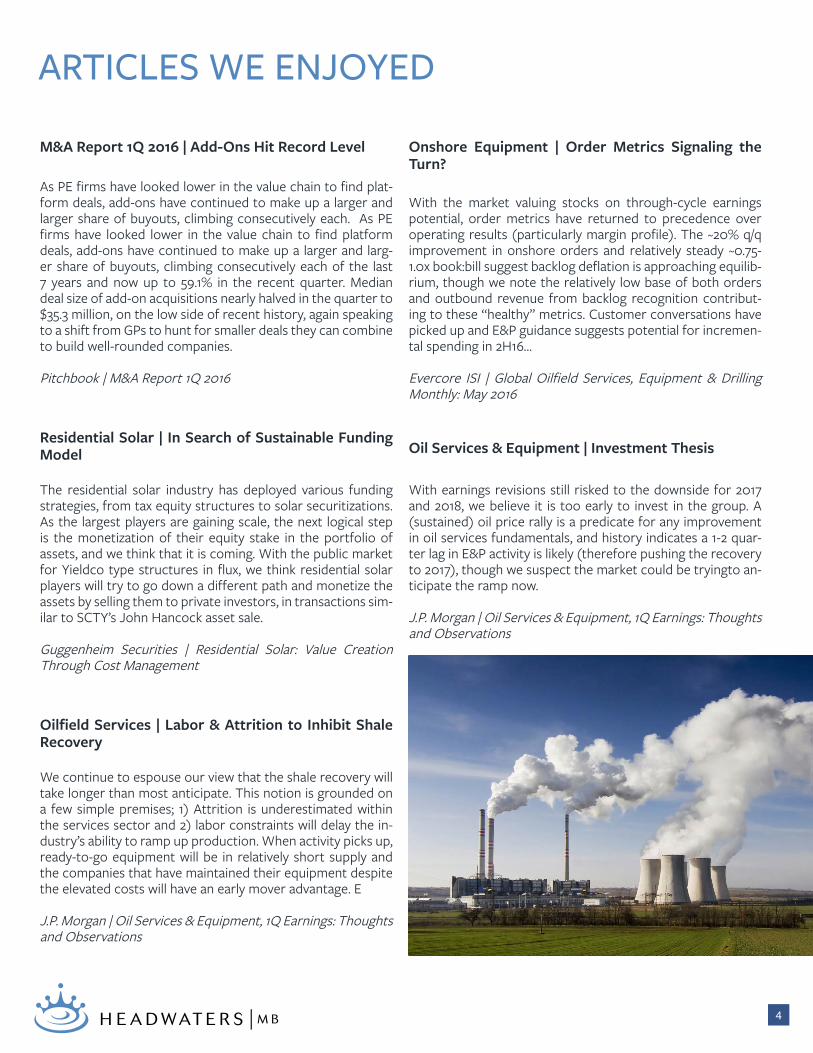
Residential Solar | In Search of Sustainable Funding Model
The residential solar industry has deployed various funding strategies, from tax equity structures to solar securitizations. As the largest players are gaining scale, the next logical step is the monetization of their equity stake in the portfolio of assets, and we think that it is coming. With the public market for Yieldco type structures in flux, we think residential solar players will try to go down a different path and monetize the assets by selling them to private investors, in transactions sim-ilar to SCTY’s John Hancock asset sale.
Guggenheim Securities | Residential Solar: Value Creation Through Cost Management
Oilfield Services | Labor & Attrition to Inhibit Shale Recovery
We continue to espouse our view that the shale recovery will take longer than most anticipate. This notion is grounded on a few simple premises; 1) Attrition is underestimated within the services sector and 2) labor constraints will delay the in-dustry’s ability to ramp up production. When activity picks up, ready-to-go equipment will be in relatively short supply and the companies that have maintained their equipment despite the elevated costs will have an early mover advantage. E
J.P. Morgan | Oil Services & Equipment, 1Q Earnings: Thoughts and Observations
Onshore Equipment | Order Metrics Signaling the Turn?
With the market valuing stocks on through-cycle earnings potential, order metrics have returned to precedence over operating results (particularly margin profile). The ~20% q/q improvement in onshore orders and relatively steady ~0.75-1.0x book:bill suggest backlog deflation is approaching equilib-rium, though we note the relatively low base of both orders and outbound revenue from backlog recognition contribut-ing to these “healthy” metrics. Customer conversations have picked up and E&P guidance suggests potential for incremen-tal spending in 2H16…
Evercore ISI | Global Oilfield Services, Equipment & Drilling Monthly: May 2016
Oil Services & Equipment | Investment Thesis
With earnings revisions still risked to the downside for 2017 and 2018, we believe it is too early to invest in the group. A (sustained) oil price rally is a predicate for any improvement in oil services fundamentals, and history indicates a 1-2 quar-ter lag in E&P activity is likely (therefore pushing the recovery to 2017), though we suspect the market could be tryingto an-ticipate the ramp now.
J.P. Morgan | Oil Services & Equipment, 1Q Earnings: Thoughts and Observations
ARTICLES WE ENJOYED
5
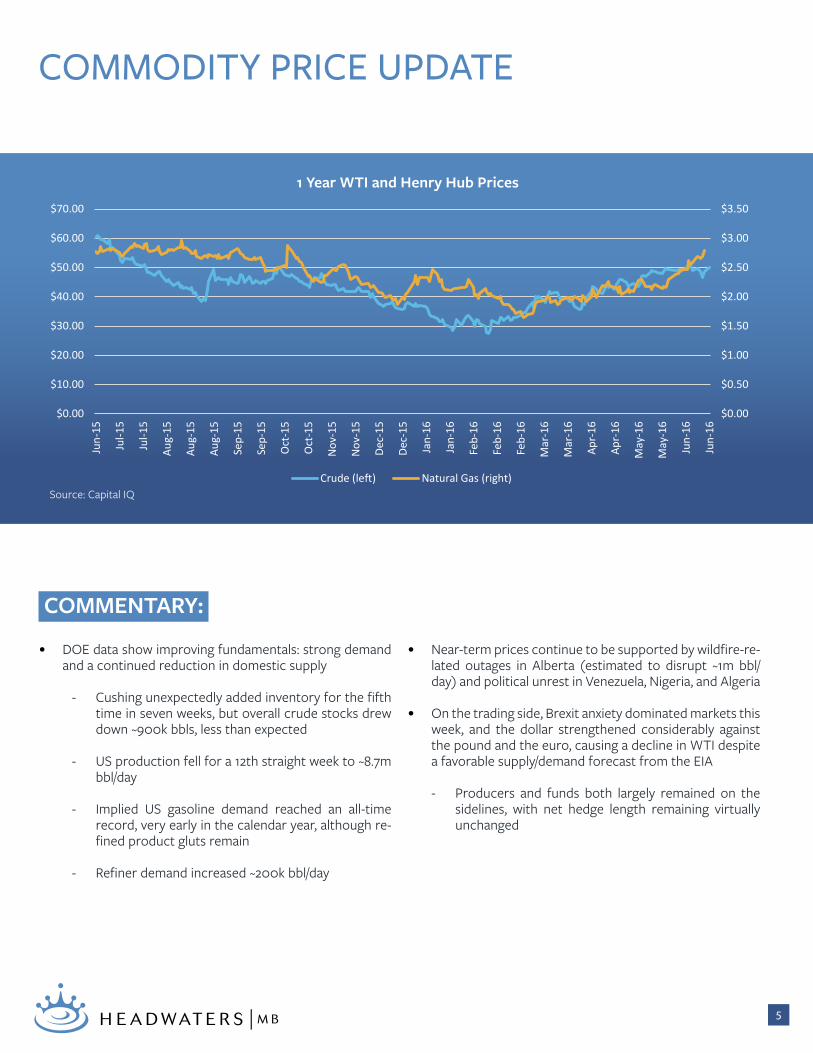
1 Year WTI and Henry Hub Prices
Source: Capital IQ
COMMENTARY:
• DOE data show improving fundamentals: strong demand and a continued reduction in domestic supply
- Cushing unexpectedly added inventory for the fifth time in seven weeks, but overall crude stocks drew down ~900k bbls, less than expected
- US production fell for a 12th straight week to ~8.7m bbl/day
- Implied US gasoline demand reached an all-time record, very early in the calendar year, although re-fined product gluts remain
- Refiner demand increased ~200k bbl/day
• Near-term prices continue to be supported by wildfire-re-lated outages in Alberta (estimated to disrupt ~1m bbl/day) and political unrest in Venezuela, Nigeria, and Algeria
• On the trading side, Brexit anxiety dominated markets this week, and the dollar strengthened considerably against the pound and the euro, causing a decline in WTI despite a favorable supply/demand forecast from the EIA
- Producers and funds both largely remained on the sidelines, with net hedge length remaining virtually unchanged
COMMODITY PRICE UPDATE
$0.00
$0.50
$1.00
$1.50
$2.00
$2.50
$3.00
$3.50
$0.00
$10.00
$20.00
$30.00
$40.00
$50.00
$60.00
$70.00
Jun-
15
Jul-1
5
Jul-1
5
Aug-
15
Aug-
15
Aug-
15
Sep-
15
Sep-
15
Oct
-15
Oct
-15
Nov
-15
Nov
-15
Dec-
15
Dec-
15
Jan-
16
Jan-
16
Feb-
16
Feb-
16
Feb-
16
Mar
-16
Mar
-16
Apr-
16
Apr-
16
May
-16
May
-16
Jun-
16
Jun-
16
Crude (left) Natural Gas (right)
6
0
500
1,000
1,500
2,000
Jan-
00
Jan-
02
Jan-
04
Jan-
06
Jan-
08
Jan-
10
Jan-
12
Jan-
14
Jan-
16
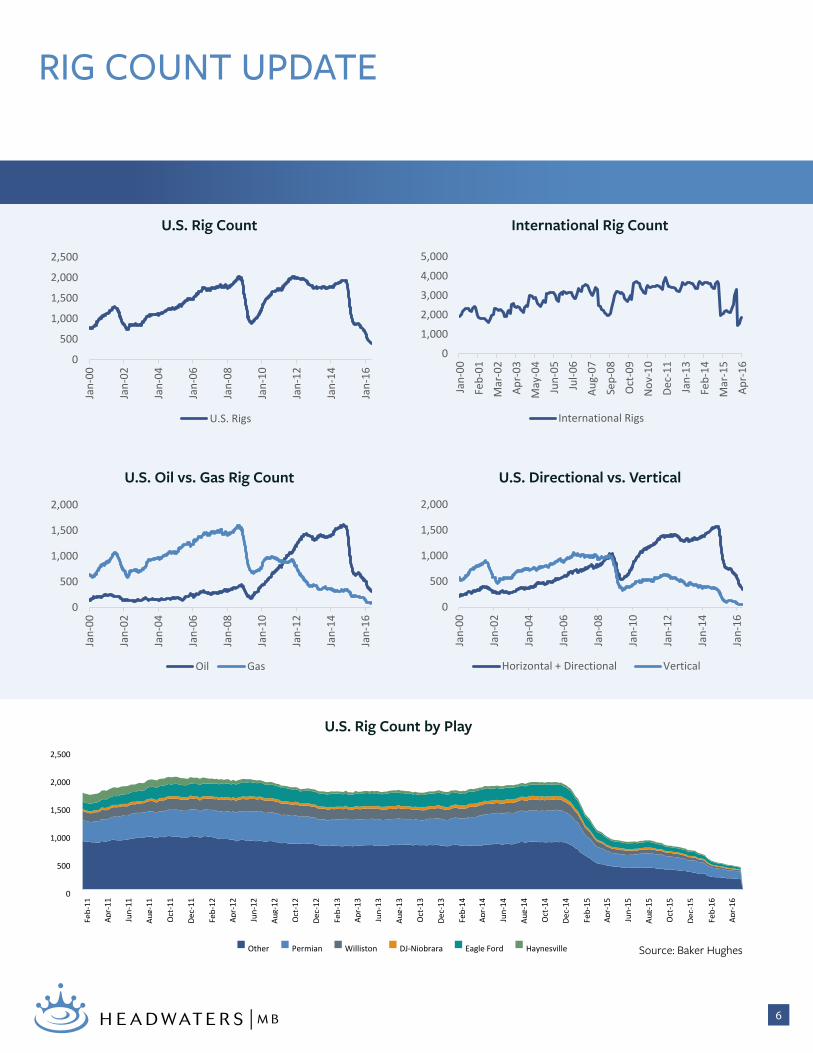
Oil Gas
0
500
1,000
1,500
2,000
2,500
Jan-
00
Jan-
02
Jan-
04
Jan-
06
Jan-
08
Jan-
10
Jan-
12
Jan-
14
Jan-
16
U.S. Rigs
0
500
1,000
1,500
2,000
Jan-
00
Jan-
02
Jan-
04
Jan-
06
Jan-
08
Jan-
10
Jan-
12
Jan-
14
Jan-
16
Horizontal + Directional Vertical
0
1,000
2,000
3,000
4,000
5,000
Jan-
00Fe
b-01
Mar
-02
Apr-
03M
ay-0
4Ju
n-05
Jul-0
6Au
g-07
Sep-
08O
ct-0
9N
ov-1
0De
c-11
Jan-
13Fe
b-14
Mar
-15
Apr-
16
International Rigs
U.S. Rig Count International Rig Count
U.S. Directional vs. VerticalU.S. Oil vs. Gas Rig Count
U.S. Rig Count by Play
Source: Baker Hughes
RIG COUNT UPDATE
0
500
1,000
1,500
2,000
2,500
Feb-
11
Apr-
11
Jun-
11
Aug-
11
Oct
-11
Dec-
11
Feb-
12
Apr-
12
Jun-
12
Aug-
12
Oct
-12
Dec-
12
Feb-
13
Apr-
13
Jun-
13
Aug-
13
Oct
-13
Dec-
13
Feb-
14
Apr-
14
Jun-
14
Aug-
14
Oct
-14
Dec-
14
Feb-
15
Apr-
15
Jun-
15
Aug-
15
Oct
-15
Dec-
15
Feb-
16
Apr-
16
Other Permian Williston DJ-Niobrara Eagle Ford Haynesville
7
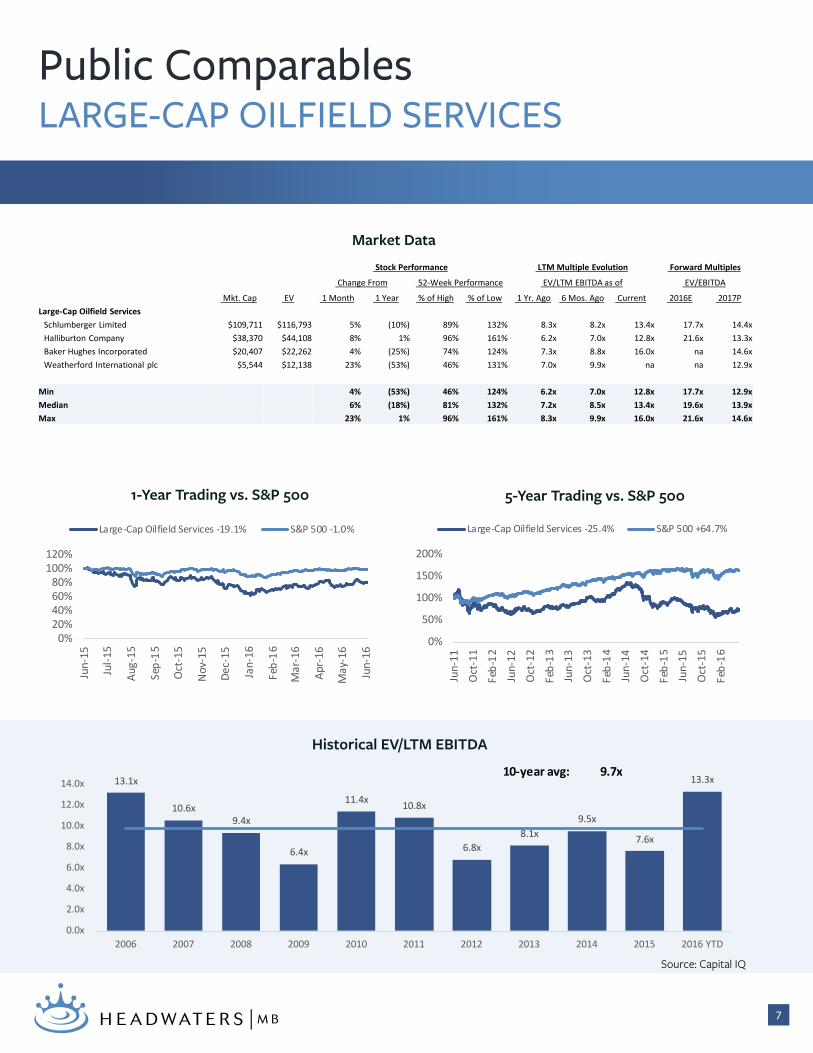
Public ComparablesLARGE-CAP OILFIELD SERVICES
5-Year Trading vs. S&P 5001-Year Trading vs. S&P 500
Historical EV/LTM EBITDA
Source: Capital IQ
Market Data
Stock Performance LTM Multiple Evolution Forward Multiples
Change From 52-Week Performance EV/LTM EBITDA as of EV/EBITDA
Mkt. Cap EV 1 Month 1 Year % of High % of Low 1 Yr. Ago 6 Mos. Ago Current 2016E 2017P Large-Cap Oilfield Services
Schlumberger Limited $109,711 $116,793 5% (10%) 89% 132% 8.3x 8.2x 13.4x 17.7x 14.4x Halliburton Company $38,370 $44,108 8% 1% 96% 161% 6.2x 7.0x 12.8x 21.6x 13.3x Baker Hughes Incorporated $20,407 $22,262 4% (25%) 74% 124% 7.3x 8.8x 16.0x na 14.6x Weatherford International plc $5,544 $12,138 23% (53%) 46% 131% 7.0x 9.9x na na 12.9x
Min 4% (53%) 46% 124% 6.2x 7.0x 12.8x 17.7x 12.9x Median 6% (18%) 81% 132% 7.2x 8.5x 13.4x 19.6x 13.9x Max 23% 1% 96% 161% 8.3x 9.9x 16.0x 21.6x 14.6x
0%20%40%60%80%
100%120%
Jun-
15
Jul-1
5
Aug-
15
Sep-
15
Oct
-15
Nov
-15
Dec-
15
Jan-
16
Feb-
16
Mar
-16
Apr-
16
May
-16
Jun-
16
Large-Cap Oilfield Services -19.1% S&P 500 -1.0%
0%
50%
100%
150%
200%
Jun-
11
Oct
-11
Feb-
12Ju
n-12
Oct
-12
Feb-
13Ju
n-13
Oct
-13
Feb-
14Ju
n-14
Oct
-14
Feb-
15Ju
n-15
Oct
-15
Feb-
16
Large-Cap Oilfield Services -25.4% S&P 500 +64.7%
10-year avg: 9.7x13.1x
10.6x 9.4x
6.4x
11.4x 10.8x
6.8x 8.1x
9.5x
7.6x
13.3x
0.0x
2.0x
4.0x
6.0x
8.0x
10.0x
12.0x
14.0x
2006 2007 2008 2009 2010 2011 2012 2013 2014 2015 2016 YTD
8
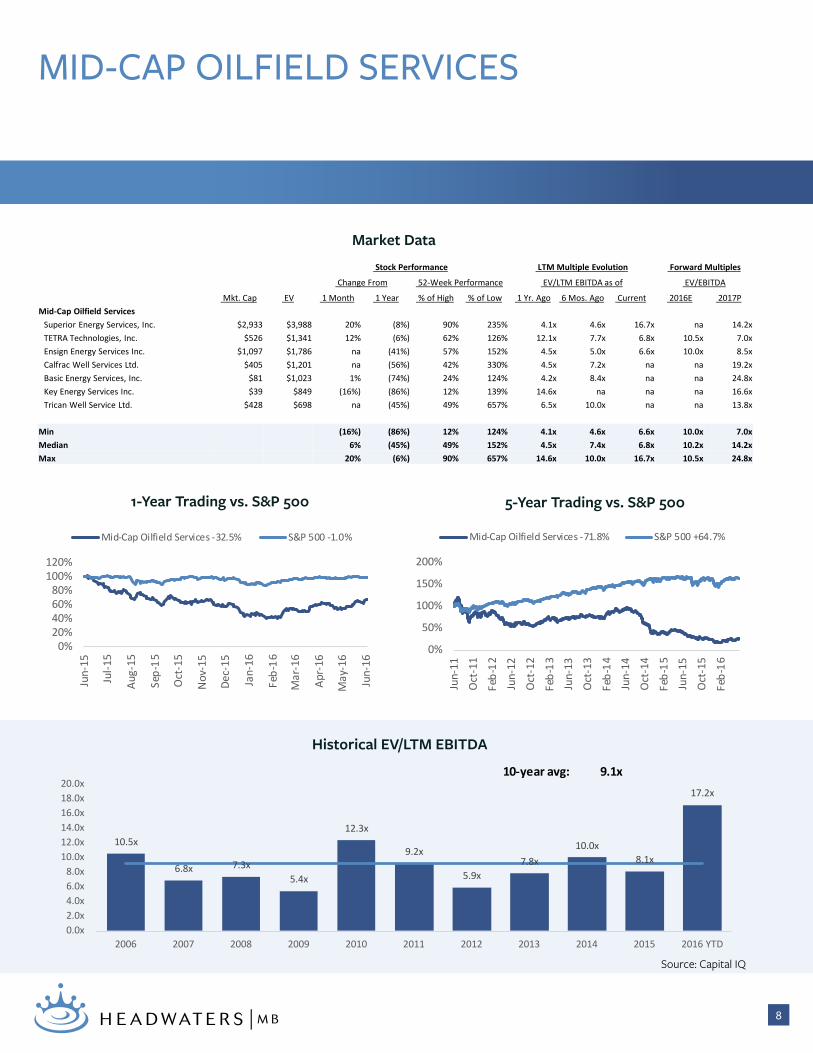
Market Data
5-Year Trading vs. S&P 5001-Year Trading vs. S&P 500
Historical EV/LTM EBITDA
Source: Capital IQ
MID-CAP OILFIELD SERVICES
Stock Performance LTM Multiple Evolution Forward Multiples
Change From 52-Week Performance EV/LTM EBITDA as of EV/EBITDA
Mkt. Cap EV 1 Month 1 Year % of High % of Low 1 Yr. Ago 6 Mos. Ago Current 2016E 2017P Mid-Cap Oilfield Services
Superior Energy Services, Inc. $2,933 $3,988 20% (8%) 90% 235% 4.1x 4.6x 16.7x na 14.2x TETRA Technologies, Inc. $526 $1,341 12% (6%) 62% 126% 12.1x 7.7x 6.8x 10.5x 7.0x Ensign Energy Services Inc. $1,097 $1,786 na (41%) 57% 152% 4.5x 5.0x 6.6x 10.0x 8.5x Calfrac Well Services Ltd. $405 $1,201 na (56%) 42% 330% 4.5x 7.2x na na 19.2x Basic Energy Services, Inc. $81 $1,023 1% (74%) 24% 124% 4.2x 8.4x na na 24.8x Key Energy Services Inc. $39 $849 (16%) (86%) 12% 139% 14.6x na na na 16.6x Trican Well Service Ltd. $428 $698 na (45%) 49% 657% 6.5x 10.0x na na 13.8x
Min (16%) (86%) 12% 124% 4.1x 4.6x 6.6x 10.0x 7.0x Median 6% (45%) 49% 152% 4.5x 7.4x 6.8x 10.2x 14.2x Max 20% (6%) 90% 657% 14.6x 10.0x 16.7x 10.5x 24.8x
0%20%40%60%80%
100%120%
Jun-
15
Jul-1
5
Aug-
15
Sep-
15
Oct
-15
Nov
-15
Dec-
15
Jan-
16
Feb-
16
Mar
-16
Apr-
16
May
-16
Jun-
16
Mid-Cap Oilfield Services -32.5% S&P 500 -1.0%
0%
50%
100%
150%
200%
Jun-
11
Oct
-11
Feb-
12Ju
n-12
Oct
-12
Feb-
13Ju
n-13
Oct
-13
Feb-
14Ju
n-14
Oct
-14
Feb-
15Ju
n-15
Oct
-15
Feb-
16
Mid-Cap Oilfield Services -71.8% S&P 500 +64.7%
10-year avg: 9.1x
10.5x
6.8x 7.3x 5.4x
12.3x
9.2x
5.9x 7.8x
10.0x 8.1x
17.2x
0.0x2.0x4.0x6.0x8.0x
10.0x12.0x14.0x16.0x18.0x20.0x
2006 2007 2008 2009 2010 2011 2012 2013 2014 2015 2016 YTD
9
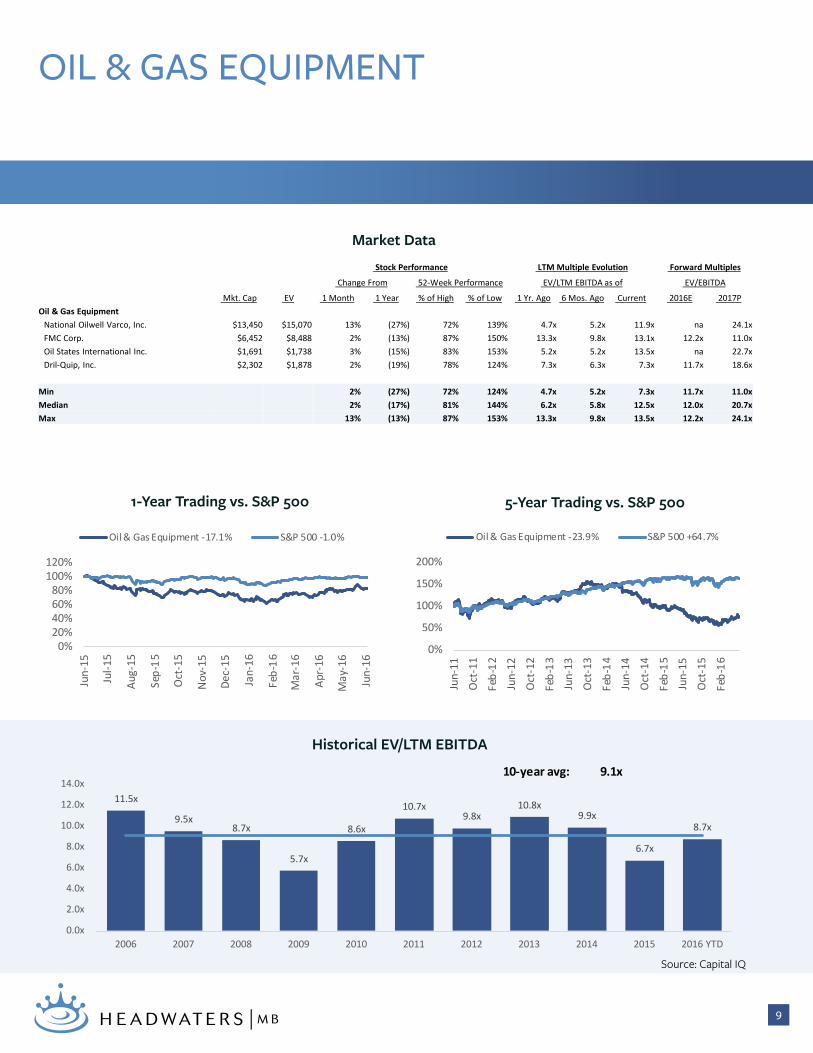
5-Year Trading vs. S&P 5001-Year Trading vs. S&P 500
Historical EV/LTM EBITDA
Source: Capital IQ
OIL & GAS EQUIPMENT
Market Data
Stock Performance LTM Multiple Evolution Forward Multiples
Change From 52-Week Performance EV/LTM EBITDA as of EV/EBITDA
Mkt. Cap EV 1 Month 1 Year % of High % of Low 1 Yr. Ago 6 Mos. Ago Current 2016E 2017P Oil & Gas Equipment
National Oilwell Varco, Inc. $13,450 $15,070 13% (27%) 72% 139% 4.7x 5.2x 11.9x na 24.1x FMC Corp. $6,452 $8,488 2% (13%) 87% 150% 13.3x 9.8x 13.1x 12.2x 11.0x Oil States International Inc. $1,691 $1,738 3% (15%) 83% 153% 5.2x 5.2x 13.5x na 22.7x Dril-Quip, Inc. $2,302 $1,878 2% (19%) 78% 124% 7.3x 6.3x 7.3x 11.7x 18.6x
Min 2% (27%) 72% 124% 4.7x 5.2x 7.3x 11.7x 11.0x Median 2% (17%) 81% 144% 6.2x 5.8x 12.5x 12.0x 20.7x Max 13% (13%) 87% 153% 13.3x 9.8x 13.5x 12.2x 24.1x
0%20%40%60%80%
100%120%
Jun-
15
Jul-1
5
Aug-
15
Sep-
15
Oct
-15
Nov
-15
Dec-
15
Jan-
16
Feb-
16
Mar
-16
Apr-
16
May
-16
Jun-
16
Oil & Gas Equipment -17.1% S&P 500 -1.0%
0%
50%
100%
150%
200%
Jun-
11
Oct
-11
Feb-
12Ju
n-12
Oct
-12
Feb-
13Ju
n-13
Oct
-13
Feb-
14Ju
n-14
Oct
-14
Feb-
15Ju
n-15
Oct
-15
Feb-
16
Oil & Gas Equipment -23.9% S&P 500 +64.7%
10-year avg: 9.1x
11.5x
9.5x 8.7x
5.7x
8.6x
10.7x 9.8x
10.8x 9.9x
6.7x
8.7x
0.0x
2.0x
4.0x
6.0x
8.0x
10.0x
12.0x
14.0x
2006 2007 2008 2009 2010 2011 2012 2013 2014 2015 2016 YTD

10
5-Year Trading vs. S&P 5001-Year Trading vs. S&P 500
Historical EV/LTM EBITDA
Source: Capital IQ
LAND DRILLERS
Market Data
Stock Performance LTM Multiple Evolution Forward Multiples
Change From 52-Week Performance EV/LTM EBITDA as of EV/EBITDA
Mkt. Cap EV 1 Month 1 Year % of High % of Low 1 Yr. Ago 6 Mos. Ago Current 2016E 2017P Land Drillers
Nabors Industries Ltd. $2,983 $6,351 32% (25%) 72% 215% 4.5x 4.6x 9.3x 11.2x 9.7x Helmerich & Payne, Inc. $7,343 $6,932 15% (8%) 93% 167% 4.4x 3.7x 8.4x 15.9x 18.4x Patterson-UTI Energy Inc. $3,110 $3,764 22% 6% 95% 193% 3.7x 3.6x 8.3x 19.9x 15.4x Precision Drilling Corporation $1,982 $3,549 na (19%) 79% 198% 6.1x 6.2x 13.8x 13.9x 11.2x Pioneer Energy Services Corp. $279 $648 45% (32%) 64% 455% 3.1x 3.0x 8.5x na 11.6x
Min 15% (32%) 64% 167% 3.1x 3.0x 8.3x 11.2x 9.7x Median 27% (19%) 79% 198% 4.4x 3.7x 8.5x 14.9x 11.6x Max 45% 6% 95% 455% 6.1x 6.2x 13.8x 19.9x 18.4x
0%
50%
100%
150%
200%
Jun-
11
Oct
-11
Feb-
12Ju
n-12
Oct
-12
Feb-
13Ju
n-13
Oct
-13
Feb-
14Ju
n-14
Oct
-14
Feb-
15Ju
n-15
Oct
-15
Feb-
16
Land Drillers -34.3% S&P 500 +64.7%
0%20%40%60%80%
100%120%
Jun-
15
Jul-1
5
Aug-
15
Sep-
15
Oct
-15
Nov
-15
Dec-
15
Jan-
16
Feb-
16
Mar
-16
Apr-
16
May
-16
Jun-
16
Land Drillers -8.6% S&P 500 -1.0%
10-year avg: 5.9x
7.0x
4.7x 5.7x
4.2x
8.5x 7.5x
4.4x 5.3x
6.1x
4.2x
6.7x
0.0x1.0x2.0x3.0x4.0x5.0x6.0x7.0x8.0x9.0x
2006 2007 2008 2009 2010 2011 2012 2013 2014 2015 2016 YTD
11
5-Year Trading vs. S&P 5001-Year Trading vs. S&P 500
Historical EV/LTM EBITDA
Source: Capital IQ
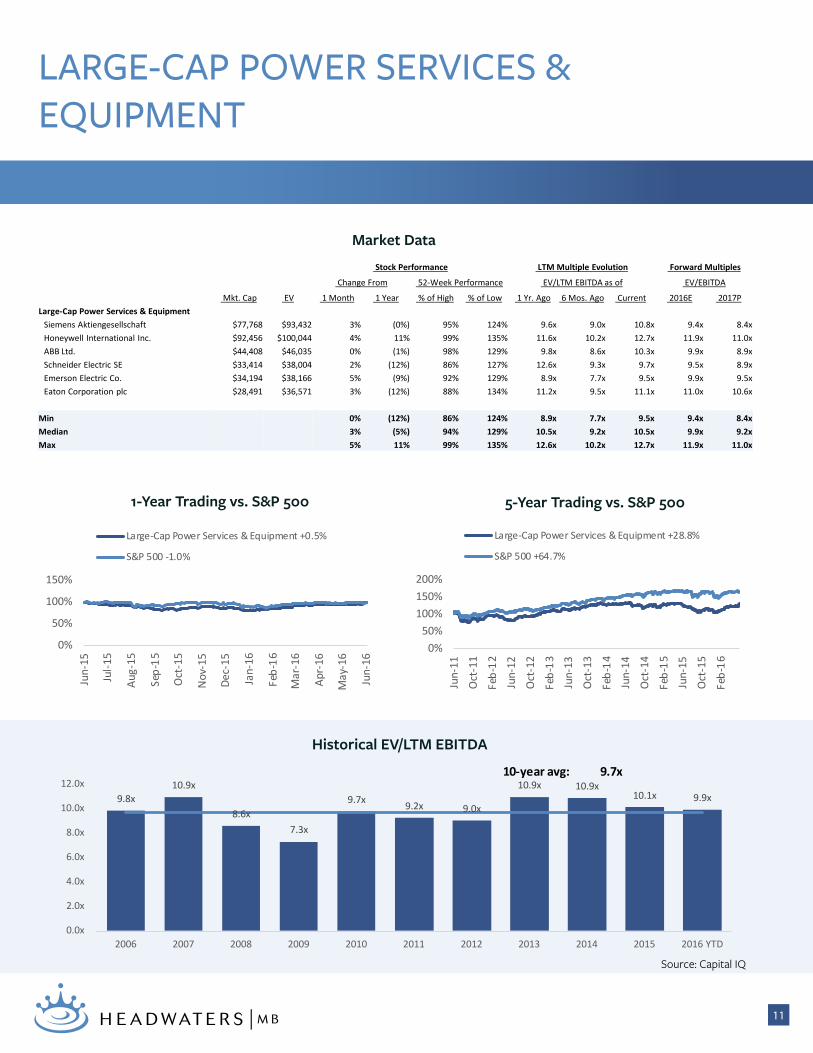
LARGE-CAP POWER SERVICES & EQUIPMENT
Market Data
Stock Performance LTM Multiple Evolution Forward Multiples
Change From 52-Week Performance EV/LTM EBITDA as of EV/EBITDA
Mkt. Cap EV 1 Month 1 Year % of High % of Low 1 Yr. Ago 6 Mos. Ago Current 2016E 2017P Large-Cap Power Services & Equipment
Siemens Aktiengesellschaft $77,768 $93,432 3% (0%) 95% 124% 9.6x 9.0x 10.8x 9.4x 8.4x Honeywell International Inc. $92,456 $100,044 4% 11% 99% 135% 11.6x 10.2x 12.7x 11.9x 11.0x ABB Ltd. $44,408 $46,035 0% (1%) 98% 129% 9.8x 8.6x 10.3x 9.9x 8.9x Schneider Electric SE $33,414 $38,004 2% (12%) 86% 127% 12.6x 9.3x 9.7x 9.5x 8.9x Emerson Electric Co. $34,194 $38,166 5% (9%) 92% 129% 8.9x 7.7x 9.5x 9.9x 9.5x Eaton Corporation plc $28,491 $36,571 3% (12%) 88% 134% 11.2x 9.5x 11.1x 11.0x 10.6x
Min 0% (12%) 86% 124% 8.9x 7.7x 9.5x 9.4x 8.4x Median 3% (5%) 94% 129% 10.5x 9.2x 10.5x 9.9x 9.2x Max 5% 11% 99% 135% 12.6x 10.2x 12.7x 11.9x 11.0x
0%
50%
100%
150%
Jun-
15
Jul-1
5
Aug-
15
Sep-
15
Oct
-15
Nov
-15
Dec-
15
Jan-
16
Feb-
16
Mar
-16
Apr-
16
May
-16
Jun-
16
Large-Cap Power Services & Equipment +0.5%
S&P 500 -1.0%
0%50%
100%150%200%
Jun-
11
Oct
-11
Feb-
12Ju
n-12
Oct
-12
Feb-
13Ju
n-13
Oct
-13
Feb-
14Ju
n-14
Oct
-14
Feb-
15Ju
n-15
Oct
-15
Feb-
16
Large-Cap Power Services & Equipment +28.8%
S&P 500 +64.7%
10-year avg: 9.7x
9.8x 10.9x
8.6x 7.3x
9.7x 9.2x 9.0x
10.9x 10.9x 10.1x 9.9x
0.0x
2.0x
4.0x
6.0x
8.0x
10.0x
12.0x
2006 2007 2008 2009 2010 2011 2012 2013 2014 2015 2016 YTD

12
5-Year Trading vs. S&P 5001-Year Trading vs. S&P 500
Historical EV/LTM EBITDA
Source: Capital IQ
MID-CAP POWER SERVICES & EQUIPMENT
Market Data
Stock Performance LTM Multiple Evolution Forward Multiples
Change From 52-Week Performance EV/LTM EBITDA as of EV/EBITDA
Mkt. Cap EV 1 Month 1 Year % of High % of Low 1 Yr. Ago 6 Mos. Ago Current 2016E 2017P Mid-Cap Power Services & Equipment
Ametek Inc. $10,910 $12,741 (2%) (15%) 80% 108% 13.1x 12.8x 11.9x 12.1x 11.4x Hubbell Inc. $5,611 $6,267 (3%) (8%) 91% 126% 10.4x 8.6x 10.5x 10.8x 10.1x Valmont Industries, Inc. $3,130 $3,503 4% 11% 93% 148% 8.3x 7.6x 11.2x 10.0x 9.6x Littelfuse Inc. $2,634 $2,734 8% 19% 94% 141% 12.2x 10.9x 14.0x 12.2x 10.7x AZZ incorporated $1,552 $1,838 5% 14% 97% 132% 9.8x 9.6x 10.8x 11.0x 9.9x Badger Meter Inc. $1,055 $1,106 (0%) 13% 92% 140% 15.1x 14.7x 15.9x 16.0x 14.2x ESCO Technologies Inc. $1,039 $1,099 5% 5% 97% 128% 12.9x 12.1x 12.5x 11.0x 9.5x Thermon Group Holdings, Inc. $679 $688 12% (12%) 81% 148% 9.8x 9.4x 11.1x 10.9x 11.0x
Min (3%) (15%) 80% 108% 8.3x 7.6x 10.5x 10.0x 9.5x Median 4% 8% 93% 136% 11.3x 10.3x 11.5x 11.0x 10.4x Max 12% 19% 97% 148% 15.1x 14.7x 15.9x 16.0x 14.2x
0%
50%
100%
150%
Jun-
15
Jul-1
5
Aug-
15
Sep-
15
Oct
-15
Nov
-15
Dec-
15
Jan-
16
Feb-
16
Mar
-16
Apr-
16
May
-16
Jun-
16
Mid-Cap Power Services & Equipment +3.2%
S&P 500 -1.0%
0%50%
100%150%200%
Jun-
11
Oct
-11
Feb-
12Ju
n-12
Oct
-12
Feb-
13Ju
n-13
Oct
-13
Feb-
14Ju
n-14
Oct
-14
Feb-
15Ju
n-15
Oct
-15
Feb-
16
Mid-Cap Power Services & Equipment +81.5%
S&P 500 +64.7%
10-year avg: 10.9x
11.9x 12.1x 10.7x
9.3x 10.1x 9.6x
10.7x 11.6x 11.6x 11.3x 11.5x
0.0x
2.0x
4.0x
6.0x
8.0x
10.0x
12.0x
14.0x
2006 2007 2008 2009 2010 2011 2012 2013 2014 2015 2016 YTD
13
5-Year Trading vs. S&P 5001-Year Trading vs. S&P 500
Historical EV/LTM EBITDA
Source: Capital IQ
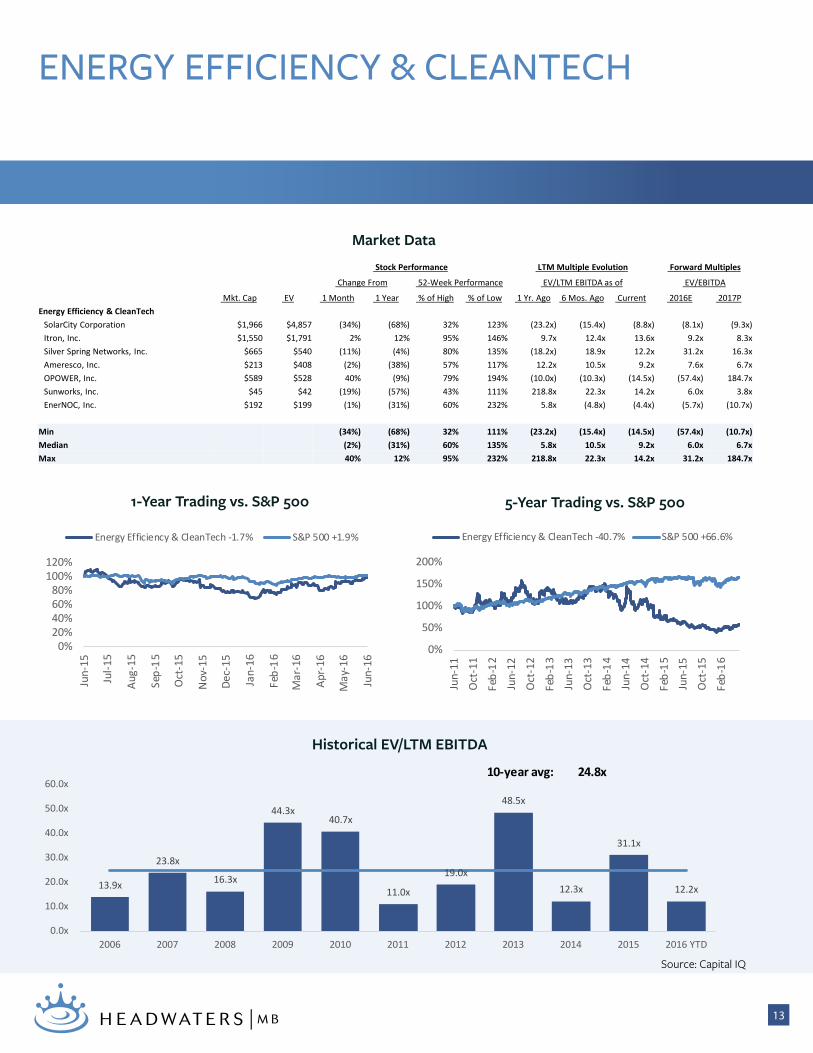
ENERGY EFFICIENCY & CLEANTECH
Market Data
Stock Performance LTM Multiple Evolution Forward Multiples
Change From 52-Week Performance EV/LTM EBITDA as of EV/EBITDA
Mkt. Cap EV 1 Month 1 Year % of High % of Low 1 Yr. Ago 6 Mos. Ago Current 2016E 2017P Energy Efficiency & CleanTech
SolarCity Corporation $1,966 $4,857 (34%) (68%) 32% 123% (23.2x) (15.4x) (8.8x) (8.1x) (9.3x)Itron, Inc. $1,550 $1,791 2% 12% 95% 146% 9.7x 12.4x 13.6x 9.2x 8.3x Silver Spring Networks, Inc. $665 $540 (11%) (4%) 80% 135% (18.2x) 18.9x 12.2x 31.2x 16.3x Ameresco, Inc. $213 $408 (2%) (38%) 57% 117% 12.2x 10.5x 9.2x 7.6x 6.7x OPOWER, Inc. $589 $528 40% (9%) 79% 194% (10.0x) (10.3x) (14.5x) (57.4x) 184.7x Sunworks, Inc. $45 $42 (19%) (57%) 43% 111% 218.8x 22.3x 14.2x 6.0x 3.8x EnerNOC, Inc. $192 $199 (1%) (31%) 60% 232% 5.8x (4.8x) (4.4x) (5.7x) (10.7x)
Min (34%) (68%) 32% 111% (23.2x) (15.4x) (14.5x) (57.4x) (10.7x)Median (2%) (31%) 60% 135% 5.8x 10.5x 9.2x 6.0x 6.7x Max 40% 12% 95% 232% 218.8x 22.3x 14.2x 31.2x 184.7x
0%20%40%60%80%
100%120%
Jun-
15
Jul-1
5
Aug-
15
Sep-
15
Oct
-15
Nov
-15
Dec-
15
Jan-
16
Feb-
16
Mar
-16
Apr-
16
May
-16
Jun-
16
Energy Efficiency & CleanTech -1.7% S&P 500 +1.9%
0%
50%
100%
150%
200%
Jun-
11
Oct
-11
Feb-
12Ju
n-12
Oct
-12
Feb-
13Ju
n-13
Oct
-13
Feb-
14Ju
n-14
Oct
-14
Feb-
15Ju
n-15
Oct
-15
Feb-
16
Energy Efficiency & CleanTech -40.7% S&P 500 +66.6%
10-year avg: 24.8x
13.9x
23.8x
16.3x
44.3x 40.7x
11.0x
19.0x
48.5x
12.3x
31.1x
12.2x
0.0x
10.0x
20.0x
30.0x
40.0x
50.0x
60.0x
2006 2007 2008 2009 2010 2011 2012 2013 2014 2015 2016 YTD
14
5-Year Trading vs. S&P 5001-Year Trading vs. S&P 500
Historical EV/LTM EBITDA
Source: Capital IQ
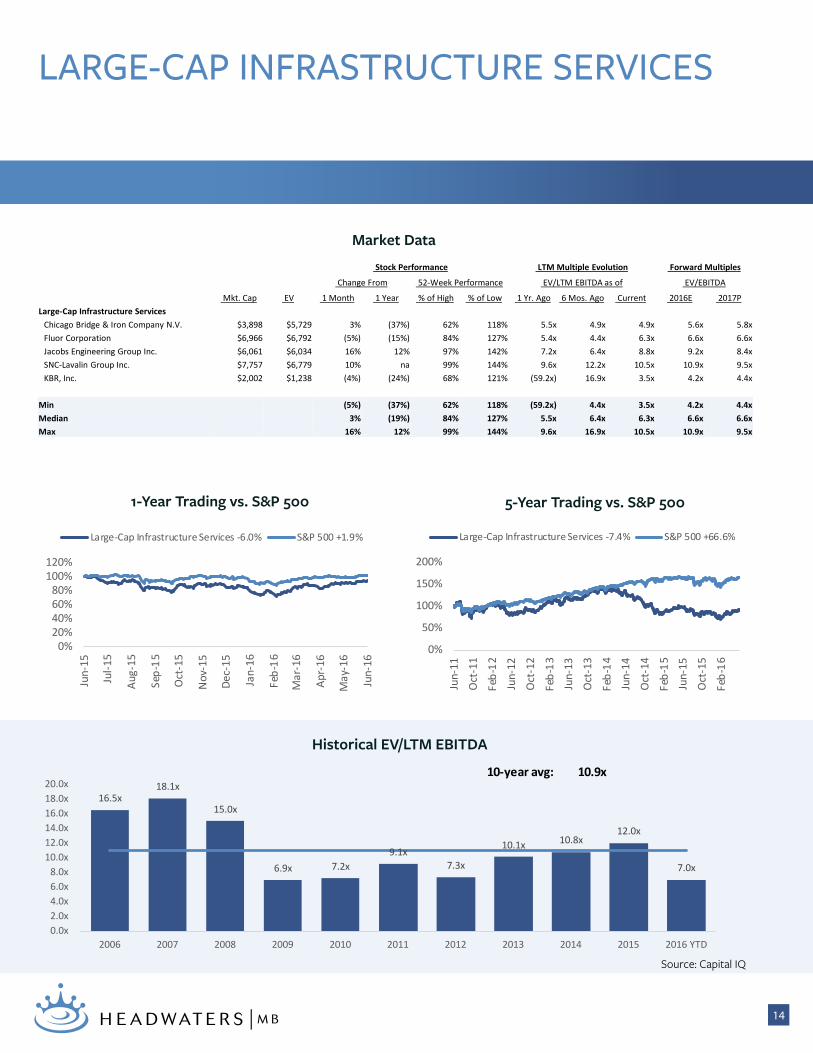
LARGE-CAP INFRASTRUCTURE SERVICES
Market Data
Stock Performance LTM Multiple Evolution Forward Multiples
Change From 52-Week Performance EV/LTM EBITDA as of EV/EBITDA
Mkt. Cap EV 1 Month 1 Year % of High % of Low 1 Yr. Ago 6 Mos. Ago Current 2016E 2017P Large-Cap Infrastructure Services
Chicago Bridge & Iron Company N.V. $3,898 $5,729 3% (37%) 62% 118% 5.5x 4.9x 4.9x 5.6x 5.8x Fluor Corporation $6,966 $6,792 (5%) (15%) 84% 127% 5.4x 4.4x 6.3x 6.6x 6.6x Jacobs Engineering Group Inc. $6,061 $6,034 16% 12% 97% 142% 7.2x 6.4x 8.8x 9.2x 8.4x SNC-Lavalin Group Inc. $7,757 $6,779 10% na 99% 144% 9.6x 12.2x 10.5x 10.9x 9.5x KBR, Inc. $2,002 $1,238 (4%) (24%) 68% 121% (59.2x) 16.9x 3.5x 4.2x 4.4x
Min (5%) (37%) 62% 118% (59.2x) 4.4x 3.5x 4.2x 4.4x Median 3% (19%) 84% 127% 5.5x 6.4x 6.3x 6.6x 6.6x Max 16% 12% 99% 144% 9.6x 16.9x 10.5x 10.9x 9.5x
0%20%40%60%80%
100%120%
Jun-
15
Jul-1
5
Aug-
15
Sep-
15
Oct
-15
Nov
-15
Dec-
15
Jan-
16
Feb-
16
Mar
-16
Apr-
16
May
-16
Jun-
16
Large-Cap Infrastructure Services -6.0% S&P 500 +1.9%
0%
50%
100%
150%
200%
Jun-
11
Oct
-11
Feb-
12Ju
n-12
Oct
-12
Feb-
13Ju
n-13
Oct
-13
Feb-
14Ju
n-14
Oct
-14
Feb-
15Ju
n-15
Oct
-15
Feb-
16
Large-Cap Infrastructure Services -7.4% S&P 500 +66.6%
10-year avg: 10.9x
16.5x 18.1x
15.0x
6.9x 7.2x 9.1x
7.3x
10.1x 10.8x 12.0x
7.0x
0.0x2.0x4.0x6.0x8.0x
10.0x12.0x14.0x16.0x18.0x20.0x
2006 2007 2008 2009 2010 2011 2012 2013 2014 2015 2016 YTD
15
5-Year Trading vs. S&P 5001-Year Trading vs. S&P 500
Historical EV/LTM EBITDA
Source: Capital IQ
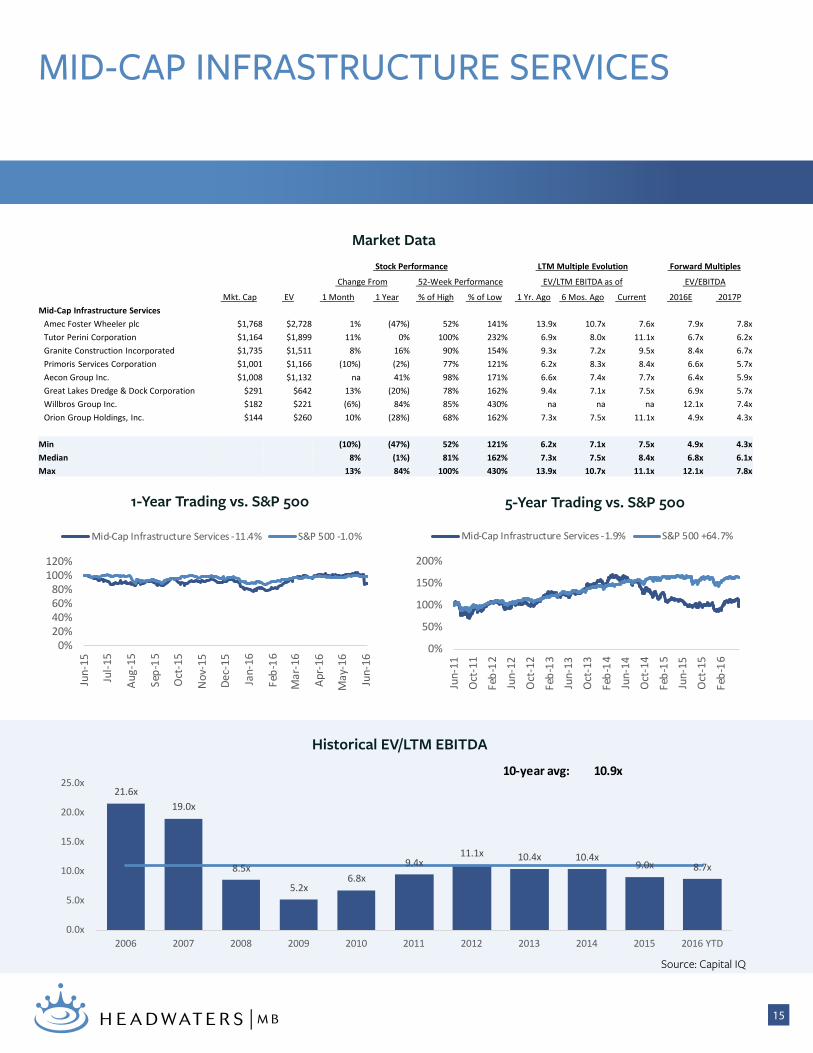
MID-CAP INFRASTRUCTURE SERVICES
Market DataStock Performance LTM Multiple Evolution Forward Multiples
Change From 52-Week Performance EV/LTM EBITDA as of EV/EBITDA
Mkt. Cap EV 1 Month 1 Year % of High % of Low 1 Yr. Ago 6 Mos. Ago Current 2016E 2017P Mid-Cap Infrastructure Services
Amec Foster Wheeler plc $1,768 $2,728 1% (47%) 52% 141% 13.9x 10.7x 7.6x 7.9x 7.8x Tutor Perini Corporation $1,164 $1,899 11% 0% 100% 232% 6.9x 8.0x 11.1x 6.7x 6.2x Granite Construction Incorporated $1,735 $1,511 8% 16% 90% 154% 9.3x 7.2x 9.5x 8.4x 6.7x Primoris Services Corporation $1,001 $1,166 (10%) (2%) 77% 121% 6.2x 8.3x 8.4x 6.6x 5.7x Aecon Group Inc. $1,008 $1,132 na 41% 98% 171% 6.6x 7.4x 7.7x 6.4x 5.9x Great Lakes Dredge & Dock Corporation $291 $642 13% (20%) 78% 162% 9.4x 7.1x 7.5x 6.9x 5.7x Willbros Group Inc. $182 $221 (6%) 84% 85% 430% na na na 12.1x 7.4x Orion Group Holdings, Inc. $144 $260 10% (28%) 68% 162% 7.3x 7.5x 11.1x 4.9x 4.3x
Min (10%) (47%) 52% 121% 6.2x 7.1x 7.5x 4.9x 4.3x Median 8% (1%) 81% 162% 7.3x 7.5x 8.4x 6.8x 6.1x Max 13% 84% 100% 430% 13.9x 10.7x 11.1x 12.1x 7.8x
0%20%40%60%80%
100%120%
Jun-
15
Jul-1
5
Aug-
15
Sep-
15
Oct
-15
Nov
-15
Dec-
15
Jan-
16
Feb-
16
Mar
-16
Apr-
16
May
-16
Jun-
16
Mid-Cap Infrastructure Services -11.4% S&P 500 -1.0%
0%
50%
100%
150%
200%
Jun-
11
Oct
-11
Feb-
12Ju
n-12
Oct
-12
Feb-
13Ju
n-13
Oct
-13
Feb-
14Ju
n-14
Oct
-14
Feb-
15Ju
n-15
Oct
-15
Feb-
16
Mid-Cap Infrastructure Services -1.9% S&P 500 +64.7%
10-year avg: 10.9x21.6x
19.0x
8.5x
5.2x 6.8x
9.4x 11.1x 10.4x 10.4x
9.0x 8.7x
0.0x
5.0x
10.0x
15.0x
20.0x
25.0x
2006 2007 2008 2009 2010 2011 2012 2013 2014 2015 2016 YTD

16
5-Year Trading vs. S&P 5001-Year Trading vs. S&P 500
Historical EV/LTM EBITDA
Source: Capital IQ
UTILITY SERVICES
Market Data
Stock Performance LTM Multiple Evolution Forward Multiples
Change From 52-Week Performance EV/LTM EBITDA as of EV/EBITDA
Mkt. Cap EV 1 Month 1 Year % of High % of Low 1 Yr. Ago 6 Mos. Ago Current 2016E 2017P Utility Services
Quanta Services, Inc. $3,549 $3,802 3% (23%) 77% 140% 8.7x 8.8x 8.3x 6.6x 6.0x MasTec, Inc. $1,951 $2,960 6% 10% 96% 190% 6.7x 8.6x 13.0x 7.0x 6.3x MYR Group, Inc. $451 $426 2% (19%) 75% 134% 6.3x 5.6x 5.6x 5.7x 5.2x
Min 2% (23%) 75% 134% 6.3x 5.6x 5.6x 5.7x 5.2x Median 3% (19%) 77% 140% 6.7x 8.6x 8.3x 6.6x 6.0x Max 6% 10% 96% 190% 8.7x 8.8x 13.0x 7.0x 6.3x
0%
50%
100%
150%
200%
Jun-
11
Oct
-11
Feb-
12Ju
n-12
Oct
-12
Feb-
13Ju
n-13
Oct
-13
Feb-
14Ju
n-14
Oct
-14
Feb-
15Ju
n-15
Oct
-15
Feb-
16
Utility Services +18.9% S&P 500 +64.7%
0%20%40%60%80%
100%120%
Jun-
15
Jul-1
5
Aug-
15
Sep-
15
Oct
-15
Nov
-15
Dec-
15
Jan-
16
Feb-
16
Mar
-16
Apr-
16
May
-16
Jun-
16
Utility Services -10.2% S&P 500 -1.0%
10-year avg: 9.7x15.6x 15.6x
11.5x
9.0x 8.4x 9.1x 8.1x 7.6x 7.6x
6.8x 7.6x
0.0x2.0x4.0x6.0x8.0x
10.0x12.0x14.0x16.0x18.0x
2006 2007 2008 2009 2010 2011 2012 2013 2014 2015 2016 YTD
17
5-Year Trading vs. S&P 5001-Year Trading vs. S&P 500
Historical EV/LTM EBITDA
Source: Capital IQ
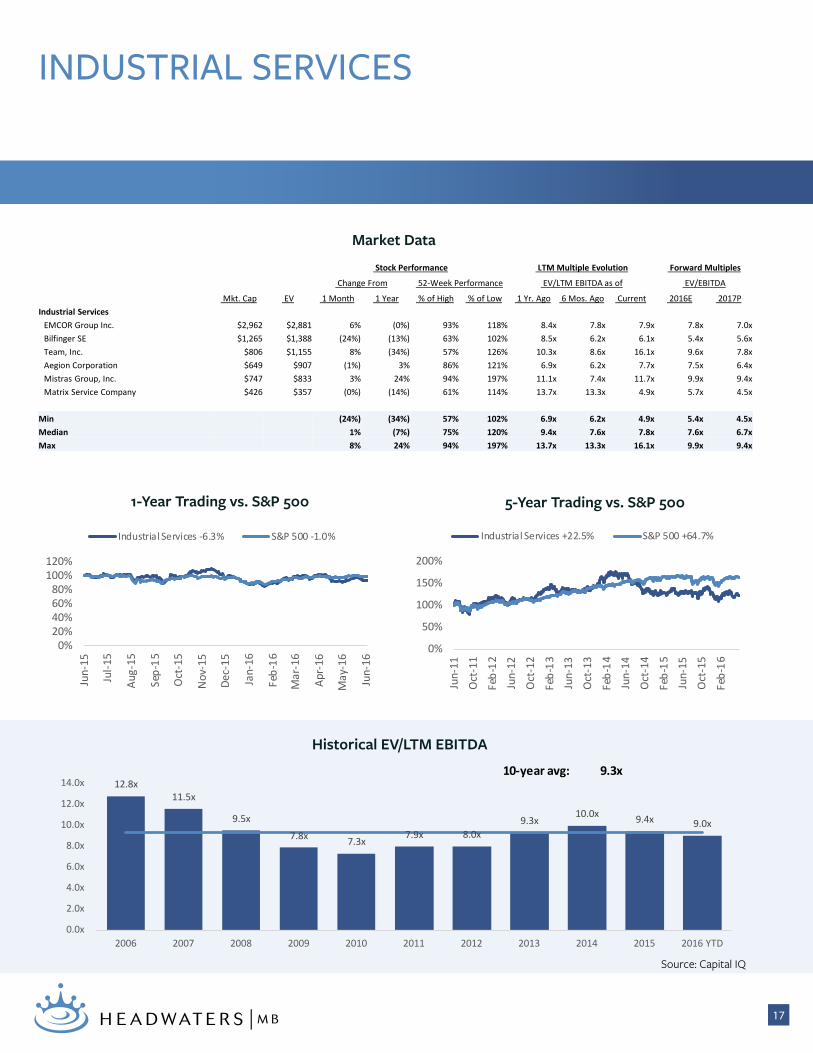
INDUSTRIAL SERVICES
Market Data
Stock Performance LTM Multiple Evolution Forward Multiples
Change From 52-Week Performance EV/LTM EBITDA as of EV/EBITDA
Mkt. Cap EV 1 Month 1 Year % of High % of Low 1 Yr. Ago 6 Mos. Ago Current 2016E 2017P Industrial Services
EMCOR Group Inc. $2,962 $2,881 6% (0%) 93% 118% 8.4x 7.8x 7.9x 7.8x 7.0x Bilfinger SE $1,265 $1,388 (24%) (13%) 63% 102% 8.5x 6.2x 6.1x 5.4x 5.6x Team, Inc. $806 $1,155 8% (34%) 57% 126% 10.3x 8.6x 16.1x 9.6x 7.8x Aegion Corporation $649 $907 (1%) 3% 86% 121% 6.9x 6.2x 7.7x 7.5x 6.4x Mistras Group, Inc. $747 $833 3% 24% 94% 197% 11.1x 7.4x 11.7x 9.9x 9.4x Matrix Service Company $426 $357 (0%) (14%) 61% 114% 13.7x 13.3x 4.9x 5.7x 4.5x
Min (24%) (34%) 57% 102% 6.9x 6.2x 4.9x 5.4x 4.5x Median 1% (7%) 75% 120% 9.4x 7.6x 7.8x 7.6x 6.7x Max 8% 24% 94% 197% 13.7x 13.3x 16.1x 9.9x 9.4x
0%
50%
100%
150%
200%
Jun-
11
Oct
-11
Feb-
12Ju
n-12
Oct
-12
Feb-
13Ju
n-13
Oct
-13
Feb-
14Ju
n-14
Oct
-14
Feb-
15Ju
n-15
Oct
-15
Feb-
16
Industrial Services +22.5% S&P 500 +64.7%
0%20%40%60%80%
100%120%
Jun-
15
Jul-1
5
Aug-
15
Sep-
15
Oct
-15
Nov
-15
Dec-
15
Jan-
16
Feb-
16
Mar
-16
Apr-
16
May
-16
Jun-
16
Industrial Services -6.3% S&P 500 -1.0%
10-year avg: 9.3x12.8x
11.5x
9.5x
7.8x 7.3x 7.9x 8.0x
9.3x 10.0x 9.4x 9.0x
0.0x
2.0x
4.0x
6.0x
8.0x
10.0x
12.0x
14.0x
2006 2007 2008 2009 2010 2011 2012 2013 2014 2015 2016 YTD
18
Recent Successes
WE ACTED AS SOLE ADVISOR TO THE SELLER
HAS BEEN ACQUIRED BY
A PORTFOLIO COMPANY OF
WE ACTED AS SOLE ADVISOR TO THE SELLER
A PORTFOLIO COMPANY OF
TO BE COMBINED WITH
HAS BEEN ACQUIRED BY
WE ACTED AS SOLE ADVISOR TO THE COMPANY
HAS SECURED SENIOR TERM FINANCING
$6,300,000
Oilfield ServicesFuel Distribution
Transaction Type:Sale of SubsidiaryBuyer DescriptionPE-backed strategic
Oilfield ServicesWaste & Container Solutions
Transaction Type:Private saleBuyer DescriptionPE-backed strategic
Industrial/OFSIndustrial tools and lighting
Transaction Type:PE SaleBuyer DescriptionPrivate Equity
Oil & GasOffshore E&P
Transaction Type:Capital RaiseBuyer DescriptionInstitutional Investor
WE ACTED AS SOLE ADVISOR TO THE SELLER
HAS BEEN ACQUIRED BY
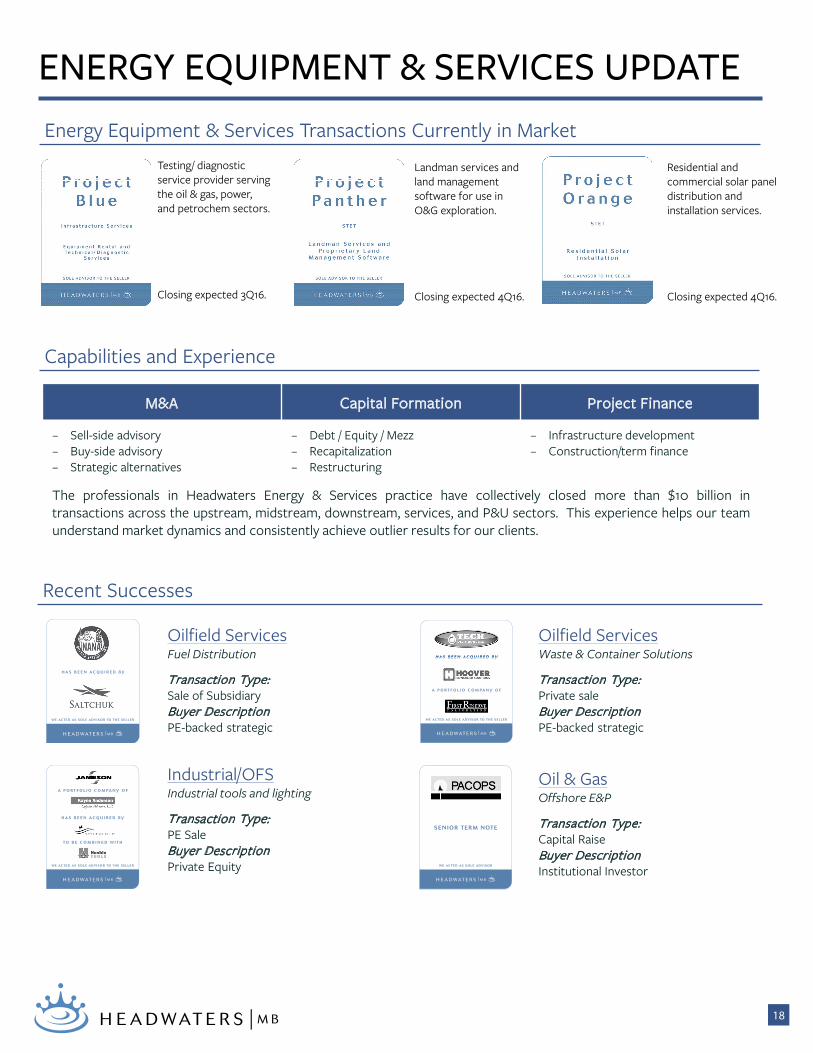
Energy Equipment & Services Update
Energy Equipment & Services Transactions Currently in Market
Testing/ diagnostic service provider serving the oil & gas, power, and petrochemsectors.
Closing expected 3Q16.
Equipment Rental and Technical/Diagnostic
Services
Oilfield Services
ProjectBlue
SOLE ADVISOR TO THE SELLER
Capabilities and Experience
M&A Capital Formation Project Finance
– Sell-side advisory– Buy-side advisory– Strategic alternatives
– Debt / Equity / Mezz– Recapitalization– Restructuring
– Infrastructure development– Construction/term finance
The professionals in Headwaters Energy & Services practice have collectively closed more than $10 billion intransactions across the upstream, midstream, downstream, services, and P&U sectors. This experience helps our teamunderstand market dynamics and consistently achieve outlier results for our clients.
Landman Services and Proprietary Land
Management Software
Oilfield Services
ProjectPurple
SOLE ADVISOR TO THE SELLER
Residential Solar Installation
Power Services
ProjectOrange
SOLE ADVISOR TO THE SELLER
Landman services and land management software for use in O&G exploration.
Closing expected 4Q16.
Residential and commercial solar panel distribution and installation services.
Closing expected 4Q16.
Recent Successes
WE ACTED AS SOLE ADVISOR TO THE SELLER
HAS BEEN ACQUIRED BY
A PORTFOLIO COMPANY OF
WE ACTED AS SOLE ADVISOR TO THE SELLER
A PORTFOLIO COMPANY OF
TO BE COMBINED WITH
HAS BEEN ACQUIRED BY
WE ACTED AS SOLE ADVISOR TO THE COMPANY
HAS SECURED SENIOR TERM FINANCING
$6,300,000
Oilfield ServicesFuel Distribution
Transaction Type:Sale of SubsidiaryBuyer DescriptionPE-backed strategic
Oilfield ServicesWaste & Container Solutions
Transaction Type:Private saleBuyer DescriptionPE-backed strategic
Industrial/OFSIndustrial tools and lighting
Transaction Type:PE SaleBuyer DescriptionPrivate Equity
Oil & GasOffshore E&P
Transaction Type:Capital RaiseBuyer DescriptionInstitutional Investor
WE ACTED AS SOLE ADVISOR TO THE SELLER
HAS BEEN ACQUIRED BY
ENERGY EQUIPMENT & SERVICES UPDATE
Testing/ diagnostic service provider serving the oil & gas, power, and petrochem sectors.
Closing expected 3Q16.
Landman services and land management software for use in O&G exploration.
Closing expected 4Q16.
Residential and commercial solar panel distribution and installation services.
Closing expected 4Q16.
WE ACTED AS SOLE ADVISOR TO THE SELLER
H A S B E E N A C Q U I R E D B Y
WE ACTED AS SOLE ADVISOR TO THE SELLER
A P O R T F O L I O C O M PA N Y O F
H A S B E E N A C Q U I R E D B Y
T O B E C O M B I N E D W I T H
WE ACTED AS SOLE ADVISOR TO THE SELLER
H A S B E E N A C Q U I R E D B Y
A P O R T F O L I O C O M PA N Y O F
SEN IOR TERM NOTE
WE ACTED AS SOLE ADVISOR
19
Disclosure: This newsletter is a periodic compilation of certain economic and corporate information, as well as completed and announced merger and acquisition activity. Information contained in this newsletter should not be construed as a recommendation to sell or buy any security. Any reference to or omission of any reference to any company in this newsletter should not be construed as a recommendation to buy, sell or take any other action with respect to any security of any such company. We are not soliciting any action with respect to any security or company based on this newsletter. The newsletter is published solely for the general information of clients and friends of Headwaters MB, LLC. It does not take into account the particular investment objectives, financial situation or needs of individual recipients. Certain transactions, including those involving early-stage companies, give rise to substantial risk and are not suitable for all investors. This newsletter is based upon information that we consider reliable, but we do not represent that it is accurate or complete, and it should not be relied upon as such. Prediction of future events is inherently subject to both known and unknown risks and other factors that may cause actual results to vary materially. We are under no obligation to update the information contained in this news-letter. Opinions expressed are our present opinions only and are subject to change without notice. Additional information is available upon request. The companies mentioned in this newsletter may be clients of Headwaters MB, LLC. The decisionsto include any company in this newsletter is unrelat-ed in all respects to any service that Headwaters MB, LLC may provide to such company. This newsletter may not be copied or reproduced in any form, or redistributed without the prior written consent of Headwaters MB, LLC. The information contained herein should not be construed as legal advice.
About Headwaters MB:Headwaters MB is an independent, middle-market investment banking firm providing strategic merger and acquisition, corporate finance, and merchant banking services through proprietary sources of capital. Named “Investment Bank of the Year” by the M&A Advisor in 2014, Headwaters MB is headquartered in Denver, CO, with six regional offices across the United States and partnerships with 18 firms covering 30 countries. For more information, visit www.headwatersmb.com
To learn more about how the Headwaters MB team can help you grow from opportunities in the Energy Equipment & Services sector, please contact:
Te d K i n s m a n | M a n a g i n g D i re c t o rE n e rg y E q u i p m e n t & S e r v i c e s3 0 3 .5 7 2 .6 01 3 t k i n s m a n @ h e a d w a t e r s m b. c o m
Ti m M c E u e n | S r. V i c e P re s i d e n tE n e rg y E q u i p m e n t & S e r v i c e s3 0 3 .9 6 2 .5 7 7 8 t m c e u e n @ h e a d w a t e r s m b. c o m
S a m u e l L . H i l l | M a n a g i n g D i re c t o rE n e rg y E q u i p m e n t & S e r v i c e s2 1 4 . 4 5 7. 4 8 3 2 h i l l @ h e a d w a t e r s m b. c o m
L u i s M o y a | V i c e P re s i d e n tE n e rg y E q u i p m e n t & S e r v i c e s2 1 4 . 8 1 4 .5 6 8 4 l m o y a @ h e a d w a t e r s m b. c o m


