47
Industry outlook 2016 27 November 2015

Industry outlook 2016
27 November 2015

Agenda
• Overall food and beverage
• Canned tuna
• Canned fruits and vegetables
2

3
Thailand’s GDP growth
Unit: %YOY
Domestic food and beverage consumption is expected to grow in line with gradual economic recovery and rising disposable income
0.7
6.5
7.8
2.52.5
0
1
2
3
4
5
6
7
8
9
10
2016f 2015e 2014 2013
2.9
2012 2011
0.1
2010
Domestic F&B value 1
Positive drivers: • Economy -- Stabilized and
recovery phrase
• Stabilized political situation
• Rising numbers of foreign tourists
Tourists
19%
Thais
82%
F&B expenditure in Thailand
Source: EIC analysis based on data from BOT

4
4.5
3.6
4.7
3.0
2.9
4.0
5.3
5.0
3.5
3.6
3.5
4.5
3.9
6.6
3.73.3
2.1
3.4
2.4
5.6
+24%
+12%
+14%
+19%
+21%
+13%
+16%
Snacks
+11%
Seasoning
Ready Meals
Pasta
Oils and Fats
Ice Cream
Dairy
Chilled Processed Food
Canned/Preserved Food
Bakery
2014-19 CAGR
2014-15
5.4
5.2
5.9
4.2
4.7
6.0
7.6
4.5+7%
Organic +15%
+29%
+15% Health & wellness
Functional
Naturally Healthy
2014-15
2014-19 CAGR
Rising urbanization and middle class will drive stronger demand for processed food, RTE, RTD and health & wellness food in Thailand
Growth of packaged food sales in Thailand
Unit: %
Growth of health & wellness food sales in Thailand
Unit: %
Source: EIC analysis based on data from Euromonitor
Domestic F&B value 1

5
Export of F&B 2
Thailand’s food export by main category
Unit: %
Other F&B export value
Unit: billion THB
ASEAN
22%
Japan 13%
China
12%
Africa
12% EU
11%
US 11%
Middle East 4%
Oceania
3%
Others
12%
Seafood 37%
Meat
18%
Other F&B 45%
Thai food importer
Unit: %
251
45%
10%
2013
241
2014
21%
19%
+8%
4%
41%
26%
19%
4%
11%
2012
237
44%
24%
19%
3% 10%
2011
219
46%
25%
16%
3% 11%
2010
182
44%
26%
15%
3% 12%
Starch +3% Dairy +17%
Others Fruit & Veg +9% Beverage +15%
At present, “ASEAN” represents Thailand’s largest food export destination, accounting for about 22% of total shipments, followed by Japan and China
Source: EIC analysis based on data from NFI

6
-1
0
1
2
3
4
5
6
7
8
9
10
11
2018f 2014 2010
US
Japan
China
MENA
ASEAN-5
EM
EU
World
46
77
52 49
78
54 52
79
56
+4%
+1%
+5%
EM DM World
2020f 2015e 2010
* Poverty line = Income below USD 1.25 /day
Not surprisingly, attention has turned to emerging markets as this region is still relatively underfed and is poised for rapid economic growth
GDP growth forecast Unit: %YOY
Urban population Unit: % of total
Source: EIC analysis based on data from IMF and UN
Export of F&B 2
Emerging markets (EM) will add nearly 3 billion people---more than 40% of total’s population--- to the middle class by 2050
This means a lot of people who will be entering the consumer economy and spending more money on food and beverage

7
809
+6.9%
2020f
1,375
2012
2020f
7.7
25%
75%
2010
6.9
23%
77%
2000
6.1
21%
79%
Muslim +1.9% Non-muslim +1.0%
7.2 7.3
2017f 2010 2014 2011
6.9
2012 2015f
7.0 7.0
2016f
7.4 7.1
2013
7.4
+1%
2018f
7.5
Source: EIC analysis based on data from NFI, IMF, Trademap, UN and World Halal Summit Report
World population
Unit: Billion persons
Aging population
Unit: Million persons
Muslim population
Unit: Million persons
Export of F&B 2
Food serving Aging and Muslim population sees expanding opportunities and bigger room to grow in the future
Halal food, an area deemed to have high attention as this specialty sector is
expanding very rapidly

8
Medical food is another emerging specialty sector, reflecting the vibrancy of the Thai food industry
Medical food consists of products specially formulated for the dietary
management of diseases with distinctive nutritional needs that cannot be met by a
normal diet
• Many leading medical food manufacturers are establishing facilities in Thailand, attracted by the country’s rich agricultural raw materials, skilled and affordable labor, high quality control standard, cost-effective manufacturing, strategic location in the Asia-Pacific market and attractive incentives
• Business in this sector also benefit from the world-class reputation of Thailand’s medical services industry (health tourism), which attracts about 2 million foreign patients annually
Source: EIC analysis based on data from BOI

9
84
43
2013
+15%
2018f
23%
43%
Others
N. America
Europe
34%
66
34
2018f
+14%
2013
932
2019f
1,100 +3%
2014
Rising health awareness amongst consumers will contribute stronger sales for health and wellness F&B products, esp. in the developed economies
Global H&W food market
Unit: USD billion
Global organic F&B market
Unit: USD billion 2013: 80.4 USD billion
Export of F&B 2
Source: EIC analysis based on data from Merrill Lynch, Euromonitor, BCC Research and Agrarmarkt Austria Marketing
10
51
118
2339
5
48
72
9
17
10
32
17
3
35
Milk Seafood Oil Sugar Starchy roots
Cereal exc. Beer
Meat Alcoholic beverages
Fruits Vegetables
2002 2014
844741
+3%
2018f 2013
442
336
+6%
2014 2019f
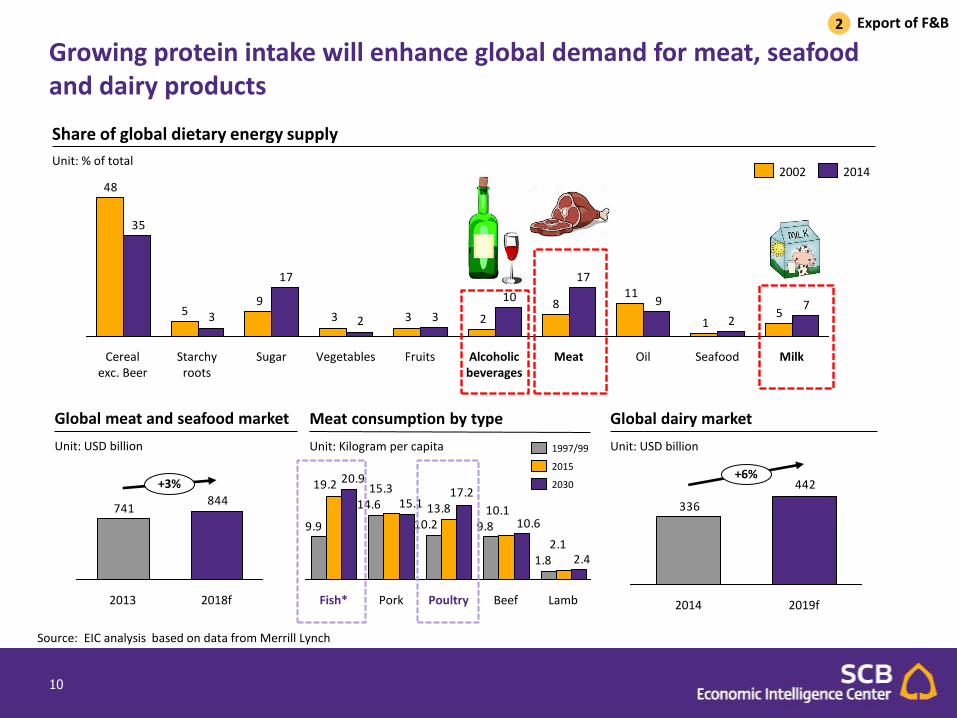
Growing protein intake will enhance global demand for meat, seafood and dairy products
Share of global dietary energy supply
Unit: % of total
Global meat and seafood market
Unit: USD billion
Global dairy market
Unit: USD billion
Source: EIC analysis based on data from Merrill Lynch
Meat consumption by type
Unit: Kilogram per capita
1.8
9.810.2
14.6
9.9
2.1
10.113.8
15.319.2
2.4
10.6
17.215.1
20.9
Fish* Pork Poultry Beef Lamb
1997/99
2030
2015
Export of F&B 2

11
13%
2014
14%
1,516
10%
64%
11% 11%
2,580
2010
3%
+14%
67%
6%
2%
Others +1%
India +28% Vietnam +13%
Thailand +15% Canada +16%
17% 4% 6%
Indonesia
Hong Kong
Others
30%
US
Vietnam
21%
22% China
Source: EIC analysis based on data from Trademap
Chinese demand for Thai fruits will continue to rise steadily over the forecasted period
Export of F&B 2
Major destination of Thai fruits export, 2014
Unit: % of total
China fruit imports, by supplying country
Unit: USD million
Thailand is the main supplier of fresh fruits in China, accounting for almost 70% of total imports

12
Likewise, demand for Thai dairy products is also expected to grow steadily, particularly among our neighboring countries
Export of F&B 2
12%
10%
8%
5% 4%
16%
2010
+35%
20%
9%
16%
13%
8% 9%
4% 1%
20%
+31%
+37%
+9%
2014
262
19%
13%
13%
189
Cambodia +7%
Hong Kong +17%
Singapore +4%
Laos +6%
Philippines +15%
Myanmar +5%
US +16%
Germany +66%
Others +3%
Buttermilk & yogurt
31%
Sweetened milk
20%
Milk
12% Whey
6%
Others
31%
Import
Domestic
Production
2,602
57%
43%
Domestic
2,602
Export
Consumption
93%
7%
Source: EIC analysis based on data from Trademap
Major destination of Thai dairy products
Unit: USD million
Thai dairy export products, 2014
Unit: %
Thai dairy industry, 2014
Unit: ‘000 ton

Growth of alcoholic drinks in Thailand is lagging, but non-alcoholic drinks are gradually picking up the slack
13
100%
2013
569,376
54.12%
45.88% 44.58%
55.42%
2009
716,979
2012
676,473
45.95%
54.05%
2011
629,614
45.23%
54.77%
2010
600,648
45.17%
54.83%
Market share of beverage industry in Thailand Unit: THB million
Source: EIC analysis based on data from Euromonitor
Non-alcoholic drinks Alcoholic drinks
332,291
2012
37,903
285,378
+7%
2013
74,194
35,490
2011
62,728 68,935
312,145
33,279
2010
271,342
61,750
31,345
2009
253,803
29,297
56,238
178,246
220,194
168,268
207,721 189,372
Dairy
Hot drinks
Soft drinks
Market size of non-alcoholic drinks in Thailand Unit: THB million
66.3%
11.4%
22.3%
Remark: Hot drinks = coffee, tea and other hot drinks Soft drinks = carbonates, fruit and vegetable juice, bottled water, functional drinks, concentrates, RTD tea/coffee, concentrates and Asian specialty drinks
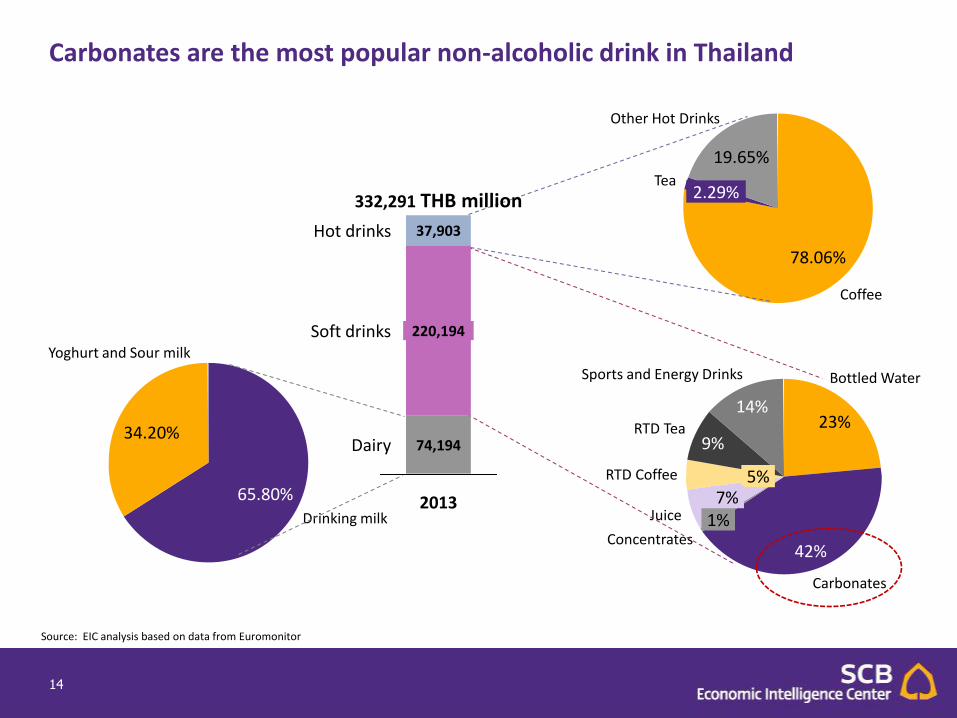
Carbonates are the most popular non-alcoholic drink in Thailand
14
Sports and Energy Drinks
14% RTD Tea
9%
RTD Coffee 5%
Juice 7%
Concentrates 1%
Carbonates
42%
Bottled Water
23%
Source: EIC analysis based on data from Euromonitor
Other Hot Drinks
19.65% Tea
2.29%
Coffee
78.06%
Dairy
Soft drinks
Hot drinks
2013
332,291 THB million
74,194
220,194
37,903
Yoghurt and Sour milk
34.20%
Drinking milk
65.80%

In 2014, carbonates continued to grow continuously in terms of both volume and value sales
15
Source: EIC analysis based on data from Euromonitor
Off-trade vs On-trade sales of carbonates (volume) Unit: Million litres
Off-trade vs On-trade sales of carbonates (value) Unit: THB million
624 631613 688667670
1,833 2,003
2,471
1,840
2010
2,457 2,640
1,807
2011
2,421
2009 2013 2012
2,055
2014
1,971
2,670 2,742
+2.5%
Off-trade On-trade
55,461
25,765
88,595
2014
53,432 60,597
2013
26,657 28,780
2012
81,052
54,395
62,968
2011
82,650
27,189 30,146
2010
89,377
59,565
2009
93,115
29,030
+3.3%
79,196
On-trade Off-trade

However, with recent strong competition in soft drinks, especially healthy drinks, carbonate’s growth tended to slow over the forecast period
16
Source: EIC analysis based on data from Euromonitor
Off-trade sales of carbonates by category (volume) Unit: Million litres
2014 2011
2,165 2,216
2009 2015 2016 2017
+2.6%
2019
2,092 2,055
+2.0%
2010 2012 2018
2,124
2,274
2013
2,003
1,840 1,833 1,807
1,971
Cola carbonates Non-cola carbonates • Rising health awareness: Carbonates’
players were required to develop innovative drinks which created a perception of reduced sugar content and healthy attributes, such as no sugar added, low calories or flavors, in order to drive sales and stimulate consumer interest
• Packaging redesign is another major strategic moves of key domestic players
Personalize packaging to give as a gift: Coca-Cola (Thailand) Ltd. Created name printing on its bottles
Pepsi-Cola (Thai) Trading Co. Ltd. Developed its bottle and can packaging to be slimmer and easier to carry, and provided a variety of sizes of selection

Sports and energy drinks in Thailand is expected to continue recording moderate growth over the forecast period
17
Source: EIC analysis based on data from Euromonitor
Off-trade sales of sports and energy drinks by category Unit: Million litres
537
583 +4.1%
2018
302
225
2015 2014
292
214
498 516
284
2013
477
202
275
2012
450
327
262
2011
413
174
239
2010
397
160
237
2009
379
146
233
235
363
134
229
314
188
559
245 255
+5.6%
2016 2017 2008
Sports drinks Energy drinks Energy drinks: • The consumer perception of these
products has changed as white-collar workers are responding positively to energy drinks
• While blue-collar workers remained loyalty to energy drinks
• Some students opt for energy drinks to help them stay awake longer to study harder for final exams
Sport drinks: • Growing popularity of outdoor activities
Badminton and tennis Riding a bike Golfing
• Sports drinks are perceived as necessary choice to prevent dehydration
• New brands and innovative products with added vitamins and minerals helped promote stronger sales

The market is dominated by a few key players, which are very powerful within the beverages industry
18
Source: EIC analysis based on data from Euromonitor
Brand shares of Off-trade sports and energy drinks Unit: % Off-trade volume
28.9%
Sponsor
27.5%
M-150
11.0%
Carabao Dang
6.9%
9.9% Red Bull
M 4.3%
Shark 11.5%
Others
Competitive landscape: It is unlikely that small or medium-sized
players will enter into this category
Instead, it is expected that existing players will be active in promoting their products portfolios
Expected strategic moves:
• New, innovative products serving females, urban dwellers and young professionals …
Mixed berry and mixed fruits

Another eye-catching segment is RTD tea and coffee, which recorded impressive growth in the recent years
19
Source: EIC analysis based on data from Euromonitor
Off-trade sales of RTD tea and coffee in Thailand Unit: THB million
33,940
11,477
0
5,000
10,000
15,000
20,000
25,000
30,000
35,000
2008 2010 2012 2014 2016 2018 2020
RTD coffee
+11.7%
+2.4%
RTD tea
11.1%
30.0%
Ichitan
Puriku
25.8%
Others
Lipton
Oishi
13.1% 20.0%
Others
28.2%
63.0%
8.8%
Nescafe
Birdy

20
EIC views that domestic demand for RTD tea and coffee is expected to be promising over the forecast period
Key driving factors:
RTD tea
• Healthier lifestyles among Thai consumers
RTD tea is a great choice for health-conscious consumers
• Intense efforts by manufacturers to boost sales
A wide selection of product varieties
Attractive promotional support and various campaigns
Product innovation – new flavors, low-sugar RTD tea and sugar-free RTD tea
RTD coffee
• Growing number of coffee lovers in Thai society in the coming years Demand for RTD coffee will also
benefit from this trend
• Urbanized and busier lifestyles
• The expansion of modern grocery retailing
• More premium products being developed targeted a growing niche of young urban consumers
Source: EIC analysis based on data from Euromonitor

Global health and wellness trend is the key driver of the non-alcoholic drinks market
21
Export drinks in 2014
Unit: USD million
Alcohol 21.08%
Non-alcohol
78.92%
Dairy products
11%
Other
1%
Fruit Juice
32%
Soft drinks 3%
Functional drinks
52%
21%
Other
Beer
52%
Wine 7%
Whisky
21%
Source: analyzed by EIC using information from Ministry of Commerce
100% = 2,066.1 million Dollar

Asia was the biggest market for every categories of drinks, except fruit juice which exported to North America the most
22
Other
2%
Asia
98%
Dairy 100% = 183.7million Dollar
Other
4%
Europe
4%
Asia
92%
Soft drinks 100% = 56.3million Dollar
Other
1%
Africa
4%
North america 2%
Asia
94% Other
1%
Australia
8%
Africa
4%
North America 38%
Europe
17%
Asia 33%
Energy drinks 100% = 853.2million Dollar
Fruit juice 100% = 527million Dollar
Export markets of beverage in 2014 (by region)
Unit: USD million
Source: analyzed by EIC using information from Ministry of Commerce
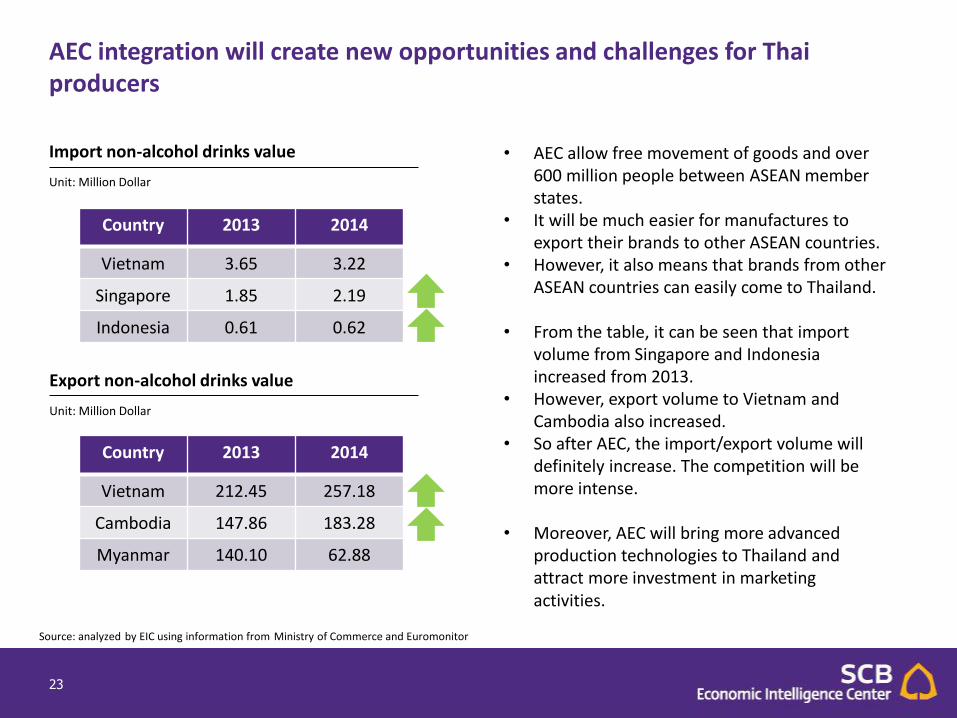
AEC integration will create new opportunities and challenges for Thai producers
23
Country 2013 2014
Vietnam 3.65 3.22
Singapore 1.85 2.19
Indonesia 0.61 0.62
Import non-alcohol drinks value
Unit: Million Dollar
Export non-alcohol drinks value
Unit: Million Dollar
Country 2013 2014
Vietnam 212.45 257.18
Cambodia 147.86 183.28
Myanmar 140.10 62.88
Source: analyzed by EIC using information from Ministry of Commerce and Euromonitor
• AEC allow free movement of goods and over 600 million people between ASEAN member states.
• It will be much easier for manufactures to export their brands to other ASEAN countries.
• However, it also means that brands from other ASEAN countries can easily come to Thailand.
• From the table, it can be seen that import volume from Singapore and Indonesia increased from 2013.
• However, export volume to Vietnam and Cambodia also increased.
• So after AEC, the import/export volume will definitely increase. The competition will be more intense.
• Moreover, AEC will bring more advanced production technologies to Thailand and attract more investment in marketing activities.
24
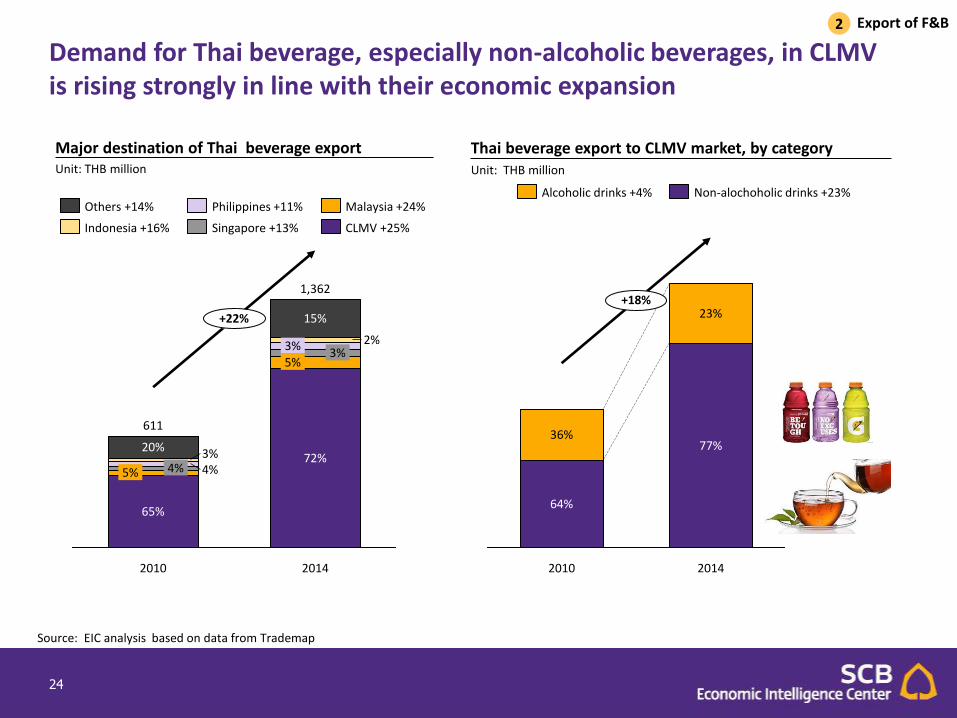
+22%
2014
1,362
72%
5% 3%
3% 2%
15%
2010
611
65%
5% 4% 4% 3% 20%
CLMV +25%
Malaysia +24%
Singapore +13%
Philippines +11%
Indonesia +16%
Others +14%
+18%
2014
77%
23%
2010
64%
36%
Non-alochoholic drinks +23% Alcoholic drinks +4%
Demand for Thai beverage, especially non-alcoholic beverages, in CLMV is rising strongly in line with their economic expansion
Export of F&B 2
Source: EIC analysis based on data from Trademap
Thai beverage export to CLMV market, by category Unit: THB million
Major destination of Thai beverage export Unit: THB million

25
EIC view that strong fundamentals all the way around will sustain the growth and prosperity of Thailand’s ample food industry
Segment Key drivers 2016
Outlook MT
Outlook
Domestic & Import
• Population growth
• Economic recovery
• Higher disposable income
• Rising of middle-income class
• Rising urbanization
Export • Macro trend
Economic change
Demographic change
Demand change
• Demand for Thai fruits in China
• Demand for Thai beverage in CLMV
• Demand for Thai dairy products from Asian countries
Positive
G
Positive
G
Positive
G
Positive
G
Source: EIC analysis
Agenda
• Overall food and beverage
• Canned tuna
• Canned fruits and vegetables
26
27
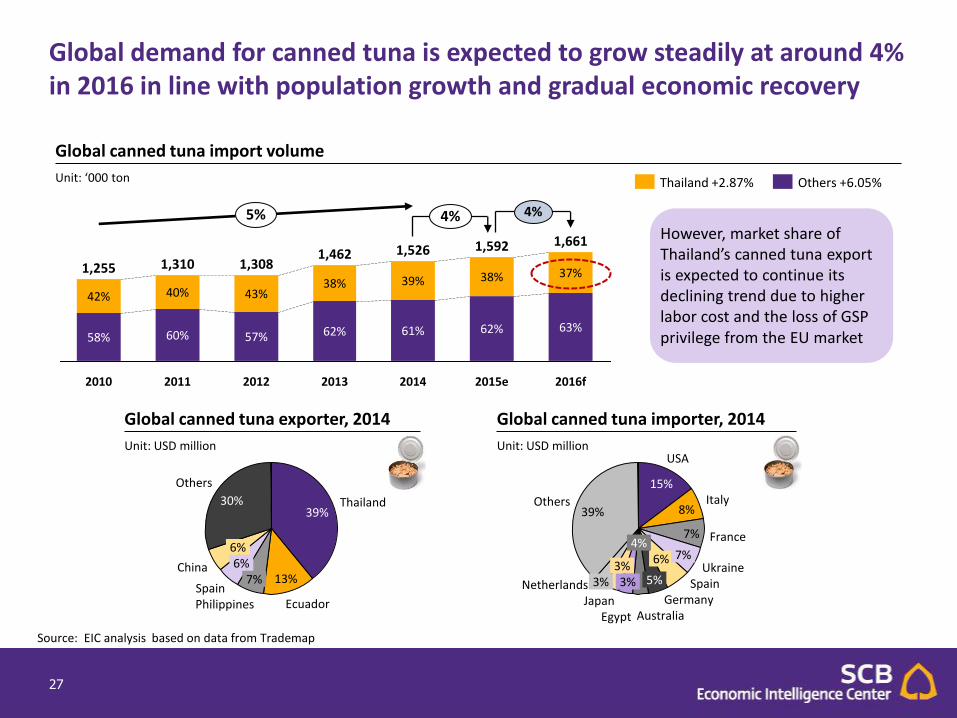
Global demand for canned tuna is expected to grow steadily at around 4% in 2016 in line with population growth and gradual economic recovery
38%
2014
1,526
61%
39%
4%
1,462
62%
38%
2012
1,308
57%
43%
2011
1,310
60%
40%
2010 2015e
58%
42%
1,592
4% 5%
2013 2016f
1,661
63%
37%
62%
1,255
Others +6.05% Thailand +2.87%
Others
30%
China
6%
Spain
6%
Philippines
7%
Ecuador
13%
Thailand 39%
Netherlands
Others 39%
3%
Japan
3%
Egypt
3%
Australia
4%
Germany
5% Spain
6% Ukraine
7%
France 7%
Italy 8%
USA
15%
Global canned tuna import volume
Unit: ‘000 ton
Global canned tuna exporter, 2014
Unit: USD million
Global canned tuna importer, 2014
Unit: USD million
However, market share of Thailand’s canned tuna export is expected to continue its declining trend due to higher labor cost and the loss of GSP privilege from the EU market
Source: EIC analysis based on data from Trademap

28
While Thailand’s canned tuna export value is expected to grow marginally from this year but still much lower than the average growth in the past
Thailand’s canned tuna export value
Unit: USD million
Thailand’s canned tuna export volume
Unit: ‘000 ton
0
500
1,000
1,500
2,000
2,500
3,000
-15
-10
-5
0
5
10
15
20
25
30
35
2014 2010 2013 2016f 2015e 2011 2012
+2% -14%
+10%
Value %YOY
-2
0
2
4
6
8
10
500
0
100
200
300
400
600
700
2015e 2014 2016f
+1% +3%
2013 2012
0%
2011 2010
%YOY Volume
Source: EIC analysis based on data from MOC
• Mild tuna price recovery • Falling demand from the key trading partner (U.S) • Higher competition from Ecuador and the
Philippines, which still receive GSP privilege
Driver Driver

29
American, our key trading partner, fell out of love with canned tuna! This shift of preference is due to growing interest in fresh and organic foods among U.S. consumers
-3%
2014
237
2013
226
2012
234
2011
248
2010
267
2.3
2.7
3.53.7
-5%
-3%
-1%
2013 2010 2000 1990
U.S. canned tuna import volume
Unit: ‘000 ton
U.S. annual per capita consumption of canned tuna
Unit: lbs per person
Source: EIC analysis based on data from Trademap and Merrill Lynch

30
At the same time, global competition in canned tuna market will become even more intensify, reflecting by a gradual decline of our market share
5%
2014
1,526
39%
13%
7% 6% 6%
27%
2011
1,310
44%
9%
6% 6%
4%
31%
2010
1,255
47%
7% 8%
6% 3% 7%
7%
12%
43%
1,308
2012
30%
5% 4% 5%
10%
12%
38%
1,462
2013
30%
30%
Thailand +0.29% Ecuador +23.70% Philippines +2.23% Spain +3.52% China +23.25% Others +5.18%
Global canned tuna exporter
Unit: ‘000 ton
Source: EIC analysis based on data from Trademap
31
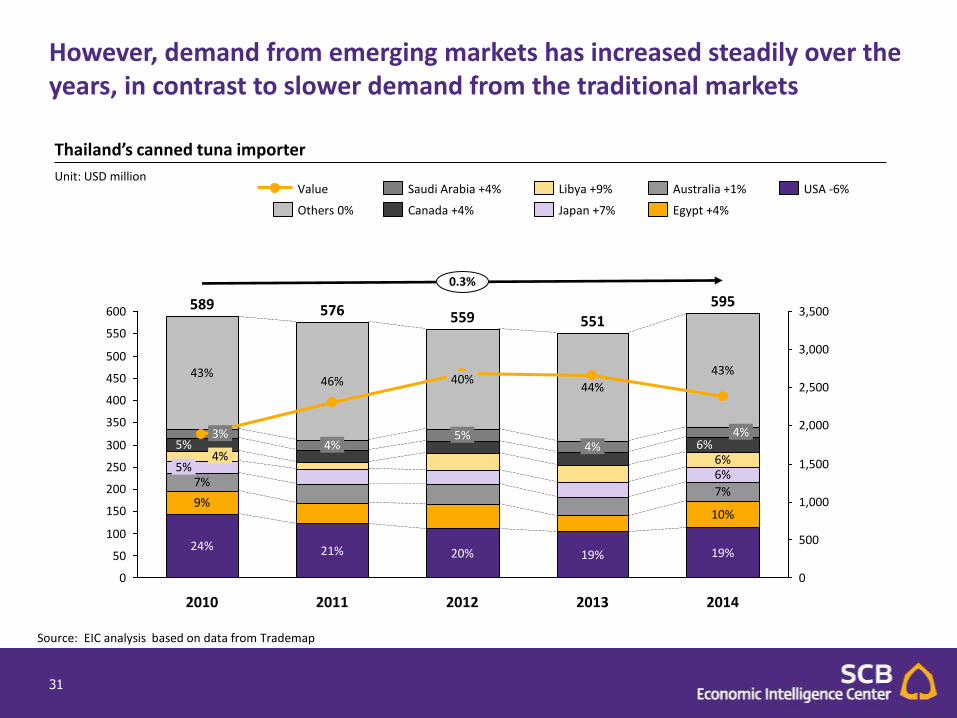
However, demand from emerging markets has increased steadily over the years, in contrast to slower demand from the traditional markets
3,500
3,000
2,500
2,000
1,500
1,000
500
0
600
550
500
450
400
350
300
250
200
150
100
50
0
0.3%
2014
595
19%
10%
7%
6% 6%
43%
2013
551
44%
2012
559
40%
2011
576
46%
2010
589
24%
9%
7% 5%
4%
43%
3% 4% 4%
5% 4% 6% 5%
21% 20% 19%
USA -6%
Egypt +4%
Australia +1%
Japan +7%
Libya +9%
Canada +4%
Saudi Arabia +4%
Others 0%
Value
Thailand’s canned tuna importer
Unit: USD million
Source: EIC analysis based on data from Trademap

32
Recent developments and key challenges in Thai seafood industry:
Source: EIC analysis
• Supply chain strengthening – vertical integration • Product and geographic diversification • Inventory management efficiency • Enhance cost competitiveness through EOS • To counter trade barriers
Relocation of production base
1
Tier-3
2
IUU threat
3
The GSP cut
4
Labor shortage
5
• Thailand remains at “Tier-3” on 2015 U.S. TIP report • Reasons: labor abuses in seafood industry • However, at the moment, no trade sanction has been
imposed on Thailand
• On April 2015, the EU issue an official warning or “Yellow Card” on Thai seafood industry, citing concerns over IUU fishing in Thailand and by Thai vessels
• If problems not solved in an effective manner within specific timeframe, trade sanctions will be imposed
• Thailand loses EU export preferences (GSP) in 2015 • Over 6,200 Thai products including seafood will be
removed from the GSP benefit • This will likely cause Thailand to lose a competitive edge to
other trade rivals who still receive the GSP
• Thai fishing industry faces labor shortage (particularly crew members) as neighboring (CLM) economies grow
• Seafood industry depend heavily on migrant workers • Labor shortage is expected to worsen: 1) birthrate is
declining 2) Thais seek higher education opportunities

Agenda
• Overall food and beverage
• Canned tuna
• Canned fruits and vegetables
33
34
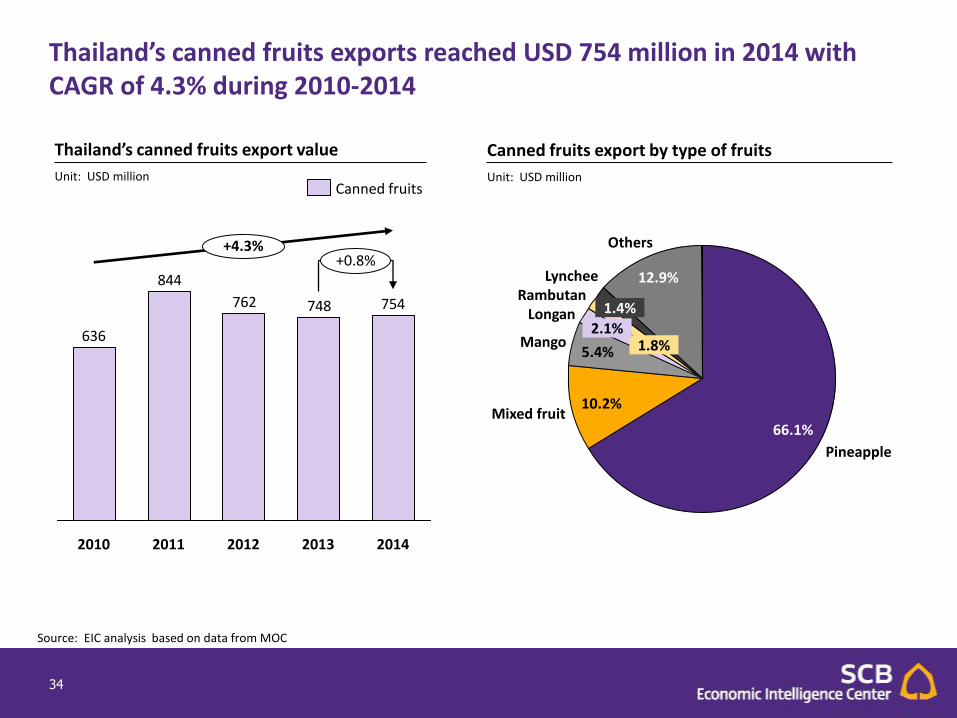
Thailand’s canned fruits exports reached USD 754 million in 2014 with CAGR of 4.3% during 2010-2014
Thailand’s canned fruits export value
Unit: USD million
Source: EIC analysis based on data from MOC
754748762
844
636
+0.8% +4.3%
2014 2013 2012 2011 2010
Canned fruits
Others
12.9% Lynchee
1.4% Rambutan
1.8%
Longan 2.1%
Mango 5.4%
Mixed fruit 10.2%
Pineapple
66.1%
Canned fruits export by type of fruits
Unit: USD million

35
2000 2002 2004 2006 2008 2010 2012 2014
700
500
1,300
900
1,100
1,000
600
800
1,200
1,400 +6% others
Russian
USA
24%
Japan 3%
31%
5%
37% EU-27
ทีม่า : การวเิคราะหโ์ดย EIC จากขอ้มลูของ Trademap
The global market for canned pineapple witnessed growth in recent years due to rising demand for convenience food
Global imports of canned pineapple Unit: USD million
Major importers of canned pineapple Unit: % of total import value

36
ทีม่า : การวเิคราะหโ์ดย EIC จากขอ้มลูของ FAOSTAT
Indonesia
5%
Brazil
Philippines
25%
36% Thailand
Kenya
6%
11%
Others
17%
Thailand’s the world’s largest producer and exporter of canned pineapple
100% = 3,341,179.8 ton
17%
7%
Others
Indonesia
Kenya
Philippines
12%
Thailand
16%
47%
Major producer of canned pineapple Unit: % of total production
Major exporter of canned pineapple Unit: % of total export value
100% = USD 1,081 million
37
ทีม่า : การวเิคราะหโ์ดย EIC จากขอ้มลูของกระทรวงพาณชิย ์(MOC)
0
50
100
150
200
250
2004 2006 2008 2010 2012 2014
ASEAN (9) Japan USA EU (27)
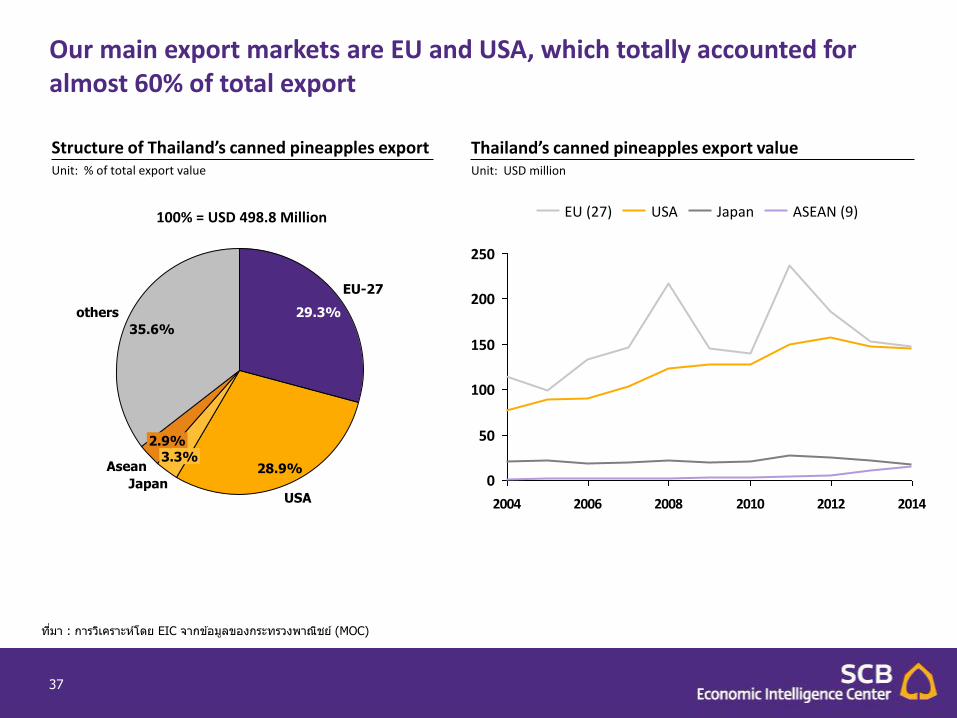
others
35.6%
Asean
2.9%
Japan
3.3%
USA
28.9%
EU-27
29.3%
100% = USD 498.8 Million
Structure of Thailand’s canned pineapples export Unit: % of total export value
Our main export markets are EU and USA, which totally accounted for almost 60% of total export
Thailand’s canned pineapples export value Unit: USD million

38
ทีม่า : การวเิคราะหโ์ดย EIC จากขอ้มลูของ Trademap
446437476
564
413
2010 2014
1.9%
2012 2011 2013
31.8%24.9% 26.4% 29.9% 29.2%
14.8%
14.0% 14.8%12.1% 15.8%
13.2%
13.3% 11.2%15.9%
15.9%
40.3%47.8% 47.6%
42.1% 39.1%
2013 2014 2010 2012 2011
Others Indonesia Kenya Thailand
EU’s import value of canned pineapple
Unit: USD million
Our competitiveness in the EU is expected to continue its declining trend over the coming years

39
#GSP impact
Major competitors in canned pineapple market
Indonesia Still receive GSP privilege
Philippines Still receive GSP privilege
ทีม่า : การวเิคราะหโ์ดย EIC จากขอ้มลูของ Trademap
Average pineapple export to EU 2009-2013 (THB mil) 5,359.06
Average GSP utilization rate 88.32%
New Tax rate 25.6%
Old GSP Tax rate 22.1%
Amount effected (THB mil) 165.7
3.5%
Export unit value of major exporters of canned pineapple
Unit: USD/ton
991957
500
600
700
800
900
1,000
1,100
-17%
3.5%
2015F 2014 2013 2012 2011 2010
Thailand Philippines Indonesia
Key challenge for exporting to the EU market is the GSP cut which will have negative impact on price competitiveness against our rivals

40
While our positioning in the U.S. market remains strong
ทีม่า : การวเิคราะหโ์ดย EIC จากขอ้มลูของ Trademap
308319316
336
292
1.3% -3.7%
2014 2013 2012 2011 2010
14.1% 16.8%16.3%
13.5% 17.3%
29.3% 26.2% 28.0% 31.2% 28.5%
48.2% 48.8% 49.8% 50.4% 50.7%
8.4% 4.8%5.9%8.2%
2011 2010 2012 2014
3.6%
2013
Philippines Thailand Indonesia Others
U.S. import value of canned pineapple
Unit: USD million

41
Between 2010-2014, Thailand’s canned vegetable exports grow steadily at CAGR 3.9%, of which sweet corn accounted for the largest share
Thailand’s prepared, canned vegetables export
Unit: USD million
Source: EIC analysis based on data from MOC
362337339351
310
+7.3% +3.9%
2014 2013 2012 2011 2010
Canned vegetable
0.4%
Mushroom
0.5%
Bamboo
3.3%
Babycorn
9.2%
Sweet corn 57.0%
Others
29.6%
Tomato
Canned vegetables export by type
Unit: USD million

42
Australia
4.8%
4.7%
5.4%
S.Korea
Taipei
USA 9.9%
Japan
22.4%
52.8% Others
100% = USD 361.7 Million
Thailand’s export of canned vegetables by country Unit: % of total export value
Japan is our main export destination for both canned vegetables and canned sweet corn
Thailand’s export of canned sweet corn by country Unit: % of total export value
UK
5.9%
5.7%
6.9% Taipei
Russia
S.Korea 8.9%
Japan
16.3%
56.2% Others
100% = USD 206.4 Million
Source: EIC analysis based on data from MOC

43
Canned sweet corn (prepared or preserved) imported by Japan and Taipei, Chinese Unit: USD million
50.3%
37.5%
14.0% 12.2%
53.3%
98,203
11.8%
39.2%
48.9%
92,420
2014 2013
46.8%
39.1%
91,639
36.4%
2012 2010 2011
76,859
11.1%
32.3%
56.6%
87,023
10.3%
Thai canned sweet corn is driving out U.S. competition Thailand continues to push the U.S. out of the market for canned sweet corn as both countries compete in the same markets and U.S. sweet corn is more expensive
Source: EIC analysis based on data from Trademap
54.6%
2012
29,150
43.5%
56.5%
30,078
45.4%
28,474
2014
44.8%
55.2%
2013
28,844
50.9%
49.1%
5.5%
30,312
2010
62.7%
2011
37.3%
4.7% 3.1% 5.5% 3.7%
USA Thailand Others

44
Global demand for canned fruits and vegetables still looks promising
Key driving factors:
1
Rapid urbanization, rising income levels, changing food habits and growing preference for convenience food are some of the prominent factors that stimulate the global canned fruits market
2
Demand for steel and aluminum from the canned fruit industry is fuelled by their non-toxic and recyclable properties, which in turn lead to effective waste management
• North America and Europe dominate the global canned fruits market owing to a fast lifestyle, concern over food safety and high demand for convenience
• Asia Pacific will be the dominant player in the forecasting horizon

45
End of document

Disclaimer Disclaimer Disclaimer Disclaimer
The information contained in this report
has been obtained from sources believed
to be reliable. However, neither we nor any
of our respective affiliates, employees or
representatives make any representation
or warranty, express or implied, as to the
accuracy or completeness of any of the
information contained in this report, and
we and our respective affiliates, employees
or representatives expressly disclaim any
and all liability relating to or resulting from
the use of this report or such information
by the recipient or other persons in
whatever manner.
Any opinions presented herein represent
our subjective views and our current
estimates and judgments based on various
assumptions that may be subject to
change without notice, and may not prove
to be correct.
This report is for the recipient’s
information only. It does not represent or
constitute any advice, offer,
recommendation, or solicitation by us and
should not be relied upon as such. We, or
any of our associates, may also have an
interest in the companies mentioned
herein.
47


