26
Industry Statistics Year-end 2017 Emerging Markets Private Capital Fundraising and Investment

Industry StatisticsYear-end 2017Emerging Markets Private Capital Fundraising and Investment

About EMPEAEMPEA is the global industry association for private capital in emerging markets. We are an independent non-profit organization. We have over 300 member firms, comprising institutional investors, fund managers and industry advisors, who together manage more than US$1 trillion of assets and have offices in more than 100 countries across the globe. Our members share EMPEA’s belief that private capital is a highly suited investment strategy in emerging markets, delivering attractive long-term investment returns and promoting the sustainable growth of companies and economies. We support our members through global authoritative intelligence, conferences, networking, education and advocacy.
1 | EMPEA Industry Statistics
Shannon Stroud │ Vice President, Programs & Business Development
Randy Mitchell │ Vice President, Strategic Engagement
Ann Marie Plubell │ Vice President, Regulatory Affairs
Holly Radel │ Vice President, Marketing & Communications
Kyoko Terada │ Vice President, Membership & Industry Partners
Jeff Schlapinski │ Director, Research
Camden Walker │ Director, Operations
Victoria Carrion │ Senior Manager, Membership & Industry Partners
Leela Vosko │ Manager, Marketing & Communications
Olivia Drouhaut │ Manager, Programs & Business Development
Luke Moderhack │ Manager, Research
Rae Winborn │ Manager, Research
Isabelle Diop │ Senior Research Analyst
Kevin Horvath │ Senior Research Analyst
Sabrina Katz │ Research Analyst
Michele Rucker │ Coordinator, Marketing & Communications
Anastasia Pechler │ Coordinator, Membership & Industry Partners
Michael Barth │ Senior Advisor
David Creighton │ Senior Advisor
Pat Dinneen │ Senior Advisor
Sanjiv Kapur │ Senior Advisor
André Roux │ Senior Advisor
Peter Tropper │ Senior Advisor
Kelly Williams │ Senior Advisor
Barış Öney │ Country Representative – Turkey
Steve Okun │ ASEAN Representative

Announcements & AcknowledgementsImportant Update to EMPEA’s Research Methodology
Please note that this release incorporates several changes to EMPEA's research methodology. Afghanistan and Pakistan are now included in Emerging Asia, rather than MENA, regional totals. In addition, unless otherwise specified, EMPEA's data and statistics now include expanded coverage of private infrastructure and real assets and private credit funds, in addition to previously reported private equity activity.
For more information, please see our full Research Methodology at the end of this report or click here: https://empea.org/data-methodology/.
Acknowledgments
EMPEA would like to acknowledge Industry Partners who were consulted during the compilation of our Industry Statistics: the African Private Equity and Venture Capital Association (AVCA), Asociación Mexicana de Capital Privado (AMEXCAP), Associação Brasileira de Private Equity & Venture Capital (ABVCAP), Association Marocaine des Investisseurs en Capital (AMIC), Czech Private Equity & Venture Capital Association (CVCA), Hong Kong Venture Capital & Private Equity Association (HKVCA), Latin American Private Equity & Venture Capital Association (LAVCA) and the Polish Private Equity and Venture Capital Association (PSIK). We thank these Industry Partners for their support.
Terms of Use
All material and underlying data contained within this presentation are the intellectual property of EMPEA. Any reference to the material must be properly attributed to EMPEA.
Contact Us
For additional information, inquiries or questions, please contact us at [email protected] or call +1 202 524 6113.
2 | EMPEA Industry Statistics
Looking for Additional Data?
• EMPEA Members receive exclusive access to detailed reporting and analysis, including:
• Fundraising and investment by region, sub-region and country;
• Fund size distribution;
• Listing of fund managers, funds, investments and exits;
• Investment size distribution by region;
• Investment by strategy and sector; and,
• Cambridge Associates fund performance data.
• For additional information, please email the research team at [email protected] or call +1 202 524 6113.
3 | EMPEA Industry Statistics
EMPEA’s research methodology has been updated as of 2 November 2016. Afghanistan and Pakistan are now included in Emerging Asia, rather than MENA, regional totals. For any questions, please contact [email protected] or +1 202 524 6113.
EMPEA’s industry data and statistics provide an overview of fundraising, investment and exit activity among private alternative asset managers active in the emerging markets of Africa, Asia, Europe, Latin America and the Middle East. Unless stated otherwise, the information presented in EMPEA reports and data products is drawn from EMPEA’s proprietary research database, FundLink, and is based on data obtained from surveys of industry participants, direct communications with fund managers, press releases, trade publications and exchanges with regional and local venture capital associations. Fundraising, investment and exit amounts in EMPEA reports have been confirmed wherever possible directly by fund managers. EMPEA updates historical data on a quarterly basis as new data from fund managers and other sources is compiled in FundLink. Any discrepancies between the aggregate statistics published by EMPEA and the constituent data on individual funds and transactions included in tables and raw data files can be attributed to confidential information that has been omitted from public reporting.
EMPEA’s reporting covers activity by long-term, fixed-life, private, directinvestment funds, backed by institutional investors, across the following three asset classes: private equity, private credit and private infrastructure and real assets—collectively “private funds” or “private capital”. EMPEA data and statistics exclude activity from real estate funds, funds of funds, secondariesfunds, traditional investment holding companies, corporate strategic investors, government-owned or -managed entities and captive investment vehicles, as well as funds investing primarily in publicly-traded equity or debt securities.
Funds
Reported fundraising totals reflect only official closes (interim and/or final) as reported in primary and secondary sources or directly by fund managers. Capital commitments accruing prior to or between official closes are not included in reporting.
Investments
EMPEA classifies investments into one of three asset classes—private equity, private credit and private infrastructure and real assets—and into one of the following deal types: buyout, growth, venture capital, PIPE, mezzanine or debt.Venture capital includes seed, early-stage and late-stage investments. When determining how an investment should be classified, EMPEA takes into account the typical investment strategy of the fund manager(s) involved, the type of security acquired, the reported round number or type of transaction, the development stage of the company at the time of investment, the company’s business model and the type of product or service that the company provides. Secondary investments (both traditional and direct) are excluded from reporting. In addition, wherever possible, bank (acquisition) financing and co-investment from excluded entities (mentioned in the first section of this note) are excluded from reported investment values, both to ensure continuity across regions and to provide a more accurate picture of the scale and pace of capital deployment by the funds that are the primary focus of EMPEA’s research.
EMPEA Research Methodology
4 | EMPEA Industry Statistics
Exits
EMPEA does not publish aggregate statistics on exit activity due to significant selection bias in the reporting of these transactions. Accordingly, exit data included in EMPEA reports and data products should not be treated as a comprehensive picture of all emerging markets exit activity, but as a sampling of exits from a given market or time period.
Sectors
EMPEA’s fund and company sector classifications are based on the Industry Classification Benchmark (ICB), which is owned by FTSE International Limited (FTSE). FTSE® is a trademark of the London Stock Exchange Group companies and is used by FTSE under license. FTSE does not accept any liability to any person for any loss or damage arising out of any error or omission in the ICB.
Abbreviations commonly used in EMPEA reports
EM – Emerging marketsPE – Private equityVC – Venture capitalGP – General partner (fund manager)LP – Limited partner (fund investor)
In some exhibits in EMPEA publications, percentage labels may not sum to 100% due to rounding. In all tables in which it appears, “N/A” denotes a confidential or otherwise undisclosed value.
Geographies
EMPEA data and statistics are compiled based on the “market” approach.Fundraising activity is categorized based on the countries, sub-regions or regions in which fund managers intend to invest, while investment activity is categorized based on the country headquarters of investee companies. For companies registered in offshore financial centers or developed markets, but operating exclusively or predominantly in emerging markets, investment activity is categorized based on the geographic footprint of the operations of investee companies. In the case of global or multi-regional funds, only those funds investing primarily in emerging markets are included in fundraising totals (e.g., pan-Asia funds with a significant portion of capital intended for investment in China and India). Country-dedicated fundraising data and statistics reflect only those funds with a single-country strategy or mandate. Target allocations to individual markets within a broader global or regional fund are not attributed to single-country fundraising totals.
Regions in this report
• Emerging Asia: Asia Pacific, excluding Japan, Australia and New Zealand.• Central and Eastern Europe (CEE) and Commonwealth of Independent States
(CIS): European Union accession countries (2004), Southeastern Europe (excluding Greece) and Turkey, as well as Russia and other CIS countries.
• Latin America: Mexico, Central and South America and the Caribbean (excluding Puerto Rico and other overseas territories and departments).
• Middle East and North Africa (MENA): Gulf Cooperation Council (GCC), Iran, Iraq, Jordan, Lebanon, Palestinian Territories, Syria and Yemen, as well as North Africa (Algeria, Egypt, Libya, Morocco, Sudan and Tunisia).
• Sub-Saharan Africa: Africa, excluding North Africa as defined above.
EMPEA Research Methodology (continued)
5 | EMPEA Industry Statistics
Contents
• Highlights from the YE 2017 Industry Statistics• Fundraising
• Investment
• Exits
• Global Private Capital Overview
• EM Fundraising
• EM Investment
• Cambridge Associates PE & VC Fund Performance
6 | EMPEA Industry Statistics

HighlightsYear-end 2017 Industry Statistics │ Emerging Markets Private Capital
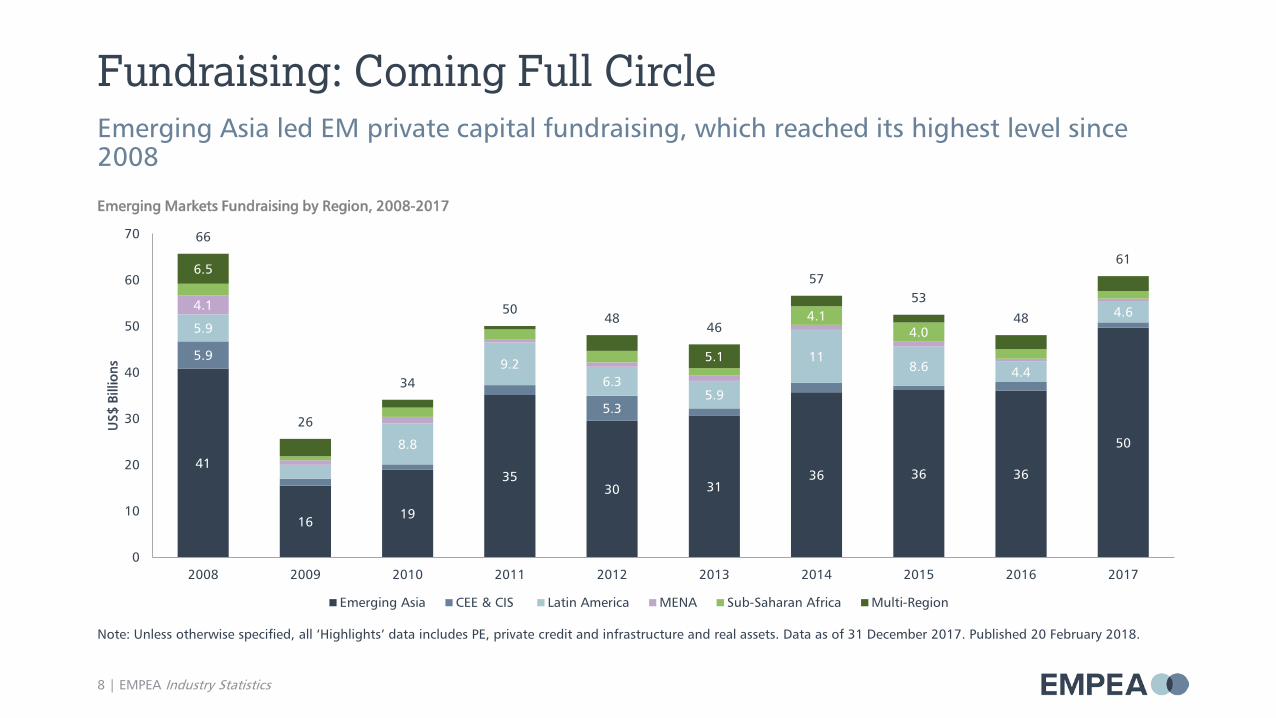
Fundraising: Coming Full Circle
Emerging Markets Fundraising by Region, 2008-2017
8 | EMPEA Industry Statistics
Note: Unless otherwise specified, all ‘Highlights’ data includes PE, private credit and infrastructure and real assets. Data as of 31 December 2017. Published 20 February 2018.
Emerging Asia led EM private capital fundraising, which reached its highest level since 2008
41
1619
3530 31
36 36 36
50
5.9
5.3
5.9
8.8
9.26.3
5.9
118.6 4.4
4.64.14.1
4.0
6.5
5.1
66
26
34
5048
46
5753
48
61
0
10
20
30
40
50
60
70
2008 2009 2010 2011 2012 2013 2014 2015 2016 2017
US$
Bill
ions
Emerging Asia CEE & CIS Latin America MENA Sub-Saharan Africa Multi-Region

9 | EMPEA Industry Statistics
Note: ‘Fundraising by Fund Sequence’ includes both final and interim closes. Data as of 31 December 2017. Published 20 February 2018.
Emerging Markets Fundraising by Strategy, 2008-2017 Growth Equity Fundraising by Fund Sequence, 2008-2017
Fundraising: Strategy ShiftVenture capital, infrastructure and private credit continue to gain ground; growth equity commitments are mostly accruing to proven GPs
38%
22%
37%31% 34%
41%
51%
41%
33% 25%
8% 13% 6%
16%19%
9% 7% 8%8% 10%
4% 5% 7% 10% 12%
0%
20%
40%
60%
80%
100%
2008-2009 2010-2011 2012-2013 2014-2015 2016-2017
% o
f To
tal C
apit
al R
aise
d
Buyout Growth Venture Capital
Infrastructure Real Assets Private Credit
44% 45%55%
61% 58%
26%30%
32%
32% 33%
30%24%
13%7% 9%
0%
20%
40%
60%
80%
100%
2008-2009 2010-2011 2012-2013 2014-2015 2016-2017
% o
f To
tal C
apit
al R
aise
d
Fourth or Later Second or Third First-time

10 | EMPEA Industry Statistics
Note: Includes both interim and final closes. Data as of 31 December 2017. Published 20 February 2018.
No. of First-time Funds Raising Capital – Select Markets, 2010-2017 Venture Capital Share of First-time Funds Holding a Close, 2010-2017
Fundraising: New VC TeamsVenture capital funds led an upturn in fundraising for first-time teams in 2017, especially in MENA, China and India
0
5
10
15
20
25
2010 2011 2012 2013 2014 2015 2016 2017
No.
of
Fund
s
MENA China India
18%
25%
30% 31%
41%
48% 47%
58%
0%
10%
20%
30%
40%
50%
60%
70%
2010 2011 2012 2013 2014 2015 2016 2017
% o
f To
tal N
o. o
f Fi
rst-
tim
e Fu
nds
Fund Manager(s) Fund Name Fund FocusGeographic Focus
Total Capital Raised to
Date (US$m)
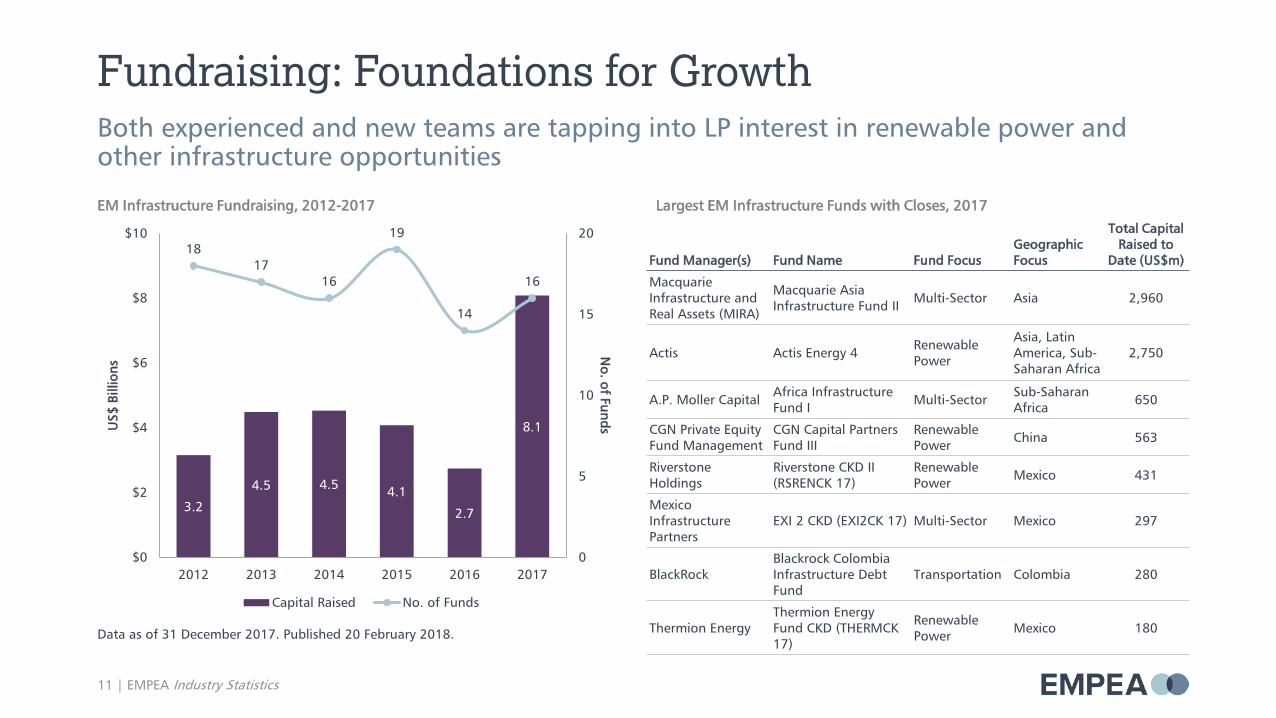
Macquarie Infrastructure and Real Assets (MIRA)
Macquarie Asia Infrastructure Fund II Multi-Sector Asia 2,960
Actis Actis Energy 4 Renewable Power
Asia, Latin America, Sub-Saharan Africa
2,750
A.P. Moller Capital Africa Infrastructure Fund I Multi-Sector Sub-Saharan
Africa 650
CGN Private Equity Fund Management
CGN Capital Partners Fund III
Renewable Power China 563
Riverstone Holdings
Riverstone CKD II (RSRENCK 17)
Renewable Power Mexico 431
Mexico Infrastructure Partners
EXI 2 CKD (EXI2CK 17) Multi-Sector Mexico 297
BlackRockBlackrock Colombia Infrastructure Debt Fund
Transportation Colombia 280
Thermion EnergyThermion Energy Fund CKD (THERMCK 17)
Renewable Power Mexico 180
11 | EMPEA Industry Statistics
Data as of 31 December 2017. Published 20 February 2018.
EM Infrastructure Fundraising, 2012-2017 Largest EM Infrastructure Funds with Closes, 2017
Fundraising: Foundations for GrowthBoth experienced and new teams are tapping into LP interest in renewable power and other infrastructure opportunities
3.2
4.5 4.5 4.1
2.7
8.1
1817
16
19
14
16
0
5
10
15
20
$0
$2
$4
$6
$8
$10
2012 2013 2014 2015 2016 2017
No. of FundsU
S$ B
illio
ns
Capital Raised No. of Funds
Fund Manager(s) Fund Name Fund TypeGeographic Focus
Total Capital Raised to
Date (US$m)
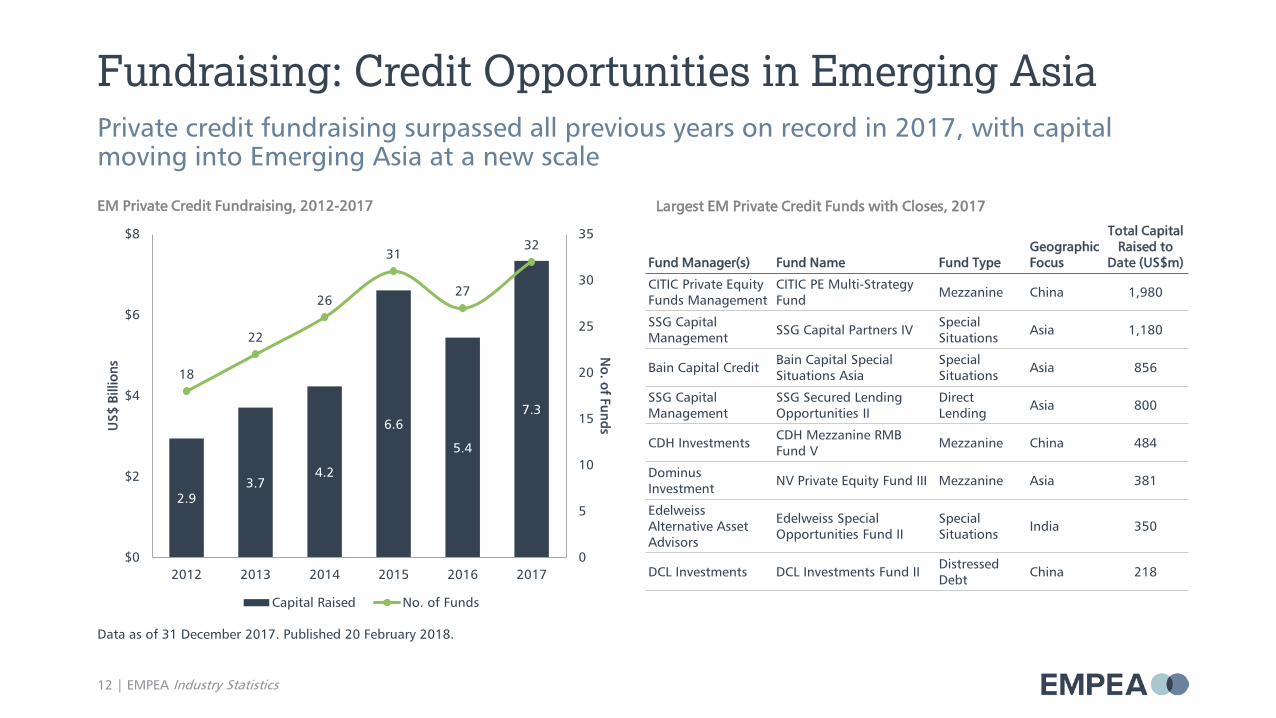
CITIC Private Equity Funds Management
CITIC PE Multi-Strategy Fund Mezzanine China 1,980
SSG Capital Management SSG Capital Partners IV Special
Situations Asia 1,180
Bain Capital Credit Bain Capital Special Situations Asia
Special Situations Asia 856
SSG Capital Management
SSG Secured Lending Opportunities II
Direct Lending Asia 800
CDH Investments CDH Mezzanine RMB Fund V Mezzanine China 484
Dominus Investment NV Private Equity Fund III Mezzanine Asia 381
Edelweiss Alternative Asset Advisors
Edelweiss Special Opportunities Fund II
Special Situations India 350
DCL Investments DCL Investments Fund II Distressed Debt China 218
12 | EMPEA Industry Statistics
Data as of 31 December 2017. Published 20 February 2018.
EM Private Credit Fundraising, 2012-2017 Largest EM Private Credit Funds with Closes, 2017
Fundraising: Credit Opportunities in Emerging AsiaPrivate credit fundraising surpassed all previous years on record in 2017, with capital moving into Emerging Asia at a new scale
2.93.7
4.2
6.6
5.4
7.3
18
22
26
31
27
32
0
5
10
15
20
25
30
35
$0
$2
$4
$6
$8
2012 2013 2014 2015 2016 2017
No. of FundsU
S$ B
illio
ns
Capital Raised No. of Funds
13 | EMPEA Industry Statistics
Data as of 31 December 2017. Published 20 February 2018.
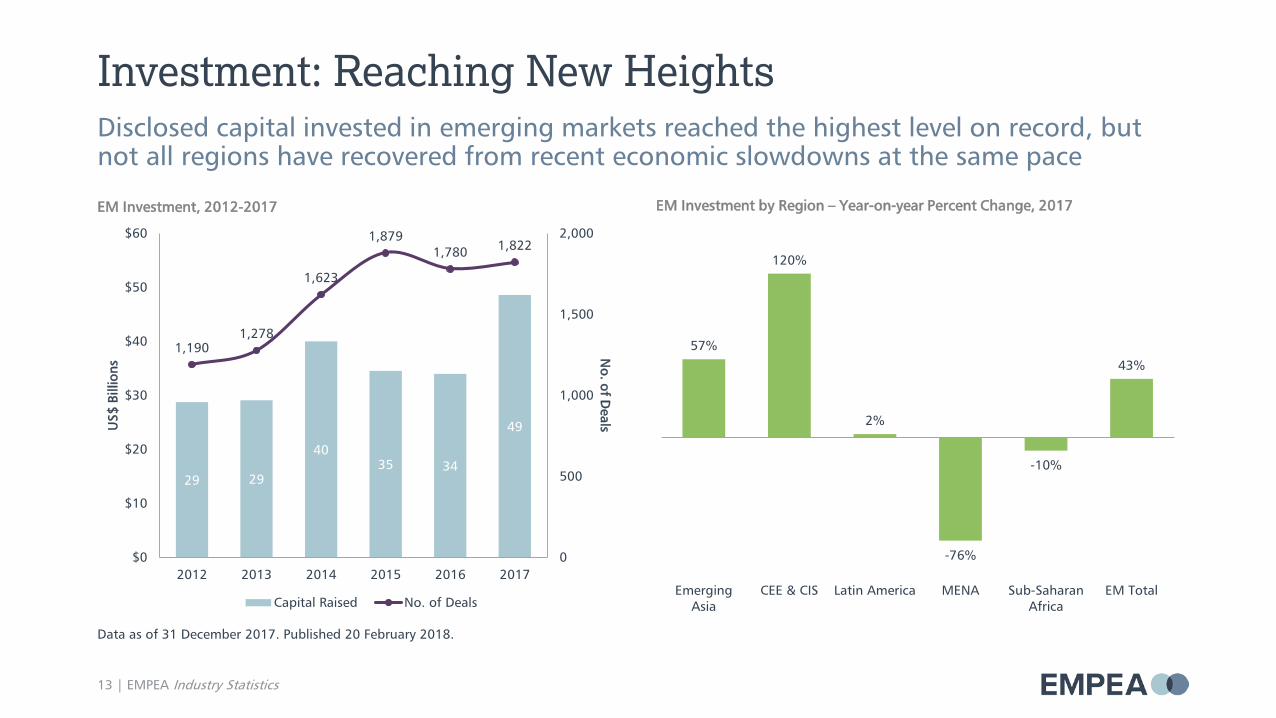
EM Investment, 2012-2017 EM Investment by Region – Year-on-year Percent Change, 2017
Investment: Reaching New HeightsDisclosed capital invested in emerging markets reached the highest level on record, but not all regions have recovered from recent economic slowdowns at the same pace
29 29
4035 34
49
1,1901,278
1,623
1,8791,780 1,822
0
500
1,000
1,500
2,000
$0
$10
$20
$30
$40
$50
$60
2012 2013 2014 2015 2016 2017
No. of D
ealsUS$
Bill
ions
Capital Raised No. of Deals
57%
120%
2%
-76%
-10%
43%
EmergingAsia
CEE & CIS Latin America MENA Sub-SaharanAfrica
EM Total

Investment: Consumer Services
14 | EMPEA Industry Statistics
† The Industry Classification Benchmark (“ICB”) is owned by FTSE International Limited (“FTSE”). “FTSE®” is a trademark of the London Stock Exchange Group companies and is used by FTSE under license.
Note: 'Utilities' includes investments in power generation, transmission and distribution. Data as of 31 December 2017. Published 20 February 2018.
Consumer services led all other sectors for investment in 2017 at US$17.9 billion, nearly triple the 2008 total
EM Investment – Select ICB† Industries, 2008-2017 (Indexed to 2008)
0.0
0.5
1.0
1.5
2.0
2.5
3.0
2008 2009 2010 2011 2012 2013 2014 2015 2016 2017
Consumer-facing
Consumer Goods Consumer Services Health Care Technology
0.0
0.5
1.0
1.5
2.0
2.5
3.0
2008 2009 2010 2011 2012 2013 2014 2015 2016 2017
Primary Goods and Industrials
Basic Materials Industrials Oil & Gas Utilities
15 | EMPEA Industry Statistics
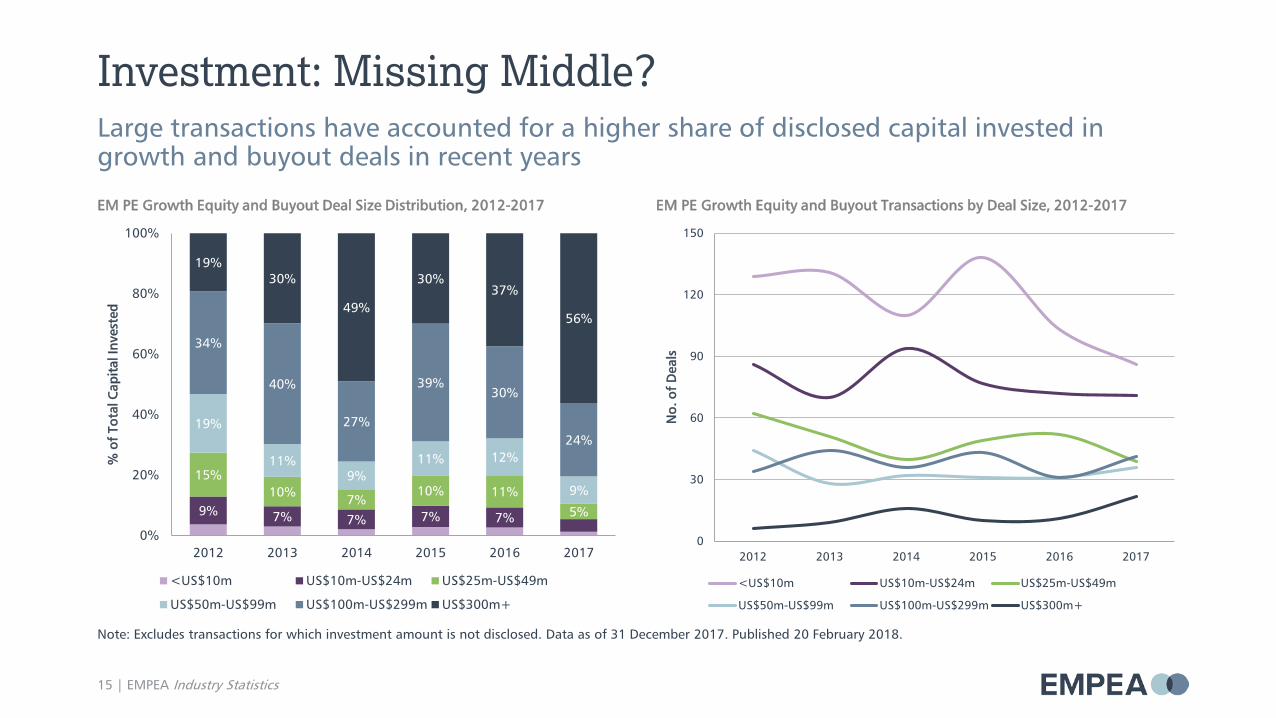
Note: Excludes transactions for which investment amount is not disclosed. Data as of 31 December 2017. Published 20 February 2018.
Investment: Missing Middle?Large transactions have accounted for a higher share of disclosed capital invested in growth and buyout deals in recent years
9% 7% 7% 7% 7%
15%10% 7%
10% 11%
5%
19%
11%9%
11% 12%
9%
34%
40%
27%
39%30%
24%
19%30%
49%
30%37%
56%
0%
20%
40%
60%
80%
100%
2012 2013 2014 2015 2016 2017
% o
f To
tal C
apit
al In
vest
ed
<US$10m US$10m-US$24m US$25m-US$49m
US$50m-US$99m US$100m-US$299m US$300m+
0
30
60
90
120
150
2012 2013 2014 2015 2016 2017
No.
of
Dea
ls
<US$10m US$10m-US$24m US$25m-US$49m
US$50m-US$99m US$100m-US$299m US$300m+
EM PE Growth Equity and Buyout Deal Size Distribution, 2012-2017 EM PE Growth Equity and Buyout Transactions by Deal Size, 2012-2017

16 | EMPEA Industry Statistics
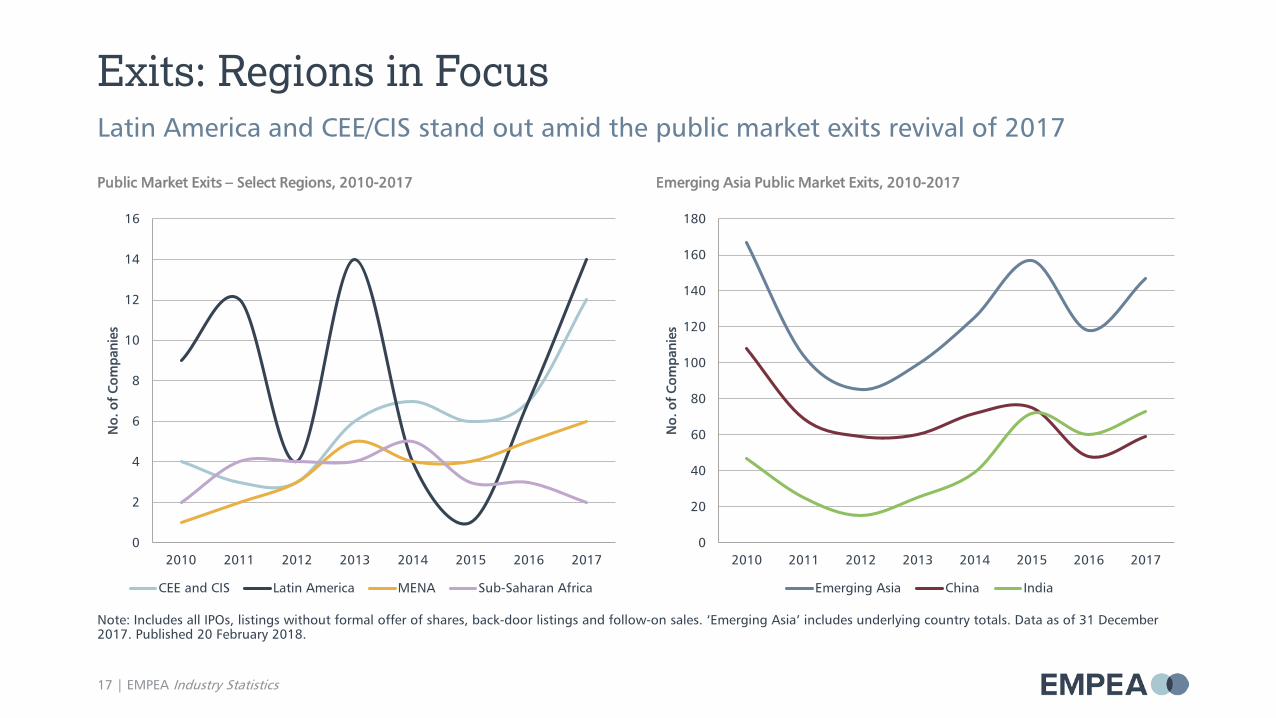
Note: 'Public markets' includes all IPOs, listings without formal offer of shares, back-door listings and follow-on sales. 'Listings' includes all IPOs, listings without formal offer of shares and back-door listings. Data as of 31 December 2017. Published 20 February 2018.
Disclosed EM Exits – Select Transaction Types, 2010-2017 EM PE-backed Public Listings and Follow-on Sales, 2013-2017
Exits: Going PublicAfter a subdued 2016, public market exits rebounded in 2017
51
73
87
64
86
78 76
8683
101
0
20
40
60
80
100
120
2013 2014 2015 2016 2017
No.
of
Com
pani
es
Listings Follow-on Sales
0
20
40
60
80
100
120
140
160
180
200
2010 2011 2012 2013 2014 2015 2016 2017
No.
of
Com
pani
es
Public Markets Strategic Sale Secondary Sale
17 | EMPEA Industry Statistics
Note: Includes all IPOs, listings without formal offer of shares, back-door listings and follow-on sales. ‘Emerging Asia’ includes underlying country totals. Data as of 31 December 2017. Published 20 February 2018.
Public Market Exits – Select Regions, 2010-2017 Emerging Asia Public Market Exits, 2010-2017
Exits: Regions in FocusLatin America and CEE/CIS stand out amid the public market exits revival of 2017
0
2
4
6
8
10
12
14
16
2010 2011 2012 2013 2014 2015 2016 2017
No.
of
Com
pani
es
CEE and CIS Latin America MENA Sub-Saharan Africa
0
20
40
60
80
100
120
140
160
180
2010 2011 2012 2013 2014 2015 2016 2017
No.
of
Com
pani
es
Emerging Asia China India

Global Private Capital OverviewYear-end 2017 Industry Statistics
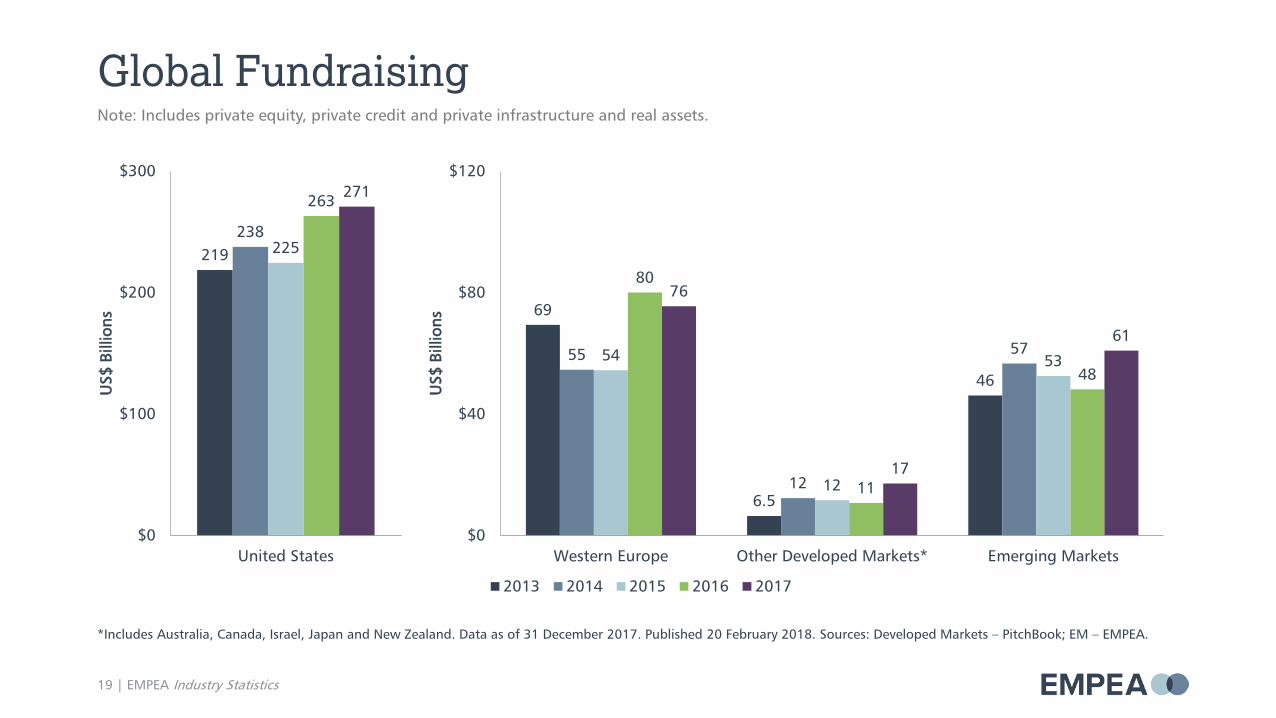
Global Fundraising
19 | EMPEA Industry Statistics
219238
225
263 271
$0
$100
$200
$300
United States
US$
Bill
ions
2013 2014 2015 2016 2017
*Includes Australia, Canada, Israel, Japan and New Zealand. Data as of 31 December 2017. Published 20 February 2018. Sources: Developed Markets – PitchBook; EM – EMPEA.
Note: Includes private equity, private credit and private infrastructure and real assets.
69
6.5
46
55
12
5754
12
53
80
11
48
76
17
61
$0
$40
$80
$120
Western Europe Other Developed Markets* Emerging Markets
US$
Bill
ions

202
274291
304327
$0
$100
$200
$300
$400
United States
US$
Bill
ions
2013 2014 2015 2016 2017
Global Investment
*Includes Australia, Canada, Israel, Japan and New Zealand. Data as of 31 December 2017. Published 20 February 2018. Sources: Developed Markets – PitchBook; EM – EMPEA.
20 | EMPEA Industry Statistics
Note: Includes private equity, private credit and private infrastructure and real assets.
93
24 29
132
4940
170
4135
141
49
34
151
44 49
$0
$40
$80
$120
$160
$200
Western Europe Other Developed Markets* Emerging Markets
US$
Bill
ions

EM Fundraising & Investment
Data as of 31 December 2017. Published 20 February 2018.
21 | EMPEA Industry Statistics
66
26
34
50 4846
5753
48
61
31
2125
3229 29
40
35 34
49
$0
$20
$40
$60
$80
2008 2009 2010 2011 2012 2013 2014 2015 2016 2017
US$
Bill
ions
Funds Raised Capital Invested
Note: Includes private equity, private credit and private infrastructure and real assets.
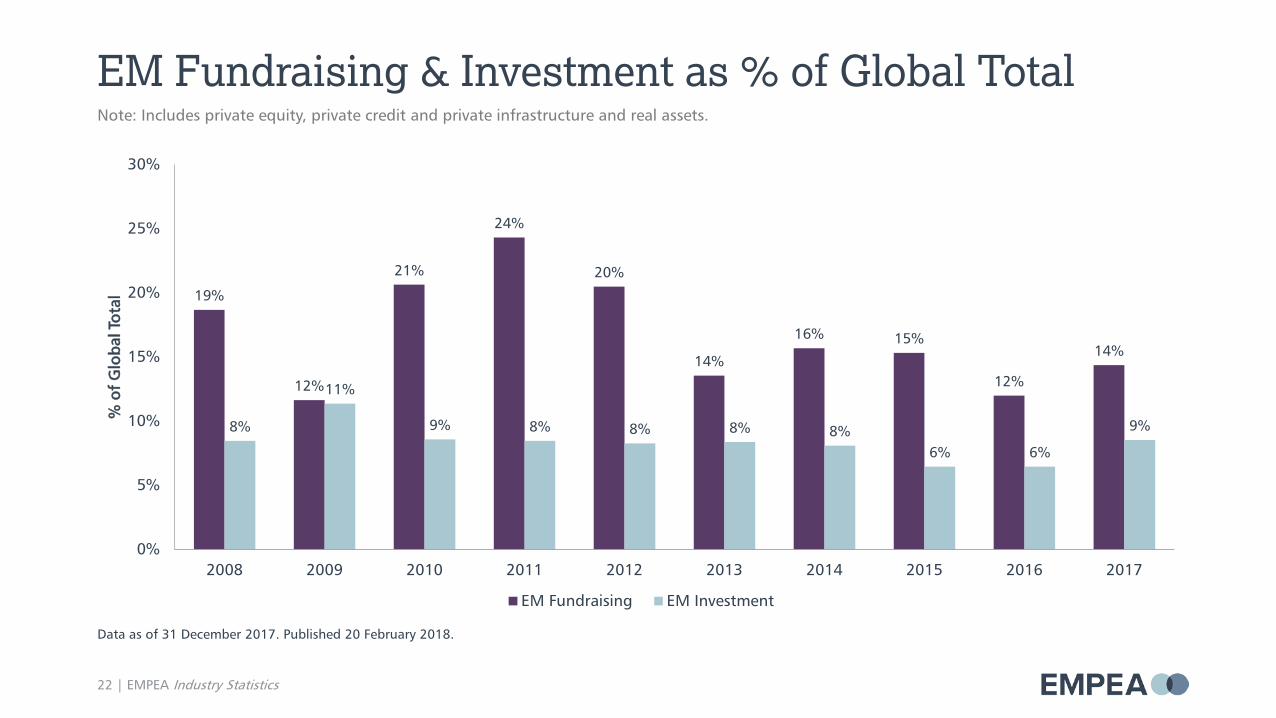
EM Fundraising & Investment as % of Global Total
22 | EMPEA Industry Statistics
19%
12%
21%
24%
20%
14%
16% 15%
12%
14%
8%
11%
9% 8% 8% 8% 8%6% 6%
9%
0%
5%
10%
15%
20%
25%
30%
2008 2009 2010 2011 2012 2013 2014 2015 2016 2017
% o
f G
loba
l Tot
al
EM Fundraising EM Investment
Data as of 31 December 2017. Published 20 February 2018.
Note: Includes private equity, private credit and private infrastructure and real assets.
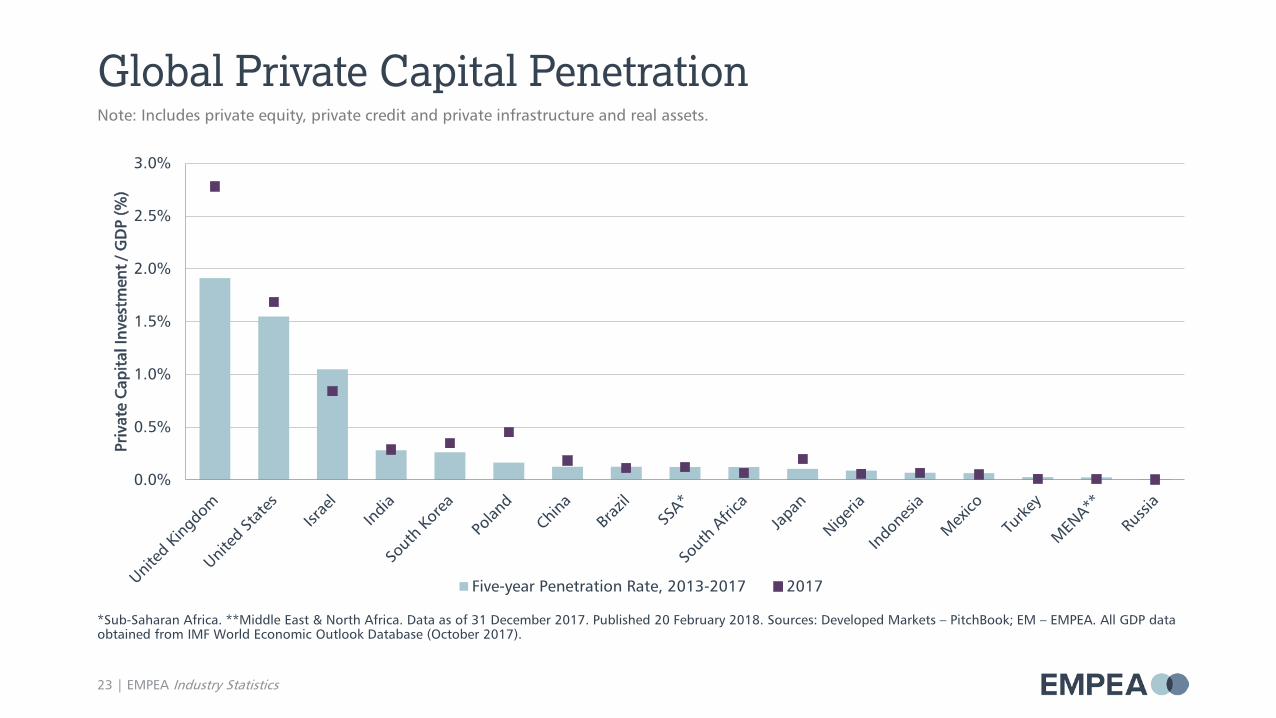
*Sub-Saharan Africa. **Middle East & North Africa. Data as of 31 December 2017. Published 20 February 2018. Sources: Developed Markets – PitchBook; EM – EMPEA. All GDP data obtained from IMF World Economic Outlook Database (October 2017).
0.0%
0.5%
1.0%
1.5%
2.0%
2.5%
3.0%
Priv
ate
Cap
ital
Inve
stm
ent
/ GD
P (%
)
Five-year Penetration Rate, 2013-2017 2017
Global Private Capital Penetration
23 | EMPEA Industry Statistics
Note: Includes private equity, private credit and private infrastructure and real assets.

Disclaimer
This information is intended to provide an indication of industry activity based on the best information available from public and proprietary sources. EMPEA has taken measures to validate the information presented herein but cannot guarantee the ultimate accuracy or completeness of the data provided. EMPEA is not responsible for any decision made or action taken based on information drawn from this report.
24 | EMPEA Industry Statistics

2600 Virginia Avenue NW • Suite 500 • Washington, DC 20037-1905 USA
Phone: +1 202 333 8171 • Fax: +1 202 333 3162 • Web: empea.org
© EMPEA 2018. All rights reserved.


