20
Trade.··. St11DDlary Major :Primary Olefins USITC Publication 2588 (CH-5 JANUARY 1993 OFFICE OF INDUSTRIES U.S. International Trade Commission Washington, DC 20436
Industry~ Trade.··. St11DDlary Major :Primary Olefins
USITC Publication 2588 (CH-5
JANUARY 1993
OFFICE OF INDUSTRIES U.S. International Trade Commission Washington, DC 20436
UNITED STATES INTERNATIONAL TRADE COMMISSION
COMMISSIONERS
Don E. Newquist, Chairman
Peter S. Watson, Vice Chairman
David B. Rohr
Anne E. Brunsdale
Carol T. Crawford Janet A. Nuzum
Office of Operations Robert A. Rogowsky, Director
Office of Industries Vern Simpson, Director
This report was prepared principally by
James P. Raftery
Energy, Petroleum, Benzenoid Chemicals, and Rubber and Plastics Branch Energy and Chemicals Division
John J. Gersic, Chief
Address all communications to Secretary to the Commission
United States International Trade Commission Washington, DC 20436
PREFACE
In 1991 the United States International Trade Commission initiated its current Industry and Trade Summary series of informational reports on the thousands of products imported into and exported from the United States. Each summary addresses a different commodityfmdustry area and contains information on product uses, U.S. and foreign producers, and customs treatment. Also included is an analysis of the basic factors affecting trends in consumption, production, and trade of the commodity, as well as those bearing on the competitiveness of U.S. industries in domestic and foreign markets.I .
This report on major primary olefins covers the period 1987 through 1991 and represents one of approximately 250 to 300 individual reports to be produced in this series during the first haJf of the 1990s. Listed below are the individual summary reports published to date on the chemicals sector.
USITC publication number 2458(CH-1) 2509(CH-2) 2548(CH-3) 2578(CH-4) 2588(CH-5)
Publication date
November 1991 ....... . May 1992 ............ . August 1992 .......... . March 1992 ........... . January 1993 .......... .
Title
Soaps, detergents, and smface-active agents lnolganic acids Paints, inks, and related items Crude petroleum Major primary olefins
1 The information and anafysis provided in this report are for the of this report only. Noth.Dig in this report should be construed to indicate how the Qmnniscion wo~ an investigation conducted under statutmy authority covering the same or similar subject matter.

CONTENTS
Page
Preface ............................................................................. .
Introduction . . . . . . . . . . . . . . . . . . . . . . . . . . . . . . . . . . . . . . . . . . . . . . . . . . . . . . . . . . . . . . . . . . . . . . . . . 1
U.S. industry profile . . . . . . . . . . . . . . . . . . . . . . . . . . . . . . • . . . . . . . . . . . . . . . . . . . . . . . . . . . . . . . . . . . 1
Industry structure . . . . . . . . . . . . . . . . . . . . . . . . . . . . . . . . . . . . . . . . . . . . . . . . . . . . . . . . . . . . . . . . . . . 1 Consumer characteristics and factors affecting demand . . . . . . • . . . . . . . . . . . . . . . . . . . . . . . . . . . . . . 3
Foreign industry profile . . . . . . . . . . . . . . . . . . . . . . . . . . . . . . . . . . . . . . . . . . . . . . . . . . . . . . . . . . . . . . . 3
U.S. trade measures . . . . . . . . . . . . . . . . . . . . . . . . . . . . . . . . . . . . . . . . . . . . . . . . . . . . . . . . . . . . . . . . . . 3
Tariff and nontariff measures . . . . . . . . . . . . . . . . . . . . . . . . . . . . . . . . . . . . . . . . . . . . . . . . . . . . . . . . . . 3 U.S. Government trade-related investigations . . . . . . . . . . . . . . . . . . . . . . . . . . . . . . . . . . . . . . . . . . . . . 5
Foreign trade measures . . . . . . . . . . . . . . . . . . . . . . . . . . . . . . . . . . . . . . . . . . . . . . . . . . . . . . . . . . . . . . . 5
U.S. market . . . . . . . . . . . . . . . . . . . . . . . . . . . . . . . . . . . . . . . . . . . . . . . . . . . . . . . . . . . . . . . . . . . . . . . . . 5 Consumption . . . . . . . . . . . . . . . . . . . . . . . . . . . . . . . . . . . . . . . . . . . . . . . . . . . . • . . . . . . . . . . . . . . . . . . 5 Ploduction . . . . . . . . . . . . . . . . . . . . . . . . . . . . . . . . . . . . . . . . . • . . . . . . . . . . . . . . . . . . . . . . . . . . . . . . • 6 Imports............................................................................ 6
Foreign markets . . . . . . . . . . . . . . . . . . . . . . . . . . . . . . . . . . . . . . . . . . . . . . . . . . . . . . . . . . . . . . . . . . . . . . 7 Foreign market profile . . . . . . . . . . . . . . . . . . . . . . . . . . • . . . . . . . . . • . . . . . . . . . . . . . . . . . . . . . . . . . . 7 U.S. exports . . . . . . . . . . . . . . . . . . . . . . . . . . . . . . . . . . . . . . . . . . . . . . . . . . . . . . . . . . . . . . . . . . . . . . . . 8
U.S. trade balance . . . . . . . . . . . . . . . . . . . . . . . . . . . . . . . . . . . . . • . . . . . . . . . . . . . . . . . . . . . . . . . . . . . . 8
Appendix
A. Explanation of tariff and trade agreement terms . . . . . . . . . . . . . . . . . . . . . . . . . . . . . . . . . . . . . . . . . A-1
Figure 1. U.S. major primary olefins industry: Principal
ra'!V ~terials, producer types, major products, and pnnc1pal consumers . . . . . . . . . . . . . . . . . . . . . . . . . . . . . . . . . . . . . . . . . . . . . . . . . . . . . . . . . . . . . . 2
Tables 1. Major primary olefins: Harmonized Tariff Schedule subheading;
description; U.S. col. 1 rate of duty as of Jan. l, 1992; U.S. exports, 1991; and U.S. imports, 1991 . . • • . . . . . . . • . . . . . . . . . . . . . . . . . . . . . . . . . . • . . . 4
2. Major primary olefins: U.S. production, exports of domestic merchandise, imports for consumption, and apparent consumption, 1987-91 . . . • . . . . • • . . • . . . • . . . . . . . . . . . • . . . . . . • . . . . • . . . . • . . . 5
3. Major primary olefins: U.S. imports for consumption, by principal sources, 1987-91 . • . . . . . . . . . . . . . . . • . . . . . . . . . . . . . • . . . . . . . . . . . . . . . . . • • . . . 6
4. Major primary olefins: U.S. exports of domestic merchandise, by principal markets, 1987-91 . . . . . . • . . . . . . • . • . • • . . . • . . . • . . . . . . . . . . . . . . . . . . • . . • • . . . 7
5. Major primary olefins: U.S. exports of domestic merchandise, imports for consumption, and merchandise trade balance, by selected countries and country groups, 1987-91 . . . . . . . . . . • . . . . . . . . . . . • • . . . . . . . . . . . . 9
iii

INTRODUCTION
This summary contains information regarding major primary olefins for the period 1987 through 1991. The olefins covered are ethylene, propylene, butylene, and 1,3-butadiene. These olefins are primary petrochemicals derived from feedstocks produced during the first-stage processing of crude petroleum and natural gas. They are basic building blocks used to produce thousands of petrochemicals, plastic resins, and elastomers.
Ethylene, the largest-volume olefin covered by this summary, accounts for about 60 percent of the U.S. production of these products. It is manufactured in olefin plants by the steam cmcking of ethane and propane ( .. light feedstocks" from natural gas) or naphtha and gas-oil ( .. heavy feedstocks" from petroleum refining). Cracking processes, such as steam cmcking or catalytic cracking, involve the breaking of larger, less valuable molecules into smaller molecules. High- and low-density polyethylene, polyvinyl chloride, and polystyrene are derived from ethylene and are used to make fabricated plastics. Other important ethylene derivatives include ethylene glycol (the chief ingredient in antifreeze preparations), synthetic fibers, solvents, and detergents.
Propylene, the second-largest primary olefin, accounts for 30 to 35 percent of U.S. primary olefins production. It is produced during the catalytic cracking of petroleum in refineries and as a co-product of ethylene production in olefin plants. As an ethylene co-product, its yield depends on which feedstock is used. Heavy feedstocks produce more co-product propylene than light feedstocks. Polypropylene, acrylonitrile, propylene oxide, and cumene are derived from propylene and its main end uses are fabricated plastics and synthetic fibers. Propylene is also used to produce resins, foams, and coatings.
Butylene is also produced during refinery operations and as a co-product of ethylene production. It is used in the production of gasoline, alcohols, linear low-density polyethylene, and 1,3-butadiene. Its fastest growing derivative is methyl tertiary-butyl ether (MTBE), an octane enhancer for gasoline. Butylene's estimated 1991 production represents 3 percent of U.S. major olefins production.
The olefin 1,3-butadiene is produced primarily as an ethylene co-product in the steam cmcking of heavy feedstocks, but also from the dehydrogenation of refinery butylene. Its production level averages 5 percent of total U.S. primary olefin production. The United States historically has been a net importer of 1,3-butadiene, which accounts for about 50 percent of U.S. major primary olefin imports. The principal uses for 1,3-butadiene are in the manufacture of various synthetic rubbers (elastomers), which are then used to make tires and other rubber products.
U.S. INDUSTRY PROFILE
Industry Structurel
The raw materials, producer types, major products, and principal consumers of the U.S. major primary olefins industry are shown in figure 1. In the United States, olefins are produced by both petroleum companies and chemical companies. In 1991, there were 37 finns producing olefins, of which 26 were petroleum companies and 11 were chemical companies. Petroleum companies usually have the largest facilities for producing olefins. These companies have an advantage over chemical companies in that they are integrated upstream into the production of crude petroleum and natural gas, allowing them to reuse byproducts from olefins production in their petroleum operations. Petroleum and chemical companies are vertically integrated through the production of downstream products, such as synthetic rubber and plastic resins. Many of these olefins producers are further vertically integrated to product fabrication.
The four largest producers in 1990, three of which are petroleum companies, accounted for about 45 percent of production. The four largest producers consistently have reflected similar concentration ratios. The olefins industry is characterized by improving process technology that is capital-intensive and that requires skilled production workers. During the past decade, this technology has evolved from the plant design detennining the choice of feedstock to one of tailoring the feedstock to prevailing product demand. Each feedstock produces a discrete range of products. The lighter feedstocks produce mostly ethylene, and the heavier feedstocks produce varying levels of propylene, butylene, and 1,3-butadiene co-products.
With an estimated total employment of 5,000 people, about two-thirds of whom are production workers, the industry is geographically concentrated along the gulf coast in Texas and Louisiana. 2 Olefms fmns tend to locate near areas producing crude petroleum and natural gas (the feedstocks for olefms production).
During 1987-91, output per production worker hour {productivity) increased an average of 8 percent annually. Wage rates for production workers increased an average 3.2 percent annually during the same period, from avera~e hourly earnings of $16.04 in 1987 to $18.09 in 1991:3
1 Major primary olefms produced in chemical (olefins) plants are included as part of SIC 2869, Industrial Organic Chemicals, Not Elsewhere Classified. Production of these olefms in petroleum refineries is included as part of SIC 2911, Petroleum Refining.
2 Estimated from 19l!'l Census of Manafactures and 1989 Annual Survey of Manllfactures.
3 Estimated from "Chemicals and Allied Products," U.S.1ndustrial Outlook 1992.
1
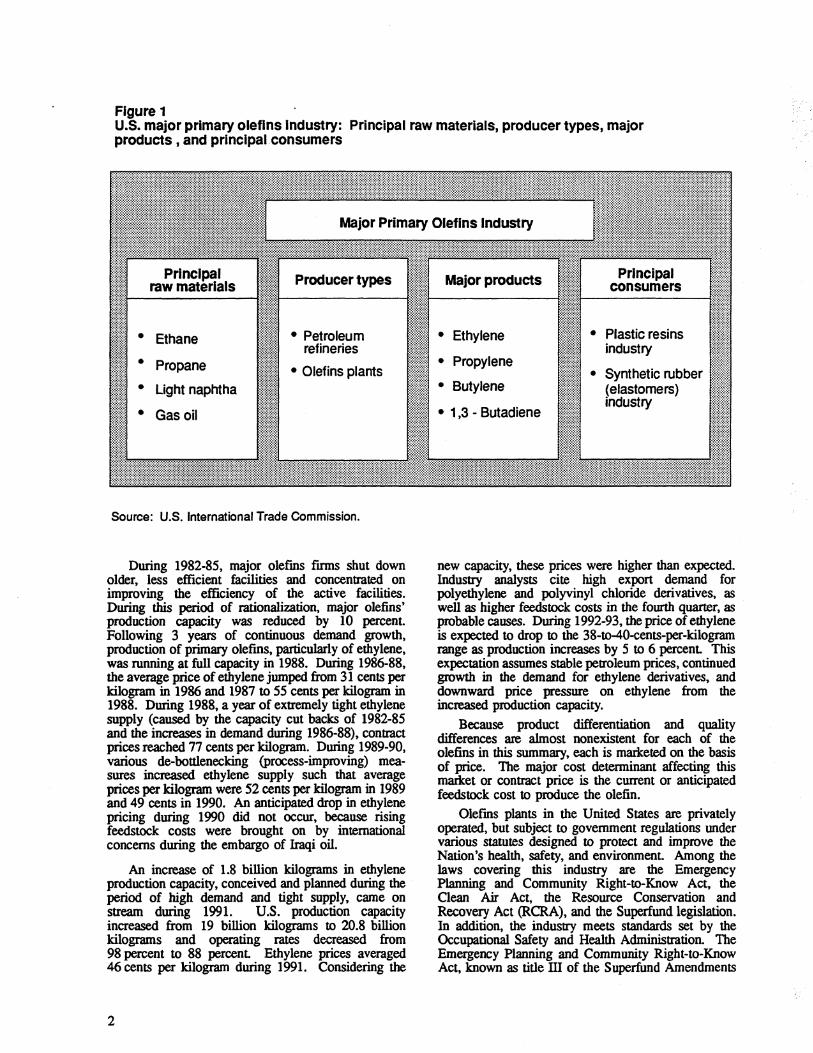
Figure 1 U.S. major primary oleflns Industry: Principal raw materials, producer types, major products, and principal.consumers
• Ethane • Petroleum refineries
Propane • Olefins plants • Light naphtha
• Gas oil
Source: U.S. International Trade Commission.
During 1982-8S, major olefms firms shut down older, less efficient facilities and concentrated on improving the efficiency of the active facilities. During this period of rationali7.ation, major olefins' production capacity was reduced by 10 percent. Following 3 years of continuous demand growth, production of primary olefins, particularly of ethylene, was running at full capacity in 1988. During 1986-88, the average price of ethylene jumped from 31 cents per kilogram in 1986 and 1987 to SS cents per kilogram in 1988. During 1988, a year of extremely tight ethylene supply (caused by the capacity cut backs of 1982-8S and the increases in demand during 1986-88), contract prices reached 77 cents per kilogram. During 1989-90, various de-bottlenecking (process-improving) measures increased ethylene supply such that average prices per kilogram were S2 cents per kilogram in 1989 and 49 cents in 1990. An anticipated drop in ethylene pricing during 1990 did not occur, because rising feedstock costs were brought on by international concerns during the embargo of Iraqi oil.
An increase of 1.8 billion kilograms in ethylene production capacity, conceived and planned during the period of high demand and tight supply, came on stream during 1991. U.S. production capacity increased from 19 billion kilograms to 20.8 billion kilograms and operating rates decreased from 98 percent to 88 percent Ethylene prices averaged 46 cents per kilogram during 1991. Considering the
2
• Ethylene • Plastic resins industry
• Propylene • Synthetic rubber
• Butylene (elastomers)
• 1,3 - Butadiene industry
new capacity, these prices were higher than expected. Industry analysts cite high export demand for polyethylene and polyvinyl chloride derivatives, as well as higher feedstock costs in the fourth quarter, as probable causes. During 1992-93, the price of ethylene is expected to drop to· the 38-to-40-cents-per-kilogram range as production increases by S to 6 percent This expectation assumes stable petroleum prices, continued growth in the demand for ethylene derivatives, and downward price pressure on ethylene from the increased production capacity.
Because product differentiation and quality differences are almost nonexistent for each of the olefins in this summary, each is marlceted on the basis of price. The major cost determinant affecting this marlcet or contract price is the current or anticipated feedstock cost to produce the olefin.
Olefms plants in the United States are privately operated, but subject to government regulations under various statutes designed to protect and improve the Nation's health, safety, and environment Among the laws covering this industry are the Emergency Planning and Community Right-to-Know Act, the Oean Air Act, the ·Resource Conservation and Recovery Act (RCRA), and the Superfund legislation. In addition, the industry meets standards set by the Occupational Safety and Health Administration. The Emergency Planning and Community Right-to-Know Act, known as title ill of the Superfund Amendments
and Reauthorization Act, mandates emergency planning in virtually all communities. The law also gives communities the right to know more about hazardous materials that an industry or business produces, stores, buys, or ships. Title m sets specific reporting requirements and deadlines. The reported data are maintained in an Environmental Protection Agency (EPA) computerized data base that can be accessed by the public. The Oean Air Act prohibits hazardous air pollutant discharges in excess of emission standards. The act's 1990 amendments impose new standards on the industry for 1,3-butadiene and three ethylene derivatives-ethylene oxide, ethylene dichloride, and ttichloroethylene. RCRA, enacted in 1976, governs the management of hazardous waste from generation to disposal. In 1990, EPA implemented land-disposal prohibitions on hazardous waste. Congress is considering new RCRA provisions such as increasing control of nonhazardous solid waste and recycling. The Superfund Amendments and Reauthorization Act of 1986, which established a $9 billion, 5-year fund to pay for the continued cleanup of hazardous waste sites, was reauthorized in 1990." Most of the revenues for the fund are generated by taxes on industry sectors, including the olefins industry. These regulations influence the industry processes and production costs. They also have an affect on business operations and invesbnent decisions.
Research and development funds in the U.S. major primary olefins industry are mainly directed to cost-cutting process developments that comply with government regulations.
A number of U.S. firms are subsidiaries of foreign multinational companies. Foreign chemical firms currently favor entering the U.S. market by purchasing U.S. finns and facilities. The main reasons for these acquisitions are the continued globali7.ation of petrochemical markets and the view by foreign chemical concerns that the U.S. market is the biggest and most promising. Foreign ownership in the U.S. olefins industry is estimated at 20 percent during 1990. Currently, three of the largest multinationals, one British, one Dutch, and one Gennan, operate in the U.S. primary olefins industry. In 1990, these firms acc01mted for less than 10 percent of U.S production of primary olefins.
Consumer Characteristics and Factors Affecting Demand
The domestic industries consuming major primary olefins are the plastic resins industry and the synthetic rubber (elastomers) industry (figure 1). The products manufactured by the fmns in these industries include polyethylene, polypropylene, polyvinylchloride, polystyrene, and elastomers such as polybutadiene and styrene-butadiene rubber. From these products are manufactured thousands of finished plastic and rubber products, including unsupported and laminated plastic
4 ''Chemicals and Allied Products," U.S. Industrial 011tlook, 1992, pp. 11-4, 11-5, 11-6.
film and sheet, plastic rods and blbes, as well as foam products. Miscellaneous plastics include products as diverse as air mattresses, watering pots, and work gloves. The packaging industry consumes 30 percent of processed plastics, and the building and construction industry another 20 percent. Packaging applications include bottles, vials, drums, food containers, and blister and bubble containers. The building and construction applications include pipes, conduit, bathroom units, fittings, flooring, and insulation materials. Elastomeric applications include tires, inner blbes, rubber and plastics footwear, gaskets, packing and sealing devices, and miscellaneous rubber products such as bathing caps, wet suits, pacifiers, and teething rings. As can be inferred from the array of fabricated finished products, demand shifts for major primary olefins tend to follow the expansionary and recessionary phases of the general economy. However, since 1989, U.S. exports of plastic resins and elastomers have increased 43 percent and have offset any overall tendency toward primary olefms production decreases during this period.
FOREIGN INDUSTRY PROFILE In addition to the United States, which accounts for
about 35 percent of world olefins production, the other major olefin producers are the European Community (EC) and Japan. The EC accounts for about 33 percent of world production, while Japan's output is about 12 percent of the total. Gennany, France, the Netherlands, and the United Kingdom account for over 75 percent of EC production. Unlike the United States, which bases much of its olefins production on natural gas feedstocks, the EC and Japan primarily use naphtha (a petroleum refining product) as a feedstock for the production of primary olefms.
EC petrochemical companies tend to be major multinational firms. They are vertically integrated back to the production of feedstock and forward to the production of intennediate or final consumer goods. Currently, about 40 percent of the EC's petrochemical industry is either government-owned or influenced by government policies. Japan's olefms industry is vertically integrated forward. Strong domestic demand for plastics and synthetic fibers exists. The Japane8e Government, through the Ministty of International Trade and Industry {MITI), recognizes that Japan possesses no petroleum resource base; therefore, MITI reportedly strongly influences the domestic olefins industry in an attempt to provide stability in meeting domestic demands.
U.S. TRADE MEASURESS
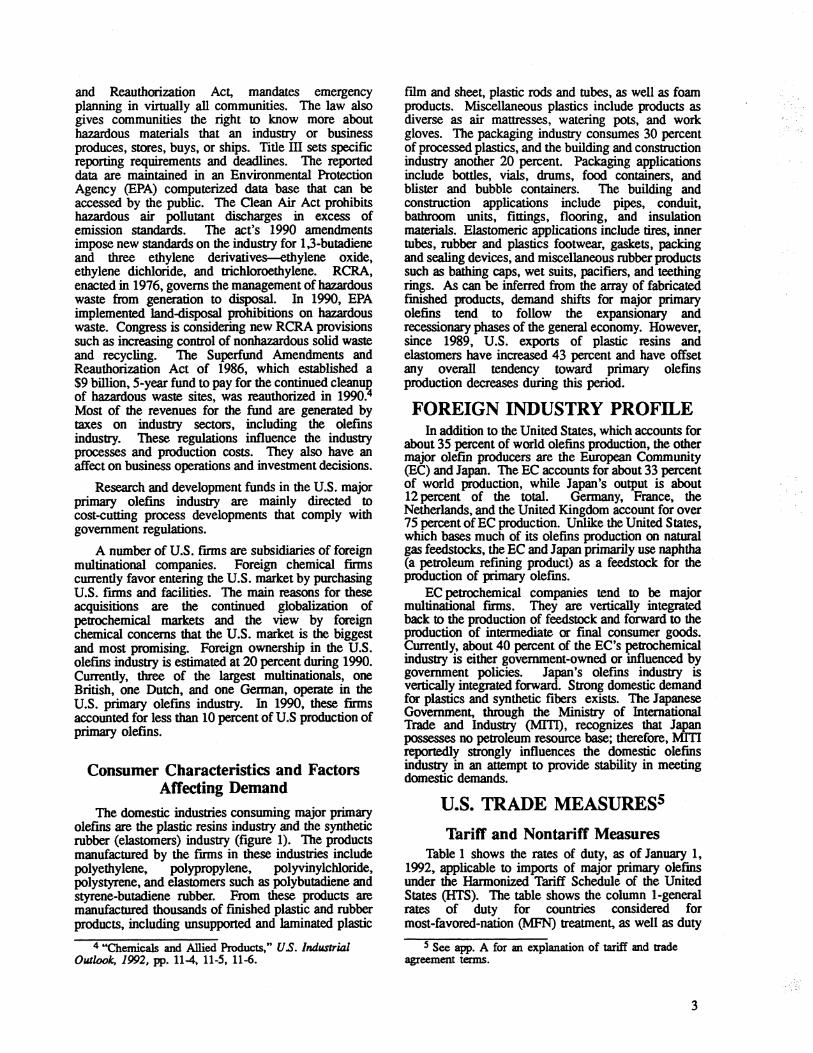
Tariff and Nontariff Measures Table 1 shows the rates of duty, as of January l,
1992, applicable to imports of major primary olefms under the Harmonized Tariff Schedule of the United States (HTS). The table shows the column I-general rates of duty for countries considered for most-favored-nation (MFN) treatment, as well as duty
S See app. A for an explanation of tariff and trade agreement terms.
3
Table 1 Major primary oleflns: Harmonized Tariff Schedule subheading; description; U.S. col.1 rate of duty as of Jan.1, 1992; U.S. exports, 1991; and U.S. Imports, 1991
HTS subheading Description
Col. 1 rate of duty As of Jan. 1, 1992 General Special1
2711.14.00 Ethylene, propylene, butylene and butadiene1 . . . . . . .. . . . . . Free 2901.21.00 Ethylene . .. .. . . . . . . . .. . . .. .. .. .. . .. . . . . . . .. . .. . .. . Free 2901.22.00 Propylene . . . . . . . . . . . . . . . . . . . . . . . . . . . . . . . . . . . . . . . . . Free 2901.23.00 But)'lene and isomers thereof . . . . . . . . . . . . . . . . . . . . . . . . Free 2901.24.10 1,3-Butadiene . . . . . . . . . . . . . . . . . . . . . . . . . . . • . . . . . . . . . Free
1 These primary olefins are not as pure as those following which are classified in chapter 29 of the HTS. 2$220,000.
Source: U.S. exports and imports compiled from official statistics of the U.S. Department of Commerce.
U.S. exports, 1991
U.S. imports, 1991
- Million dollars --40 102 3 1
149 13 30 12 (2) 60
rates. unde~ column 1 for countries qualifying under special tariff programs. Duty:.free status of ethylene, propylene, butylenes, and 1,3-butadiene was provided for in the Tariff Act of 1930. There are no known domestic nontariff import restrictions on major primary olefins.
U.S. Government Trade-Related Investigations
Upon request of the Committee on Finance of the p.s. ~en~te, the Commission conducted a factfinding invesugauon under section 332 of the Tariff Act of 1930 (19 U.S.C. 1332), investigation No. 332-230, "U.S. Gl~bal Competitiveness: Building-Block Petrochemicals and Competitive Implications for Construction, Automobiles, and Other Major Consuming Industries." The report, USITC p~blication 2005, was published in August 1987; pnmary olefins were identified as major building-block petrochemicals. One of the principal findings of the study was that the most important factor explaining changes ~n f:be CO!Ilpetitiyeness of. the primary petrochemical industnes of different nations is changes in world prices of crude peb'Oleum.
FOREIGN TRADE MEASURES During 1987-91, the major foreign markets for
domestic producers of primary olefins were Canada, Korea, and Mexico. Foreign tariff rates for primary olefins range from duty free on goods imported from the United States into Canada, the EC, and Japan, to 30 percent ad valorem plus a 7 percent value-added tax on goods imported from the United States into Thailand ~ foreign ~ rate on U.S. primary olefins entenng the Republic of Korea is 5 percent ad valorem; entering Mexico it is 10 percent ad valorem, excluding 1,3-butadiene, which is duty-free. There are
Table2
no ~o~ nontariff measures affecting U.S. exports of major pnmary olefins to our major foreign markets.6
U.S. MARKET
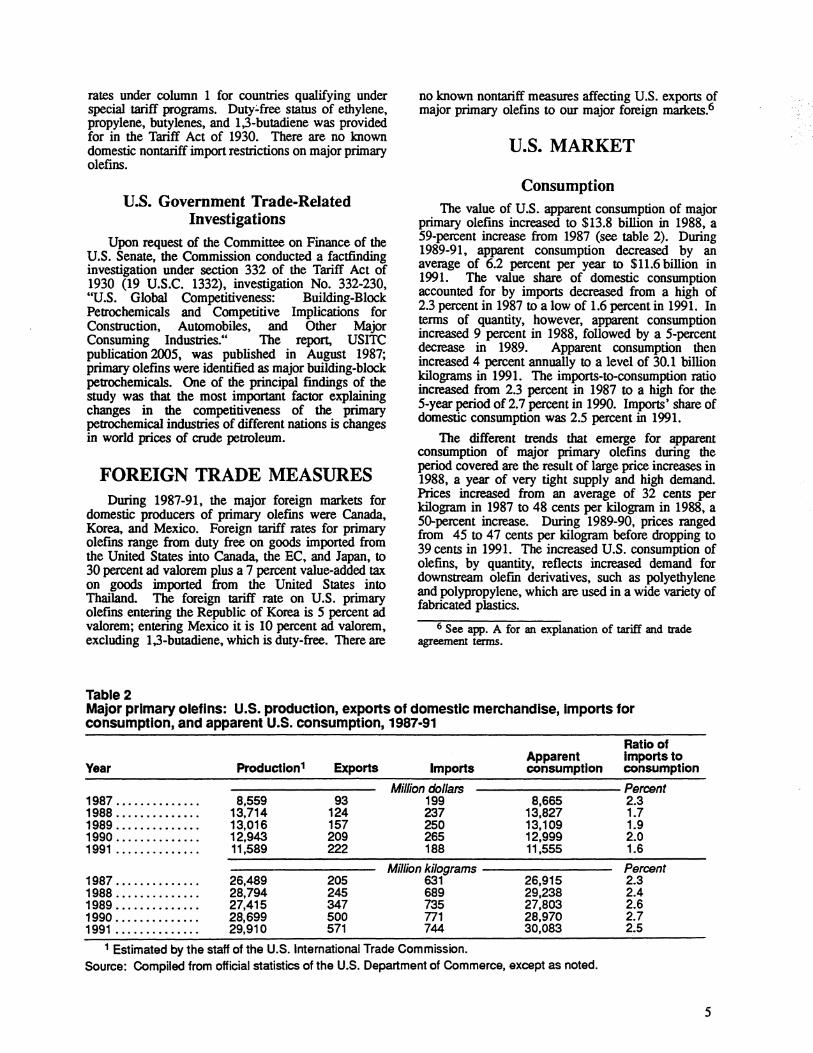
Consumption . The value of U.S. apparent consumption of major
pnmary olefins increased to $13.8 billion in 1988 a 59-percent increase from 1987 (see table 2). Duri°ng 1989-91, apparent consumption decreased by an average of 6.2 percent per year to $11.6 billion in 1991. The value share of domestic consumption accounted ~or by imports decreased from a high of 2.3 percent in 1987 to a low of 1.6 percent in 1991. In terms of quantity, however, apparent consumption increased~ percent in 1988, followed by a 5-percent decrease in 1989. Apparent consumption then ~creased 4 percent annually to a level of 30.1 billion !dlograms in 1991. The imports-to-consumption ratio mcreased from 2.3 percent in 1987 to a high for the 5-year period of 2 7 percent in 1990. Imports• share of domestic consumption was 2.5 percent in 1991.
The different trends that emerge for apparent co~sumption of major primary olefins during the period covered are the result of large price increases in 19~8. a year of very tight supply and high demand. ~ces in~ from an average of 32 cents per kilogram in_ 1987 to 48 cents per kilogram in 1988, a SO-percent increase. During 1989-90, prices ranged from 45. to 47 cents ~r kilogram before dropping to 39 cents m 1991. The increased U.S. consumption of olefins, by quantity, reflects increased demand for downstream olefin derivatives, such as polyethylene and polypropylene, which are used in a wide variety of fabricated plastics.
6 See app. A for an explanation of tariff and trade agreement terms.
Major primary oleflns: U.S. production, expons of domestic merchandise, Imports for consumption, and apparent U.S. consumption, 1987-91
Ratio of
Year Productlon1 Exports Imports Apparent consumption
Imports to consumption
Million dollars Percent 1987 .............. 8,559 93 199 8,665 2.3 1988 .............. 13,714 124 237 13,827 1.7 1989 .............. 13,016 157 250 13,109 1.9 1990 .............. 12,943 209 265 12,999 2.0 1991 .............. 11,589 222 188 11,555 1.6
Million kilograms Percent 1987 .............. 26,489 205 631 26,915 2.3 1988 .............. 28,794 245 689 29,238 2.4 1989 .............. 27,415 347 735 27,803 2.6 1990 .............. 28,699 500 n1 28,970 2.7 1991 .............. 29,910 571 744 30,083 2.5
1 Estimated by the staff of the U.S. International Trade Commission. Source: Compiled from official statistics of the U.S. Department of Commerce, except as noted.
5
Production
U.S. production (quantity) of major primary olefins increased from 26.5 billion kilograms in 1987 to about 29.9 billion kilograms in 1991. This 13-percent increase represents an annual average increase of 3.1 percent for the period. With the exception of 1989, major olefins production increased every year during this period. In 1989, production decreased 4.8 percent in response to reduced demand caused by a slowdown in the economy and customer inventory reduction of olefins and plastic resins. During 1991, estimated production increased 4.2 percent from the 1990 level because of strong end-product demand for olefin derivatives, particularly plastics. During 1992-96,
Table 3
major olefins production is projected to grow about 3 percent annually.
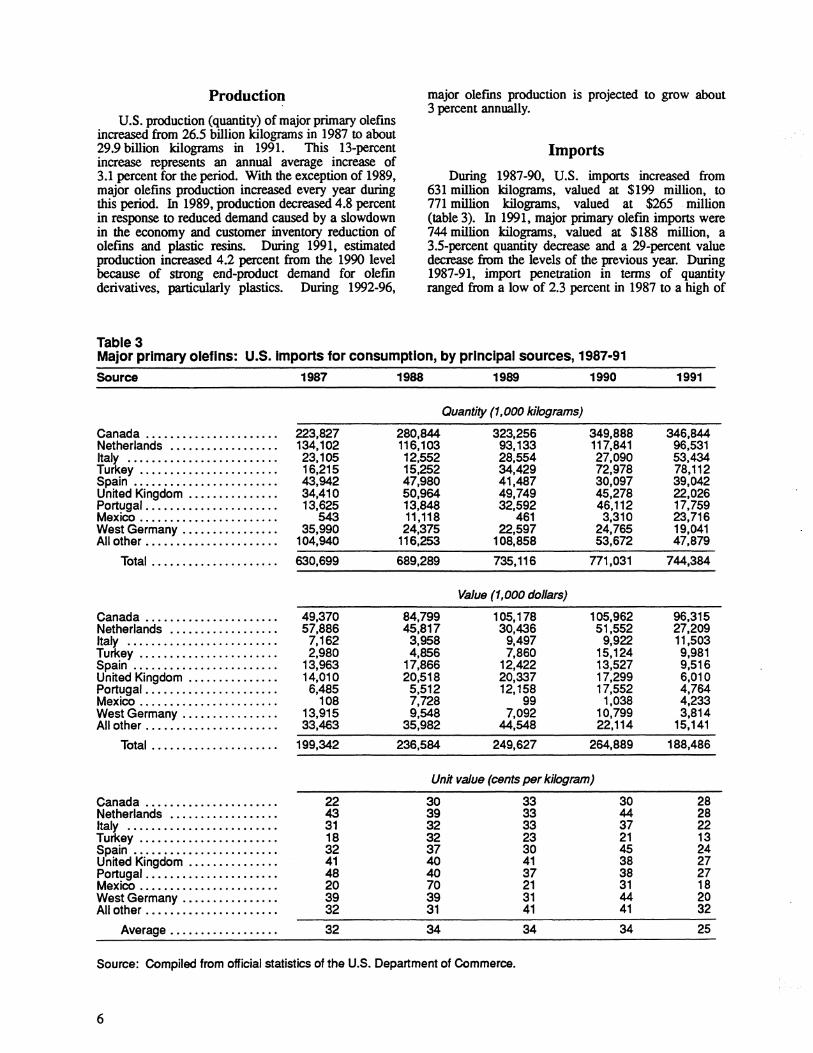
Imports
During 1987-90, U.S. imports increased from 631 million kilograms, valued at $199 million, to 771 million kilograms, valued at $265 . million (table 3). In 1991, major primary olefin imports were 744 million kilograms, valued at $188 million, a 3.5-percent quantity decrease and a 29-percent value decrease from the levels of the previous year. During 1987-91, import penetration in terms of quantity ranged from a low of 2.3 percent in 1987 to a high of
Major primary oleflns: U.S. Imports for consumption, by principal sources, 1987·91
Source 1987 1988 1989 1990 1991
Quantity (1,000 kilograms)
Canada ..•.••.•.....•.••••.•. 223,827 280,844 323,256 349,888 346,844 Netherlands ................... 134,102 116,103 93,133 117,841 96,531 lta~ .••.•..•..•.....•..••.... 23,105 12,552 28,554 27,090 53,434 Tu ey ..•••••.••••.......••.. 16,215 15,252 34,429 72,978 78,112 Spain •.••••••.•.••........•.. 43,942 47,980 41,487 30,097 39,042 United Kingdom .•••.....•..••. 34,410 50,964 49,749 45,278 22,026 Portugal ...•...•...••..••....• 13,625 13,848 32,592 46,112 17,759 Mexico ..••..•..••.•........•• 543 11,118 461 3,310 23,716 West Germany ..•••........••• 35,990 24,375 22,597 24,765 19,041 All other ••••••.•••...••..••••. 104,940 116,253 108,858 53,672 47,879
Total .••••.•••.......•.••. 630,699 689,289 735,116 771,031 744,384
Value (1,000 dollars)
Canada •...........•...•....• 49,370 84,799 105,178 105,962 96,315 Netherlands ........ ·········· 57,886 45,817 30,436 51,552 27,209 Italy .•...•.•.•....•....••.... 7,162 3,958 9,497 9,922 11,503 Turkey ....••••..••...•..•...• 2,980 4,856 7,860 15,124 9,981 Spain ........•..........•.... 13,963 17,866 12,422 13,527 9,516 United Kingdom .•........••... 14,010 20,518 20,337 17,299 6,010 Portugal ..•...•...•......•.••. 6,485 5,512 12, 158 17,552 4,764 Mexico .....•••..•.•....•..... 108 7,728 99 1,038 4,233 West Germany .•.•...•........ 13,915 9,548 7,092 10,799 3,814 All other .....••.......••...•.. 33,463 35,982 44,548 22,114 15,141
Total ••••••••.....•.....•. 199,342 236,584 249,627 264,889 188,486
Unit value (cents per kilogram)
Canada .••••••.••..•••...••.. 22 30 33 30 28 Netherlands .................. 43 39 33 44 28 Italy .....•.•...•.••••••••..•• 31 32 33 37 22 Turkey ..••.•..•..••••••••••.. 18 32 23 21 13 Spain ..•••.•••••.....•.••••.• 32 37 30 45 24 United Kingdom ..•.•.......•.• 41 40 41 38 27 Portugal •••••••••....••..•••.• 48 40 37 38 27 Mexico •......••••••.......••• 20 70 21 31 18 West Germany .•..•••.•.•.•..• 39 39 31 44 20 All other ..•••••.•••••.•.•.•••• 32 31 41 41 32
Average .•.••••.....•.•••. 32 34 34 34 25
Source: Compiled from official statistics of the U.S. Department of Commerce.
6
2.7 percent in 1990. In 1991, it was 2.5 percent The apparent discrepancy in the level of decreased imports during 1991 (quantity vs. value) is due to the large drop in prices for 1,3-butadiene. Import prices for this olefin fell to their lowest level in more than 5 years, from an average 46 cents per kilogram in 1990 to 29 cents per kilogram average in 1991. Quantity imports of 1,3-butadiene actually increased almost 1 percent in 1991; however, the average price of the olefin decreased 37 percent. Since 1,3-butadiene imports constitute 50 percent of U.S. major olefm imports, large price changes in this commodity strongly influence the average price for major primary olefins.
The principal suppliers of imported olefins to the United States during 1987-91 were Canada and the EC.
Table4
In 1991, Canada supplied more than 46 percent of U.S. major primary olefin imports, while the EC supplied another 34 percent. The Netherlands and Italy supplied more than half of the EC share. The principal consumers of imported primary olefins are the specialty chemical companies producing plastics resins and elastomers.
FOREIGN MARKETS
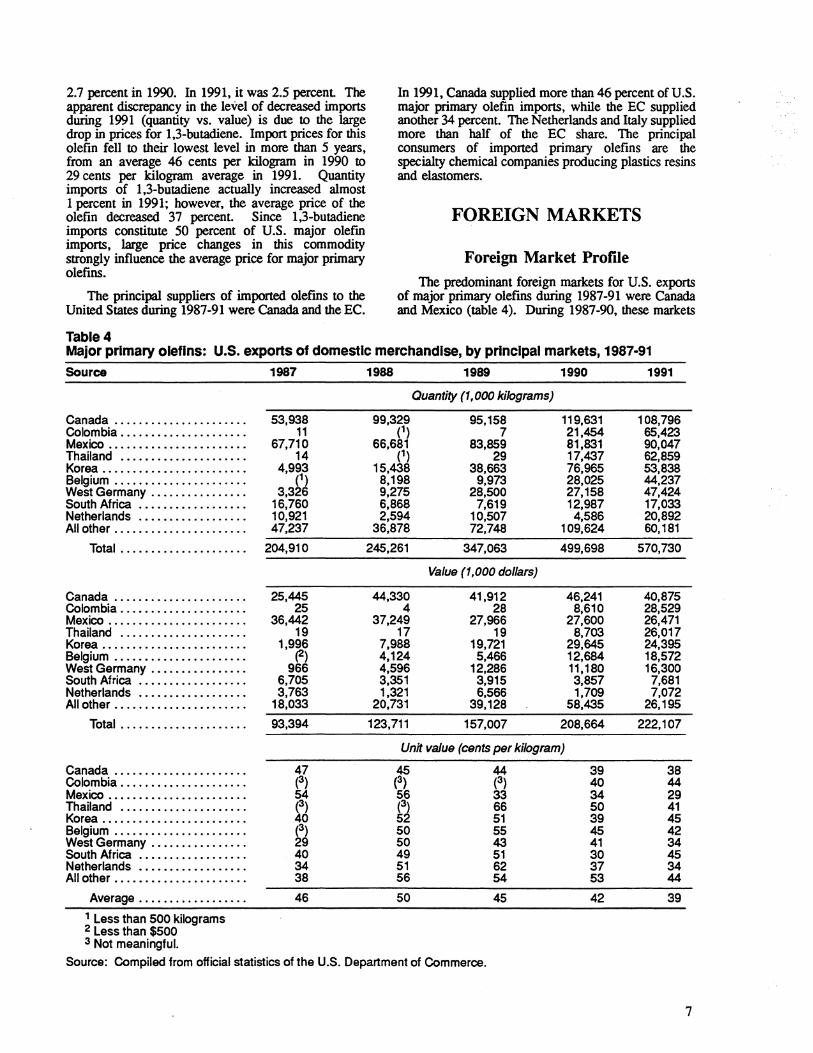
Foreign Market Profile The predominant foreign markets for U.S. exports
of major primary olefms during 1987-91 were Canada and Mexico (table 4). During 1987-90, these markets
Major primary oleflns: U.S. exports of domestic merchandise, by principal markets, 1987·91
Source
Canada ...............•...... Colombia ....••............... Mexico ..............••......• Thailand .•.•••............... Korea .......................• Belgium ..................... . West Germany .•.............. South Africa ................. . Netherlands .•..•............. All other .............•........
Canada ..................... . Colombia ..........•.......... Mexico ......•................ Thailand .......•.....•....•.. Korea ......•...•............. Belgium .....•.....•.......... West Germany .•........•..... South Africa .....•....•.....•. Netherlands ....•......•...... All other ..................... .
Total .....•..........•....
Canada .....................• Colombia .....••......•......• Mexico •..•....•...•.....•.... Thailand .................... . Korea ................•....... Belgium ...................•.. West Germany ............... . South Africa .........••.....•. Netherlands •................. All other .......•...•........•.
Average ................. .
1 Less than 500 kilograms 2 Less than $500 3 Not meaningful.
1987
53,938 11
67,710 14
4,993 (1)
3,326 16,760 10,921 47,237
25,445 25
36,442 19
1,996 <2>
966 6,705 3,763
18,033
93,394
47 (3) 54 (3) 40 (3) 29 40 34 38
46
1988 1989
Quantity (1,000 kilograms)
99,329 95, 158 (1) 7
66,681 83,859 (1) 29
15,438 38,663 8,198 9,973 9,275 28,500 6,868 7,619 2,594 10,507
36,878 72,748
245,261 347,063
Value (1,000 dollars)
44,330 41,912 4 28
37,249 27,966 17 19
7,988 19,721 4,124 5,466 4,596 12,286 3,351 3,915 1,321 6,566
20,731 39,128
123,711 157,007
1990
119,631 21,454 81,831 17,437 76,965 28,025 27,158 12,987 4,586
109,624
499,698
46,241 8,610
27,600 8,703
29,645 12,684 11,180 3,857 1,709
58,435
208,664
Unit value (cents per kilogram)
45 44 (3) (3) 56 33 (3) 66 52 51 50 55 50 43 49 51 51 62 56 54
50 45
39 40 34 50 39 45 41 30 37 53
42
Source: Compiled from official statistics of the U.S. Department of Commerce.
1991
108,796 65,423 90,047 62,859 53,838 44,237 47,424 17,033 20,892 60, 181
570,730
40,875 28,529 26,471 26,017 24,395 18,572 16,300 7,681 7,072
26,195
222,107
38 44 29 41 45 42 34 45 34 44
39
7
received about 50 percent of U.S. exports. In 1991, exports to Canada were valued· at $41 million and represented over 18 percent of total U.S. exports; exports to Mexico represented 12 percent. The value of U.S. exports increased over 6 percent in 1991, but Canada and Mexico's combined share of that total was only 30 percent. Signfficant levels of exports to Colombia ($29 million, 13 percent of total), Thailand ($26 million, 12 percent), and the Republic of Korea ($24 million, 11 percent) during 1991 explain the reduced dominance of Canada and Mexico as U.S. export markets.
The United States was the major source of Canadian and Mexican imports of major primary olefins during 1987-91. Industry analysts have indicated it is unlikely that the implementation of the EC 1992 single market program or the shift of Eastern European countries to a market economy will have any significant effect on international trade of major primary olefins in the foreseeable future. Loss of Western Europe as a source of 1,3-butadiene could be disruptive, but this possibility is remote given the EC's preponderant use of naphtha as a feedstock in olefins production. Furthermore, among major U.S. trading partners (Canada, Japan, and the EC), imports of major primary olefins are virtually duty free.
U.S. Exports U.S. exports of major primary olefins (table 4) as a
percentage of production steadily inaeased from 0.8 percent in 1987 to 1.9 percent in 1991. The commodity mix of U.S. exports generally includes a
8
larger proportion of propylene than the other olefins, particularly in 1991. Growth in the demand for polypropylene fibers and resins, as well as propylene oxide, which is used in Urethane chemicals, polyester resins, and various solvents is considered to be the driving force behind propylene's preponderance in the U.S. major ole:fins export mix.
U.S. exports of primary olefins increased from $93 million in 1987 to $222 million in 1991, representing an increase of almost 140 percent during the period. The average annual increase was about 25 percent. In 1991, the value of U.S. exports exceeded imports for the first time during 1987-91. Petroleum companies, such as Exxon and Shell, are the principal exporters of major primary olefins.
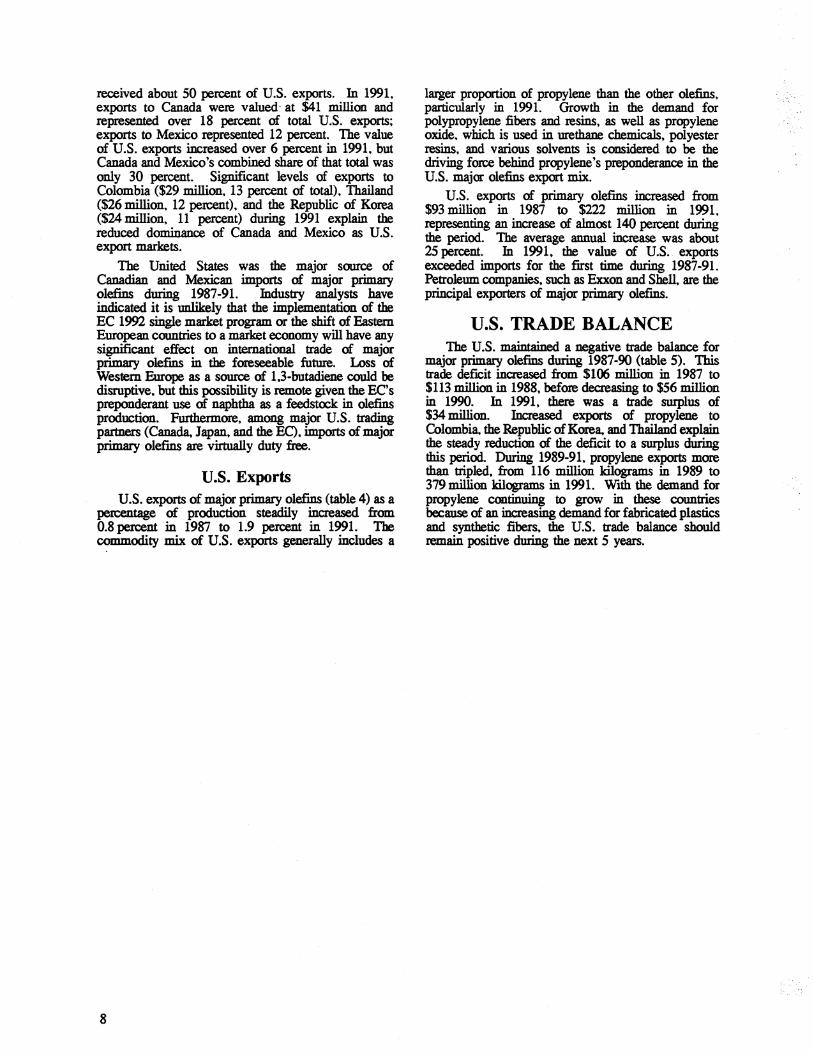
U.S. TRADE BALANCE The U.S. maintained a negative trade balance for
major primary ole:fins during 1987-90 (table 5). This trade deficit inaeased from $106 millim in 1987 to $113 million in 1988, before decreasing to $56 million in 1990. In 1991, there was a trade surplus of $34 million. Increased exports of propylene to Colombia. the Republic of Korea. and Thailand explain the steady reduction of the deficit to a surplus during this period. During 1989-91, propylene exports more than tripled, from 116 million kilograms in 1989 to 379 million kilograms in 1991. With the demand for propylene continuing to grow in these countries because of an increasing demand for fabricated plastics and synthetic fibers, the U.S. trade balance should remain positive during the next 5 years.
.... ·.
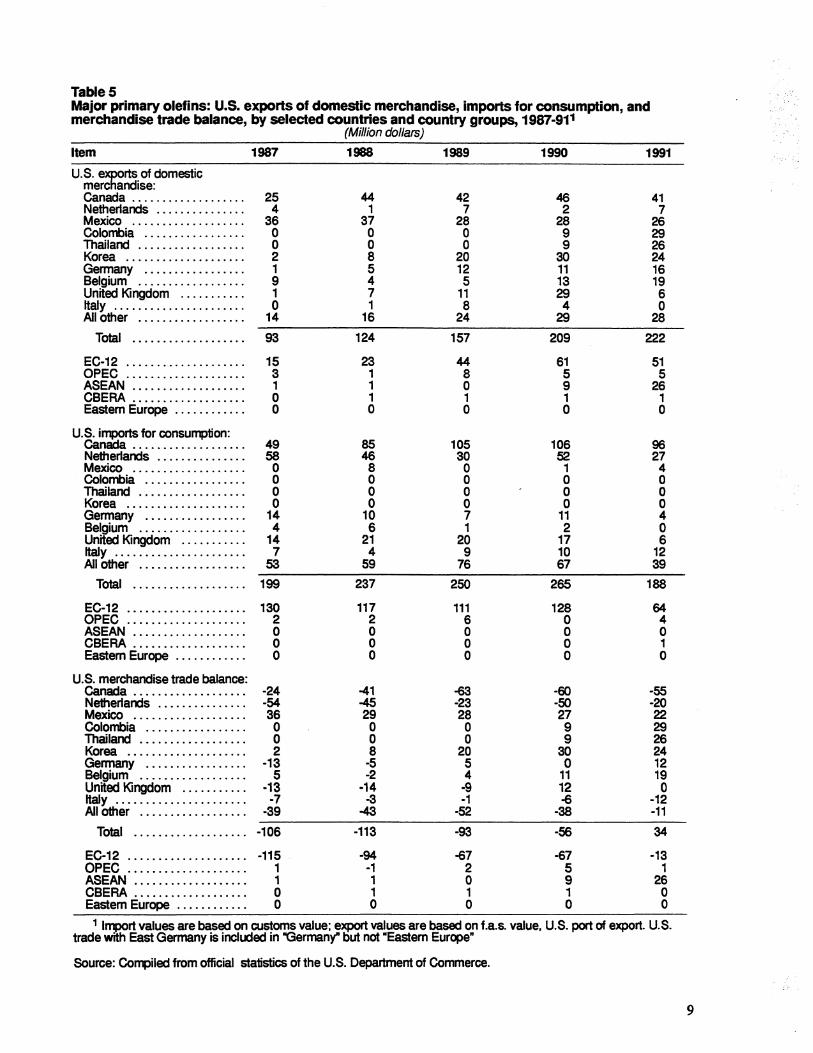
Table5 Major primary olefins: U.S. exports of domestic merchandise, Imports for consumption, and merchandise trade balance, by selected countries and country groups, 1987·911
(Million dollars)
Item 1987 1988 1989 1990 1991
U.S. exports of domestic merchandise: Canada................... 25 44 42 Netherlands . . . . . . . . . . . . . . . 4 1 7 Mexico . . . . . . . . . . . . . . . . . . . 36 37 28 Colombia . . . . . . . . . . . . . . . . . O O O Thailand . . . . . . . . . . . . . . . . . . o o O Korea . . .. . . . . . . . . . . . . . . . . 2 8 20 Germany .. . . . . . . . . . . . . . . . 1 5 12 Belgium . . . . . .. . . . . . . . . . . . 9 4 5 United Kingdom . . . . . . . . . . . 1 7 11 Italy . . . .. . . . . . . . . . . . . . . . . . 0 1 8 All other . . . . . . . . . . . . . . . . . . 14 16 24
46 2
28 9 9
30 11 13 29 4
29
41 7
26 29 26 24 16 19 6 0
28 ~~~~~~~~~~~~~~~~~~~~~~~~
Total . . .. . . . . . . . . . . . . . . . 93 124 157
EC-12 . . . . . . . . . . . . . . . . . . . . 15 OPEC .................... 3 ASEAN ................... 1 CBERA ................... 0 Eastem Europe . . . . . . . . . . . . 0
23 1 1 1 0
44 8 0 1 0
209
61 5 9 1 0
222
51 5
26 1 0
U.S. imports for consumption: Canada . . . . . . . . . . . . . . . . . . . 49 85 105 106 96 Netherlands . . . . . . . . . . . . .. . 58 46 30 52 27 Mexico ................... 0 8 0 1 4 Colombia . . . . . . . . . . . . . . . . . O O o o o Thailand . . . . . . . . . . . . . . . . . . 0 0 0 0 0 Korea .................... 0 O O O O Germany . . . . . . . . . . . . . . . . . 14 10 7 11 4 Belgium .................. 4 6 1 2 O United Kingdom . . . . . . . . . . . 14 21 20 17 6 Italy . . . . . . . . . . . . . . . . . . . . . . 7 4 9 10 12 All other . . . . . . . . . . . . . . . . . . 53 59 76 67 39
~~~~~~~~~~~~~~~~~~~~~~~~
Total . . . . . . . . . . . . . . . . . . . 199 237 250 265 188
EC-12 . . . . . . . . . . . . . . . . . . . . 130 117 111 128 64 OPEC .................... 2 2 6 0 4 ASEAN ................... 0 0 0 0 0 CBERA . . . . . . . . . . . . . . . . . . . 0 0 0 0 1 Eastem Europe . . . . . . . . . . . . 0 0 0 0 0
U.S. merchandise trade balance: Canada . . . . . . . . . . . . . . . . . . . -24 -41 -63 -60 -55 Netherlands . . . . . . . . . . . . . . . -54 -45 -23 -50 -20 Mexico . . . . . . . . . . . . . . . . . . . 36 29 28 27 22 Colombia . . . . . . . . . . . . . . . . . o o o 9 29 Thailand . . . . . . . . . . . . . . . . . . 0 0 0 9 26 Korea . . . . . . . . . . . . . . . . . . . . 2 8 20 30 24 Germany . . . . . . . . . . . . . . . . . -13 -5 5 o 12 Belgium . . . . . . . . . . . . . . . . . . 5 -2 4 11 19 United Kingdom . . . . . . . . . . . ·13 ·14 ·9 12 O Italy . . . . . . . . . . . . . . . . . . . . . . -7 -3 -1 -6 -12 All Other . . . . . . . . . . . . . . . . . . -39 -43 -52 -38 -11
~~~~~~~~~~~~~~~~~~~~~~~~
Total . . . . . . . . . . . . . . . . . . . -106 -113 -93 -56 34
EC-12 . . . . . . . . . . . . . . . . . . . . -115 -94 -67 -67 -13 OPEC . . . . . . . . . . . . . . . . . . . . 1 ·1 2 5 1 ASEAN ................... 1 1 0 9 26 CBERA . . . . . . . . . . . . . . . . . . . 0 1 1 1 0 Eastern Europe . . . . . . . . . . . . O O O O O
1 lrTP.C>rt values are based on customs value; export values are based on f.a.s. value, U.S. port of export. U.S. trade with East Germany is included in "Germany" but not •Eastem Europe•
Source: Compiled from official statistics of the U.S. Department of Commerce.
9

APPENDIX A EXPLANATION OF TARIFF AND TRADE AGREEMENT TERMS
TARIFF AND TRADE AGREEMENT TERMS
The Harmonized Tariff Schedule of the United States (HTS) replaced the Tariff Schedules of the United States (TSUS) effective January 1, 1989. Chapters 1 through 97 are based on the internationally adopted Harmonized Commodity Description and Coding System through the 6-digit level of product description, with additional U.S. product subdivisions at the 8-digit level. Chapters 98 and 99 contain special U.S. classification provisions and temporary rate provisions, respectively.
Rates of duty in the general subcolumn of HTS column 1 are most-favored-nation (MFN) rates; for the most part, they represent the final concession rate from the Tokyo Round of Multilateral Trade Negotiations. Column I-general duty rates are applicable to imported goods from all countries except those enumerated in general note 3(b) to the HTS, whose products are dutied at the rates set forth in column 2. Goods from Annenia, Bulgaria, the People's Republic of China, Czechoslovakia, Estonia, Hungary, Latvia, Lithuania, Moldova, Mongolia, Poland, Russia, the Ukraine and Yugoslavia are currently eligible for MFN treatment. Among articles dutiable at column I-general rates, particular products of enumerated countries may be eligible for reduced rates of duty or for duty-free entry under one or more preferential tariff programs. Such tariff treatment is set forth in the special subcolumn of HTS column 1. Where eligibility for special tariff treatment is not claimed or established, goods are dutiable at column I-general rates.
The Generalized System of Preferences (GSP) affords nonreciprocal tariff preferences to developing countries to aid their economic development and to diversify and expand their production and exports. The U.S. GSP, enacted in title V of the Trade Act of 1974 and renewed in the Trade and Tariff Act of 1984, applies to merchandise imported on or after January 1, 1976, and before July 4, 1993. Indicated by the symbol "A" or "A*" in the special subcolumn of column l, the GSP provides duty-free entry to eligible articles the product of and imported directly from designated beneficiary developing countries, as set forth in general note 3(c)(ii) to the HTS.
A-2
The Caribbean Basin Economic Recovery Act (CBERA) affords nonreciprocal tariff preferences to developing countries in the Caribbean Basin area to aid their economic development and to diversify and expand their production and exports. The CBERA, enacted in title II of Public Law 98-67, implemented by Presidential Proclamation 5133 of November 30, 1983, and amended by the Customs and Trade Act of 1990, applies to merchandise entered, or withdrawn from warehouse for consumption, on or after January l, 1984; this tariff preference program has no expiration date. Indicated by the symbol "E" or "E*" in the special subcolumn of column l, the CBERA provides duty-free entry to eligible articles the product of and imported directly from designated countries, as set forth in general note 3(c)(v) to the HTS.
Preferential rates of duty in the special subcolumn of column 1 followed by the symbol "IL" are applicable to products of Israel under the United States-Israel Free-Trade Area lmplementati.on Act of 1985, as provided in general note 3(c)(vi) of the HTS. When no rate of duty is provided for products of Israel in the special subcolumn for a particular provision, the rate of duty in the general subcolumn of column 1 applies.
Preferential rates of duty in the special duty rates subcolumn of column 1 followed by the symbol "CA" are applicable to eligible goods originating in the territory of Canada under the United States-Canada Free-Trade Agreement, as provided in general note 3(c)(vii) to the HTS.
Preferential nonreciprocal duty-free or reducedduty treatment in the special subcolumn of column 1 followed by the symbol "J" or "J*" in parentheses is afforded to eligible articles the product of designated beneficiary countries under the Andean Trade Preferences Act (ATPA), enacted in title II of Public Law 102-182 and implemented by Presidential Proclamation 6455 of July 2, 1992 (effective July 22, 1992), as set forth in general note 3(c)(ix) to the HTS.
Other special tariff treatment applies to particular products of insular possessions (general note 3(a)(iv)), goods covered by the Automotive Products Trade Act (general note 3(c)(iii)) and the Agreement on Trade in Civil Aircraft (general
note 3(c)(iv)), and articles imported from freely associated states (general note 3(c)(viii)).
The General Agreement on Tari.Ifs and Trade (GATI) (61 Stat (pt 5) A58; 8 UST (pt 2) 1786) is the multilateral agreement setting forth basic principles governing international trade among its more than 90 signatories. The GATI's main obligations relate to most-favored-nation treatment, the maintenance of scheduled concession rates of duty, and national (nondiscriminatory) treatment for imported products. The GATI also provides the legal frameworlc. for customs valuation standards, "escape clause" (emergency) actions, antidumping and countervailing duties, and other measures. Results of GATI'-sponsored multilateral tariff negotiations are set forth by way of separate schedules of concessions for each participat-
ing contracting party, with the U.S. schedule designated as schedule XX.
Officially known as ''The Arrangement Regarding International Trade in Textiles," the Multifiber Arrangement (MFA) provides a frameworlc. for the negotiation of bilateral agreements between importing and producing countries, or for unilateral action by importing countries in the absence of an agreement. These bilateral agreements establish quantitative limits on imports of textiles and apparel, of cotton and other vegetable fibers, wool, manmade fibers, and silk blends, in order to prevent marlc.et disruption in the importing countries--restrictions that would otherwise be a departure from GATI provisions. The United States has bilateral agreements with more than 30 supplying countries, including the four largest suppliers: China, Hong Kong, the Republic of Korea, and Taiwan.
A-3


