Inefficiency in Rice Production and Land Use: A Panel Study of Japanese Rice Farmers Osaka University Institute of Social and Economic Research Kazuo Ogawa October 13-14, 2016 Hitotsubashi-RIETI International Workshop on Real Estate Market, Productivity, and Prices
Transcript
Inefficiency in Rice Production and Land Use:
A Panel Study of Japanese Rice Farmers
Osaka University Institute of Social and Economic Research
Kazuo Ogawa
October 13-14, 2016 Hitotsubashi-RIETI International Workshop on Real Estate Market, Productivity, and Prices
1. Introduction Decreasing trend of Japan’s demand for rice Annual consumption of rice per capita
118 kg per capita in 1962 55 kg per capita in 2014
Figure 1 Yield of and Demand for Rice as a Staple Food
yield demand
Source: Ministry of Agriculture, Forestry and Fisheries, Situations about Rice, Basic Principles on Demand and Supply of Rice and Price Stabilization
3
Rice production adjustment policy Promote a shift of crops from production of rice as a stable food to soybeans, grains and “new demand rice” mainly used as animal feed However, if rice as a staple food is produced by inefficient farmers, a large tax burden will be incurred to maintain the price of rice.
4
2. Purpose of the Paper Empirical analysis of the efficiency in production by the rice-producing farmers, using the panel data from the Rice Production Cost Statistics (Kome Seisanhi Chosa Tokei) reported by the Ministry of Agriculture, Forestry and Fisheries
5
Specifically, • The stochastic frontier production function with
four production factors (land, labor, capital stock, and materials) is estimated.
• The inefficiency indices of production are calculated.
• Based on the inefficiency indices, the efficient and inefficient rice producers are identified, and the factor demand behavior and the characteristics of the arable land utilization for rice production are compared.
6
3. Summary of the Results 1. On inefficiency indices: The estimate of inefficiency in production was robust, irrespective of the type of production function or the probability distribution of the inefficiency.
7
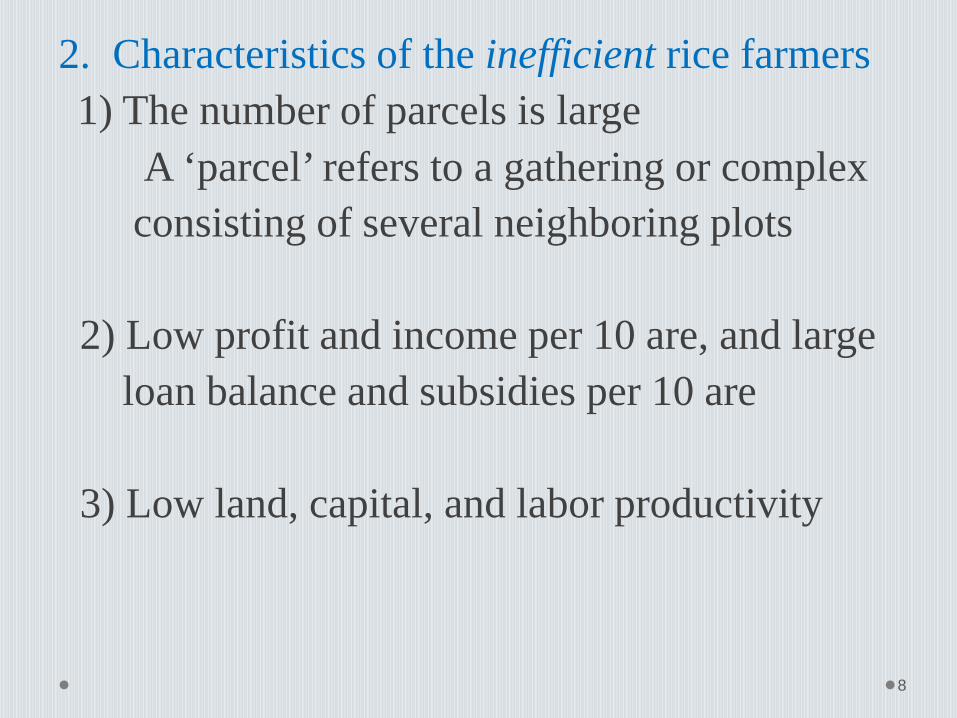
2. Characteristics of the inefficient rice farmers 1) The number of parcels is large A ‘parcel’ refers to a gathering or complex consisting of several neighboring plots 2) Low profit and income per 10 are, and large loan balance and subsidies per 10 are 3) Low land, capital, and labor productivity
8
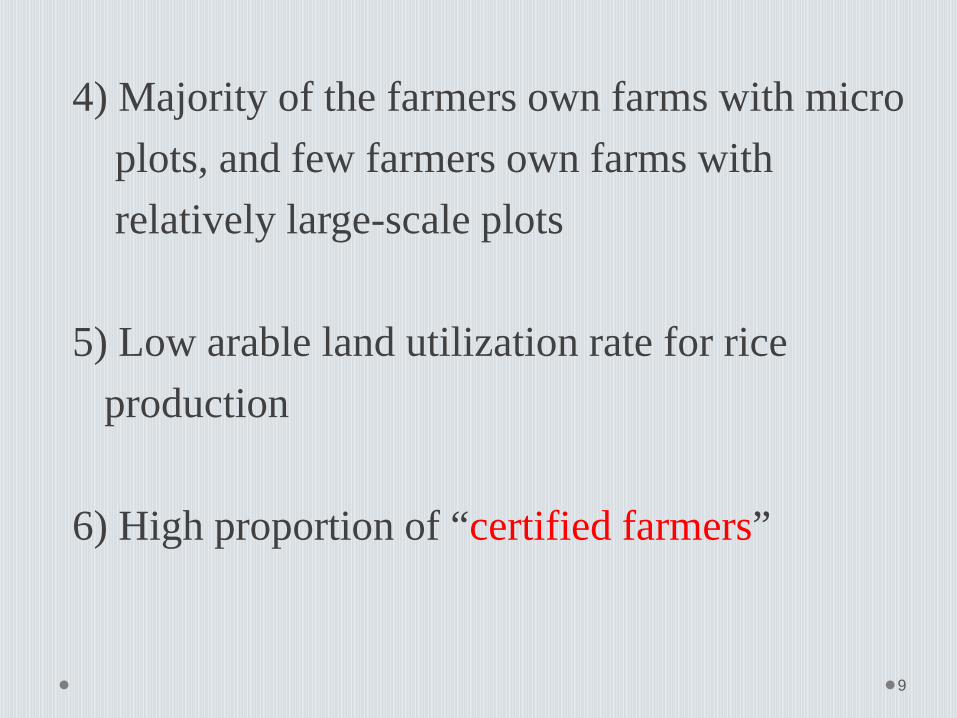
4) Majority of the farmers own farms with micro plots, and few farmers own farms with relatively large-scale plots 5) Low arable land utilization rate for rice production 6) High proportion of “certified farmers”
9
What is a “certified farmer” ? In order to be selected as a certified, a farmer passes through a process wherein she/he submits an agricultural management improvement plan to the local municipals, and they, in turn, certify for a period of 5 years. The target for expansion of management scale over the coming 5 years and the goals for attaining efficiency of agricultural management should be described in the agricultural management improvement plan.
10
Advantage of being a certified farmer • Grants and increases in the subsidies related to
agricultural production, mainly switching to new crops
• Low interest finance from the Agriculture JA Bank and the Japan Finance Corporation
Disadvantage of being a certified farmer • Various burdensome official procedures • Cooperation in production adjustment for rice was
a requirement at the stage of applying to a certified farmer prior to 2009
11
3.Characteristics of dynamic factor demand Slow adjustment of labor input by inefficient rice producers without responding to a change in wages 4. Determinants of the cultivated area used for rice production The higher the proportion of farm area in small plots, the more likely that the producer would reduce arable land utilization for rice production; and these effects were larger for the efficient producer.
12
Certified farmers reduced arable land cultivation for rice production, and the extent of this reduction was larger for efficient producers. In other words, the more efficient a certified farmer is, the more likely it is that he would use a field for something other than rice cultivation.
The productivity of rice production may decline further in the future.
13
4. Data Set and their Characteristics Rice Production Cost reported by the Ministry
of Agriculture, Forestry and Fisheries(2008~2013) The sample farmers: agricultural households
that sold at least 600 kg of unpolished rice The number of observations: 5,543
14
Data of major variables 1) Yield (Y): quantity of rice produced as the main product (kg) 2) Labor input (N): labor time spent on rice cultivation, including both family labor and hired labor (hours) 3) Land (L): area planted in rice (are) 4) Capital stock (K): buildings and structures, land improvement equipment, automobiles, agricultural machinery, and tools deflated by the corresponding price indices (ten thousand yen in 2010 price)
15
5) Materials (M) : five materials (seed and seedling, fertilizer, agricultural chemicals, light, heat and power, and various other materials costs) deflated by the corresponding price indices (ten thousand yen in 2010 price) 6) Prices: Production price (p) Wage rate (w) Land rent (pL) Rental price of capital (pK) Materials price (pM)
16
Table 2 Descriptive Statistics of Major Variables
mean median standard deviation
Yield of rice (kg) 21891 10290 31021 Area planted for rice production (a) 416.0 199.0 578.6 Labor input (hours) 816.2 515.0 914.7 Capital stock (ten thousand yen)1) 400.3 196.5 583.7 Material input (ten thousand yen)2) 100.7 49.3 139.3 Land productivity (kg/a.) 51.4 51.7 7.4 Labor productivity (kg/hour) 23.5 21.0 12.8 Capital productivity(kg/ten thousand yen) 291.5 60.0 5276.9 Arable land utilization as rice production (%) 74.2 75.6 18.2 Proportion of farm area not disposed of or in lots of less than 10 a (%)
17.4 5.1 26.8
Proportion of farm area in lots more than or equal 10 a and less than 20 a (%)
27.0 18.6 28.2
Proportion of farm area in lots more than or equal 20 a and less than 30 a (%)
27.0 18.6 29.0
Proportion of farm area in lots more than or equal 30 a and less than 50 a (%)
18.6 0.0 25.7
Proportion of farm area in lots more than or equal 50 a (%) 10.0 0.0 23.2
Notes: 1), 2) real values in 2010 price Source: Ministry of Agriculture, Forestry and Fisheries, Rice Production Cost Statistics
17
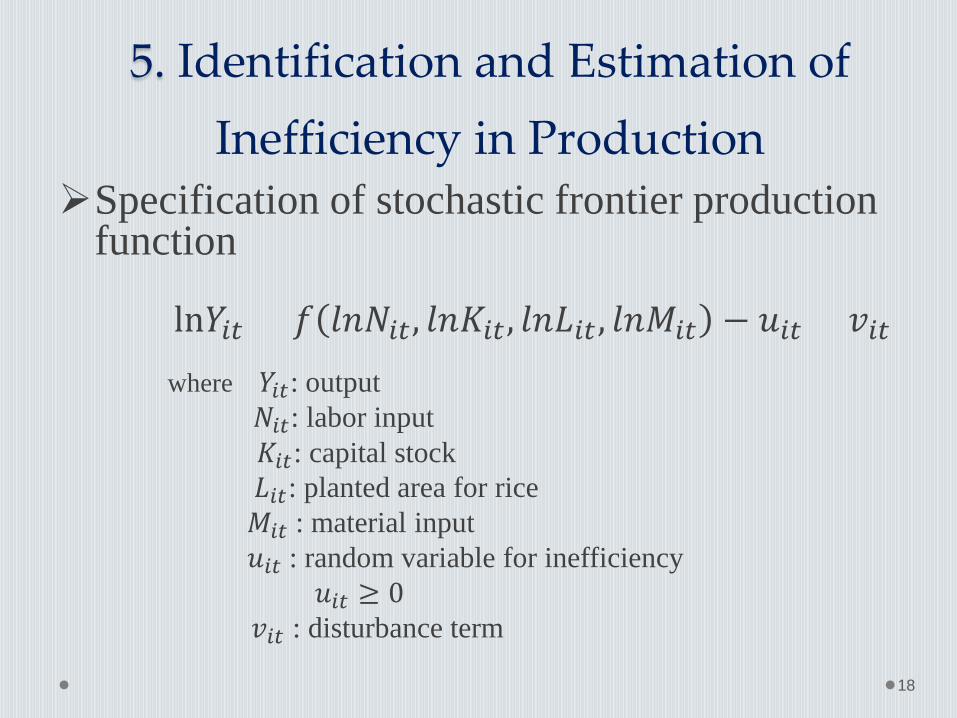
5. Identification and Estimation of
Inefficiency in Production Specification of stochastic frontier production
where 𝑌𝑌𝑖𝑖𝑖𝑖: output 𝑁𝑁𝑖𝑖𝑖𝑖: labor input 𝐾𝐾𝑖𝑖𝑖𝑖: capital stock 𝐿𝐿𝑖𝑖𝑖𝑖: planted area for rice 𝑀𝑀𝑖𝑖𝑖𝑖 : material input 𝑢𝑢𝑖𝑖𝑖𝑖 : random variable for inefficiency 𝑢𝑢𝑖𝑖𝑖𝑖 ≥ 0
𝑣𝑣𝑖𝑖𝑖𝑖 : disturbance term
18
Two types of production function 1. Cobb-Douglas production function 2. Translog production function Two types of probability distribution for
inefficiency 1. half-normal 2. truncated normal Distribution of 𝑣𝑣𝑖𝑖𝑖𝑖 i.i.d. N 0,𝜎𝜎𝑣𝑣2
19
Other explanatory variables ・Year dummies ・Regional dummies for 10 regions (Hokkaido, Tohoku, south Kanto, north Kanto and Koshin, Hokuriku, Tokai, Kinki, Chugoku, Shikoku, and Kyushu)
Estimation results by ML method Table 3
20
Table 3 Estimation Results of Stochastic Frontier Production Function (1)
Notes: The coefficient estimates of year and regional dummies are suppressed. 21
Summary of the estimation results 1) All of the coefficient estimates of the Cobb-
Douglas production function are significantly positive (increasing returns to scale)
2) Many of the coefficient estimates of the translog production function are not significant due to multicollinearity
3) The estimate of the inefficiency location parameter µ of truncated normal distribution is not statistically significant Half normal
22
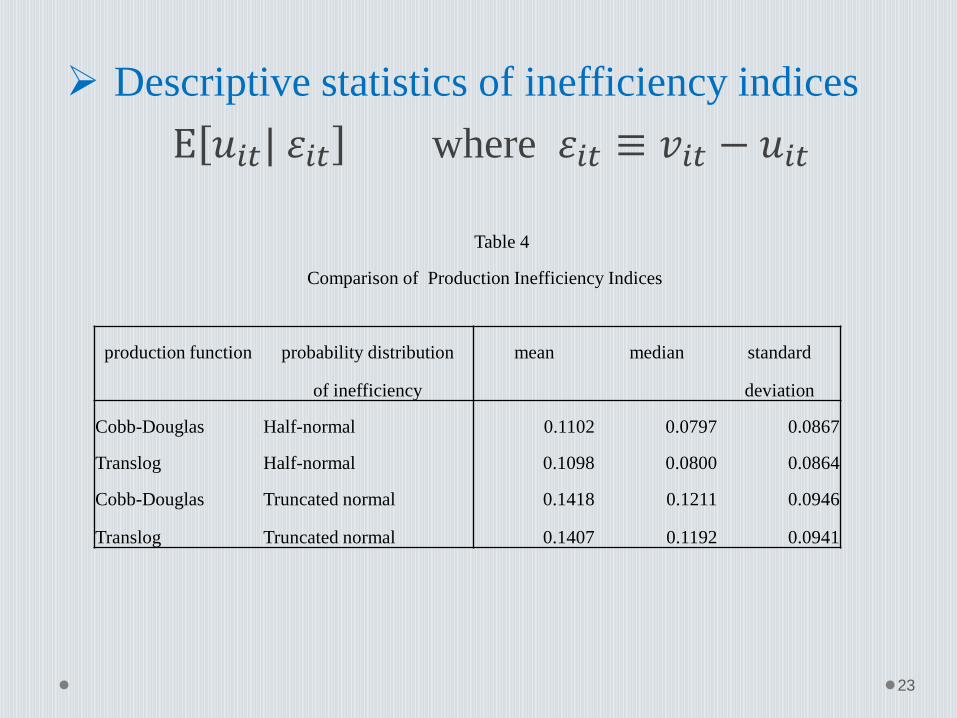
Descriptive statistics of inefficiency indices E 𝑢𝑢𝑖𝑖𝑖𝑖| 𝜀𝜀𝑖𝑖𝑖𝑖 where 𝜀𝜀𝑖𝑖𝑖𝑖 ≡ 𝑣𝑣𝑖𝑖𝑖𝑖 − 𝑢𝑢𝑖𝑖𝑖𝑖
Table 4
Comparison of Production Inefficiency Indices
production function probability distribution mean median standard
of inefficiency deviation
Cobb-Douglas Half-normal 0.1102 0.0797 0.0867
Translog Half-normal 0.1098 0.0800 0.0864
Cobb-Douglas Truncated normal 0.1418 0.1211 0.0946
Translog Truncated normal 0.1407 0.1192 0.0941
23
The correlation coefficient of the inefficiency indices between the Cobb-Douglas production function and the translog production function is 0.9983 for both types of probability distributions
In the subsequent analysis, we assume the half- normal for the inefficiency distribution, and the Cobb-Douglas for the production function
24
6. Comparison of Behavioral Characteristics between Efficient and
Inefficient Rice Producers
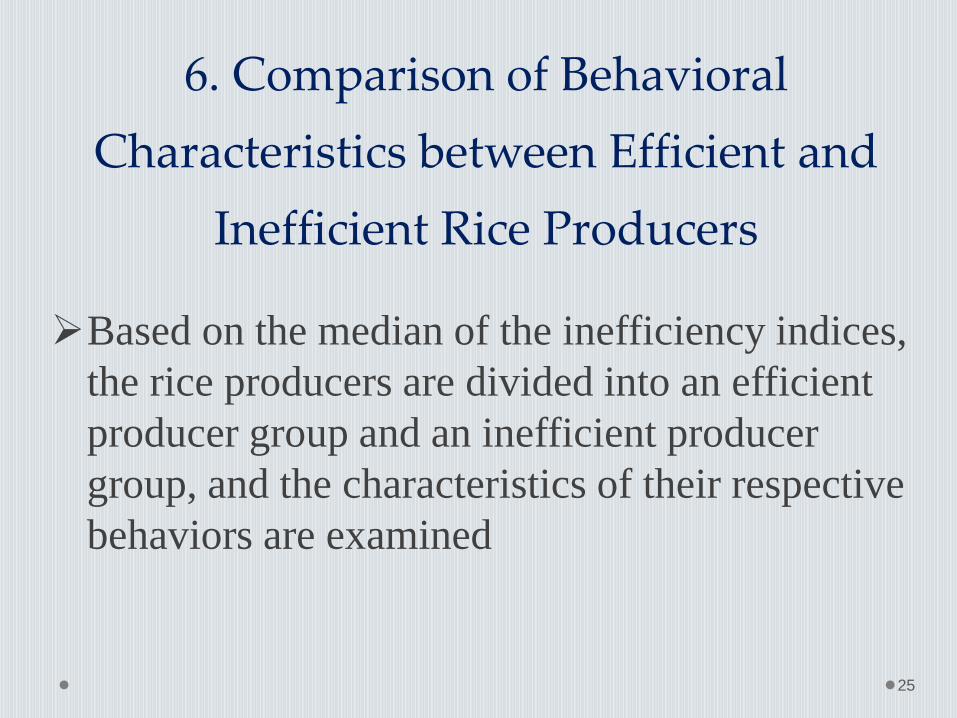
Based on the median of the inefficiency indices, the rice producers are divided into an efficient producer group and an inefficient producer group, and the characteristics of their respective behaviors are examined
25
Table 6 Comparison of Characteristics between Efficient and Inefficient Rice Producers
inefficient efficient test statistics of producers producers mean difference Number of parcels 4.5 4.25 2.12** Area planted for rice production (a) 408.6 423.5 -0.95 Income per 10 a (yen) 13620.6 24126.6 -8.71*** Outstanding loan balance per 10 a (yen ) 15854.5 11702.2 3.99*** Land productivity (kg/a) 47.7 55.1 -42.9*** Labor productivity (kg/hour) 142.1 442.7 -2.10** Capital productivity(kg/ten thousand yen) 21.9 25.1 -9.25*** Arable land utilization as rice production (%) 73.5 74.9 -2.69*** Net receipt of mutual aid money per 10 a (yen) -135.5 -376 3.41*** Proportion of farm area not disposed of or in lots of less than 10 a (%)
18.7 16.1 3.58***
Proportion of farm area in lots more than or equal 10 a and less than 20 a (%)
28.4 25.6 3.70***
Proportion of farm area in lots more than or equal 20 a and less than 30 a (%)
26.8 27.3 -0.74
Proportion of farm area in lots more than or equal 30 a and less than 50 a (%)
17.9 19.2 -1.96*
Proportion of farm area in lots more than or equal 50 a (%)
8.2 11.7 -5.55***
Proportion of certified farmers (%) 50 44.5 4.09*** Price of the harvested rice per kg (yen ) 218.2 217.5 0.73 Notes: *, **, *** significant at 10%, 5%, 1% level, respectively
26
Characteristics of the inefficient rice farmers 1) The number of parcels is large The agricultural land is more fragmented. 2) Low profit and income per 10 are, and large loan balance and subsidies per 10 are 3) Low land, capital, and labor productivity 4) Majority of the farmers own farms with micro plots (less than 20a), and few farmers own farms with relatively large-scale plots (more than 30a) 5) Low arable land utilization rate for rice production 6) High proportion of “certified farmers”
27
Histograms of land productivity for efficient and inefficient producer group
(a) Efficient Rice Producer
kg/a mean = 55.15kg
(b) Inefficient Rice Producers
kg/a mean =47.69kg
28
7. Inefficiency in Production and Factor Demand
1. Production inefficiency and static factor demand We examine how inefficiency in production will affect static factor demand, given land input
Y = F 𝐾𝐾,𝑁𝑁,𝑀𝑀, 𝐿𝐿� 𝑒𝑒−𝑢𝑢 where Y: output 𝐾𝐾,𝑁𝑁,𝑀𝑀, 𝐿𝐿�: capital stock, labor, material and land u: non-negative inefficiency 29
Factor demand functions derived from profit maximization are expressed as follows:
𝐾𝐾∗ = 𝑔𝑔𝐾𝐾𝑝𝑝𝐾𝐾𝑝𝑝
,𝑤𝑤𝑝𝑝
,𝑝𝑝𝑀𝑀𝑝𝑝
, 𝐿𝐿� ,𝑢𝑢
𝑁𝑁∗= 𝑔𝑔𝑁𝑁𝑝𝑝𝐾𝐾𝑝𝑝
,𝑤𝑤𝑝𝑝
,𝑝𝑝𝑀𝑀𝑝𝑝
, 𝐿𝐿� ,𝑢𝑢
𝑀𝑀∗ = 𝑔𝑔𝑀𝑀𝑝𝑝𝐾𝐾𝑝𝑝
,𝑤𝑤𝑝𝑝
, 𝑝𝑝𝑀𝑀𝑝𝑝
, 𝐿𝐿�,𝑢𝑢
where p, 𝑝𝑝𝐾𝐾 ,𝑤𝑤,𝑝𝑝𝑀𝑀: output price, rental price of capital, wage rate and materials price
30
Proposition: The more a rice producer diverges from the production frontier, the more the factor demand also diverges from the optimal level when 𝜕𝜕2𝑌𝑌
𝜕𝜕𝑥𝑥𝑖𝑖𝜕𝜕𝑥𝑥𝑗𝑗> 0 (x:factor input, 𝑖𝑖 ≠ 𝑗𝑗).
To examine this proposition, the logarithmic linear factor demand function, which takes inefficiency into consideration, is estimated
31
Specification of static factor demand function 𝑢𝑢𝐾𝐾,𝑖𝑖𝑖𝑖 ,𝑢𝑢𝑁𝑁,𝑖𝑖𝑖𝑖 ,𝑢𝑢𝑀𝑀,𝑖𝑖𝑖𝑖 : inefficiency in capital stock, labor and materials
𝑙𝑙𝑙𝑙𝐾𝐾𝑖𝑖𝑖𝑖 = 𝛽𝛽0𝐾𝐾 + 𝛽𝛽1𝐾𝐾𝑙𝑙𝑙𝑙 �𝑝𝑝𝐾𝐾𝑝𝑝�𝑖𝑖𝑖𝑖
+ 𝛽𝛽2𝐾𝐾𝑙𝑙𝑙𝑙 �𝑤𝑤𝑝𝑝�𝑖𝑖𝑖𝑖
+ 𝛽𝛽3𝐾𝐾𝑙𝑙𝑙𝑙 �𝑝𝑝𝑀𝑀𝑝𝑝�𝑖𝑖𝑖𝑖
+ 𝛽𝛽4𝐾𝐾𝑙𝑙𝑙𝑙𝐿𝐿𝑖𝑖𝑖𝑖���� − 𝑢𝑢𝐾𝐾 ,𝑖𝑖𝑖𝑖 + 𝑣𝑣𝐾𝐾,𝑖𝑖𝑖𝑖
𝑙𝑙𝑙𝑙𝑁𝑁𝑖𝑖𝑖𝑖 = 𝛽𝛽0𝑁𝑁 + 𝛽𝛽1𝑁𝑁𝑙𝑙𝑙𝑙 �𝑝𝑝𝐾𝐾𝑝𝑝�𝑖𝑖𝑖𝑖
+ 𝛽𝛽2𝑁𝑁𝑙𝑙𝑙𝑙 �𝑤𝑤𝑝𝑝�𝑖𝑖𝑖𝑖
+ 𝛽𝛽3𝑁𝑁𝑙𝑙𝑙𝑙 �𝑝𝑝𝑀𝑀𝑝𝑝�𝑖𝑖𝑖𝑖
+ 𝛽𝛽4𝑁𝑁𝑙𝑙𝑙𝑙𝐿𝐿𝑖𝑖𝑖𝑖���� − 𝑢𝑢𝑁𝑁,𝑖𝑖𝑖𝑖 + 𝑣𝑣𝑁𝑁,𝑖𝑖𝑖𝑖
𝑙𝑙𝑙𝑙𝑀𝑀𝑖𝑖𝑖𝑖 = 𝛽𝛽0𝑀𝑀 + 𝛽𝛽1𝑀𝑀𝑙𝑙𝑙𝑙 �𝑝𝑝𝐾𝐾𝑝𝑝�𝑖𝑖𝑖𝑖
+ 𝛽𝛽2𝑀𝑀𝑙𝑙𝑙𝑙 �𝑤𝑤𝑝𝑝�𝑖𝑖𝑖𝑖
+ 𝛽𝛽3𝑀𝑀𝑙𝑙𝑙𝑙 �𝑝𝑝𝑀𝑀𝑝𝑝�𝑖𝑖𝑖𝑖
+ 𝛽𝛽4𝑀𝑀𝑙𝑙𝑙𝑙𝐿𝐿𝑖𝑖𝑖𝑖���� − 𝑢𝑢𝑀𝑀 ,𝑖𝑖𝑖𝑖
+𝑣𝑣𝑀𝑀,𝑖𝑖𝑖𝑖
32
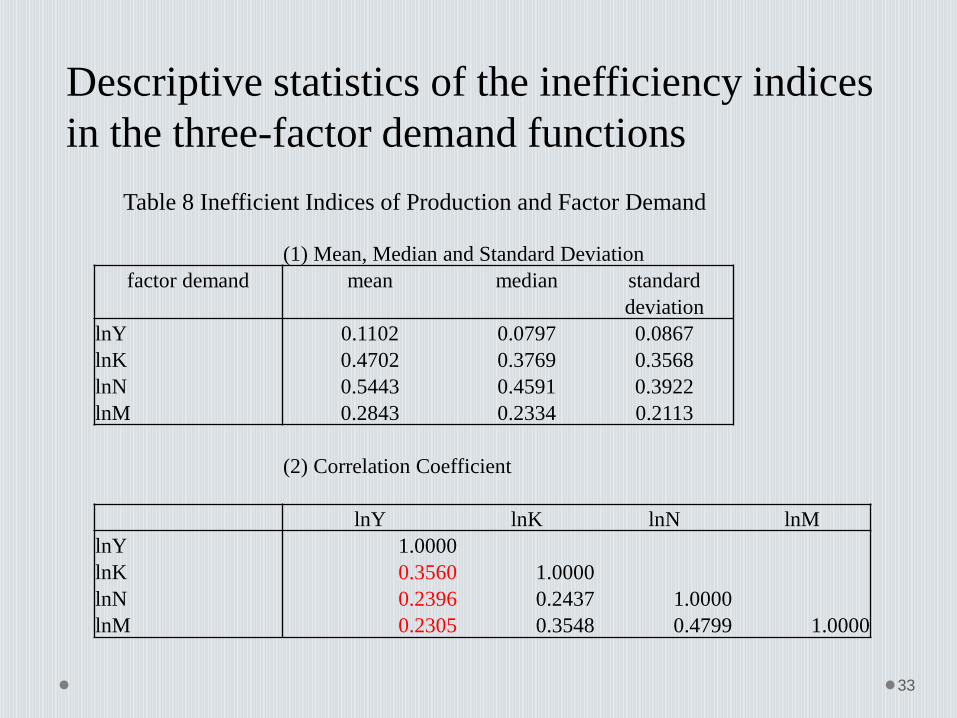
Descriptive statistics of the inefficiency indices in the three-factor demand functions
Table 8 Inefficient Indices of Production and Factor Demand
(1) Mean, Median and Standard Deviation factor demand mean median standard
2. Production inefficiency and dynamic factor demand Comparison of the dynamic adjustment processes of factor demand between the efficient and the inefficient rice producers Specification of dynamic factor demand function 𝑙𝑙𝑙𝑙𝐾𝐾𝑖𝑖𝑖𝑖 = 𝛾𝛾0𝐾𝐾 + 𝛾𝛾1𝐾𝐾𝑙𝑙𝑙𝑙 �
𝑝𝑝𝐾𝐾𝑝𝑝�𝑖𝑖𝑖𝑖
+ 𝛾𝛾2𝐾𝐾𝑙𝑙𝑙𝑙 �𝑤𝑤𝑝𝑝�𝑖𝑖𝑖𝑖
+ 𝛾𝛾3𝐾𝐾𝑙𝑙𝑙𝑙 �𝑝𝑝𝑀𝑀𝑝𝑝�𝑖𝑖𝑖𝑖
+ 𝛾𝛾4𝐾𝐾𝑙𝑙𝑙𝑙𝐾𝐾𝑖𝑖 ,𝑖𝑖−1 + 𝑣𝑣𝐾𝐾,𝑖𝑖𝑖𝑖
𝑙𝑙𝑙𝑙𝑁𝑁𝑖𝑖𝑖𝑖 = 𝛾𝛾0𝑁𝑁 + 𝛾𝛾1𝑁𝑁𝑙𝑙𝑙𝑙 �𝑝𝑝𝐾𝐾𝑝𝑝�𝑖𝑖𝑖𝑖
+ 𝛾𝛾2𝑁𝑁𝑙𝑙𝑙𝑙 �𝑤𝑤𝑝𝑝�𝑖𝑖𝑖𝑖
+ 𝛾𝛾3𝑁𝑁𝑙𝑙𝑙𝑙 �𝑝𝑝𝑀𝑀𝑝𝑝�𝑖𝑖𝑖𝑖
+ 𝛾𝛾4𝑁𝑁𝑙𝑙𝑙𝑙𝑁𝑁𝑖𝑖 ,𝑖𝑖−1 + 𝑣𝑣𝑁𝑁,𝑖𝑖𝑖𝑖
𝑙𝑙𝑙𝑙𝑀𝑀𝑖𝑖𝑖𝑖 = 𝛾𝛾0𝑀𝑀 + 𝛾𝛾1𝑀𝑀𝑙𝑙𝑙𝑙 �𝑝𝑝𝐾𝐾𝑝𝑝�𝑖𝑖𝑖𝑖
+ 𝛾𝛾2𝑀𝑀𝑙𝑙𝑙𝑙 �𝑤𝑤𝑝𝑝�𝑖𝑖𝑖𝑖
+ 𝛾𝛾3𝑀𝑀𝑙𝑙𝑙𝑙 �𝑝𝑝𝑀𝑀𝑝𝑝�𝑖𝑖𝑖𝑖
+ 𝛾𝛾4𝑀𝑀𝑙𝑙𝑙𝑙𝑀𝑀𝑖𝑖 ,𝑖𝑖−1 + 𝑣𝑣𝑀𝑀,𝑖𝑖𝑖𝑖
34
Estimation results by System GMM Table 9 Estimation Results of Dynamic Factor Demand Function
Notes: The coefficient estimates of year dummies are suppressed.
35
Comparison of dynamic labor demand between the efficient and the inefficient producers
1) The adjustment speed of labor is faster for efficient producers (0.4741) than for inefficient producers (0.3819). 2) When a wages rises, efficient producers immediately reduce labor input. The long run wage elasticity is -1.8197; thus, large labor adjustments occur over the longer term. 3) Inefficient producers do not make any adjustments of labor input in either the short or long run even if there is a change in wages.
36
8. Determinants of Arable Land Utilization as Rice Production
Comparison of the determinants of the arable land utilization as rice production between efficient and inefficient producer group We assume that the proportion of arable land
used for rice production is determined by the economic circumstances of rice producers in the previous year. The determinants of arable land utilized for rice
production are divided into three groups 37
1. Performance of producers 1) Land productivity 2) Outstanding loan balance 3) Crop prospects relative to normal year 2. Attributes of the fields 1) Number of parcels of the fields 2) Area distribution of the farm plots 3. Organizational characteristics of farmers 1) Participation of farmers in agricultural production organizations, such as cultivation accords, joint utilization, and consignment 2) Whether a farmer is certified or not
38
39
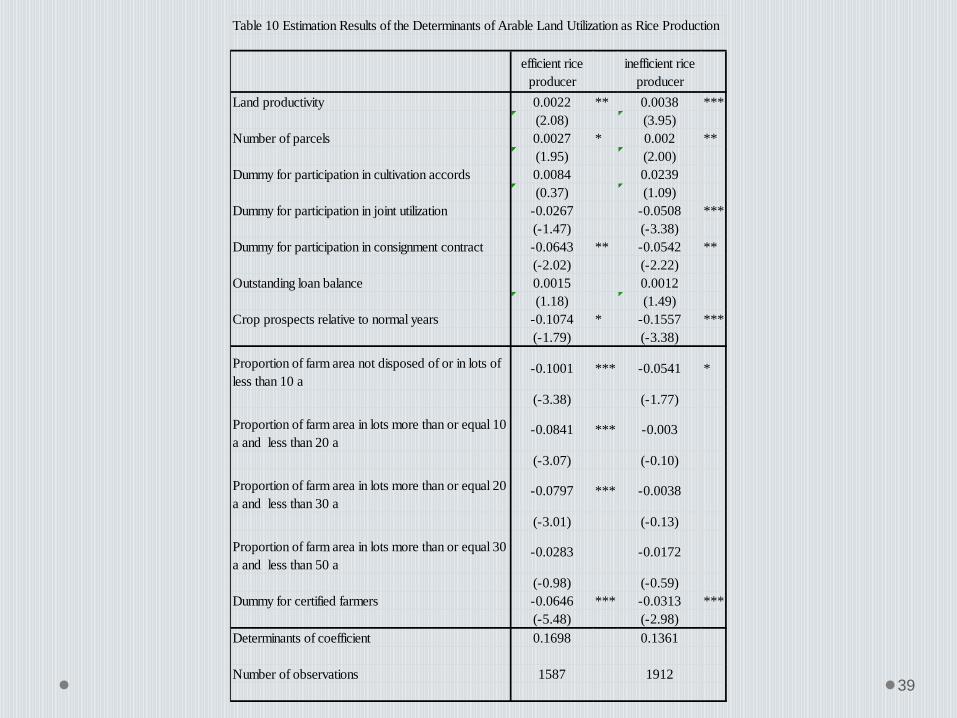
Table 10 Estimation Results of the Determinants of Arable Land Utilization as Rice Production
efficient riceproducer
inefficient riceproducer
Land productivity 0.0022 ** 0.0038 ***(2.08) (3.95)
Number of parcels 0.0027 * 0.002 **(1.95) (2.00)
Dummy for participation in cultivation accords 0.0084 0.0239(0.37) (1.09)
Dummy for participation in joint utilization -0.0267 -0.0508 ***(-1.47) (-3.38)
Dummy for participation in consignment contract -0.0643 ** -0.0542 **(-2.02) (-2.22)
Crop prospects relative to normal years -0.1074 * -0.1557 ***(-1.79) (-3.38)
Proportion of farm area not disposed of or in lots ofless than 10 a
-0.1001 *** -0.0541 *
(-3.38) (-1.77)
Proportion of farm area in lots more than or equal 10a and less than 20 a
-0.0841 *** -0.003
(-3.07) (-0.10)
Proportion of farm area in lots more than or equal 20a and less than 30 a
-0.0797 *** -0.0038
(-3.01) (-0.13)
Proportion of farm area in lots more than or equal 30a and less than 50 a
-0.0283 -0.0172
(-0.98) (-0.59)Dummy for certified farmers -0.0646 *** -0.0313 ***
(-5.48) (-2.98)Determinants of coefficient 0.1698 0.1361
Number of observations 1587 1912
Interpretations of estimation results 1. There is a tendency for arable land utilization for rice cultivation to be reduced more by producers that have a great deal of farmland in small plots. These effects are larger for efficient producers. For efficient rice farmers, the proportion of farm area that is undisposed or in micro plots of less than 10 are has the largest effect on arable land utilization for rice production; these effects gradually decline as the plots grow larger. The effect is much smaller for inefficient producers.
40
More efficient rice producer tends to switch from rice grown on a small plot to other crops, and his land employed for rice cultivation is concentrated in relatively large-scale fields. 2. A certified farmer significantly reduces the arable land used for rice production. Furthermore, the more efficient a certified farmer is, the larger this effect is. An efficient certified farmer reduces arable land utilization rate for rice production by 6.5%, while the extent of the reduction by inefficient certified farmers is only 3.1%
41
9.Concluding Remarks The negative effect of being certified farmer on
arable land utilization for rice production may reflect the fact that cooperation in production adjustment for rice was a requirement at the stage of applying for certified farmers prior to 2009. However, productivity of rice production will
decline as efficient certified farmers reduce the proportion of arable land used for rice production, which is the opposite of what was intended by policymakers.
42
An agricultural system, such as certified farmer system, should be designed so that it might give incentives to efficient rice producers to expand rice cultivation, and inefficient producers to withdraw from rice cultivation and switch to other crops.