Sot Scr Med Vol 27, No 4. pp 291-296, 1988 0277-9536188 $3 00 + 0 00 Prmted rn Great Bntam Pcrgamon Press plc INEQUALITIES? SOCIAL CLASS DIFFERENTIALS IN HEALTH IN BRITISH YOUTH PATRICK WEST MRC MedIcal Sociology Unit, 6 Ltlybank Gardens, Glasgow G12 SQQ, Scotland Abstract-In the Brltlsh context, there 1s a widespread assumption that mequahtles m health between soclai classes are a persistent feature of the hfe-course, an assumption appearmg most plausible by reference to the more accessible published stattstlcs on the Issue However, the age-bands typically employed are m fact so broad as to obscure important life-stages altogether One such stage 1syouth which on the evidence of the major mdlcators of mortality, chrome Illness and self-rated health IS characterlsed more by the absence than presence of class gradtents That social class dtfferentlals re-emerge quite dramatically after this relative equahsatlon m youth has lmphcatrons for the broader debate about the explanation of mequahtles m health Key words-health mequahtles m youth, age and class gradients INTRODUCTION Of all the ways health vanes by social and bIologIca parameters, m Bntam it IS social class which has attracted and contmues to attract most attention [l] Despite Important cntlclsm from diverse sources about the vahdlty of a measure of social class based on occupatton [24], the fact remams, as the ‘Black Report’ [5] demonstrated, that (occupational) class IS the smgle most powerful predictor of morbldlty and mortahty m the course of a hfetlme What httle analysis has been possible from the 197943 Decen- ma1 Supplement on occupational mortahty [6] confirms the conclusion of perslstmg, or even wlden- mg, health mequalities between social classes [7] How these dlfferentlals are produced, and for what reason is, of course, another question which divides those who emphaslse artefactual and/or health selec- tlon explanations [3, 81 and those who stress social causation either by reference to hfestyles [9] or ma- terial circumstances [ 10, 1 I] This paper can only mdlrectly contribute to the central question of the production of class differ- entlals and IS predommantly confined to the Bntlsh context In an mcreasmgly complex debate, however, which IS begmnmg to resemble the earher nature/ nurture controversy over IQ. there IS a danger that some simple facts go unobserved largely because of our own assumptions about the pervasiveness of health mequahtles and, more specIfically, because of our uncntlcal reliance on the more accessible pub- hshed statistics The assumption m questlon, which seems to be widespread, IS that social class drfferentlals are a persistent feature of the hfe-course from chlldhood through adolescence to adulthood and old age This (plausible) assumption appears to be borne out by the evidence Whitehead [12], for example, m a review for the now defunct Health Education Council of Eng- land and Wales refers to studies which continue to show an Inverse relatlonshlp between social class and mortahty, a gradient apparent at ‘every stage of hfe’ Hart [IO], too, in another maJor review, notes the systematic assoclatlon between death rates and class ‘at every age’, most pronounced m the younger years and dlmmlshmg with increasing age Given there 1s no a-prrorr reason to suppose that class gradients vary m magmtude wrthan the age-bands typically employed, the conclusion seems Justified The prob- lem is, though, that the age-bands are actually very broad, and concealed wthm them are various stages m the hfe-course where the assumption on closer mspectlon IS more problematic than often supposed One such stage IS youth or adolescence, a penod roughly defined as between 12 and 19 yr of age, whtch excepting occaslonal references to the effect that dlfferentlals are rather less marked than at younger or older ages [5] receives remarkably httle attention m the ‘Inequahtles’ literature This IS surpnsmg since It 1s precisely m youth that occurs a maJor process of sorting or allocation of mdlvlduals mto occupatlonal roles which subsequently forms the basis of their (achieved) social class posltlon A focus on the pat- tern observed m youth might, therefore, be expected to occupy a key place m the broader debate about explanations for mequahtles m health To examme the pattern of class dltierentlals m youth, two major Bntlsh sources of data have been utlhsed The first 1s pubhshed mortahty data denved from the two previous Decennial Supplements on OccupatIonal Mortahty which permlt an analysts of social class patterns wlthm 5 yr age bands-the 1979-83 Decennial Supplement contams no mforma- tron at all on deaths among children The second IS a secondary analysis of the 1980 General Household Survey [ 131, focusing on the social class dlstnbutlons of chrome Illness and self-rated health at specific ages m youth In addltlon, because the picture m youth presents a contrast with the famlhar pattern observed m the population as a whole--rt zs characterrsed more bv the absence than presence of class vartatlon-some attention 1s given to the way m which gradients vary over a broader age span In no sense does this constitute a comprehenslve review of health dlfferentlals m youth, but mortahty and morbldlty
Transcript
Sot Scr Med Vol 27, No 4. pp 291-296, 1988 0277-9536188 $3 00 + 0 00 Prmted rn Great Bntam Pcrgamon Press plc
INEQUALITIES? SOCIAL CLASS DIFFERENTIALS IN HEALTH IN BRITISH YOUTH
PATRICK WEST
MRC MedIcal Sociology Unit, 6 Ltlybank Gardens, Glasgow G12 SQQ, Scotland
Abstract-In the Brltlsh context, there 1s a widespread assumption that mequahtles m health between soclai classes are a persistent feature of the hfe-course, an assumption appearmg most plausible by reference to the more accessible published stattstlcs on the Issue However, the age-bands typically employed are m fact so broad as to obscure important life-stages altogether One such stage 1s youth which on the evidence of the major mdlcators of mortality, chrome Illness and self-rated health IS characterlsed more by the absence than presence of class gradtents That social class dtfferentlals re-emerge quite dramatically after this relative equahsatlon m youth has lmphcatrons for the broader debate about the explanation of mequahtles m health
Key words-health mequahtles m youth, age and class gradients
INTRODUCTION
Of all the ways health vanes by social and bIologIca parameters, m Bntam it IS social class which has attracted and contmues to attract most attention [l] Despite Important cntlclsm from diverse sources about the vahdlty of a measure of social class based on occupatton [24], the fact remams, as the ‘Black Report’ [5] demonstrated, that (occupational) class IS the smgle most powerful predictor of morbldlty and mortahty m the course of a hfetlme What httle analysis has been possible from the 197943 Decen- ma1 Supplement on occupational mortahty [6] confirms the conclusion of perslstmg, or even wlden- mg, health mequalities between social classes [7] How these dlfferentlals are produced, and for what reason is, of course, another question which divides those who emphaslse artefactual and/or health selec- tlon explanations [3, 81 and those who stress social causation either by reference to hfestyles [9] or ma- terial circumstances [ 10, 1 I]
This paper can only mdlrectly contribute to the central question of the production of class differ- entlals and IS predommantly confined to the Bntlsh context In an mcreasmgly complex debate, however, which IS begmnmg to resemble the earher nature/ nurture controversy over IQ. there IS a danger that some simple facts go unobserved largely because of our own assumptions about the pervasiveness of health mequahtles and, more specIfically, because of our uncntlcal reliance on the more accessible pub- hshed statistics
The assumption m questlon, which seems to be widespread, IS that social class drfferentlals are a persistent feature of the hfe-course from chlldhood through adolescence to adulthood and old age This (plausible) assumption appears to be borne out by the evidence Whitehead [12], for example, m a review for the now defunct Health Education Council of Eng- land and Wales refers to studies which continue to show an Inverse relatlonshlp between social class and mortahty, a gradient apparent at ‘every stage of hfe’ Hart [IO], too, in another maJor review, notes the
systematic assoclatlon between death rates and class ‘at every age’, most pronounced m the younger years and dlmmlshmg with increasing age Given there 1s no a-prrorr reason to suppose that class gradients vary m magmtude wrthan the age-bands typically employed, the conclusion seems Justified The prob- lem is, though, that the age-bands are actually very broad, and concealed wthm them are various stages m the hfe-course where the assumption on closer mspectlon IS more problematic than often supposed
One such stage IS youth or adolescence, a penod roughly defined as between 12 and 19 yr of age, whtch excepting occaslonal references to the effect that dlfferentlals are rather less marked than at younger or older ages [5] receives remarkably httle attention m the ‘Inequahtles’ literature This IS surpnsmg since It 1s precisely m youth that occurs a maJor process of sorting or allocation of mdlvlduals mto occupatlonal roles which subsequently forms the basis of their (achieved) social class posltlon A focus on the pat- tern observed m youth might, therefore, be expected to occupy a key place m the broader debate about explanations for mequahtles m health
To examme the pattern of class dltierentlals m youth, two major Bntlsh sources of data have been utlhsed The first 1s pubhshed mortahty data denved from the two previous Decennial Supplements on OccupatIonal Mortahty which permlt an analysts of social class patterns wlthm 5 yr age bands-the 1979-83 Decennial Supplement contams no mforma- tron at all on deaths among children The second IS a secondary analysis of the 1980 General Household Survey [ 131, focusing on the social class dlstnbutlons of chrome Illness and self-rated health at specific ages m youth In addltlon, because the picture m youth presents a contrast with the famlhar pattern observed m the population as a whole--rt zs characterrsed more bv the absence than presence of class vartatlon-some attention 1s given to the way m which gradients vary over a broader age span In no sense does this constitute a comprehenslve review of health dlfferentlals m youth, but mortahty and morbldlty
292 PATRICK WFST
are still the most widely employed health mdlcators m the ‘mequahtles’ debate [12, 141 and It IS therefore appropriate to start there
THE BROAD PICTURE
First, though, it IS pertinent to remind ourselves what the picture looks like when presented m the broad age-bands typlcally found m pubhshed docu- ments The mam pomt 1s to note where the age break occurs
Figure 1 shows the standardlsed mortality ratios (SMRs) by social class for the two age groups, children (l-14 yr) and adults (1544 yr) The hlsto- grams are reproduced from the 197&1972 Decenmal Supplement [15], and along with figures for still- births and infant mortahty are those which occupy a promment posltlon m the ‘Black Report’ (and Hart’s (IO] later review) as testimony to the pervasive Influence of social class on mortahty throughout the hfe course From the histograms, the class gradient appears rather more pronounced m childhood than adulthood and IS slmllar for both males and females,
Chlldren (l-14 yr)
1 Males Adults (15-64yr)
200 1
0 Females
Social class
Fig I Mortality by social class for children and adults Source Ref [lS]
though bemg rather steeper for the former than the latter
Figure 2 shows a slmllar series of social class gradients m respect of rates of chronic Illness, defined as those reportmg ‘longstandmg Illness, dlsablhty or mfirrmty These are denved from pubhshed data m the 1980 General Household Survey [16] Here, the gradients are presented m three age groups for both males and females In broad terms, the pattern for males at any rate parallels the picture for mortality, though there IS some mdlcatlon that the gradient m the O-15 age group IS less steep than m the older age groups The pattern for females IS much less dlstmc- tlve and may m part reflect the fact that from 16 onwards social class IS estabhshed for married women by reference to husband’s occupation and for single women by reference to their own
This Issue aside, these two sets of data on mortahty and morbldlty respectively remam the most widely utlhsed evidence about social class dlfferentlals m health, and it IS this that gives nse to the (plausible) assumption that they are a persistent feature of the hfe-course However, not only are the age groups very broad, but the particular stage of youth IS entirely obscured by virtue of the cut-off pomt at 14 or 15 which results from the different method of social class classlficatlon for children (father’s or ‘head of household’s’ occupation) and adults (own occupation) The dlstrlbutlons for youth, therefore, are spread around this cut-off pomt, and the posabll- lty IS that their mcluslon both with younger children and older adults has the effect of sustammg the assumption that the class gradient m youth IS much the same as at other ages It IS this assumption that will now be exammed
SOCIAL CLASS DIFFERENTIALS IN YOUTH
Data on mortahty m youth are, as mdlcated, avallable m previous Decenmal Supplements usmg finer age groupmgs than those more usually reported However, while the 1970-1972 Supplement permits an analysis of all cause mortality m 5 yr age bands for each sex, It 1s not possible from pubhshed data to ascertam specific causes of death except by reference to the age group 1-14 A focus on causes IS relevant
/::- y-p5+; >45_6Q
30 -
- /
1640
z- fl O-l5
/16+
A o-1 5
OJ f
I I I Social class V
Fig 2 Chronic Illness-% reporting longstandq Illness, dlsablhty or lnfirnuty by social class by age Source Ref [16]
Health mequahtles In youth 293
here because of the parttculariy dramatic way deaths attnbutable to acctdents affect the picture To obtatn these data, we depend on an analysts conducted by Adelstetn and White [17] of around 25,000 deaths occurrmg to chtldren m the years 1959-1963 These mvestlgators matched mortaltty and soctal class data from death regtstratlon forms with the estimated population of chtldren aged l-14 m each social class (father’s occupation) denved from a 10% sample of the 1961 census No dtstmctlon IS possible between males and females, and the pattern for ‘youth’ from these data 1s restncted to the lower end of the adolescent period (age 10-14)
Figure 3 shows the all cause mortaltty rates (per 100,000 per year) by social class m three age groups of children In each case, the social class difference IS slgmficant at the 0 1% level, but It 1s evident that the gradient for the l-4 yr olds ts much steeper than for those aged 5-9, which tn turn IS steeper than at age IO-14 Apart from the increased mortality rate m social class V, the gradient 1s very shallow tn the two older groups and parttcularly so at 10-14
Consldermg the maJor causes of death within each of these age groups, among the 1-4yr olds a social class differential IS apparent tn respect of congemtal abnormahttes, respiratory disease, mentngococcal tn- fectton, measles and accidents (all highly stattsttcally significant) Among both 5-9 and IO-14yr olds, excepting a slight reverse class gradient for neo- plasms, the only significant difference occurs m re- spect of accidents which compnse about a third of all causes Combmmg the three age groups creates the tmpresslon of a unrform set of causes and conceals that fact that m early youth (10-14) there 1s not only least evidence of a class dtfferenttal than at any other pomt tn the hfe-course, but that what little gradient there IS, IS attributable to accidents As ~111 be shown, It IS not more than a temporary equahsatlon for the
160-j
8 80-
8 0 5-9 2 60-
40- 10-14
20-
“- Fig 3 Mortality rates (per 100,000 per year) for three age groups of children by social class-England and Wales
1959-1963 Source Ref [17]
differential re-emerges qutte dramatically m later adolescence
Morbrdq
The second set of data on class differentials refers to an analysts of chrome illness m a sub-file of the 1980 General Household Survey compnsmg 4216 youngsters aged 12-19 As IS standard m this survey, for those aged under 16 chronic tllness 1s reported by an adult, after that age It IS self-reported In this case, social class IS defined by reference to the occupation of the ‘head of household’ which m the great majonty of cases ts the father A separate analysis using father’s occupatton as the basis for classtficatlon reveals an almost Identical pattern to the one re- ported here The social class groupings are based on socto-economtc groups (SEGs), and therefore differ shghtly from the Registrar General’s classtficatlon used m mortahty statlsttcs The findings are presented for males and females combined
Table 1 shows the percentage reported as suffering from chronic Illness and, m parentheses, restnctmg chronic rllness (whether or not acttvtttes are limited) by soctal class and age For presentational purposes, cases are grouped m 2 yr age-bands, the number m each bemg around 1000 cases It ts clear that m respect of chrome tllness there 1s no evidence of a soctal class dtfferenhal at any age The 14-15 yr old dtstnbutlon IS Just significant (5% level) but hardly mdtcatlve of a gradtent In respect of restrtctmg chrome tllness, there ts perhaps more evidence that rates increase with falling social class though the pattern IS rather uneven At no age, however, IS the difference stattsttcally slgntficant
It might be objected that from 16 onwards a better classtficatlon of soctal class resides m their own rather than head of household’s occupation Among (eco- nomtcally active) 16-19 yr olds, who can be so classtfied, there IS however hardly any more evidence of a class dlfferentlal What difference there IS (not significant) 1s almost entirely attnbutable to a lower chrome Illness rate tn the profesaonal/managenal group The problem here IS that at this age there are so few classified tn thts social class (2% tn all) that a full analysis ts vtrtually precluded Notwtthstandmg this, whatever measure IS used the presentation of findmgs m broader age-groups, such as that shown m Fig 2, would result m a fallacious concluston about the soctal class pattern m youth
THE EMERGENCE AND RE-EMERGENCE OF CLASS DIFFERENTIALS
Having established that the sltuatlon m youth IS charactensed more by the absence than presence of social class differentials and that this pattern IS obscured by the use of broad age-bands, tt IS tmpor- tant to ascertain at what points In the hfe-course they emerge, and re-emerge
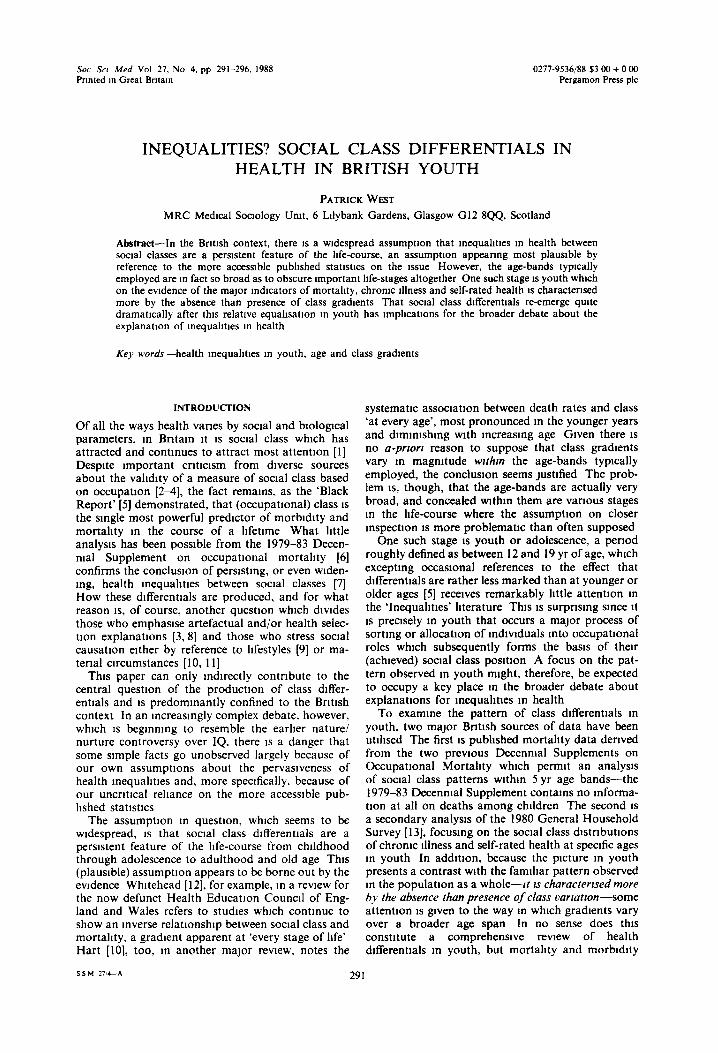
Figure 4 returns us to mortality, this time usmg data from the 1970-1972 Decenmai Supplement The rates for all cause mortahty are presented rn the smallest age-bands possible and cover the years from 1 to 39 They are for males only, the comparable figures for females not bemg available from published sources
294 PATRICK WEST
320 -,
Table I Chrome dlness and restnctmg chrome illness* by social class (HOH) m youth (12-19)
Fig 4 Mortality rates (per 100,000) for males by social class m chlldhood, youth and early adulthood-England and
Wales. 197&1972 Source Ref [15]
Figure 4 also shows, as expected, an almost Identl- cal picture for the years 1-14 to that found m the earher Decenmal Supplement At 1-4 there IS clear evidence of a social class dlfferentlal which flattens out at age 5-9 and 1s shallower still at IO-14 From thereon, the pattern shows a dramatic change By 15-19, the rates are not only higher than those observed m the youngest age-group, but excepting the particularly high social class 1 and II rates there are clear signs of a re-emerging social class gradlent By 20-24, the famlhar dlfferentlal IS established and It contmues to get steeper with Increasing age
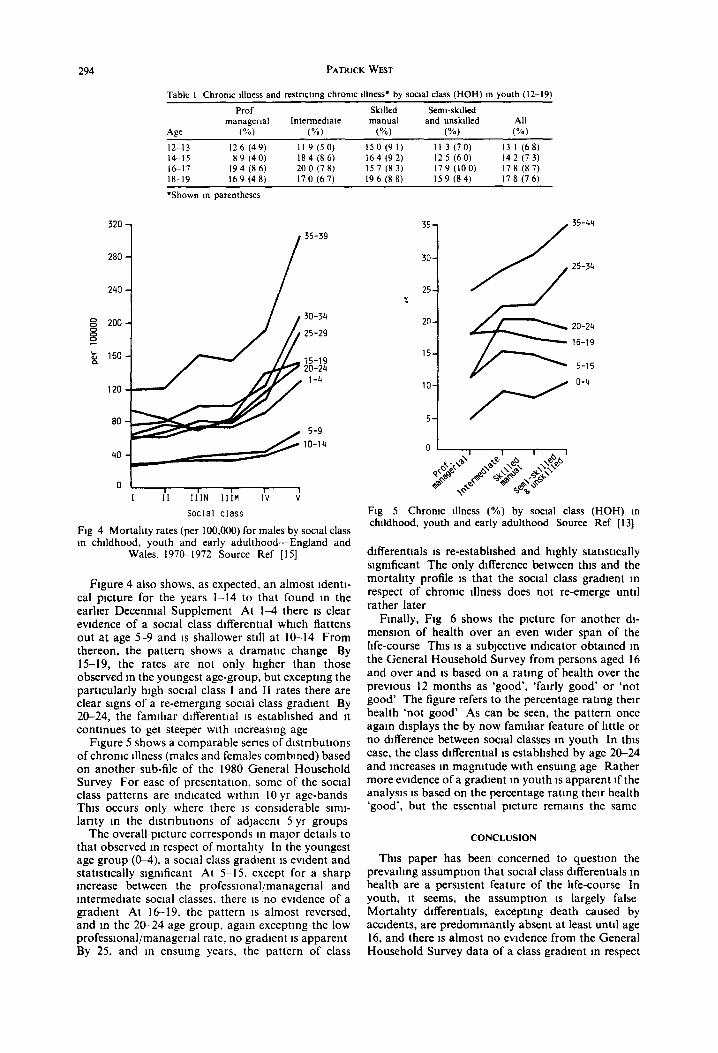
Figure 5 shows a comparable series of dlstrlbutlons of chrome Illness (males and females combined) based on another sub-file of the 1980 General Household Survey For ease of presentation. some of the social class patterns are mdlcated wlthm 10 yr age-bands This occurs only where there IS considerable slml- larlty m the dlstrlbutlons of adJacent 5 yr groups
The overall picture corresponds m major details to that observed m respect of mortality In the youngest age group (&4), a social class gradlent IS evident and statlstlcally slgmficant At S-15, except for a sharp Increase between the professlonal/managerlal and mtermedlate social classes, there 1s no evidence of a gradlent At 16-19, the pattern 1s almost reversed, and m the 20-24 age group, again exceptmg the low profeswonal/managerlal rate, no gradlent IS apparent By 25, and m ensuing years, the pattern of class
35 35-44
30 25-34
I
Fig 5 Chronic illness (%) by social class (HOH) m childhood, youth and early adulthood Source Ref [13]
dlfferentlals 1s re-estabhshed and highly statlstlcally significant The only difference between this and the mortahty profile 1s that the social class gradlent m respect of chrome Illness does not re-emerge until rather later
Finally, Fig 6 shows the picture for another dl- menslon of health over an even wider span of the hfe-course This IS a subjective mdlcator obtamed m the General Household Survey from persons aged 16 and over and IS based on a ratmg of health over the previous 12 months as ‘good’, ‘fairly good’ or ‘not good’ The figure refers to the percentage rating their health ‘not good’ As can be seen, the pattern once again displays the by now famlhar feature of httle or no difference between social classes m youth In this case, the class dlfferentlal IS estabhshed by age 20-24 and increases m magnrtude with ensumg age Rather more evidence of a gradlent m youth IS apparent If the analysis 1s based on the percentage rating their health ‘good’, but the essential picture remams the same
CONCLUSION
This paper has been concerned to questlon the prevalhng assumption that social class dlfferentlals m health are a persistent feature of the hfe-course In youth, It seems, the assumption 1s largely false Mortahty dlfferentlals, exceptmg death caused by accidents, are predommantly absent at least until age 16, and there IS almost no evidence from the General Household Survey data of a class gradlent m respect
Health mequahtles m youth 295
20-
% fi
45-54
15- 35-44
10-
5 _
,pzz~
Fig 6 Subpctlve health (X ‘not good’) by social class (HOH) m youth and adulthood Over the last 12 months, would you say your health has on the whole been good,
fairly good, or not good? Source Ref [13]
of chrome illness and sublective health rating throughout the adolescent penod It 1s only later that the class dlfferentlals apparent m the earhest years of childhood re-emerge It IS a picture, m short, which IS simply not apparent from the evidence available m published form [5, lo] because of the way specific stages and changes m class gradients are obscured by the age-bands employed It also challenges the val- idity of the claim [lo] that health mequahtles diminish with increasing age It 1s clearly a much more complex picture than that
These are, of course, only two data-sets, selected because they happen to be the most widely utlhsed and reported Bntlsh sources on mequalities m health Remarkably perhaps, there IS not much else to draw on Wadsworth [18], employmg data from the 1946 National Longltudmal Survey, reports a class gradl- ent for ‘senous illness’ (hospital admlsslon for a mmlmum of 28 consecutive days or school or work absence of 3 consecutive weeks or more) at each of five ages up to 25 for males only No statlstlcally significant differences were found for females Fur- ther enquiry [19] reveals, however, that the reported differences for males refer to cumulative rates (preva- lence), not cases arising m each of the 5 yr periods (madence) In respect of the latter, It IS only among the youngest (O-S) that the difference IS significant and where the gradient IS steepest The class differ- entials of later childhood and youth, therefore, are predommantly attnbutable to the mcluslon m the cal- culations of ‘serious illness’ occurrmg m the earliest years These findings complement, and amplify, the analysis of mortality and morbidity presented here
The question remains, however, as to why the social class dlfferentlals evident m early childhood all but vanish m youth only to re-appear again within a relatively short penod of time There appear to be several possible explanations, each of which con- tributes to a greater or lesser extent to an understand- mg of the picture
The first IS that the patterns observed are an artefact of the measurement of social class, which has a particularly dramatlc effect m youth because of the change from father’s or head of household’s occupa- tion to that of young people themselves This argu- ment seems to have two components The first mvolves the posslblhty that paternal occupation be- comes an mcreasmgly mvahd measure of social class between birth and school-leaving age It fails to take account of mtra-generatlonal social moblhty To achieve the pattern of relative equahsatlon m youth, however, one would have to posit a process m reverse of what IS usually expected, that fathers wrth healthier children move down the social scale, those with less healthy children move up This seems lmplauslble The second 1s potentially more slgmficant and reflects the madequacy of own occupation as a measure of social class m the immediate period after entry mto the labour market Most studies of social mobility exclude youth altogether because of the high level of occupational moblhty expenenced 1201 Occupation at this age IS not a good measure of ‘achieved’ social class The possibility IS, therefore, that class dlffer- entlals m health are obscured m late adolescence by virtue of the transient nature of the youth labour market It IS precisely for this reason that m the data presented here occupation of head of household has been used One way of resolving this issue, which becomes increasingly urgent in an era of unemploy- ment, 1s to utlhse altematlve mdlcators of social class which do not rely on occupation
A second explanation, which treats the patterns as real rather than apparent, mvolves the notion of a time delay m the effects of early environment Thus, one expects to find an impact m the earhest years by vn-tue of the fact that younger children are partlcu- larly vulnerable. Once survived, there 1s a penod m which those effects are latent, only becoming manifest m the post-adolescence penod when other influences such as those associated with the work-place or behavlours hke smoking compound those of the early environment Given the virtual disappearance of mfectlous diseases and the developmental course of chronic disease, It 1s perhaps not surprising that the effects of social class are not observed m youth Such an explanation 1s consistent with the evidence re- ported here and with two recent studies-one rn Sweden [2l], the other m Bntam [22)-which show that class dlfferentlals m self-reported morbidity do not become established until middle-age The idea of a latent penod m youth 1s also consistent wrth the well-estabhshed finding that height at any age m adolescence IS directly related to social class [23] As a marker of health status, It simply suggests that class differentials m youth have not dlsappeared, they are merely less visible
A third, and related, explanation places rather less emphasis on the effects of early environment and plays up the potentgal importance of influences occur- nng later on Of particular significance m this model IS the role of health-related behaviors like smoking or alcohol consumption, which develop m adolescence but which typlcally have delayed effects m terms of chrome morbldlty and mortality Their longer term slgruficance for health should, however, be obser- vable m youth as a series of clearcut class gradients
296 PATRICK WEST
A full review of the relevant literature 1s outside the scope of this paper, but the evidence from recent Bntlsh studies [23,24,25] suggests that around the age of 16 there IS much less class variation m smoking and drmkmg than IS often supposed In youth, though, the picture IS complicated by a number of age-specific influences, including those ansmg from the school context and youth (sub)culture mvolve- ment, which have the potential for cutting across social class That this period of relative equahsatlon IS essentially temporary IS indicated by the fact that by early adulthood a class differential m smoking 1s established (22,261 The picture for alcohol consump- tion is not so clearcut
A fourth, and entirely different, explanation of the re-emergence of social class differentials m mortality and morbidity m the post-youth period 1s health selection This hypothesis, which rests on the idea that the healthy experience upward social moblhty relative to their class of origin, the less healthy downward moblhty, cannot be tested on the two data-sets employed here because It requires a longl- tudmal approach However, it 1s of relevance to point out that the dramatic way social class differentials re-emerge after youth rather than simply showing a steady increase with age IS consistent with the health selection explanation Recent evrdence, too, from the National Child Development Survey [27], showing an independent effect of height on ‘achieved’ social class at age 23, also suggests an important role for health selection m accounting for the changing pattern of class gradients between youth and adulthood It IS not, of course, that one would expect health selection to be limited to that period but that its effect should be particularly marked m the period between entry into the labour market and the achievement of a stable occupational role
Interestingly enough, that 1s precisely the deduc- tion Hart [lo] draws m her assessment of Stern’s [8] formulation of the health selection thesis For Hart, It IS flawed because from available published statistics It IS not supported by the evidence--class gradients appear to be steeper before social moblhty occurs and shallower later on m hfe As we now know, uncntlcal reliance on those sources together wtth an assump- tion that inequalities in health charactense the whole of the life course can lead us to conclustons which are certainly partial. and sometimes downright wrong
Acknowledgements-The author IS supported financially by the Medical Research Council of Great Britain He would hke to thank colleagues at the MRC Medlcal Sociology Umt, particularly Russell Ecob, Kate Hunt and Sally Macmtyre for helpful comments on earher drafts of this paper and Gdl Smclalr for typing several verslons of the manuscript The permlsslon of the Controller, HMSO IS acknowledged for the direct reproduction of Fig 1 from Occupattonal Mortalrt) 197C-72 and for Figs 2 and 4 which are drawn from tables m Crown Copynght pubhcatlons
REFERENCES
I Macmtyre S The patternmg of health by social posItion m contemporary Brltam dIrectIons for sociological research Sot .%I Med 23, 393, 1986
2
3
4
5
6
7
8
9
10
11
12
13
14
15
16
17
18
19 20
21
22
23
24
25
26
27
Jones I G and Cameron D Social class analysis-an embarrassment to epldemlology Commun Med 6, 37, 1984 Illsley R Occupational class, selectlon and the produc- tron of mequahties in health Q J Sot Aflatrs 2, I5 1. 1986 Blaxter M Longitudinal studies m Brltam relevant to mequalities m health In Class and Health Research and Longztudtnal Data (Edited by Wdkmson R G ). p 125 Tavlstock, London, 1986 Townsend P and Davldson N Inequaltttes tn Health The Black Report Harmondsworth, Pengum, 1982 Office of Population Censuses and Surveys Occupa- tronal Mortabty 1970-80, 1982-83 Decenntal Supple- ment HMSO, London, 1986 Hart N Class, health and survival the gap widens Rod Commun Med Spring, IO, 1987 Stern J Social moblhty and the mterpretatlon of social class mortality dlfferentlals J Sot Polrc~ 12, 27. 1983 Department of Health and Social Security Preventton and Health Everybody’s Busrness A Reassessment o/ Public and Personal Health HMSO. London. 1976 Hart N Inequahtles m health the mdlvldual versus the environment J R Stattst Sot A 149, 228, 1986 Wllkmson R G (Ed ) Class and Health Research and Longttudtnal Data Tavlstock, London, 1986 Whitehead M The Health Dtvtde Inequaltttes m Health tn the 1980’s The Health Education Authority. Lon- don, 1987 Gdbert G M , Arber S , Byrne J D and Dale A General Household Survey 1980. SPSSX version Um- verslty of Surrey, 1983 Carr-HII1 R The mequahtles m health debate a crltlcal review of the Issues J Sot Pol 16, 509, 1987 Office of Population Censuses and Surveys Occu- pational Mortaltry 1970-72 Decenntal Supplement HMSO, London, 1978 Office of Population Censuses and Surveys General Household Survey 1980 HMSO, London, 1982 Adelstem A M and White G C Causes of chddren’s deaths analysed by social class (1959/63) In Chrld Health A Collectron of Studies (Edlted by Adelstem A M ef al), p 24 HMSO, London, 1976 (Studtes tn Medtcal and Populatton SubJects. No 31) Wadsworth M E J Serious Illness in chlldhood and Its assoclatlon with later-life achievement In Class and Health Research and Longttudtnal Data (Edlted by Wdkmson R G ), p 50 Tavlstock, London, 1986 Wadsworth M E J Personal commumcatlon Goldthorpe J Soctal Mob&y and Class Structure m Modern Brrtatn Clarendon Press, Oxford, 1981 Lundberg 0 Class and health compdrmg Brltam and Sweden Sot Scr Med 23, 5 I 1. 1986 Cox B D , Blaxter M , Buckle A L J et al The Health and LtJestyle Survey Health Promotion Research Trust, London, 1987 Fogelman K (Ed ) Growrng Up tn Great Brrtatn Papers From the Natronol Chrld Development Study Macmillan, London, 1983 Plant M A, Peck D F and Samuel E Alcohol, Drugs and School Leauers Tavlstock, London, 1985 Gdhes P Health behavlour and health promotlon m youth Paper presented at Changtng the Publrc Health Conference, Edinburgh, October 1987 Marsh A and Matheson J Smokrng Attrtudes and Behavtour HMSO, London, 1983 Power C., Fogelman K and Fox A J Health and social mob&y dunng the early years of hfe Q J Sot Affhtrs 2, 397, 1986