1 Inequality, the crisis, and stagnation Till van Treeck University of Duisburg-Essen 1. Introduction The inequality of income and wealth is one of the defining issues of our time, in terms of both its social and macroeconomic implications. In this article, I focus on the macroeconomic implications of inequality. In particular, it is possible to identify four themes on which there seems to be growing consensus among many economists especially in the various heterodox traditions, but also increasingly in the mainstream of the economics profession: The first theme, on which there is growing consensus, is the notion that the rise in inequality has contributed in an important way to the unsustainable rise in household debt in the United States and ultimately the financial and economic crisis starting in 2007 (e.g. Palley, 1994; Dutt, 2006; Frank, 2007; Cynamon and Fazzari, 2013; Fitoussi and Stiglitz, 2009; Rajan, 2010; Kumhof and Ranciere, 2010; Mian and Sufi, 2014). Secondly, there is the by now widely held view that rising inequality at the international level has contributed to the so-called global imbalances in terms of national current account positions (e.g. Kumhof et al., 2012; van Treeck and Sturn, 2012; Hein and Truger, 2012; Stockhammer, 2013; Behringer and van Treeck, 2013; Belabed et al., 2013). Thirdly, there has recently been a shift of the focus of attention from merely looking at income inequality to analysing the longer-term implications of income inequality for wealth inequality (e.g. Piketty, 2014; Saez and Zucman, 2014). And fourthly, the argument has been made that a high level of inequality can, generally speaking, be a cause of low economic growth, or even secular stagnation (e.g. Dutt, 2006; Palley, 2012; Ostry et al., 2014; Cingano, 2014). While it would be beyond the scope of this article to go into the details of each of these important issues, I will try to give a broad and non-technical overview on how these issues can be seen to be linked. 1 Section 2 discusses the link between income inequality and the U.S. household debt crisis. Section 3 discusses the link between changes in income distribution and the current account surplus of Germany. Section 4 looks at the relation between income distribution and current account imbalances for a panel of 20 industrialised countries. Section 5 then goes on to discuss the implications of the empirical findings for the evolution of wealth inequality. Finally, Section 6 concludes by arguing that inequality may indeed turn out to be one of the main causes of secular demand stagnation. 1 This article draws on van Treeck and Sturn (2012) and Behringer et al. (2013, 2014).
Transcript
1
Inequality, the crisis, and stagnation
Till van Treeck
University of Duisburg-Essen
1. Introduction
The inequality of income and wealth is one of the defining issues of our time, in terms of both its
social and macroeconomic implications. In this article, I focus on the macroeconomic implications of
inequality. In particular, it is possible to identify four themes on which there seems to be growing
consensus among many economists especially in the various heterodox traditions, but also
increasingly in the mainstream of the economics profession:
The first theme, on which there is growing consensus, is the notion that the rise in inequality has
contributed in an important way to the unsustainable rise in household debt in the United States and
ultimately the financial and economic crisis starting in 2007 (e.g. Palley, 1994; Dutt, 2006; Frank,
2007; Cynamon and Fazzari, 2013; Fitoussi and Stiglitz, 2009; Rajan, 2010; Kumhof and Ranciere,
2010; Mian and Sufi, 2014).
Secondly, there is the by now widely held view that rising inequality at the international level has
contributed to the so-called global imbalances in terms of national current account positions (e.g.
Kumhof et al., 2012; van Treeck and Sturn, 2012; Hein and Truger, 2012; Stockhammer, 2013;
Behringer and van Treeck, 2013; Belabed et al., 2013).
Thirdly, there has recently been a shift of the focus of attention from merely looking at income
inequality to analysing the longer-term implications of income inequality for wealth inequality (e.g.
Piketty, 2014; Saez and Zucman, 2014).
And fourthly, the argument has been made that a high level of inequality can, generally speaking, be
a cause of low economic growth, or even secular stagnation (e.g. Dutt, 2006; Palley, 2012; Ostry et
al., 2014; Cingano, 2014).
While it would be beyond the scope of this article to go into the details of each of these important
issues, I will try to give a broad and non-technical overview on how these issues can be seen to be
linked.1 Section 2 discusses the link between income inequality and the U.S. household debt crisis.
Section 3 discusses the link between changes in income distribution and the current account surplus
of Germany. Section 4 looks at the relation between income distribution and current account
imbalances for a panel of 20 industrialised countries. Section 5 then goes on to discuss the
implications of the empirical findings for the evolution of wealth inequality. Finally, Section 6
concludes by arguing that inequality may indeed turn out to be one of the main causes of secular
demand stagnation.
1 This article draws on van Treeck and Sturn (2012) and Behringer et al. (2013, 2014).
2
2. The inequality-crisis nexus in the United States
Figure 1 shows the spectacular rise in the share of total pre-tax household income going to the top of
income distribution in the United States, which started in the early 1980s. Figure 2 shows the equally
spectacular decrease in the private household saving rate, also starting in the early 1980s, to near
zero per cent just before the crisis. It also shows that households’ debt-to-income ratio has increased
very strongly in the United States over the same period.
Figure 1 around here
Figure 2 around here
These macroeconomic trends are intriguing, not least from a traditional Keynesian point of view. In
fact, simple Keynesian models would predict that higher income inequality leads to a higher
aggregate saving rate, because rich households have a lower marginal propensity to spend than poor
households. On the other hand, models with upward-looking status comparisons, like some variants
of the relative income hypothesis, predict a negative link between inequality and the aggregate
saving rate (Frank, 2005). According to this view, households just below the top of the distribution in
the United States, which could be called “upper middle class”, have reduced their saving in order to
try and keep up with the spending patterns of households at the top. This, in turn, may have also
increased the pressure on the lower middle and lower classes to increase spending relative to their
incomes. Ultimately, therefore, the rising standard of living at the top of the distribution has affected
the consumption norms of the entire income distribution (“expenditure cascades”, see Frank et al.,
2010).
It is important to emphasise that this explanation of the fall in the saving rate is not primarily about
the saving behaviour of poor households. By definition, poor households receive only a small share of
total incomes, and hence the effect of the saving behaviour of poor households on the aggregate
saving rate is rather limited. By contrast, the relative income hypothesis in the U.S. context highlights
the difficulties faced by the middle and upper middle class in providing for what they perceive as
basic needs in the face of rising inequality at the top of the distribution. Typical middle class needs
include the aspiration to send their children to relatively good schools or universities, to live in
relatively decent neighbourhoods, or to achieve a relatively high standard of health care.
All of these goods can be qualified as positional goods: What matters for the career prospects of
one’s children, for example, is the relative quality of their education rather than its absolute quality.
Clearly, not everybody can attend better than average schools, and even though today’s relatively
bad schools may be better than in the past, career prospects strongly depend on the quality of one’s
education relative to others of their generation. Similarly, social status depends not so much on the
absolute size or price of one’s home, but rather on its relative price. Again, not everyone can live in a
more expensive home or neighbourhood than the average person would aspire to live in. But the
3
relative decency of a neighbourhood also determines the relative quality of the infrastructure and
social networks that are important for households to strive economically.
Now, when people just above a given family in the income distribution scale begin to spend much
more money on education, simply because their incomes increase, but at the same time that given
family’s own income is stagnant, then that family either has to accept that the relative quality of their
children’s education decreases, or it can reduce their saving and go into debt. And this seems to be
what many U.S. middle class households have done, i.e., they have traded off their retirement
savings for the purchasing of positional goods such as education, housing, or health care. Clearly, and
importantly in this context, the institutional environment in the United States, where most of these
basic needs have to be paid for privately, puts enormous pressure on households to save less and go
into debt, as their relative incomes decrease. Moreover, given the uncertainties surrounding future
income prospects and the dependence of future income on the current consumption of positional
goods, it is not clear if households’ decision to “live beyond their means” can be qualified as
“irrational”, at least from the perspective of any given individual household.
Evidence in favour of the above explanation of the decrease in the U.S. household saving rate can be
provided based on micro data. As shown by Saez and Zucman (2014), it was the bottom 99% of the
wealth distribution who strongly reduced their saving rates starting in the early 1980s, whereas the
saving rate of the top 1% remained roughly stable. Meanwhile, the rise in the debt-to-net worth and
the debt-to-income ratios took place within the bottom 95% of the distribution, and not at all at the
top (Kumhof and Rancière, 2010; Cynamon and Fazzari, 2013).
Finally, it may be important to emphasise the fact that the functional distribution of income (the
distribution of the national income between wages and profits, or between household and corporate
income), has been much more stable in the United States since the 1980s, compared to the personal
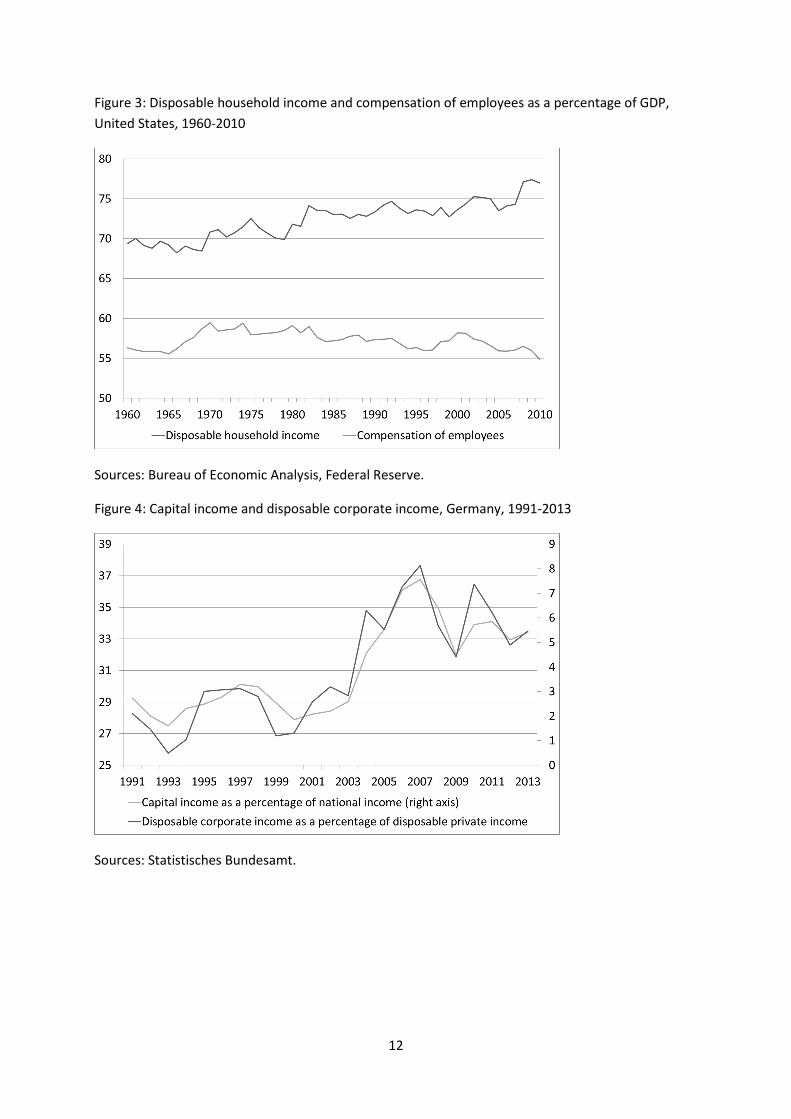
distribution of income (the distribution of income between households). As Figure 3 shows, even
though the wage share has decreased somewhat over the two or three decades preceding the crisis,
the total share of household income in national income has actually remained rather stable.
Figure 3 around here
In my view, these very powerful macroeconomic trends have a number of implications for economic
theory: Firstly, models focusing exclusively on the functional income distribution (as is the case in
many post-Keynesian and other heterodox models) may miss an important part of the inequality-
crisis nexus for the United States.2
2 In particular, this casts some doubt about the suitability of the so-called “Bhaduri-Marglin model” for
empirical investigations into the “wage-led” or “profit-led” nature of economic growth in different countries.
The original model by Bhaduri and Marglin (1990, p.77, footnote 1) assumes that the total income going to
households (wages and distributed profits, if any) are consumed, and that a positive fraction of profits is saved.
Given the stability of the share of total household income in the national income in the United States (Figure 5),
it would seem difficult to argue that shifts to the distribution of income between the household and corporate
sectors played a major role in affecting overall macroeconomic trends in the United States during the decades
prior to the crisis of 2007.
4
Secondly, mainstream theories of consumption are unable to explain the decline in the household
saving rate and the rise in household debt in the United States. In fact, the permanent income or life-
cycle theories of consumption see no link between any given household’s saving rate and its
(permanent) relative income. Rather, some variants of these theories try to explain the decrease in
the aggregate saving rate in the United States by referring to the so-called wealth effect. But the
wealth effect cannot explain why the saving rate of the top 1%, where most of the increase in wealth
took place, has actually remained stable. Moreover, much of the increase in the net worth-to-income
ratio of the bottom 95% of the income distribution before the crisis was due to the rising prices of
owner-occupied houses. Yet, as argued by Cynamon and Fazzari (2013), in most cases an owner-
occupied house merely signals an intention to consume future housing services. Since few
households actually decide to sell their house, an owner-occupied house should not generally be
considered as an asset in which households park wealth that they intend to use later to pay down
debt.
Thirdly, the current renaissance of the long-neglected relative income hypothesis of consumption is
in my view highly warranted.
3. Income distribution and macroeconomic instability in Germany
At first sight, the rise in inequality in Germany has been similar to that in the United States, at least
when looking at the Gini coefficient of equivalised household disposable income, which is still the
most routinely considered indicator of income inequality. However, when looking at top household
income shares, no major shifts can be observed for Germany over the past decades, especially for
the top 1 per cent household income share. This is also why, according to Piketty and Saez (2006),
Germany can be qualified as an L-shape country, whereas the United States and other Anglo Saxon
countries have been qualified as U-shape countries (cf. Figure 1).
It is problematic, however, to directly compare trends in top household income shares across
countries without also looking at trends within the corporate sector, which is essentially owned by
rich households. In Germany, the corporate sector has been a persistent net saver since 2002 (Figure
6), due to a large extent to the rise in retained profits. Therefore, to the extent that retained
corporate profits are not counted as household income, top household income shares à la Piketty
may underestimate the rise of top-end inequality in Germany.
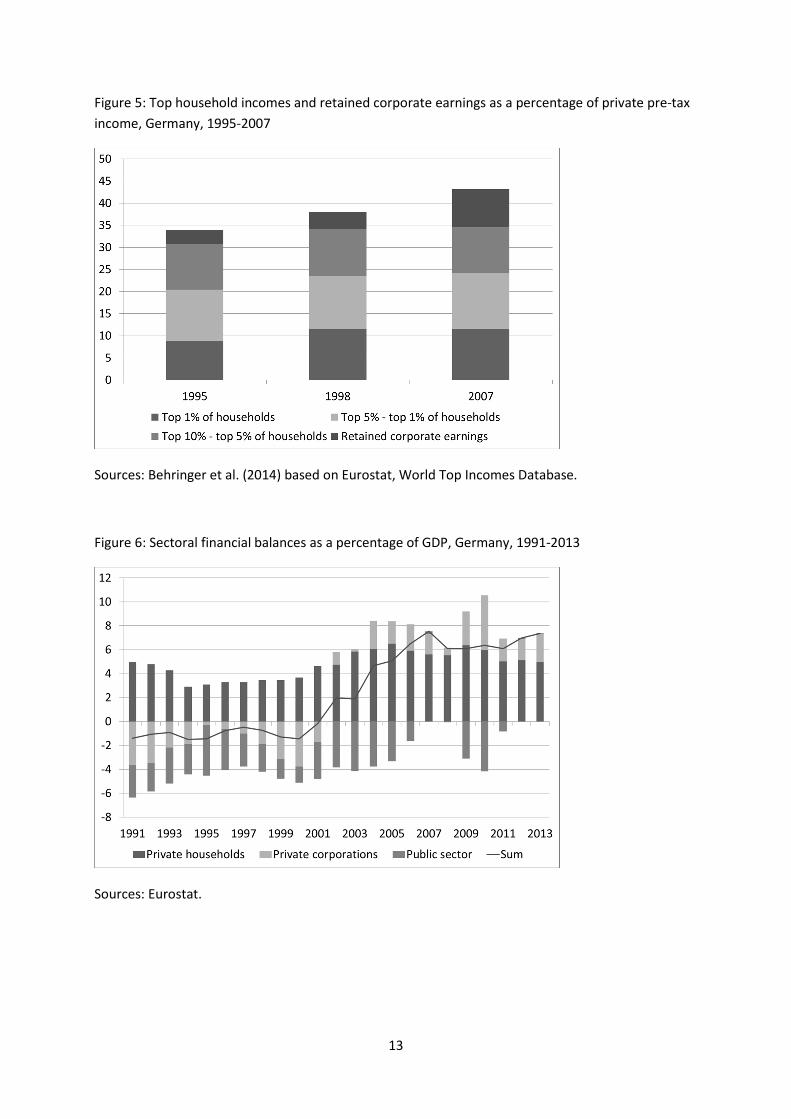
Figure 4 shows the rise in capital, or profit income as a percentage of national income in Germany
since the early 2000s, as well as the rise in corporate retained earnings as a share of disposable
private income over the same period. Based on these trends, Figure 5 puts in perspective the
development of top household income shares by taking into account the profits retained by
corporations between 1995 and 2007.
Figure 4 around here
Figure 5 around here
5
Of course, it would be excessive to argue that all retained earnings should simply be counted as top
household income. But Figure 5 can be thought of as a simple thought experiment, in that it shows
what would have happened to personal income inequality, if the German corporate sector had
behaved more like the U.S. corporate sector, which has passed their rising returns on to top
managers and shareholders, and thereby to the household sector.
The very different behaviour of German corporations is, of course, linked to the rather different
institutional environment in Germany, where the shareholder value orientation of firms is much
weaker, compared to the United States, and where many firms are small and medium-sized
enterprises which are often family-owned. Clearly, the main objective of many German firms does
not seem to be to pay maximum salaries and dividends to their managements and shareholders, but
rather to accumulate wealth within firms, in many cases with a view to passing this corporate wealth
on to the next generation as inheritances.
In conclusion, it can be argued that the “corporate veil” in Germany hides the true rise in inequality
between households, when focusing only on measures of personal income distribution. But the rise
in retained corporate profits also restrains domestic demand to the extent that the investment
spending of firms has not increased proportionally to the rise in retained profits. Finally, and perhaps
paradoxically, the rise in corporate saving has limited the pressure for the middle class to engage in
debt-financed consumption, because rich households (which can be seen as the reference group for
the middle class) have not increased their spending in proportion with the rise in incomes but rather
increased their saving rate indirectly through corporate net saving. In this context, it should also be
noted that the ability of the middle class in Germany to engage in debt-financed consumption is
restricted in Germany by more conservative bank lending practices, compared to the United
States.Similarly, the much more extensive provision of public goods, compared to the United States,
also limits the room for positional arms races.
Figure 6 places the financial balance of the German corporate sector in a broader macroeconomic
context. Since both the private household sector and the public sector have also been in or near
financial surplus in recent years, the current account surplus of the German economy has become
structural. In sum, the weakness of domestic demand, caused in part by the shift in functional
income distribution and corporate saving behaviour, has contributed to macroeconomic instability at
the international level in terms of the global current account imbalances.
Figure 6 around here
Some observers (OECD, 2010, 2012) have argued that the current account surplus of Germany was
due especially to weak investment spending, and they have concluded from this that Germany
should deregulate its product and labour markets further, in order to give a boost to investment.
However, the weak overall investment demand in Germany was due primarily to the weakness of
public investment and construction investment, whereas business equipment investment, which in
theory should be most sensitive to corporate profitability and regulations, has not been especially
6
weak (van Treeck and Sturn, 2012). Note also that net foreign direct investments account only for a
small part of the rise in the corporate financial balance.
Koo (2015) argues that Germany was in balance sheet recession at the beginning of the 2000s, and
that many corporations had to consolidate their balance sheets following the rise in corporate debt
during the economic upswing and stock market boom of the late 1990s. However, the net flow of
credit to the German corporate sector in the aggregate was negative for only two years (2003 and
2004; see also Koo, 2015, Figure 5.7). It is therefore questionable if the concept of balance sheet
recession, whereby the corporate sector would “minimise debt”, actually applies for Germany for
more than only a short period of time.
I would conclude that the main reason for the structural current account surpluses and the weak
domestic demand should be seen in the weakness of private household spending, caused in part by
the shift in the functional distribution of income.
4. Functional and personal income distribution and current account
imbalances
The purpose of this Section is to take a somewhat more systematic look at the relationship across
countries between changes in top household income shares and the functional distribution of
income on the one hand, and their implications for national current account positions on the other
hand.
Figure 7 relates changes in top household income shares to changes in the corporate financial
balances as a percentage of GDP for the G7 countries and China for the period mid-1980s to just
before the crisis. Interestingly, top household income shares have increased most in those countries
(United States and United Kingdom) where the corporate financial balance has increased less. A
similar relationship exists for the change in top household income shares and the change in the share
of wages in national income. In a sense, top management salaries and profits paid out to
shareholders have stabilised wages and household income in the Anglo Saxon countries, while in
countries like Germany, Japan or China, the rise in profits and corporate net savings is actually hiding
the “true” rise in income inequality.
Figure 7 around here
Behringer and van Treeck (2013) estimated standard current account equations on the basis of a
macro panel including 20 countries for the period 1972-2007. The estimations include measures of
the personal and functional income distribution as explanatory variables, while controlling for more
standard determinants of current account positions such as the initial net foreign asset position, the
fiscal balance, relative per capita income, the old age dependency ratio, population growth, and
private credit. An important result is that an increase in top income shares was linked to a decrease
of the current account, while an increase in corporate net saving (or a decrease in the wage share)
7
was linked to an increase of the current account. Also, taken together, the effects of changes in the
personal and functional distribution could explain a considerable part of the current account
imbalances before the crisis.
As an overall conclusion, it can be argued that rising inequality generally tends to increase
macroeconomic instability, but it depends crucially on the country-specific nature of inequality (as
well as on country-specific institutions), whether instability materialises in the form of rising
household indebtedness and current account deficits or in the form of weak domestic demand and
excessive current account surpluses.
5. Income and wealth inequality
In his international bestseller “Capital in the 21st
Century”, Thomas Piketty (2014) has formulated a
simple, but much-debated, model which can be used to analyse the link between income and wealth
inequality. According to Piketty, the model consists of two “fundamental laws of capitalism”, even
though the “first law” is merely a definition, and the “second law” is a simple arithmetic truism.3
More precisely, the first law defines the share of capital income in the national income, �, as the rate
of return on capital, �, times the wealth-to-income ratio, �. The “second law” states that, in long-
term equilibrium, the wealth-to-income ratio, �, converges to the saving rate, �, divided by the
nominal growth rate of the national income, �. Besides, Piketty argues that throughout the history of
capitalism, there has been a tendency of the rate of return on capital, �, to exceed the growth rate,
�. Piketty also shows that if the gap between � and � is large enough, then it can be expected that
wealth will rise faster than income and income and wealth inequality will rise indefinitely.
The crucial condition for the inequality � > � to imply an indefinitely rising wealth and income
inequality is that the saving rate of high income groups significantly exceeds the saving rates of lower
income groups. Because if the saving rate were independent of relative income, � > � would have
no effect whatsoever on equilibrium income and wealth inequality, which would then be identical to
wage inequality (i.e. the traditional focus of attention in mainstream economics).
However, as we have seen above for the examples of the United States and Germany, the
discrepancy between top-end and average saving rates has strongly increased in both countries,
albeit in rather different ways: In the United States, lower income groups have lowered their saving
rates presumably in an attempt to keep up with the spending patterns of the rich, whereas in
Germany, rich households have increased their saving rates through corporate retained earnings.
This means that, even independently of the precise relationship between �and �, the increased gap
between saving rates implies a tendency for the inequality of income and wealth to rise further.
While recent evidence documents the substantial rise in wealth inequality in recent decades for the
United States (Saez and Zucman, 2014), reliable data do not exist for Germany. The available data
based on household surveys suggest that although income inequality has increased, wealth
inequality has remained roughly stable since 2002 (Grabka and Westermeier 2014). But these
3 For an interesting critique of Piketty’s interpretation of the model, see Bernardo/Martinez/Stockhammer
(2014).
8
findings are called into question by the observations made above about recent trends in income
distribution and saving rates in Germany.
6. Inequality and demand stagnation
In this short article, I have argued that inequality was an important cause of the global financial crisis,
which has materialised in some countries (e.g. United States) in the form of over-indebted
households and in others (e.g. Germany) in the form of excessive current account surpluses which
are linked to the over-indebtedness of the trading partners. Clearly, this inequality-induced “debt
overhang” directly adds to the now much-debated risk of “secular stagnation”.
Some economists argue that further structural reforms (i.e. deregulation) in the product and labour
markets are now needed to give a boost to investment. But a more fundamental question is how
consumption demand, which after all makes up 60 to 70 per cent of GDP, can recover, given current
levels of inequality and household debt. Generally speaking, for demand growth to recover in a
sustainable way, middle and lower class incomes would have to move at least in parallel with
average trend productivity. In fact, it would seem that some rather massive redistribution of income
will be necessary to overcome the unsustainable debt-led and export-led models that we have seen
before the crisis.
Economists should further improve their understanding of the links between the distribution of
income and macroeconomic development. Because the nature and macroeconomic implications of
rising inequality can vary substantially across countries, theoretical and empirical research should
systematically include both the functional and the personal distribution of income.
References
Behringer, J., Belabed, C., Theobald, T., van Treeck, T. (2013): Einkommensverteilung,
Finanzialisierung und makroökonomische Ungleichgewichte, in: Vierteljahreshefte zur
Wirtschaftsforschung - Nachhaltige europäische Konsolidierungspolitik: Chancen und
Herausforderungen, 82 (4), 203-221.
Behringer, J., Theobald, T., van Treeck, T. (2014): Einkommens- und Vermögensverteilung in
Deutschland: Eine makroökonomische Sicht, Institut für Makroökonomie und Konjunkturforschung
(IMK), IMK Report Nr. 99.
Behringer, J., van Treeck, T. (2013): Income distribution and the current account: A sectoral
perspective, Institute for New Economic Thinking (INET), INET Research Notes 35.
Belabed, C., Theobald, T., van Treeck, T. (2013): Income distribution and current account imbalances,
Institute for New Economic Thinking (INET), INET Research Notes 36.
Bernardo, J., Martinez, F., Stockhammer, E. (2014): A post-Keynesian response to Piketty’s
“Fundamental Contradiction of Capitalism”, Post Keynesian Economics Study Group Working Paper
1411
9
Cingano, F. (2014): Trend in income inequality and its impact on economic growth, OECD Social,
Employment and Migration Working Papers, No. 163.
Cynamon, B., Fazzari, S. (2013): Inequality, the Great Recession, and slow recovery, URL: