32
Inequity and Inequality in a Healthy City Profile of Moscow Part II Irina Campbell, PhD, MPH [email protected] www.CampbellHealthAssociates.com
| Date post: | 23-Dec-2015 |
| Category: |
Documents |
| Upload: | john-blair |
| View: | 217 times |
| Download: | 1 times |
Inequity and Inequality in a Healthy City Profile of Moscow
Part II
Irina Campbell, PhD, MPH
www.CampbellHealthAssociates.com

TABLE : Economic Indicators in Russia,
City of Moscow, City of St. Petersburg, 1990-
1995RUSSIA MOSCOW1990 1995 1990 1995
N telephones/100 families 35.7 46.0 92.0 102.8N sq.m. living space/ per capita 16.4 18.1 18.0 20.0% privatized apts/all apts whichcould become privatized 0.16 36.0 0.1 41N private autos/1000s 58.6 92.7 70.6 153.5
Click for whole Table
A 1992-1994 analysis of health profiles from 47 cities across
Europe, which were members of the WHO Healthy Cities Project, indicated that cities, as coherent
collective wholes, have population distributions with
characteristics distinct from the sum of its individual members.

To orient health policy priorities to resolve inequities, it is important to
distinguish between identifying intervening individual risk factors (like secondary smoke or drinking
and driving) or addressing fundamental social conditions (like
the lack of education, a civic community, or employment).

Health policy which seeks to eliminate only the intervening
mechanisms or individual factors in health inequality will neither
eliminate inequity nor the relationship between the disease
and fundamental social conditions (Fiscella, 1997).

Social conditions and access to resources are very different in urban
and rural regions, particularly in large, diverse multi-ethnic, multi-
lingual nations like Russia.
Cities in Eastern Europe and Russia have a younger population structure,
but a lower life expectancy than western and northern European
cities. St. Petersburg, Russia, had the highest SMR of 14 cities, and
twice of Nancy, France.

TABLE: Social Capital Indicators in Russia,
City of Moscow, City of St. Petersburg, 1990-
1995RUSSIA MOSCOW1990 1995 1990 1995
Pop size (millions) 148.200 147.739 8.967^ 8.625Pop. change +2.2 -5.7 +10.2^ -8.9Ave. household size 3.2 2.84## 3.1 2.74##
Click for whole Table
A city health profile of Moscow is specific to its historical and
geographical context. Moscow is the capital and chief city in the
central region of Russia.

Moscow, which celebrated its 850th anniversary in 1997, has always been Russia’s seminal city, the seat of the
Tsars and the bureaucratic elite, which controlled national resources
and wealth.

Inequality and poverty in the general population of Moscow
were regulated to some extent by the socialist state, which
attempted to control most aspects of community life by urban
planning of housing, services, and economic infrastructure.
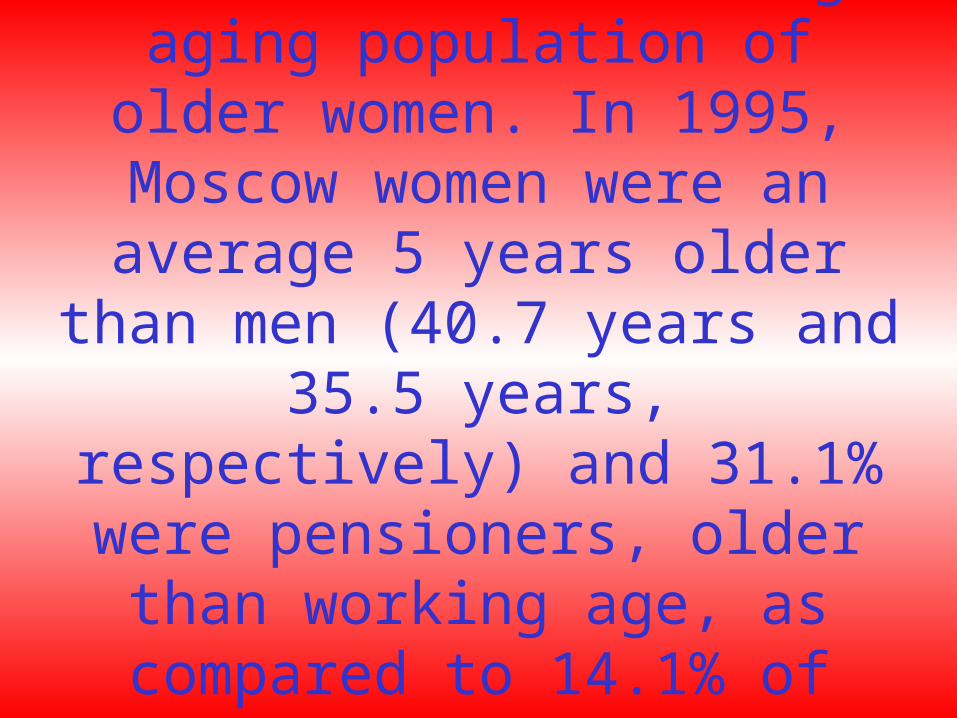
Moscow also has a large aging population of older women. In 1995, Moscow women were an average 5
years older than men (40.7 years and 35.5 years, respectively) and 31.1% were pensioners, older than working age, as compared to 14.1% of men.

TABLE 4 : Cause-specific death rates in Russia, City
of Moscow, City of St. Petersburg, 1989-1997 (per
100,000)RUSSIA MOSCOW
1990 1993 1995 1989 1993-1995*1996 1997Life expectancyMalesFemales
6474
5972
5872
6674
58^^72^^
n/an/a
61.373.6
Birth rate/1000 14.6^ 9.4 9.3 11.8 8.0^^ 7.9 7.8Death rate/1000 10.7^ 14.5 15. 12.4 16.9^^ 15.0 14.5Infant mortality/1000 live births 17.4 19.9 18.1 19.2 16.5 13.1 14.4
Click for whole Table

It was an alarming indicator of a compromised quality of life when, overall, more inhabitants died in
Moscow than were born at the close of Perestroika.
FIGURE 3 : City of Moscow projected death rates, 1993-2010: actual
rates, average rates, pessimistic high rates,
optimistic low rates
Click for the Figure

Although cardiovascular diseases still contribute the largest segment to decreasing life
expectancy in Moscow, deaths from unexplained external and
other causes account for a substantial proportion of total
mortality (Table 5).

Adequate mortality statistics are not yet readily available openly for independent verification of government sponsored research
by any western researchers requesting such data, the
accessibility to which is still strictly controlled.

Although some attempts at linking alcohol consumption and cardiovascular disease mortality have been made for Russia to
account for the mortality gap, the effects of stress, inequality, and social determinants have been shown to have a greater impact
than individual levels of drinking in western countries (Chenet et al., 1998a,
1998b; Bloom and Malaney, 1998).
Morbidity in Moscow has been reported by the Mayor’s office as
being 15-20% higher than the average in the Russian Federation
in the first half of 1999.
21% of all morbidity among Moscow adults, in 1998, was due to
respiratory illness, 40% among adolescents, and 60% among
children.
With the transfer of government property into private ownership,
there has been a concomitant increase in breach of the Moscow city sanitation code by industries and firms, from 82.6% in 1995 to 85.2% in 1997, especially among
small businesses.

Adult heart disease was 70% higher in 1997 in Moscow than Russia
(220 vs. 125.4/100,000 respectively), and infectious
respiratory diseases and sexually transmitted diseases remain a major
public health threat (State of the Environment in Moscow,
www.mos.ru , 1999).
Morbidity was officially published in Moscow for only a limited
number of conditions before 1990, but has been available annually for
Russia as a whole since the last census of 1988-1989 (Vishnevsky,
1995; Goskomstat, 1996).
Moscow, as the primary urban center in the Russian Federation,
clearly exhibits the health risks of a variety of factors which accompany any megalopolis of over 8 million
inhabitants.

In 1991, Moscow did not have any registered cases of congenital syphilis, while in 1997, this
increased to 34 cases.

The uneven variation of risk factors and health status was noted by the 1997 Mayor’s Report, pointing to
the existence of specific neighborhood pockets of poor
health.
In 1992, the southwestern district had the highest overall prevalence of infectious and parasitic diseases. Although morbidity rates were
influenced by the location of specific health facilities which report official
data, as was likely in the northwestern district, urban areas varied by
important health risks.

Housing was a major employment benefit before 1992, and an important measure of personal wealth with the spread of privatization and purchase
of apartments after 1992.

The Urban Institute survey estimated that the richest one-fifth of Moscow residents owned about half the wealth, including most real
property (Lee, 1996).

The contrasts of the quality of life within Moscow’s 33 raiyons were
amplified with time and the allocation of services and housing through employing institutions, a
dominant mechanism of controlling perks and access to material
resources.

The Moscow raiyons, both before and after rezoning have had specific social neighborhood characteristics
reported by the city census and statistical agency. The Moscow
neighborhood, thus, may be incorporated into a multilevel model
of health-related quality of life.

Further, the hierarchical linear model can take into consideration multiple factors and their interactions, which
can clarify the independent association between area and
distribution of various measures of the quality of life.


