Inferential considerations for low-countRNA-seq transcripts: a case study on thedominant prairie grass Andropogon gerardiiSeth Raithel1, Loretta Johnson2, Matthew Galliart2, Sue Brown2, Jennifer Shelton2, Nicolae Herndon2
and Nora M. Bello1*
Abstract
Background: Differential expression (DE) analysis of RNA-seq data still poses inferential challenges, such ashandling of transcripts characterized by low expression levels. In this study, we use a plasmode-based approachto assess the relative performance of alternative inferential strategies on RNA-seq transcripts, with special emphasison transcripts characterized by a small number of read counts, so-called low-count transcripts, as motivated by anecological application in prairie grasses. Big bluestem (Andropogon gerardii) is a wide-ranging dominant prairie grassof ecological and agricultural importance to the US Midwest while edaphic subspecies sand bluestem (A. gerardiissp. Hallii) grows exclusively on sand dunes. Relative to big bluestem, sand bluestem exhibits qualitative phenotypicdivergence consistent with enhanced drought tolerance, plausibly associated with transcripts of low expressionlevels. Our dataset consists of RNA-seq read counts for 25,582 transcripts (60 % of which are classified as low-count)collected from leaf tissue of individual plants of big bluestem (n = 4) and sand bluestem (n = 4). Focused on low-count transcripts, we compare alternative ad-hoc data filtering techniques commonly used in RNA-seq pipelinesand assess the inferential performance of recently developed statistical methods for DE analysis, namely DESeq2and edgeR robust. These methods attempt to overcome the inherently noisy behavior of low-count transcripts byeither shrinkage or differential weighting of observations, respectively.
Results: Both DE methods seemed to properly control family-wise type 1 error on low-count transcripts, whereasedgeR robust showed greater power and DESeq2 showed greater precision and accuracy. However, specificationof the degree of freedom parameter under edgeR robust had a non-trivial impact on inference and should behandled carefully. When properly specified, both DE methods showed overall promising inferential performanceon low-count transcripts, suggesting that ad-hoc data filtering steps at arbitrary expression thresholds may beunnecessary. A note of caution is in order regarding the approximate nature of DE tests under both methods.
Conclusions: Practical recommendations for DE inference are provided when low-count RNA-seq transcripts are ofinterest, as is the case in the comparison of subspecies of bluestem grasses. Insights from this study may also berelevant to other applications focused on transcripts of low expression levels.
* Correspondence: [email protected] of Statistics, Kansas State University, Manhattan, KS, USAFull list of author information is available at the end of the article
BackgroundRNA sequencing (RNA-seq) technology has rapidly be-come the preferred choice for gene expression analysisas it allows for high throughput over a wide range of ex-pression levels [1]. Yet, some features of RNA-seq datastill pose considerable challenges for differential expres-sion (DE) analysis, in particular related to transcriptswith low levels of expression, as characterized by lownumber of read counts [2, 3]. So called low-count tran-scripts often show large variability of logarithmic foldchange (LFC) estimates and thus exhibit inherently nois-ier inferential behavior [3]. Thus, it is not surprising thatstandard protocols for processing of RNA-seq data callfor filtering out transcripts with read counts below pre-determined expression thresholds [4]. As a consequenceof data filtering, low-count transcripts are often excludedfrom DE analyses and ignored for the purpose of infer-ence. Thus, it is plausible that important transcripts oflow expression levels, such as transcription factors, maybe easily overlooked despite their key role as master reg-ulators of downstream gene expression [5].Data filtering prior to DE analyses was originally im-
plemented in an attempt to control noise and reduce theimpact of multiple testing adjustments on power for DEdetection by removal of uninformative or weaklyexpressed transcripts [4, 6]. Nevertheless, thresholds forfiltering are usually specified with little, if any, biologicalrationale and at seemingly arbitrary cut-offs that varywidely across studies [4, 7, 8]. Recent advances in statis-tical methods available for DE analyses of RNA-seq datamay provide alternative approaches to deal with weaklyexpressed transcripts without the need for data filteringat arbitrary expression thresholds. More specifically,methods like DESeq2 [3], edgeR [9] and edgeR robust[10] have become particularly popular. Most notably,these methods attempt to handle extremely large countson RNA-seq transcripts, which may unwittingly also fa-cilitate inference on low-count transcripts. That is, ra-ther than filtering out low-count transcripts at arbitrarycut-off threshold and excluding them from DE analysis,these statistical methods could potentially be used to ac-count for the increased uncertainty associated with low-count transcripts. Both DESeq2 and edgeR have in com-mon a generalized linear mixed models framework thatrelies on the negative binomial distribution family andefficiently borrows information across transcripts tomoderate transcript-specific dispersion estimates [3, 10].As an additional advantage, DESeq2 shrinks LFC esti-mates towards a common mean in a manner inverselyproportional to the amount of information available fora transcript [3]. Limited information due to either a highlevel of dispersion (as in extremely large counts) or alow level of expression (as in low-count transcripts)causes transcript-specific LFC estimates to shrink
towards zero. In turn, the latest release of edgeR, namelyedgeR robust, works by down weighting observationsthat deviate from the model fit [10], thereby dampeningthe effect that observations with very high or very lowexpression levels have on transcript-specific estimates ofmean expression and dispersion. As a trade-off, edgeRrobust requires specification of a degrees of freedom(DF) parameter that controls the amount of shrinkage inthe estimation process. Unless explicitly specified by theuser, the DF parameter defaults to a set predeterminedvalue [10] that may be appropriate for some, but not ne-cessarily all data applications. Interestingly, no such userspecification is required by DESeq2; rather, all necessaryparameters are estimated from the data.In this study, we use a data application on prairie
grasses to illustrate inferential challenges related to low-count transcripts in RNA-seq DE analyses. Our motivat-ing interest in low-count RNA-seq transcripts stemsfrom our ongoing work with the wide-ranging prairiegrass big bluestem (Andropogon gerardii) and its edaphicsubspecies sand bluestem (A. gerardii ssp. Hallii). Bigbluestem (BB) is a widely-distributed dominant grass ofNorth American grasslands [11] and constitutes themain native forage grass for cattle in the US Great Plains[12]. In contrast, sand bluestem’s (SB) habitat consistsprimarily of the Sand Hills in Nebraska [11–14]. Ourpreliminary studies [15] pointed towards phenotypic dif-ferences between BB and SB subspecies that are consist-ent with enhanced drought tolerance of SB. Forinstance, we observed a greater quantity of epicuticularwax on the leaf surface of SB plants relative to that ofBB [15]. Further, analysis of epicuticular wax compo-nents showed presence of approximately ~20 % β-diketones on SB leaves, whereas β-diketones were absentin epicuticular wax of BB leaves [15]. Differential quan-tity and quality of epicuticular wax on leaf surfaces couldaffect heat reflectance and transmittance, thus providingdifferential relative advantages to heat tolerance in dryconditions. Further, epicuticular wax decreased light ab-sorbance in sand bluestem [15], thus potentially lower-ing internal leaf temperature and further protecting SBgrasses against heat stress. Taken together, our prelimin-ary studies indicate that adaptation of SB to water-limited conditions may involve adaptation of leaf cuticlechemistry, morphology, and function. Sand bluestem’senhanced tolerance to dry conditions relative to BB [15]is of interest due to the expected increase in extremedroughts throughout Midwest grasslands [16]. In thisstudy, we further characterize differences between BBand SB subspecies at the transcriptome level. Followingfrom the qualitative phenotypic divergence observed be-tween SB and BB, we initially focused on RNA tran-scripts that were expressed in only one of the bluestemsubspecies, with expression absent in the other. More
Raithel et al. BMC Genomics (2016) 17:140 Page 2 of 16
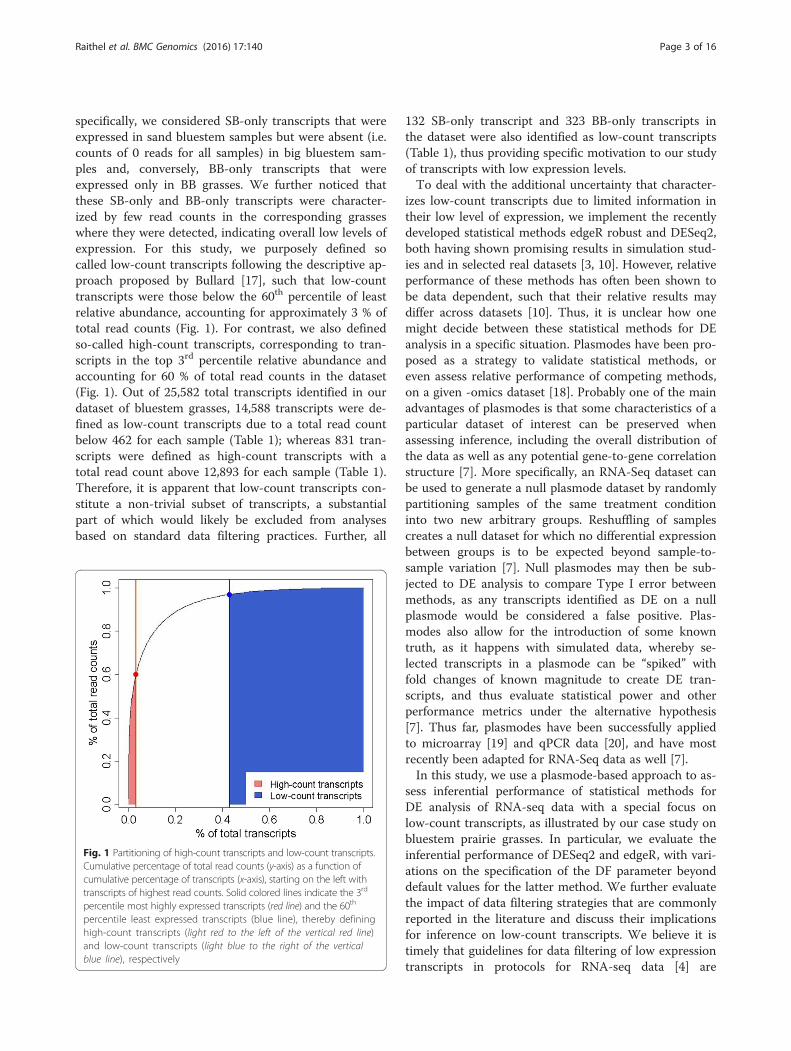
specifically, we considered SB-only transcripts that wereexpressed in sand bluestem samples but were absent (i.e.counts of 0 reads for all samples) in big bluestem sam-ples and, conversely, BB-only transcripts that wereexpressed only in BB grasses. We further noticed thatthese SB-only and BB-only transcripts were character-ized by few read counts in the corresponding grasseswhere they were detected, indicating overall low levels ofexpression. For this study, we purposely defined socalled low-count transcripts following the descriptive ap-proach proposed by Bullard [17], such that low-counttranscripts were those below the 60th percentile of leastrelative abundance, accounting for approximately 3 % oftotal read counts (Fig. 1). For contrast, we also definedso-called high-count transcripts, corresponding to tran-scripts in the top 3rd percentile relative abundance andaccounting for 60 % of total read counts in the dataset(Fig. 1). Out of 25,582 total transcripts identified in ourdataset of bluestem grasses, 14,588 transcripts were de-fined as low-count transcripts due to a total read countbelow 462 for each sample (Table 1); whereas 831 tran-scripts were defined as high-count transcripts with atotal read count above 12,893 for each sample (Table 1).Therefore, it is apparent that low-count transcripts con-stitute a non-trivial subset of transcripts, a substantialpart of which would likely be excluded from analysesbased on standard data filtering practices. Further, all
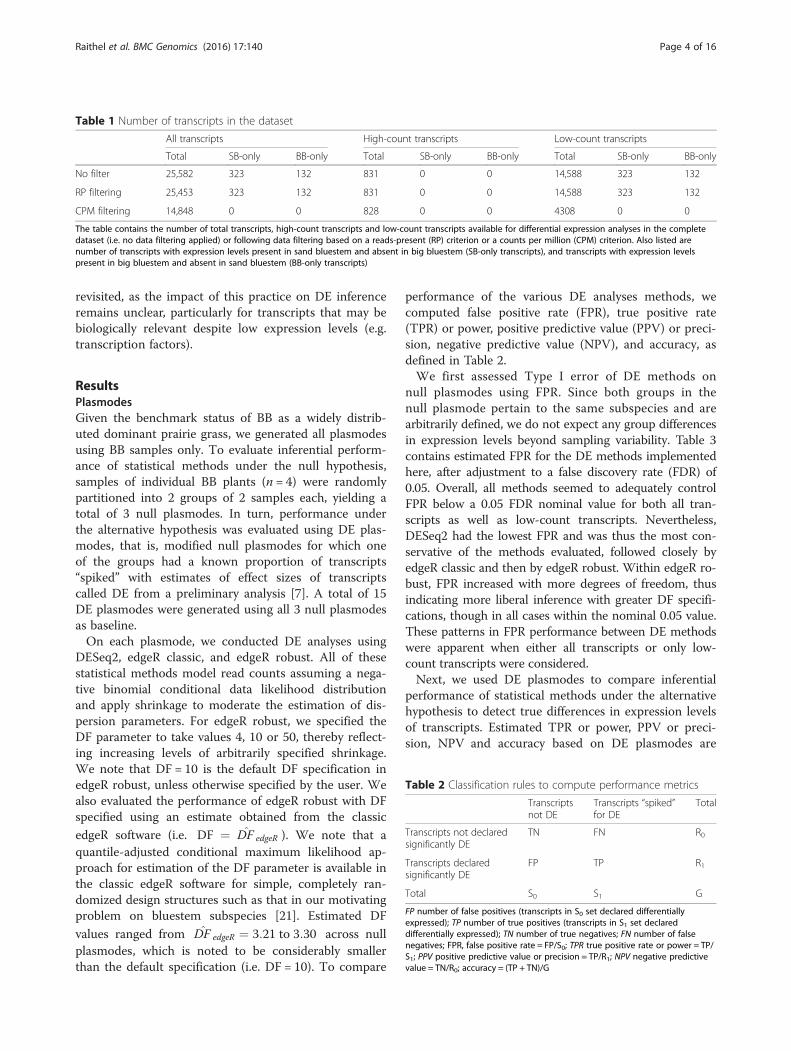
132 SB-only transcript and 323 BB-only transcripts inthe dataset were also identified as low-count transcripts(Table 1), thus providing specific motivation to our studyof transcripts with low expression levels.To deal with the additional uncertainty that character-
izes low-count transcripts due to limited information intheir low level of expression, we implement the recentlydeveloped statistical methods edgeR robust and DESeq2,both having shown promising results in simulation stud-ies and in selected real datasets [3, 10]. However, relativeperformance of these methods has often been shown tobe data dependent, such that their relative results maydiffer across datasets [10]. Thus, it is unclear how onemight decide between these statistical methods for DEanalysis in a specific situation. Plasmodes have been pro-posed as a strategy to validate statistical methods, oreven assess relative performance of competing methods,on a given -omics dataset [18]. Probably one of the mainadvantages of plasmodes is that some characteristics of aparticular dataset of interest can be preserved whenassessing inference, including the overall distribution ofthe data as well as any potential gene-to-gene correlationstructure [7]. More specifically, an RNA-Seq dataset canbe used to generate a null plasmode dataset by randomlypartitioning samples of the same treatment conditioninto two new arbitrary groups. Reshuffling of samplescreates a null dataset for which no differential expressionbetween groups is to be expected beyond sample-to-sample variation [7]. Null plasmodes may then be sub-jected to DE analysis to compare Type I error betweenmethods, as any transcripts identified as DE on a nullplasmode would be considered a false positive. Plas-modes also allow for the introduction of some knowntruth, as it happens with simulated data, whereby se-lected transcripts in a plasmode can be “spiked” withfold changes of known magnitude to create DE tran-scripts, and thus evaluate statistical power and otherperformance metrics under the alternative hypothesis[7]. Thus far, plasmodes have been successfully appliedto microarray [19] and qPCR data [20], and have mostrecently been adapted for RNA-Seq data as well [7].In this study, we use a plasmode-based approach to as-
sess inferential performance of statistical methods forDE analysis of RNA-seq data with a special focus onlow-count transcripts, as illustrated by our case study onbluestem prairie grasses. In particular, we evaluate theinferential performance of DESeq2 and edgeR, with vari-ations on the specification of the DF parameter beyonddefault values for the latter method. We further evaluatethe impact of data filtering strategies that are commonlyreported in the literature and discuss their implicationsfor inference on low-count transcripts. We believe it istimely that guidelines for data filtering of low expressiontranscripts in protocols for RNA-seq data [4] are
Fig. 1 Partitioning of high-count transcripts and low-count transcripts.Cumulative percentage of total read counts (y-axis) as a function ofcumulative percentage of transcripts (x-axis), starting on the left withtranscripts of highest read counts. Solid colored lines indicate the 3rd
percentile most highly expressed transcripts (red line) and the 60th
percentile least expressed transcripts (blue line), thereby defininghigh-count transcripts (light red to the left of the vertical red line)and low-count transcripts (light blue to the right of the verticalblue line), respectively
Raithel et al. BMC Genomics (2016) 17:140 Page 3 of 16
revisited, as the impact of this practice on DE inferenceremains unclear, particularly for transcripts that may bebiologically relevant despite low expression levels (e.g.transcription factors).
ResultsPlasmodesGiven the benchmark status of BB as a widely distrib-uted dominant prairie grass, we generated all plasmodesusing BB samples only. To evaluate inferential perform-ance of statistical methods under the null hypothesis,samples of individual BB plants (n = 4) were randomlypartitioned into 2 groups of 2 samples each, yielding atotal of 3 null plasmodes. In turn, performance underthe alternative hypothesis was evaluated using DE plas-modes, that is, modified null plasmodes for which oneof the groups had a known proportion of transcripts“spiked” with estimates of effect sizes of transcriptscalled DE from a preliminary analysis [7]. A total of 15DE plasmodes were generated using all 3 null plasmodesas baseline.On each plasmode, we conducted DE analyses using
DESeq2, edgeR classic, and edgeR robust. All of thesestatistical methods model read counts assuming a nega-tive binomial conditional data likelihood distributionand apply shrinkage to moderate the estimation of dis-persion parameters. For edgeR robust, we specified theDF parameter to take values 4, 10 or 50, thereby reflect-ing increasing levels of arbitrarily specified shrinkage.We note that DF = 10 is the default DF specification inedgeR robust, unless otherwise specified by the user. Wealso evaluated the performance of edgeR robust with DFspecified using an estimate obtained from the classic
edgeR software (i.e. DF ¼ D̂F edgeR ). We note that aquantile-adjusted conditional maximum likelihood ap-proach for estimation of the DF parameter is available inthe classic edgeR software for simple, completely ran-domized design structures such as that in our motivatingproblem on bluestem subspecies [21]. Estimated DF
values ranged from D̂F edgeR ¼ 3:21 to 3:30 across nullplasmodes, which is noted to be considerably smallerthan the default specification (i.e. DF = 10). To compare
performance of the various DE analyses methods, wecomputed false positive rate (FPR), true positive rate(TPR) or power, positive predictive value (PPV) or preci-sion, negative predictive value (NPV), and accuracy, asdefined in Table 2.We first assessed Type I error of DE methods on
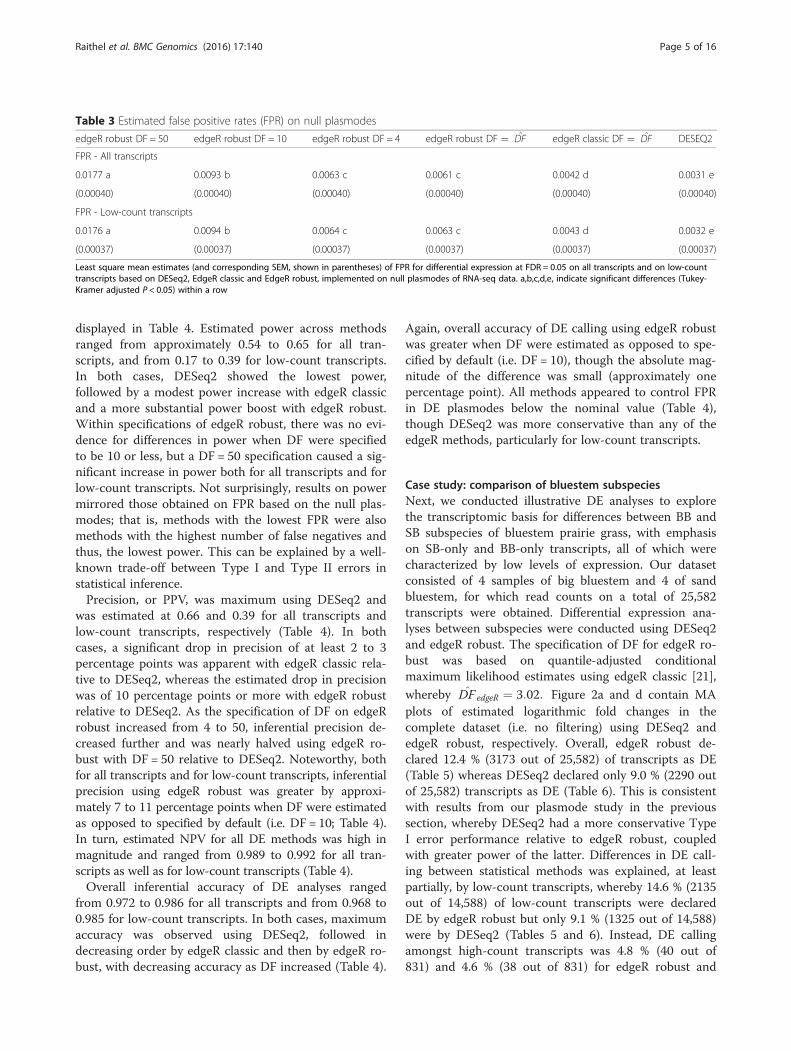
null plasmodes using FPR. Since both groups in thenull plasmode pertain to the same subspecies and arearbitrarily defined, we do not expect any group differencesin expression levels beyond sampling variability. Table 3contains estimated FPR for the DE methods implementedhere, after adjustment to a false discovery rate (FDR) of0.05. Overall, all methods seemed to adequately controlFPR below a 0.05 FDR nominal value for both all tran-scripts as well as low-count transcripts. Nevertheless,DESeq2 had the lowest FPR and was thus the most con-servative of the methods evaluated, followed closely byedgeR classic and then by edgeR robust. Within edgeR ro-bust, FPR increased with more degrees of freedom, thusindicating more liberal inference with greater DF specifi-cations, though in all cases within the nominal 0.05 value.These patterns in FPR performance between DE methodswere apparent when either all transcripts or only low-count transcripts were considered.Next, we used DE plasmodes to compare inferential
performance of statistical methods under the alternativehypothesis to detect true differences in expression levelsof transcripts. Estimated TPR or power, PPV or preci-sion, NPV and accuracy based on DE plasmodes are
Table 1 Number of transcripts in the dataset
All transcripts High-count transcripts Low-count transcripts
Total SB-only BB-only Total SB-only BB-only Total SB-only BB-only
The table contains the number of total transcripts, high-count transcripts and low-count transcripts available for differential expression analyses in the completedataset (i.e. no data filtering applied) or following data filtering based on a reads-present (RP) criterion or a counts per million (CPM) criterion. Also listed arenumber of transcripts with expression levels present in sand bluestem and absent in big bluestem (SB-only transcripts), and transcripts with expression levelspresent in big bluestem and absent in sand bluestem (BB-only transcripts)
Table 2 Classification rules to compute performance metrics
Transcriptsnot DE
Transcripts “spiked”for DE
Total
Transcripts not declaredsignificantly DE
TN FN R0
Transcripts declaredsignificantly DE
FP TP R1
Total S0 S1 G
FP number of false positives (transcripts in S0 set declared differentiallyexpressed); TP number of true positives (transcripts in S1 set declareddifferentially expressed); TN number of true negatives; FN number of falsenegatives; FPR, false positive rate = FP/S0; TPR true positive rate or power = TP/S1; PPV positive predictive value or precision = TP/R1; NPV negative predictivevalue = TN/R0; accuracy = (TP + TN)/G
Raithel et al. BMC Genomics (2016) 17:140 Page 4 of 16
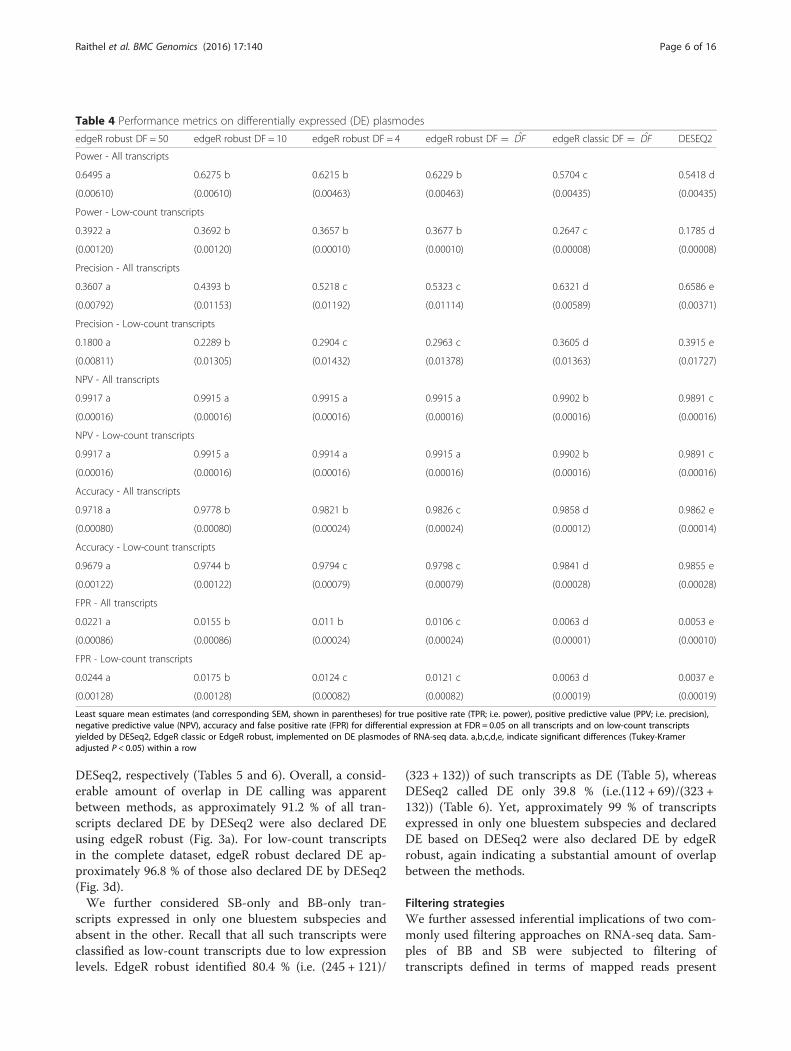
displayed in Table 4. Estimated power across methodsranged from approximately 0.54 to 0.65 for all tran-scripts, and from 0.17 to 0.39 for low-count transcripts.In both cases, DESeq2 showed the lowest power,followed by a modest power increase with edgeR classicand a more substantial power boost with edgeR robust.Within specifications of edgeR robust, there was no evi-dence for differences in power when DF were specifiedto be 10 or less, but a DF = 50 specification caused a sig-nificant increase in power both for all transcripts and forlow-count transcripts. Not surprisingly, results on powermirrored those obtained on FPR based on the null plas-modes; that is, methods with the lowest FPR were alsomethods with the highest number of false negatives andthus, the lowest power. This can be explained by a well-known trade-off between Type I and Type II errors instatistical inference.Precision, or PPV, was maximum using DESeq2 and
was estimated at 0.66 and 0.39 for all transcripts andlow-count transcripts, respectively (Table 4). In bothcases, a significant drop in precision of at least 2 to 3percentage points was apparent with edgeR classic rela-tive to DESeq2, whereas the estimated drop in precisionwas of 10 percentage points or more with edgeR robustrelative to DESeq2. As the specification of DF on edgeRrobust increased from 4 to 50, inferential precision de-creased further and was nearly halved using edgeR ro-bust with DF = 50 relative to DESeq2. Noteworthy, bothfor all transcripts and for low-count transcripts, inferentialprecision using edgeR robust was greater by approxi-mately 7 to 11 percentage points when DF were estimatedas opposed to specified by default (i.e. DF = 10; Table 4).In turn, estimated NPV for all DE methods was high inmagnitude and ranged from 0.989 to 0.992 for all tran-scripts as well as for low-count transcripts (Table 4).Overall inferential accuracy of DE analyses ranged
from 0.972 to 0.986 for all transcripts and from 0.968 to0.985 for low-count transcripts. In both cases, maximumaccuracy was observed using DESeq2, followed indecreasing order by edgeR classic and then by edgeR ro-bust, with decreasing accuracy as DF increased (Table 4).
Again, overall accuracy of DE calling using edgeR robustwas greater when DF were estimated as opposed to spe-cified by default (i.e. DF = 10), though the absolute mag-nitude of the difference was small (approximately onepercentage point). All methods appeared to control FPRin DE plasmodes below the nominal value (Table 4),though DESeq2 was more conservative than any of theedgeR methods, particularly for low-count transcripts.
Case study: comparison of bluestem subspeciesNext, we conducted illustrative DE analyses to explorethe transcriptomic basis for differences between BB andSB subspecies of bluestem prairie grass, with emphasison SB-only and BB-only transcripts, all of which werecharacterized by low levels of expression. Our datasetconsisted of 4 samples of big bluestem and 4 of sandbluestem, for which read counts on a total of 25,582transcripts were obtained. Differential expression ana-lyses between subspecies were conducted using DESeq2and edgeR robust. The specification of DF for edgeR ro-bust was based on quantile-adjusted conditionalmaximum likelihood estimates using edgeR classic [21],
whereby D̂F edgeR ¼ 3:02: Figure 2a and d contain MAplots of estimated logarithmic fold changes in thecomplete dataset (i.e. no filtering) using DESeq2 andedgeR robust, respectively. Overall, edgeR robust de-clared 12.4 % (3173 out of 25,582) of transcripts as DE(Table 5) whereas DESeq2 declared only 9.0 % (2290 outof 25,582) transcripts as DE (Table 6). This is consistentwith results from our plasmode study in the previoussection, whereby DESeq2 had a more conservative TypeI error performance relative to edgeR robust, coupledwith greater power of the latter. Differences in DE call-ing between statistical methods was explained, at leastpartially, by low-count transcripts, whereby 14.6 % (2135out of 14,588) of low-count transcripts were declaredDE by edgeR robust but only 9.1 % (1325 out of 14,588)were by DESeq2 (Tables 5 and 6). Instead, DE callingamongst high-count transcripts was 4.8 % (40 out of831) and 4.6 % (38 out of 831) for edgeR robust and
Table 3 Estimated false positive rates (FPR) on null plasmodes
Least square mean estimates (and corresponding SEM, shown in parentheses) of FPR for differential expression at FDR = 0.05 on all transcripts and on low-counttranscripts based on DESeq2, EdgeR classic and EdgeR robust, implemented on null plasmodes of RNA-seq data. a,b,c,d,e, indicate significant differences (Tukey-Kramer adjusted P < 0.05) within a row
Raithel et al. BMC Genomics (2016) 17:140 Page 5 of 16
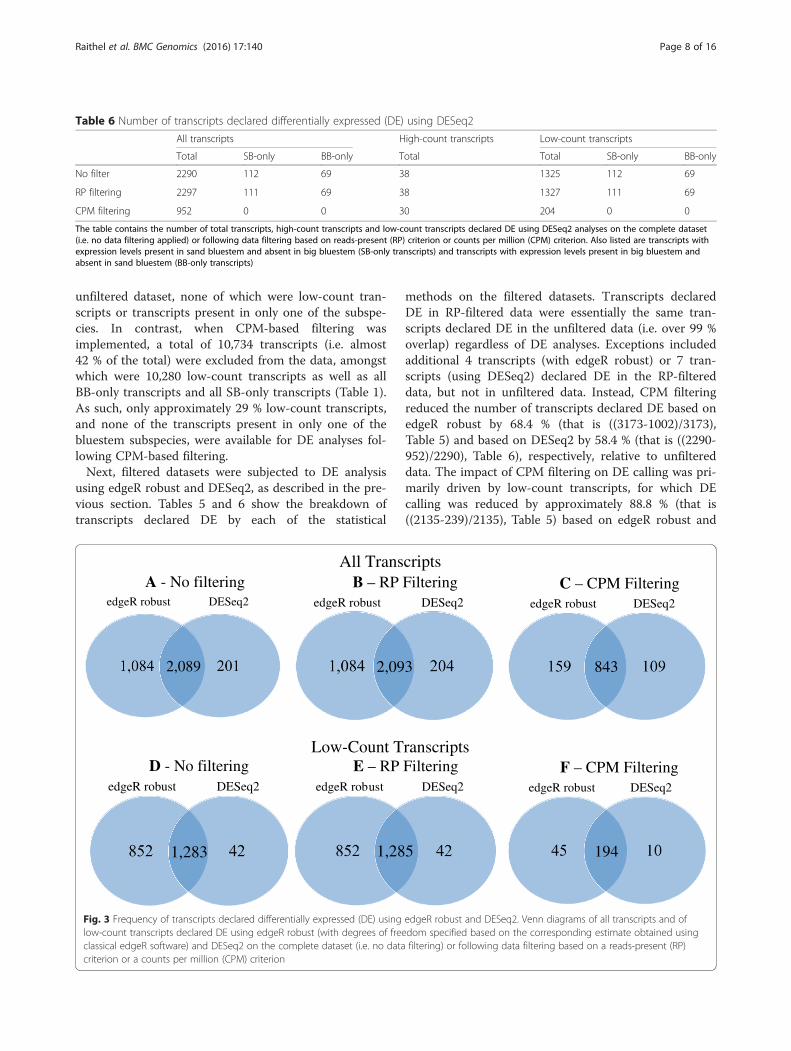
DESeq2, respectively (Tables 5 and 6). Overall, a consid-erable amount of overlap in DE calling was apparentbetween methods, as approximately 91.2 % of all tran-scripts declared DE by DESeq2 were also declared DEusing edgeR robust (Fig. 3a). For low-count transcriptsin the complete dataset, edgeR robust declared DE ap-proximately 96.8 % of those also declared DE by DESeq2(Fig. 3d).We further considered SB-only and BB-only tran-
scripts expressed in only one bluestem subspecies andabsent in the other. Recall that all such transcripts wereclassified as low-count transcripts due to low expressionlevels. EdgeR robust identified 80.4 % (i.e. (245 + 121)/
(323 + 132)) of such transcripts as DE (Table 5), whereasDESeq2 called DE only 39.8 % (i.e.(112 + 69)/(323 +132)) (Table 6). Yet, approximately 99 % of transcriptsexpressed in only one bluestem subspecies and declaredDE based on DESeq2 were also declared DE by edgeRrobust, again indicating a substantial amount of overlapbetween the methods.
Filtering strategiesWe further assessed inferential implications of two com-monly used filtering approaches on RNA-seq data. Sam-ples of BB and SB were subjected to filtering oftranscripts defined in terms of mapped reads present
Table 4 Performance metrics on differentially expressed (DE) plasmodes
Least square mean estimates (and corresponding SEM, shown in parentheses) for true positive rate (TPR; i.e. power), positive predictive value (PPV; i.e. precision),negative predictive value (NPV), accuracy and false positive rate (FPR) for differential expression at FDR = 0.05 on all transcripts and on low-count transcriptsyielded by DESeq2, EdgeR classic or EdgeR robust, implemented on DE plasmodes of RNA-seq data. a,b,c,d,e, indicate significant differences (Tukey-Krameradjusted P < 0.05) within a row
Raithel et al. BMC Genomics (2016) 17:140 Page 6 of 16
(RP) [8] and of read counts per million (CPM) [7]. Recallthat any specific data filtering approach determines thetranscriptomic basis to which DE analyses are later ap-plied, and thus, any DE results.Criteria for data filtering varies across strategies. Spe-
cifically, the RP filtering approach indicates removal of atranscript if the overall number of samples with mappedreads present for that transcript (i.e. samples with readcounts greater than zero) is smaller than the number of
samples per treatment group (i.e. 4 in this case) [8]. Inturn, CPM-based filtering indicates removal of a tran-script if a pre-selected number of samples have readCPM for that transcript that are smaller than a pre-selected threshold value [7], specified at 1 CPM for thisstudy. Table 1 shows a breakdown of transcripts avail-able for DE analyses after RP-based filtering and CPM-based filtering. Most notably, RP-based filtering excludedonly 129 transcripts (i.e. approximately 0.5 %) from the
0 5 10
-4-2
02
4A
0 5 10
-4-2
02
4
B
0 5 10
-4-2
02
4
C
0 5 10
-10
-50
510
D
0 5 10
-10
-50
510
E
0 5 10-10
-50
510
E
LF
C Log(Mean Expression)
Log(CPM)
No Filtering RP Filtering CPM Filtering
DE
Seq2
edgeRrobust
Fig. 2 MA-Plots for edgeR robust and DESeq2 with and without data filtering. Estimated fold-change in expression of RNA-seq transcripts for SB relative to
BB as a function of transcript abundance following differential expression analyses with DESeq2 or edgeR robust (DF = Classic D̂F=_edgeR) on data subjectedto no filtering (a, d) or to filtering with CPM (c, f) or RP (b, e) methods. For DESeq2, fold-changes are plotted over mean transcript expression on alog scale. For edgeR robust, fold-changes are plotted against counts per million on a log scale. Transcripts declared DE at FDR = 0.05 are colored in red
Table 5 Number of transcripts declared differentially expressed (DE) using edgeR robust
All transcripts High-count transcripts Low-count transcripts
Total SB-only BB-only Total Total SB-only BB-only
No filter 3173 248 126 40 2135 245 121
RP filtering 3177 248 126 40 2137 245 121
CPM filtering 1002 0 0 23 239 0 0
The table contains the number of total transcripts, high-count transcripts and low-count transcripts declared DE using edgeR robust (with degrees of freedom specifiedbased on the corresponding estimate obtained using classical edgeR software) analyses on the complete dataset (i.e. no data filtering applied) or following data filteringbased on reads-present (RP) criterion or counts per million (CPM) criterion. Also listed are transcripts with expression levels present in sand bluestem and absent in bigbluestem (SB-only transcripts) and transcripts with expression levels present in big bluestem and absent in sand bluestem (BB-only transcripts)
Raithel et al. BMC Genomics (2016) 17:140 Page 7 of 16
unfiltered dataset, none of which were low-count tran-scripts or transcripts present in only one of the subspe-cies. In contrast, when CPM-based filtering wasimplemented, a total of 10,734 transcripts (i.e. almost42 % of the total) were excluded from the data, amongstwhich were 10,280 low-count transcripts as well as allBB-only transcripts and all SB-only transcripts (Table 1).As such, only approximately 29 % low-count transcripts,and none of the transcripts present in only one of thebluestem subspecies, were available for DE analyses fol-lowing CPM-based filtering.Next, filtered datasets were subjected to DE analysis
using edgeR robust and DESeq2, as described in the pre-vious section. Tables 5 and 6 show the breakdown oftranscripts declared DE by each of the statistical
methods on the filtered datasets. Transcripts declaredDE in RP-filtered data were essentially the same tran-scripts declared DE in the unfiltered data (i.e. over 99 %overlap) regardless of DE analyses. Exceptions includedadditional 4 transcripts (with edgeR robust) or 7 tran-scripts (using DESeq2) declared DE in the RP-filtereddata, but not in unfiltered data. Instead, CPM filteringreduced the number of transcripts declared DE based onedgeR robust by 68.4 % (that is ((3173-1002)/3173),Table 5) and based on DESeq2 by 58.4 % (that is ((2290-952)/2290), Table 6), respectively, relative to unfiltereddata. The impact of CPM filtering on DE calling was pri-marily driven by low-count transcripts, for which DEcalling was reduced by approximately 88.8 % (that is((2135-239)/2135), Table 5) based on edgeR robust and
Table 6 Number of transcripts declared differentially expressed (DE) using DESeq2
All transcripts High-count transcripts Low-count transcripts
Total SB-only BB-only Total Total SB-only BB-only
No filter 2290 112 69 38 1325 112 69
RP filtering 2297 111 69 38 1327 111 69
CPM filtering 952 0 0 30 204 0 0
The table contains the number of total transcripts, high-count transcripts and low-count transcripts declared DE using DESeq2 analyses on the complete dataset(i.e. no data filtering applied) or following data filtering based on reads-present (RP) criterion or counts per million (CPM) criterion. Also listed are transcripts withexpression levels present in sand bluestem and absent in big bluestem (SB-only transcripts) and transcripts with expression levels present in big bluestem andabsent in sand bluestem (BB-only transcripts)
All Transcripts
Low-Count Transcripts
A - No filteringedgeR robust DESeq2
2,089
B – RP FilteringedgeR robust DESeq2
2,093
C – CPM FilteringedgeR robust DESeq2
843
D - No filteringedgeR robust DESeq2
1,283
E – RP FilteringedgeR robust DESeq2
1,285
F – CPM FilteringedgeR robust DESeq2
194
Fig. 3 Frequency of transcripts declared differentially expressed (DE) using edgeR robust and DESeq2. Venn diagrams of all transcripts and oflow-count transcripts declared DE using edgeR robust (with degrees of freedom specified based on the corresponding estimate obtained usingclassical edgeR software) and DESeq2 on the complete dataset (i.e. no data filtering) or following data filtering based on a reads-present (RP)criterion or a counts per million (CPM) criterion
Raithel et al. BMC Genomics (2016) 17:140 Page 8 of 16
by 84.6 % (that is ((1325-204)/1325), Table 6) based onDESeq2. Most notably, all 455 transcripts present in onlyone of the bluestem subspecies, that is BB-only and SB-only transcripts, were lost to DE inference as CPM-based filtering excluded them from the data prior to DEanalyses.Figure 2 shows MA-plots obtained from fitting DESeq2
or edgeR robust to RNA-seq data subjected to no filtering(2.A and 2.D), RP-based filtering (2.B and 2.E) or CPM-based filtering (2.C and 2.F) . Within each DE method, theoverall shape of the MA-plots on RP-filtered data resem-bled that of the unfiltered data. This is not surprising asRP filtering removed only a small proportion (approxi-mately 0.5 %) of transcripts from the dataset. In contrast,MA-plots on the CPM-filtered dataset showed a dras-tically modified pattern relative to unfiltered data,particularly on the left side of each plot, due to a dis-proportionate exclusion of low-count transcripts, whichwere also transcripts of more extreme fold-change esti-mates. Within each filtering strategy, the overlap in DEcalling by edgeR robust relative to DESeq2 ranged from88 to 91 % and from 95 to 97 % for all transcripts and forlow-count transcripts, respectively (Fig. 3b, c, e, f ).
Approximate tests for DE inference based on DESeq2The most recent release of the DESeq package, namelyDESeq2 [3], implemented a Wald test approach as thedefault strategy for DE testing on individual transcripts.This approach differs from that of previous versions ofDESeq, which instead specified by default a likelihoodratio test (LRT) [22]. The rationale behind moving to-wards a Wald test as the default approach seemed torely on its flexibility for testing individual coefficients orfunctions thereof, without the need to fit a reducedmodel [3]. Yet, one should recognize the approximatenature of both tests, which relies on large sample approxi-mations and assumes either an asymptotic chi-squaredistribution (LRT) or a normal distribution (Wald test)under the null hypothesis [23].Motivated by our interest in low-count transcripts, we
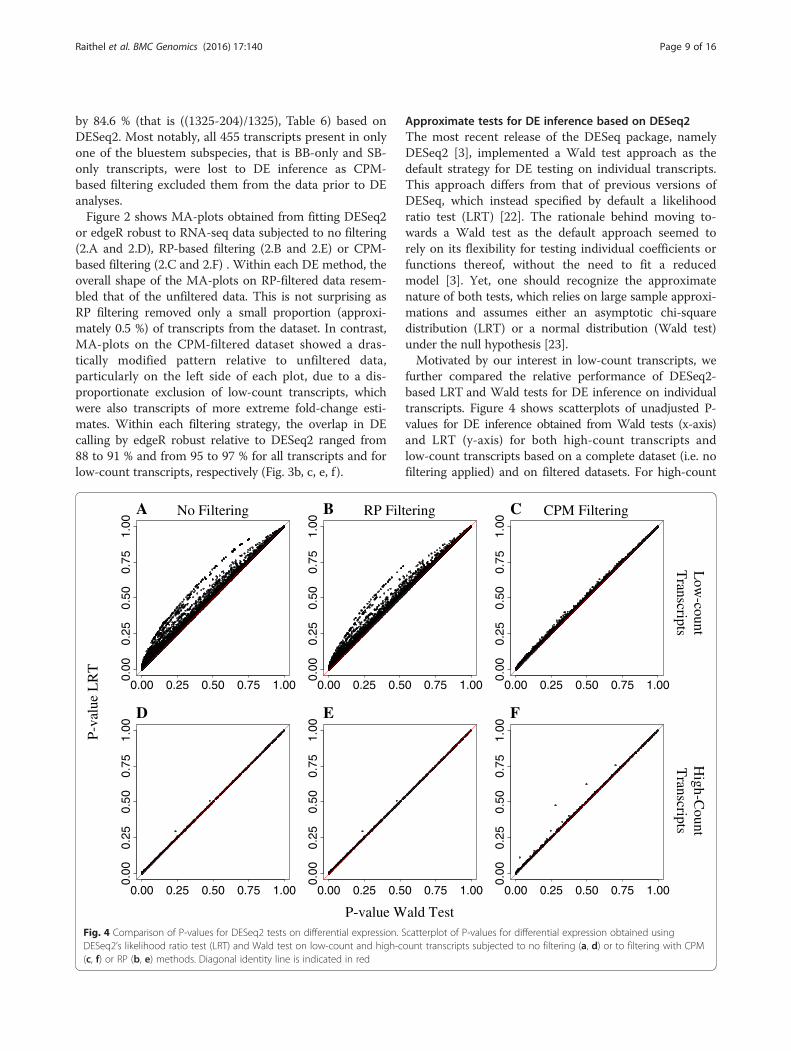
further compared the relative performance of DESeq2-based LRT and Wald tests for DE inference on individualtranscripts. Figure 4 shows scatterplots of unadjusted P-values for DE inference obtained from Wald tests (x-axis)and LRT (y-axis) for both high-count transcripts andlow-count transcripts based on a complete dataset (i.e. nofiltering applied) and on filtered datasets. For high-count
A
0.00 0.25 0.50 0.75 1.00
0.00
0.25
0.50
0.75
1.00
B
0.00 0.25 0.50 0.75 1.00
0.00
0.25
0.50
0.75
1.00
C
0.00 0.25 0.50 0.75 1.00
0.00
0.25
0.50
0.75
1.00
D
0.00 0.25 0.50 0.75 1.00
0.00
0.25
0.50
0.75
1.00
E
0.00 0.25 0.50 0.75 1.00
0.00
0.25
0.50
0.75
1.00
F
0.00 0.25 0.50 0.75 1.00
0.00
0.25
0.50
0.75
1.00
No Filtering RP Filtering CPM Filtering
P-va
lue
LR
T
P-value Wald Test
Low
-countT
ranscriptsH
igh-Count
Transcripts
Fig. 4 Comparison of P-values for DESeq2 tests on differential expression. Scatterplot of P-values for differential expression obtained usingDESeq2’s likelihood ratio test (LRT) and Wald test on low-count and high-count transcripts subjected to no filtering (a, d) or to filtering with CPM(c, f) or RP (b, e) methods. Diagonal identity line is indicated in red
Raithel et al. BMC Genomics (2016) 17:140 Page 9 of 16
transcripts, LRT and Wald tests showed considerable in-ferential agreement for DE calling regardless of data filter-ing, as indicated by most points falling along the identityline (Fig. 3d, e, f ). In contrast, for low-count transcripts,the Wald test had lower P-values for DE inference relativeto the LRT approach (Fig. 3a, b, c). For this application, itis unclear if the Wald test underestimated these P-valuesor if the LRT overestimated them. This discrepancy is par-ticularly concerning for transcripts with P-values of smallmagnitude and close to a pre-specified significance thresh-old given the qualitative differences in inference (i.e. atranscript is either called DE or not). This difference in in-ferential performance observed between Wald test-basedand LRT-based P-values for low-count transcripts wasparticularly noticeable in the complete dataset (i.e. no fil-tering applied) and on the RP-filtered data, which includedall low-count transcripts. Instead, P-values from Wald testand LRT were more closely aligned to each other onCPM-filtered data. This was expected as most low-counttranscripts had already been excluded from DE analysesdue to being removed during CPM filtering.
DiscussionIn this study, we used plasmodes generated from RNA-seq data to compare inferential performance of statisticalmethods for differential expression, with a special focuson low-count transcripts, as motivated by an applicationon bluestem prairie grasses. More specifically, we evalu-ated the inferential performance of the recently devel-oped statistical methods DESeq2, edgeR and edgeRrobust, the latter specified over a range of the DF param-eter. We also considered data filtering strategies that,while pervasively implemented in RNA-seq data pipelines,impose arbitrary criteria for data exclusion, the impact ofwhich on DE inference was shown to be substantial.This study is one of few to use a plasmode-based
approach to compare statistical methods on a specificRNA-seq dataset and more specifically, on a subset oftranscripts characterized by low expression levels [7]. Werecognize, though, that our null plasmode approach canbe sensitive to limited random partitioning of samples intogroups, especially if the number of samples available issmall, as is our case [19]. By design, though, plasmodesallow for evaluation of inferential performance while takinginto consideration the realistic conditions of a given dataapplication [19], amongst which one may consider the ac-tual structure of a real dataset and a limited sample size.Our results on inferential performance indicated ad-
equate control of Type I error within nominal levels usingeither DESeq2 or edgeR robust both for all transcripts andfor low-count transcripts. Still, false positive rates in-creased with greater degrees of freedom under edgeR ro-bust, indicating the need for careful consideration of how
this parameter is specified. In turn, edgeR robustshowed greater power than DESeq2, which is consist-ent with results from previous simulation studies [10]and is hereby shown to also apply to transcripts oflow expression levels. Interestingly, within specifica-tions of edgeR robust, there was no evidence for anychanges in power when DF were specified to be atdefault (i.e. DF = 10) or at a much smaller value esti-mated from the data (i.e. DF = [3.21, 3.30], thoughpower was significantly inflated with DF = 50. Yet, theobserved increase in power with increasing DF inedgeR robust was counterbalanced by an even greaterincrease in false positives, which in turn impaired in-ferential precision. Not unexpectedly, power for DEcalling of low-count transcripts was decreased relativeto that of all transcripts, regardless of method chosenfor DE inference. This is to be expected as low levelsof expression indicate little information available forinference on a given transcript, as shown by previous simu-lation studies [10]. Furthermore, DESeq2 showed the great-est precision and accuracy of all methods evaluated notonly for all transcripts, as already shown by other simula-tion studies [3], but especially for low-count transcripts.Our results from the plasmode-based approach to as-
sess inferential performance suggest that the specifica-tion of DF for edgeR robust can impact DE inference ofRNA-seq data, particularly that of low-count transcriptsand thus, should be considered carefully. Most relevantto our dataset, the default DF specification (i.e. DF = 10)was not optimal and led to a decrease in inferential pre-cision and accuracy relative to using an estimated DFvalue. The default value of the shrinkage parameter foredgeR robust (i.e. DF = 10) seems to be based on an as-sortment of simulation studies [9]. However, it is unclearwhether such an arbitrarily specified DF value is justifiedfor any particular real RNA-seq dataset, for which theamount of dispersion, the correlation structure betweentranscripts and the sample size may not be aligned withthose of simulated conditions [7, 8]. Our results indicatethat the specification of DF on edgeR robust should beinformed carefully. This is consistent with warningsraised in other areas of genomic applications about thearbitrary specification of low-level hyperparameters inhierarchical models [24, 25]. It would be recommendedfor DF to be estimated from the data whenever possible.Alternatively, if complexity of the experimental designprevented proper estimation of the DF parameter, a re-searcher might consider relying more heavily on infer-ence from DESeq2, for which no arbitrary specificationof DF is needed. This is consistent with the relativelystandard recommendation that DE inference be basedon multiple analysis methods [1, 8]. For instance, re-searchers may consider declaring DE only those tran-scripts that show low FDR-adjusted P-values by both
Raithel et al. BMC Genomics (2016) 17:140 Page 10 of 16
DESeq2 and edgeR robust with properly specified degreesof freedom. This recommendation is further supported bythe high level of overlap in DE calling observed betweenthe methods, when properly specified.Data filtering is a common processing step in the RNA-
seq data management pipeline [4], though its implicationshave not been thoroughly explored. Initial implementa-tions of data filtering for RNA-seq counts were intendedto reduce the impact of multiple testing adjustment onpower for DE detection [4, 6]. Yet, one should note thatfiltering strategies apply rather arbitrary data exclusioncriteria with different, potentially disproportionate, conse-quences for inference on specific transcripts. For example,our results indicate only a very minor difference in DEcalling following RP-based filtering compared to no filter-ing, with 99 % overlap between the two, regardless of DEmethod. This suggests that both edgeR robust andDESeq2 retained similar transcripts declared as DE re-gardless of whether the data has been RP-filtered or not.This result thus questions the very need to impose arbi-trary filtering rules on the data given the powerful statis-tical methods available. In turn, more extreme filteringrules such as those based on a CPM criterion caused adrastic reduction in the transcriptomic basis that wasmade available for DE analyses. In our case, CPM filteringexcluded almost 42 % of the original transcripts, most ofwhich were low-count transcripts. Filtering by CPM cri-terion was originally designed to remove transcriptsconsidered challenging for inference due to shortage ofavailable information [4]. However, we showed that CPM-based filtering also excluded from the data all transcriptsexpressed in only one of the bluestem subspecies and ab-sent in the other (i.e. SS-only and BB-only transcripts),which were of particular interest to researchers in the mo-tivating data application. Filtering out these transcripts ex-cludes them from any follow-up DE consideration, whichmay in turn impair understanding of the transcriptomicbasis for phenotypic differences between bluestem subspe-cies and misinform further exploration of candidate genes.Moreover, CPM-based filtering also reduced both the totalnumber and the proportion of transcripts called DE rela-tive to no filtering, whereas little gain was obtained inuniquely identified DE-declared transcripts (i.e. approxi-mately 0.3 % and 0.1 % gain with DESeq2 and edgeR ro-bust, respectively). Taken together, our results indicatethat the implications of data filtering for DE inferenceshould not be taken lightly, as the effect seems to depend,and disproportionally so, on the specifics of the data ex-clusion criterion as well as on the types of transcript ofinterest. On a more general note, data exclusion based onCPM filtering may have even more serious implicationsfor inference on transcription factors, which have low ex-pression levels despite their key role as master switchesthat regulate gene expression [5].
Overall, the rationale for arbitrary filtering RNA-seqdata based on either a RP criterion or a CPM criterionseems poorly justified, either biologically or otherwise,particularly given the availability of powerful state-of-the-art statistical methodology developed to deal withthe associated challenges in RNA-seq data. Instead, re-searchers may consider using the complete unfilteredRNA-seq data for DE analyses, ensuring use of modernstatistical methods to properly borrow informationacross transcripts and moderate (i.e. shrink or weigh)DE inference based on expression levels. In particular,DESeq2 and edgeR robust have shown promising infer-ential performance in handling low-count transcriptswith minimal effect on the DE analysis for the remainingtranscripts. Further, forgoing the use of data filtering atarbitrary thresholds in favor of more elegant approachesto deal with the inherent challenges of RNA-seq datamay be particularly relevant for research questions fo-cused on biologically relevant transcripts characterizedby low expression levels, such as transcription factors.Finally, it is of concern that differential expression as-
sessments for low-count transcripts based on the Waldtest implemented by default in DESeq2 yielded more lib-eral results relative to those based on a likelihood ratiotest. Both tests assume that certain regularity conditionshold, though such conditions are rarely verified in prac-tice [23]. It is further concerning that the performanceof these approximate tests is known to deteriorate rap-idly in situations of limited information, and apparentlymore so for Wald tests [26]. Both tests implemented byDESeq2 constitute approximations that may requirecareful attention and detailed consideration of theassumptions made on a case-by-case basis, in order toensure sound inference and prevent inflation of Type Ierror.
ConclusionsWe implemented a recently adapted plasmode-based ap-proach to compare inferential performance of modernstatistical methods, namely DESeq2 and edgeR robust,on RNA-seq data. Motivated by interest on a transcrip-tomic comparison of bluestem grass species, we pay spe-cial attention to transcripts of low expression levels,defined here as low-count transcripts. We emphasizethat implications of these results may be relevant toother biological applications that involve transcripts ofhigh biological importance but low expression levels,such as transcription factors. Both DESeq2 and edgeRrobust seemed to properly control family-wise type 1error on all transcripts as well as on low-count tran-scripts. For low-count transcripts, edgeR robust showedgreater power whereas DESeq2 showed greater precisionand accuracy. Overall, both methods showed promisinginferential performance on low-count transcripts and
Raithel et al. BMC Genomics (2016) 17:140 Page 11 of 16
yielded a substantial amount of overlap in DE calling,thus supporting their combined use for fine-tuned DEinference. Still, a note of caution is in order regardingthe approximate nature of DE tests on individual tran-scripts, particularly low-count ones.Regarding edgeR robust, the specification of a degree of
freedom parameter was found to be non-trivial. This is tobe expected as degrees of freedom determine the amountof shrinkage and borrowing of information across tran-scripts, thereby impacting precision and accuracy of DEinference. Our results raise legitimate questions about theuse of a default value for the degree of freedom hyperpara-meter, recognizing that a default value may not be appro-priate for all datasets, as it was certainly not optimal inour case study. The edgeR robust degrees of freedom par-ameter should thus be given careful consideration in anydata application and, whenever possible, it should be esti-mated from the data.Finally, our results support that filtering of RNA-seq
data can have serious implications for inference as mostlylow-count transcripts are removed from the data andexcluded from DE analyses. Standard RNA-seq data man-agement pipelines that call for filtering transcripts out atarbitrary thresholds should be reconsidered. Instead,researchers may implement modern state-of-the-art statis-tical methodologies specifically developed to deal directlywith the inherent challenges of RNA-seq data, includingtranscripts of low expression levels.
MethodsData collectionRNA was extracted from leaf tissue of 4 individual plantsof each of two phenotypically divergent bluestem sub-species, namely big bluestem (Andropogon gerardii, Sa-line population) and sand bluestem (A. gerardii ssp.Hallii, Arapahoe population). Phenotypic divergence wasestablished using a species specific, established hybridindex [27]. All plants were grown in common soil undergreenhouse conditions. Samples were sequenced usingRoche 454 pyrosequencer and Illumina HiSeq 2000 se-quencer sequencers. To ensure deeper coverage, onesand bluestem plant (Araphaoe population) and one bigbluestem plant (Saline population) were used for analysison the 454 sequencer. For the 454 run, we used a fullplate divided equally between the sand bluestem and bigbluestem subspecies. This run yielded 616,333 high qual-ity reads for sand bluestem and 534,633 for big bluestem(total 1,150,966; Additional file 1: Table S1). For the Ilu-mina HiSeq run, we used 4 biological replicates of thesand bluestem Arapahoe population and 4 biologicalreplicates of the big bluestem Saline population; therewere a total of 203,506,904 quality reads for sand blue-stem and 172,519,460 high quality reads for big bluestem(total combined 376,026,364; Additional file 1: Table S1).
Reads were mapped to a de-novo reference transcrip-tome assembly (described next) [28] and number ofaligned reads were counted on putative transcripts.
Transcriptome assemblyTagcleaner v. 0.12 [29] was used to remove 454 tags.Illumina headers were converted to pre-CASAVA 1.8version headers ending in “/1” or “/2” so that pairs couldbe maintained after cleaning. All reads were stringentlycleaned to remove tags, ambiguous bases, duplicates,polyA/T/N tails, and low quality bases using Prinseqv.0.20.3 [30]. For the assembly of 454 reads, the miraESTv3.4.1.1 assembler [31] was used. Illumina reads wereassembled with multiple odd values of k (23-61) usingVelvet v1.2.08 and Oases v0.2.08 [32]. The single-k-merIllumina assemblies were merged with a k-mer value of27. The resultant Illumina and 454 assemblies weremerged with miraEST v3.4.11 [31] to produce the finalmerged transcriptome. Additional file 1: Figure S1 de-picts the workflow for the transcriptome pipeline.Assemblies were evaluated on the basis of N25, N50,
N75, cumulative length of contigs, and number of con-tigs. BLASTX, NCBI BLAST+ v2.2.28 [33], was run tosearch the Andropogon contigs for putative homologs toS. bicolor Phytozome v9.0 proteins and the NCBI nr pro-tein database. The custom scripts Blastx.pl v 1.0 andFindFailed.pl were used to run BLASTX against theNCBI nr protein database. Significant BLASTX hits (e-value < 1e-10) were retained. Ortholog Hit Ratio (OHR)[34] was calculated for the assemblies. OHR is the lengthof the BLASTX hit region (the putative coding dividedby three) divided by the length of the protein in the S.bicolor database. Therefore, OHR is an estimate of thepercent of the full length protein sequence representedin the assembly. An OHR of 1 indicates a potential fulllength transcript. In an effort to reduce the influence ofredundant or fragmented contigs, the script Unique-Blast.pl [34] was used to identify the longest contig witha significant hit to any single protein in the S. bicolordatabase. Only these contigs were used to calculateOHR.Results of the transcriptome assembly follow. Cumula-
tive length of sequences (Additional file 1: Figure S2), N-values (Additional file 1: Figure S3), and OHR (Additionalfile 1: Figure S4) values suggest that the merged assemblyis more complete than the single k-mer assemblies andthe 454 assembly. Additionally, N-values (Additionalfile 1: Figure S3) and OHR (Additional file 1: Figure S4)compare favorably to other similar de novo transcriptomeassemblies. All N-values (N25, N50 and N75) are higherfor single-k-mer Illumina assemblies (N50 > 1.3 kb for allsingle-k-mer Illumina assemblies, then for the Mira as-sembly of 454 reads (N50 ~ 0.8 kb) as shown in Additionalfile 1: Figure S3. All N-values were highest for the final
Raithel et al. BMC Genomics (2016) 17:140 Page 12 of 16
merged assemblies indicating that the merged assemblymay be more contiguous than the Illumina or 454 assem-blies individually (Additional file 1: Figure S3). The finalN50 of 3.2 kb is higher than recent de novo grass tran-scriptomes (wheat 1.4 kb [35], Panicum hallii 1.3 kb [36],Ma Bamboo 1.1 kb [37] , Miscanthus 0.7 kb [38]. High N-values alone may not indicate accurate assembly. How-ever, OHR was also found to improve for the merged as-sembly. In the merged assembly ~56 % of the contigs witha BLASTX hit had an OHR of 0.5 or greater and ~74 %had an OHR of 0.8 or greater. This was a larger percent-age of BLASTX hits than any of the single-k-mer Illuminaassembly indicating that the contigs in the merged assem-bly seemed to be more complete in addition to havinghigher N-values than either the Illumina or the 454 as-semblies considered individually. These OHR values arehigher than other recent results (62 % ≥0.5 and 35 % ≥0.8for Daphnia pulex [34], 64 % ≥0.5 and 35 % ≥0.9 for saltmarsh beetle [39].The cumulative assembly length and number of con-
tigs (Additional file 1: Figure S2) when compared be-tween all assemblies also suggest that the final assemblyis of higher quality than the initial Illumina or 454 as-semblies alone. For single-k-mer Illumina assemblies,intermediate k-mer values produced the longest assem-blies while the total number of contigs decreased as the k-mer value increased. For the MIRA assembly of 454 readsthe cumulative length of the assembly was ~20 Mb greaterthan the longest single-k-mer Illumina assemblies thoughthe number of contigs was ~10 times lower than the sin-gle-k-mer Illumina assemblies. Overall, the number ofcontigs was high for both the single-k-mer Illumina as-semblies (391,875 to 551,163 contigs) and the MIRA as-sembly of 454 reads (53,174). The final merged assemblyhad the smallest number of sequences (26,373) and theshortest contiguous length (~65 Mb). Taken with the in-creased N-values (Additional file 1: Figure S3) and OHRmetrics (Additional file 1: Figure S4), the smaller lengthand number of contigs of the final merged transcriptome(Additional file 1: Figure S2) may indicate that redundantand fragmented transcripts from the initial assemblieswere more completely assembled in the final mergedtranscriptome.Cleaned Illumina reads were mapped to the final
merged assembly using Bowtie2 v.2.1.0 [40] in the bestmapping mode. The final transcriptome used for analysiscontained transcripts with greater than or equal to 400base pairs.
RNA-seq dataThe dataset used for analysis consisted of a total of25,582 transcripts. Data are available as additional sup-porting files to this article.
We first defined SB-only transcripts as transcripts withexpression levels present in sand bluestem and absent(i.e. read counts = 0 for all samples) in big bluestem. Inturn, BB-only transcripts were defined as transcriptswith expression levels present in big bluestem and ab-sent (i.e. read counts = 0 for all samples) in sandbluestem.For descriptive purposes, we then organized the data
based on relative abundance of transcripts. In brief, tran-scripts were ranked from largest to smallest number oftotal mapped reads across all samples. We adapted theapproach proposed by Bullard [17] and defined high-count transcripts as the top 3 % transcripts with thehighest relative abundance, which accounted for 60 % oftotal read counts (Fig. 1). We also defined low-counttranscripts as transcripts within the 60th percentile ofleast relative abundance, which accounted for approxi-mately 3 % of total read counts (Fig. 1). So defined,high-count transcripts and low-count transcripts weretranscripts with at least 12,893 read counts or at most462 read counts, respectively, across all samples in thedataset. We note that the proposed definitions of high-count and low-count transcripts are specific to our mo-tivating problem and the corresponding structure of ourdata. Table 1 shows the breakdown of transcripts intohigh-count and low-count categories in the completedataset (i.e. no filtering applied) and in the filtered data(see later).
Construction of plasmode datasetsAll plasmodes were generated using data from big blue-stem samples only, given its benchmark status as awidely distributed dominant prairie grass. Null plasmodedatasets were constructed as previously described [7].Briefly, for each null plasmode, samples of big bluestemwere randomly partitioned into two arbitrary groups. Atotal of 3 unique null plasmodes were created, reflectingthe 3 possible unique combinations of 4 samples in groupsof 2. So defined, no differential expression is to be ex-pected between groups other than sample-to-sample vari-ation. Thus, null plasmodes allow for evaluation ofanalysis models under the null hypothesis [7].A total of 5 DE plasmodes were generated from each null
plasmode for a total of 15 DE plasmodes, as previously de-scribed [7]. The proportion of differentially expressed tran-scripts in each DE plasmode was set at π = 0.2. We usededgeR classic [21] to obtain a list of estimated effect sizesfor transcripts declared DE at FDR = 0.05. Estimates of ef-fect sizes were sampled without replacement and added tolog-transformed counts of randomly selected transcriptson all samples of one of the arbitrary groups in the nullplasmode dataset, then back transformed to the countscale. As such, DE plasmodes combine random reshufflingof data with known effects estimated from real data and
Raithel et al. BMC Genomics (2016) 17:140 Page 13 of 16
added to known transcripts. Thus, DE plasmodes allow forevaluation of analysis models in identifying truly DE as wellas non-DE transcripts [7].
Differential expression analysesDESeq2The R package DESeq2 [3] for which the read countKij for transcript i in sample j is described with ageneralized linear model of the Negative Binomial familywith logarithmic link, such that Kij~NB(mean = μij,dispersion = αi ) with mean μij = sjqij and link functionlog (qij) = xjβi, where sj is the normalized library sizefor sample j as previously defined [22]. In turn, αi isthe variability between samples for transcript i, xj containsthe elements of the known design matrix for sample j, andβi describes the corresponding coefficient for transcript i.Estimation of the dispersion parameter is conducted in 3steps [3]. First, gene-wise dispersion estimates are ob-tained using maximization of the Cox-Reid adjusted con-ditional likelihood of the dispersion. Then, a dispersiontrend is estimated using a Gamma-family generalized lin-ear model regression. Last, a maximum a-posteriori dis-persion estimate is obtained by shrinking the gene-wisedispersion estimates toward the overall dispersion trendusing an empirical Bayes approach that enables borrowingof information across transcripts. DESeq2 further incorpo-rates empirical Bayes shrinkage of logarithmic foldchanges, thus enabling further borrowing of informationand stable estimation for gene expression fold changes tocount data, particularly for low-count genes [3]. More spe-cifically, maximum-likelihood estimates of logarithmicfold changes are shrunk towards a zero-centered normalprior distribution to yield the final maximum a-posterioriestimates. The amount of shrinkage is inversely propor-tional to the amount of information an experiment pro-vides for a given log fold change coefficient, so thattranscripts with low estimated mean values μij and highdispersion αi in small datasets are pulled more strongly to-ward zero. Default DE testing on the shrunken LFCs isbased on a Wald test, whereas a LRT alternative is alsoavailable [3].
EdgeR robustR package edgeR robust [10] for which the read countYij for transcript i in sample j is described with a gener-alized linear model of the Negative Binomial family withlogarithmic link, such that Yij ~NB(mean = μij, disper-sion = ϕi) with link function log (μij) = Xβi + log (Nj),where X is the design matrix containing the covariates,βi is a vector of regression parameters, Nj is the librarysize for sample j, and ϕi is the square of the biologicalcoefficient of variation for transcript i. Dispersion parame-ters are estimated as follows. First, initial gene-wise disper-sion is estimated using adjusted penalized likelihood.
These estimates are then moderated by shrinkage towardsa common dispersion estimate obtained by maximizing acommon likelihood function. Shrinkage is determined bya prior degree of freedom parameter afforded to theshared likelihood and specified arbitrarily by the re-searcher [4]. Unless explicitly specified, the default valuefor the prior degrees of freedom is equal to 10 [41]. Inturn, regression parameters βi are estimated using max-imum likelihood that incorporates working weights at-tached to each observation. Weights are attached to eachobservation so observations that deviate strongly frommodel fit are given a lower weight. Observations weightsare defined as functions of a Pearson residual [10] that areiteratively updated during estimation. The dispersion esti-mation machinery also receives the same observationweights, so that the influence of outliers is dampened onboth regression and dispersion estimates. Testing for DEis conducted using a LRT-based approach.
Specification of the shrinkage parameter for edgeR robustAs previously indicated, edgeR robust uses DF = 10 as adefault to specify the amount of shrinkage applied todispersion parameters [9]. While the default value fordegrees of freedom is provided in the edgeR robustpackage as a “rule of thumb”, there is little guidanceavailable to accurately inform specification of the DFparameter in a given dataset. Greater values of DF indicategreater shrinkage of tagwise dispersion estimates towardsan overall dispersion parameter common to all transcripts.We compared the performance of edgeR robust at
varying DF specifications. In particular, we consideredDF = 4, 10 and 50, to indicate a range of shrinkagearound the default specification. Further, we consideredusing the classical edgeR software [21] to estimate DFusing a quantile-adjusted conditional maximum likeli-hood [21]. Estimation of DF is facilitated by the simpledesign structure of our bluestem dataset, in which only2 groups are being compared (i.e. BB vs SB) and noblocking or nesting design structure is apparent. Werefer to this scenario as a DF = classic DF= D̂F _edgeRspecification under edgeR robust.
Multiple testing adjustmentsFollowing DE analyses based on either DESeq2 or EdgeRrobust, transcripts were called DE based on a FDR = 0.05using the Benjamini-Hochberg procedure [42].
Performance metricsTable 2 defines performance metrics used to compareinferential performance of statistical methods. More spe-cifically, we defined FPR as the number of false positivesover the sum of false positives and true negatives. Powerwas defined as the number of true positives over the
Raithel et al. BMC Genomics (2016) 17:140 Page 14 of 16
sum of true positives and false negatives. In turn, precisionwas the number of true positives over the sum of true posi-tives and false positives, and it is also referred to as positivepredictive value. Further, NPV was the number of true neg-atives over the sum of the true negatives and false negatives.Finally, accuracy was defined as the sum of true positivesand true negatives over the total number of transcripts.Performance metrics were computed on each plasmode
dataset fitted with each statistical method for DE analyses.Each metric was then fitted with a general linear mixedmodel to compare methods for DE analysis accounting forplasmode dataset as a random blocking factor. Modelswere fitted using the GLIMMIX procedure of SAS (Ver-sion 9.3, SAS Institute Inc., Cary, NC). Residual assump-tions were evaluated using studentized residuals. Pairwisecomparisons in performance metrics between analysesmethods were conducted using a Tukey-Kramer adjust-ment to prevent the inflation of type 1 error rate.
Filtering strategiesFiltering criteria are often applied to RNA-set datasetsprior to DE analyses. A relatively common filtering cri-terion removes transcripts from a dataset if the totalnumber of samples with mapped reads present for thattranscript is smaller than the number of samples pertreatment [8]. For our data, RP filtering removes a tran-script if fewer than 4 samples had mapped reads presentacross all 8 samples. Another common filtering alterna-tive strategy removes transcripts if two or more sampleshave CPM smaller than an arbitrary number [7]. For ourdata CPM-based filtering removed a transcript if two ormore samples had less than 1 CPM for that transcript.This was analogous to removing any transcripts withfewer than 80 mapped reads across all samples. Thenumber of transcripts remaining in the dataset after ap-plying RP filtering or CPM filtering is shown in Table 1,along with the total number of transcripts in the unfil-tered dataset, whereby all transcripts with at least oneread count in any of the samples is included.
Additional file
Additional file 1: Table S1. Number of high quality reads by ecotypeand population for 454 and HiSeq platforms. Figure S1. Workflowdiagram of transcriptome assembly pipeline. Figure S2. Cumulativelength of sequences and number of sequences for various k-mer values,454 data, and the combined 454 and HiSeq data. Figure S3. N values forvarious k-mers and MIRA 454 and MIRA clustered assemblies. Figure S4.Ortholog hit ratio for final MIRA clustered assembly. OHR is the length ofthe BLASTX hit region divided by the length of the protein, in our caseusing the S. bicolor database. OHR is an estimate of the percent of thefull length protein sequence represented in the assembly. An OHR of 1indicates a potential full length transcript. (DOCX 230 kb)
AbbreviationsBB: Big bluestem; CPM: Counts per million; DE: Differential expression;DF: Degrees of freedom; FDR: False discovery rate; FPR: False positive rate;
Competing interestsThe authors declare that they have no competing interests.
Authors’ contributionsAll authors contributed to the manuscript. NMB, LJ and SR conceived thestudy. NMB and SR designed the study and performed all statistical analyses.Sequencing of samples and alignment to the reference transcriptome wasconducted by SB, MG, NH and JS. The manuscript was prepared by NB, SRand LJ, with input from SB, MG, NH and JS. All authors read and approvedthe final manuscript.
AcknowledgmentsThis project was supported by the United States Department of Agriculture,Abiotic Stress Program (2008-35001-04545). We acknowledge assistance andexpertise from the Kansas State University Bioinformatics Center. Publicationof this article was funded in part by the Kansas State University Open AccessPublishing Fund.
Author details1Department of Statistics, Kansas State University, Manhattan, KS, USA.2Division of Biology, Kansas State University, Manhattan, KS, USA.
Received: 21 July 2015 Accepted: 8 February 2016
References1. Kvam VM, Lu P, Si YQ. A comparison of statistical methods for detecting
differentially expressed genes from RNA-Seq DATA. Am J Bot.2012;99(2):248–56.
2. Dillies MA, Rau A, Aubert J, Hennequet-Antier C, Jeanmougin M, Servant N,et al. A comprehensive evaluation of normalization methods for Illuminahigh-throughput RNA sequencing data analysis. Brief Bioinform.2013;14(6):671–83.
3. Love MI, Huber W, Anders S. Moderated estimation of fold change anddispersion for RNA-seq data with DESeq2. Genome Biol. 2014;15(12):550.
4. Anders S, McCarthy DJ, Chen YS, Okoniewski M, Smyth GK, Huber W, et al.Count-based differential expression analysis of RNA sequencing data usingR and Bioconductor. Nat Protoc. 2013;8(9):1765–86.
6. Bourgon R, Gentleman R, Huber W. Independent filtering increasesdetection power for high-throughput experiments. Proc Natl Acad SciU S A. 2010;107(21):9546–51.
7. Reeb PD, Steibel JP. Evaluating statistical analysis models for RNAsequencing experiments. Frontiers in Genetics. 2013;4:1–9.
8. Soneson C, Delorenzi M. A comparison of methods for differentialexpression analysis of RNA-seq data. BMC Bioinformatics. 2013;14:91.
10. Zhou XB, Lindsay H, Robinson MD. Robustly detecting differentialexpression in RNA sequencing data using observation weights. NucleicAcids Res. 2014;42(11):e91.
11. Owsley M. Plant fact sheet for Big Bluestem (Andropogon gerardii Vitman).USDA-Natural Resources Conservation Service, Jimmy Carter PMC Americus,Georgia 31719. 2011. http://plants.usda.gov/factsheet/pdf/fs_ange.pdf.
12. Knapp AK, Carter GA. Variability in leaf optical properties among 26 speciesfrom a broad range of habitats. Am J Bot. 1998;85(7):940–6.
13. Bleed AS, Flowerday CA. An atlas of the Sand Hills. 3rd ed. Lincoln:University of Nebraska-Lincoln; 1998.
14. Barnes PW. Variation in the big bluestem (Andropogon-Gerardii)-sandbluestem (Andropogon-Hallii) complex along a local dune meadowgradient in the Nebraska Sandhills. Am J Bot. 1986;73(2):172–84.
15. Shelton J. Epicuticular wax chemistry, morphology, and physiology in sandbluestem, andropogon gerardii ssp. hallii, and big bluestem, andropogongerardii spp gerardii. Manhattan: Kansas State University; 2012.
Raithel et al. BMC Genomics (2016) 17:140 Page 15 of 16
16. IPCC. Summary for Policymakers. In: Climate Change 2013: The PhysicalScience Basis. Contribution of Working Group I to the Fifth AssessmentReport of the Intergovernmental Panel on Climate Change. 2013. p. 4–5.
17. Bullard JH, Purdom E, Hansen KD, Dudoit S. Evaluation of statistical methodsfor normalization and differential expression in mRNA-Seq experiments.BMC Bioinformatics. 2010;11:94.
18. Mehta T, Tanik M, Allison DB. Towards sound epistemological foundationsof statistical methods for high-dimensional biology. Nat Genet.2004;36(9):943–7.
19. Gadbury GL, Xiang QF, Yang L, Barnes S, Page GP, Allison DB. Evaluatingstatistical methods using plasmode data sets in the age of massivepublic databases: an illustration using false discovery rates. Plos Genet.2008;4(6):e1000098.
20. Steibel JP, Poletto R, Coussens PM, Rosa GJM. A powerful and flexible linearmixed model framework for the analysis of relative quantification RT-PCRdata. Genomics. 2009;94(2):146–52.
21. Robinson MD, Smyth GK. Small-sample estimation of negative binomialdispersion, with applications to SAGE data. Biostatistics. 2008;9(2):321–32.
22. Anders S, Huber W. Differential expression analysis for sequence count data.Genome Biol. 2010;11(10):R106.
23. Hogg R, McKean J, Craig A. Introduction to Mathematical Statistics. Essex,England: Pearsons; 2013.
24. Gianola D. Priors in whole-genome regression: The Bayesian alphabetreturns. Genetics. 2013;194(3):573–96.
25. Lehermeier C, Wimmer V, Albrecht T, Auinger HJ, Gianola D, Schmid VJ, etal. Sensitivity to prior specification in Bayesian genome-based predictionmodels. Stat Appl Genet Mol. 2013;12(3):375–91.
26. Agresti A. An Introduction to Categorical Data Analysis, 2nd edn. Hoboken,New Jersey: John Wiley & Sons; 2007.
27. Barnes P: Divergence and adaptation in adjacent plant populations: Studieson the ecology and physiology of the big bluestem (Andropogon gerardiivitman) - sand bluestem (Andropogon hallii hack.) complex in Nebraska.PhD dissertation. University of Nebraska - Lincoln; 1984. http://digitalcommons.unl.edu/dissertations/AAI8423759/.
28. Johnson L, Shelton J, Bello NM, Raithel S, Galliart M, Brown SJ, Herndon N,Welti R, Nikolau B, Samarakoon T, Song Z, Jeannotte R. Divergentepicuticular wax and transcriptome of edaphically differentiatedAndropogon grasses in the US Midwest prairies. Abstract. XXIII InternationalPlant & Animal Genome Conference. San Diego, California. January 10-14,2015. https://pag.confex.com/pag/xxiii/webprogram/Paper16889.html.
29. Schmieder R, Lim YW, Rohwer F, Edwards R. TagCleaner: Identification andremoval of tag sequences from genomic and metagenomic datasets. BMCBioinformatics. 2010;11:341.
30. Schmieder R, Edwards R. Quality control and preprocessing ofmetagenomic datasets. Bioinformatics. 2011;27(6):863–4.
31. Chevreux B, Pfisterer T, Drescher B, Driesel AJ, Muller WEG, Wetter T, et al.Using the miraEST assembler for reliable and automated mRNAtranscript assembly and SNP detection in sequenced ESTs. Genome Res.2004;14(6):1147–59.
32. Schulz MH, Zerbino DR, Vingron M, Birney E. Oases: robust de novo RNA-seq assembly across the dynamic range of expression levels. Bioinformatics.2012;28(8):1086–92.
33. Altschul SF, Gish W, Miller W, Myers EW, Lipman DJ. Basic local alignmentsearch tool. J Mol Biol. 1990;215(3):403–10.
34. Zeng V, Villanueva KE, Ewen-Campen BS, Alwes F, Browne WE, Extavour CG.De novo assembly and characterization of a maternal and developmentaltranscriptome for the emerging model crustacean Parhyale hawaiensis. BMCGenomics. 2011;12:581.
35. Duan JL, Xia C, Zhao GY, Jia JZ, Kong XY. Optimizing de novo commonwheat transcriptome assembly using short-read RNA-Seq data. BMCGenomics. 2012;13:392.
36. Meyer E, Logan TL, Juenger TE. Transcriptome analysis and gene expressionatlas for Panicum hallii var. filipes, a diploid model for biofuel research. PlantJ. 2012;70(5):879–90.
37. Liu MY, Qiao GR, Jiang J, Yang HQ, Xie LH, Xie JZ, et al. Transcriptomesequencing and De Novo analysis for Ma Bamboo (Dendrocalamus latiflorusMunro) using the Illumina platform. Plos One. 2012;7(10):e46766.
38. Chouvarine P, Cooksey AM, McCarthy FM, Ray DA, Baldwin BS, Burgess SC,et al. Transcriptome-based differentiation of closely-related Miscanthus lines.Plos One. 2012;7(1):168–75.
39. Van Belleghem SM, Roelofs D, Van Houdt J, Hendrickx F. De novoTranscriptome assembly and SNP Discovery in the Wing PolymorphicSalt Marsh Beetle Pogonus chalceus (Coleoptera, Carabidae). Plos One.2012;7(8):e42605.
40. Langmead B, Salzberg SL. Fast gapped-read alignment with Bowtie 2. NatMethods. 2012;9(4):357–U354.
41. Chen Y, McCarthy D, Robinson M, Smyth GK. edgeR: Differential expressionanalysis of digital gene expression data - User’s Guide. 2014.
42. Benjamini Y, Hochberg Y. Controlling the false discovery rate - a practicaland powerful approach to multiple testing. J Roy Stat Soc B Met.1995;57(1):289–300.
• We accept pre-submission inquiries
• Our selector tool helps you to find the most relevant journal
• We provide round the clock customer support
• Convenient online submission
• Thorough peer review
• Inclusion in PubMed and all major indexing services
• Maximum visibility for your research
Submit your manuscript atwww.biomedcentral.com/submit
Submit your next manuscript to BioMed Central and we will help you at every step:
Raithel et al. BMC Genomics (2016) 17:140 Page 16 of 16