This is an Accepted Manuscript of an article published by SAGE in Environment and Planning B:
Urban Analytics and City Science:
https://journals.sagepub.com/doi/full/10.1177/2399808319869341
Wurm, M., Goebel, J., Wagner, G. G., Weigand, M., Dech, S., & Taubenböck, H. (2019).
Inferring floor area ratio thresholds for the delineation of city centers based on cognitive
perception. Environment and Planning B: Urban Analytics and City Science.
https://doi.org/10.1177/2399808319869341
Inferring floor area ratio thresholds for the delineation of
city centers based on cognitive perception
Michael Wurm1, Jan Goebel
2, Gert G. Wagner
2,3, Matthias Weigand
1, Stefan Dech
1,4,
Hannes Taubenböck1
1German Aerospace Center (DLR), German Remote Sensing Data Center (DFD), 82234 Oberpfaffenhofen, Germany. 2German Socio-Economic Panel Study (SOEP), German Institute of Economic Research (DIW Berlin), 10117 Berlin,
Germany. 3Max Planck Institute for Human Development, 14191 Berlin, Germany. 4University of Würzburg, Department of Remote Sensing, Institute of Geography and Geology. 97074 Würzburg,
Germany.
Abstract
The morphology of today’s cities is the result of historic urban developments and on-
going urban transformation resulting in complex urban spatial structures. While
functionally as well as spatially, cities are structured into sub-units such as the city center,
business districts, residential areas or industrial and commercial zones, their precise
localization in the geographic space is sometimes difficult. City centers in particular are
difficult to grasp because they stand for many different urban functions. Generally, they
are characterized as areas of high densities, such as employment, population or
commerce, but also as areas of high structural densities. In past studies, various
approaches, data and cut-off values have been presented to separate city centers from the
surrounding transition zones in geographical information systems based on density
values. To overcome the difficulty in defining the right density threshold, the current
study presents an approach which integrates the subjective perception of citizens on the
urban spatial structure and relate it to the floor area ratio to delineate city centers to infer
a characteristic density threshold. In a large empirical study for 67 monocentric cities in
Germany we observe a decreasing floor area ratio gradient towards the urban fringes. The
result of the study reveals a relative threshold for city centers at around 30% of the
density of the ‘central place’.
Keywords
city center; cognitive perception; urban spatial structure; density; floor area ratio.
1. Introduction
The spatial structure of cities has undergone fundamental transformations over the past
centuries. Today’s cities appear often as decentralized, polycentric (Garreau 1991) urban
structures; they are sometimes even seen as an intermediate step to a dispersed urban
world (Batty et al. 2004). This is mostly a result of planning policies in the 20th
century
where urban functions have been segregated and decentralized shaping modern cities as
complex urban systems connecting urban functions and urban forms throughout spatial
and functional networks (Batty 2008). While these described processes are mainly
observed in North America and recently in Asia, European cities mostly still resemble
what they looked like “in the lifetime of St. Thomas Aquinas […] built in the 13th
century” (Holmes 1992). Medieval European cities were characterized as places with a
mix of urban functions (e.g. housing, trade and commerce, consumption, employment) in
very close spatial proximities resulting in the majority of jobs being concentrated in
central manufacturing areas (Anas, Arnott & Small 1998). Since city sizes were regulated
by walking or horseback riding distances, spatial congruency between these functions
could be enabled inside city walls which were constructed in the shortest, thus in a
circular shape around a ‘central place’ which served as nuclei of urban development, e.g.
the central market (Schlüter 1899). This has led to the development of monocentric urban
spatial structures in European cities which could be preserved until the 19th
century when
the Industrial Revolution gave way to new usages of urban spaces and processes of de-
concentration and suburbanization gained in prevalence (Siedentop 2005). A key
prerequisite for the latter was the decreasing importance of spatial proximity as a
necessity for economy due to new transport technologies. Thus, the importance of the
historical city centers in terms of trade and commerce has eventually declined over time
(Besussi and Chin 2003; Thomas & Bromley 2003; Schiller 2001), but they are still
important for the provision of urban functions and soft economies today, favoring high
density and mixed locations (Batty et al. 2004).
In fact, high density and high diversity are considered as the most important
characteristics when defining city centers. Most commonly, functional characteristics are
used to define and delineate city centers, such as high concentrations of commerce,
economic activities, employment, high individual and public traffic (including
pedestrians) as well as high diversity of activities and touristic attractions, respectively
(Sert 1952; Murphy & Vance 1954; Anas, Arnott & Small 1998; Thurstain-Goodwin &
Unwin 2000, McMillen 2004). Besides urban functions, also morphological
characteristics were used to delineate city centers, mostly in terms of structural density
(Murphy & Vance 1954; Murphy 1972; Taubenböck et al. 2013 & 2016; Krehl et al.
2016). As a result of this plurality of characteristics for defining city centers, a commonly
agreed and consistent definition of city centers has not evolved (Ralphs & Wyatt 2003),
and moreover, no commonly accepted density threshold has been found.
This ambiguity in defining and delineating city centers is addressed in the present paper.
We aim at taking up on the fuzziness for delineating city centers by analyzing cognitive
perceptions of citizens on city centers and relate it to the floor area ratio (FAR) to
empirically infer a density threshold value for separating city centers from the transition
zone. In this way, we analyze people’s cognitive perceptions to spatially define city
centers, since citizens recognize and realize the presence of a city center when they are
standing in a city center even if they cannot define it. The use of subjective perception to
create ‘mental maps’ has been introduced by Lynch (1960) where he describes the
concept of ‘legibility’, making parts of the city recognizable to its dwellers and thus
triggers to spatially organize the city in the sense of mental maps. They are a subjective
interpretation of the environment as a function of individual social values and constraints
(Rengert & Pelfrey 1997). This concept is related to the direct perception theory (Gibson
1979) where specific objects are related to specific functions or activities. For example, a
park affords relaxing or a street affords walking (Jiang 2012). In this way, a city creates
also a mental map for citizens (Haken & Portugali 2003).
Based on these concepts, we search empirically for a characteristic degree of FAR which
is commonly accepted by citizens to separate city centers from their surrounding areas.
Thus, this paper contributes to research on the delineation of city centers. The work
provides new perspectives on delineating city centers following an empirical, quantitative
analysis of 67 monocentric major cities in Germany. In an experimental setting, we
calculate structural density represented as FAR based on 3D building models and relate it
to cognitive perceptions of citizens on the city center. To demonstrate the proof of
concept, we divide the statistical population of all cities into 4 groups based on
population density since it provides a proxy value for the urban spatial structure. We
argue feasibility of this proof of concept if the empirically derived distances are similar
among the 4 groups.
The remainder of this article is structured as follows: we begin by reviewing how city
centers are defined and localized in previous studies based on functional and morphologic
features (Section 2). The following Section 3 describes the used data and the workflow
for the calculation of urban morphologic features such as the floor area ratio and the
integration of survey data on cognitive perception of city centers. This is followed by a
discussion on the proposed analysis in Section 4 and, finally, Section 5 concludes the
paper with an outlook.
2. Delineation of city centers: related work
To delineate city centers, we need to have an understanding of how and based on which
criteria they are separated from their surrounding areas. But these surrounding ‘zones of
transition’, as introduced in the classical models of urban land-use (Park, Burgess &
Ernst 1925), remain also rather fuzzy in definition and shape. They are described as areas
with lower densities than the city center, e.g. population density (Borruso & Porceddu
2009) and also lower land prices as a function of the accessibility to the central business
district (CBD) as introduced in the classical, monocentric urban bid rent model by Alonso
(1964) and still applied in current studies (D’Acci 2019). From the aspect of historical
urban development, the transition zone represents the former suburbs of the historic city,
mostly located outside former city fortifications. In some cities, these fortifications could
be preserved until today e.g. Neuf-Brisach (France) or Lucca (Italy), and still delimit a
sharp border between the city center and its surroundings, mostly visible by significant
differences in density (Figure 1-A). In other cases where the city walls have been torn
down, we find today other structuring elements in their place such as boulevards e.g. the
‘Ringstraße’ in Vienna (Austria), the‘boulevard périphérique’ in Paris (France) or parks
e.g. Cologne (Germany) which still keep the separating function of the former city walls
alive, mostly still visible by changing morphological densities (Figure 1-B). Another
example are cities with no more clearly visible separating element in their today’s urban
spatial structure between their former city centers and their surroundings since their urban
morphology has been transformed more severely over the past centuries (Figure 1-C),
e.g. due to large-scale destruction and rebuilding e.g. Rotterdam (The Netherlands). In
these cases, the physical circumscription of the city center cannot be easily identified
since the transition zone is an area of flux which is characterized by a continuous change
in urban function or land-use as well as a decrease in density without any obvious
threshold.
Figure 1: Examples for city centers: A) preserved city walls: Lucca (Italy). B) former
walls replaced by structuring elements such as boulevards: Vienna (Austria). C) entirely
transformed: Rotterdam (The Netherlands). © Google Earth.
From a scientific point there exists neither a single, commonly agreed feature nor cut-off
value to delineate the city center from its surroundings. Due to the fuzziness of city
centers, the use of geographical information systems for their delineation has been
criticized for a long time (Taylor 1995), although more recent approaches have
successfully addressed this issue (Batty et al. 2004). In related work, city center detection
was performed based on a large spectrum of features, such as functional characteristics
(Thurstain-Goodwin & Unwin 2000; Lloyd 2009; Borruso & Porceddu 2009), travel
flows (Ratti et al. 2006; Roth et al. 2011), location-based social networking (Sun et al.
2015), social media data (Hollenstein and Purves 2010; Chen et al. 2017), urban land use
data (Zhu & Sun 2017), points of interest and road network data (Lei et al. 2015; Yu et al.
2015). Besides functional characteristics, also morphological features such as the density
were used to delineate CBDs (Murphy & Vance 1954; Taubenböck et al. 2013; Krehl et
al. 2016). These related works approach city center delineation either in terms of a clear-
cut spatial delineation based on a broad set of different kinds of data or approach the
fuzziness of city centers understanding it as higher order geographical phenomenon. In
this way, Burrough & Frank (1996) find city centers based on the cognitive perception of
citizens such as mental maps, as introduced by Lynch (1960). The approach of using
social studies’ participants’ individual perception for spatially structuring urban areas by
the features location, density and function was successfully adapted by Hoffmeyer-
Zlotnik (2000). Further studies related citizens’ perceptions to the appearance of specific
urban functions of city centers (Le et al. 2005; Lüscher and Weibel 2012; Alarasi,
Martinez & Amer 2015), assessed the quality of a center (Rengert & Pelfrey 1997) or
delineated the area of city centers for a small number of cities (Montello et al. 2003;
Lüscher and Weibel 2012; Le et al. 2005). Despite the related work in this context, one
remaining drawback is that the individual choice of criteria for describing a city center
remains very subjective for each individual. Thus, it is very unlikely that two citizens
agree on a similar set of criteria (Thurstain-Goodwin & Unwin 2000) making the search
for an optimal feature set a very difficult task. Therefore, instead of searching for a
commonly accepted set of functional criteria to delineate city centers for all cities under
investigation, we base our approach to citizens’ perceptions on their household locations
to delineate city centers and relate it to the FAR as a very visible and objective criterion.
Moreover, we aim at finding a generalizable, characteristic FAR-threshold for separating
city centers from their surroundings.
3. Data and methods for delineating city centers
The proposed workflow for empirically inferring a characteristic FAR threshold to
delineate city centers is based on citizens’ perceptions and decreasing FAR gradients in
monocentric cities (Barr and Cohen 2014). To evaluate the proposed proof of concept, we
base our study on a large sample of major cities in Germany. Selection of sample cities
was based on several criteria: (1) a minimum population size of 100,000 inhabitants to
ensure a significant size of the city center and the transition zone, (2) a monocentric
urban structure following a radial FAR gradient, (3) a historic city center to avoid
recently planned city foundations and (4) their spatial development has not been too
impaired by natural barriers such as mountains or water surfaces. All German major cities
have been individually evaluated with regards to their historic development and their
urban spatial structure based on (historic) maps and satellite images. Cities which have
undergone significant territorial reforms (e.g. Berlin, Wuppertal, Remscheid), with
decreasing population sizes (e.g. Zwickau, Wilhelmshaven), with a spatial development
which is affected by natural barriers such as the sea (e.g. Bremerhaven, Kiel, Flensburg)
or cities without a historical city center (e.g. Wolfsburg, Karlsruhe, Leverkusen,
Ludwigshafen) have been removed resulting in a total of 67 major cities in for the current
study. For the selected cities, 3D building models are used to calculate the FAR on the
spatial level of city blocks. Further, citizens’ perceptions from a socio-economic survey
are used to spatially delineate the extent of city centers. In a consecutive step, the spatial
extents of the perceived areas of city centers are spatially superimposed with the values to
infer a characteristic FAR-threshold value at the edge between the city centers and the
transition zone. In the absence of objective validation data for the size of city centers, we
test the proof of concept with the help of creating 4 groups from the 67 cities based on the
following assumption: if the inferred FAR-threshold values are similar among these
groups, an interrelation between FAR and cognitive perception on city centers can be
argued. The 4 groups are based on the population density of the 67 cities since the
population density integrates both, population size and area of a city. Using Jenks’
natural breaks classification algorithm (Jenks and Caspall 1971), the following 4 groups
are created: 1) ≤850 inh./km², 2) 850-1600 inh./km², 3) 1600-2500 inh./km² and 4) >2500
inh./km². The proposed workflow is presented in detail below and an overview of the
required steps is depicted in Figure 2.
Figure 2: Workflow for delineating city centers based on FAR and cognitive perception:
A) Calculation of FAR (Section 3.1); B) Using citizens’ perceptions to delineate city
centers (Section 3.2); C) Inferring the FAR-threshold (Section 3.3).
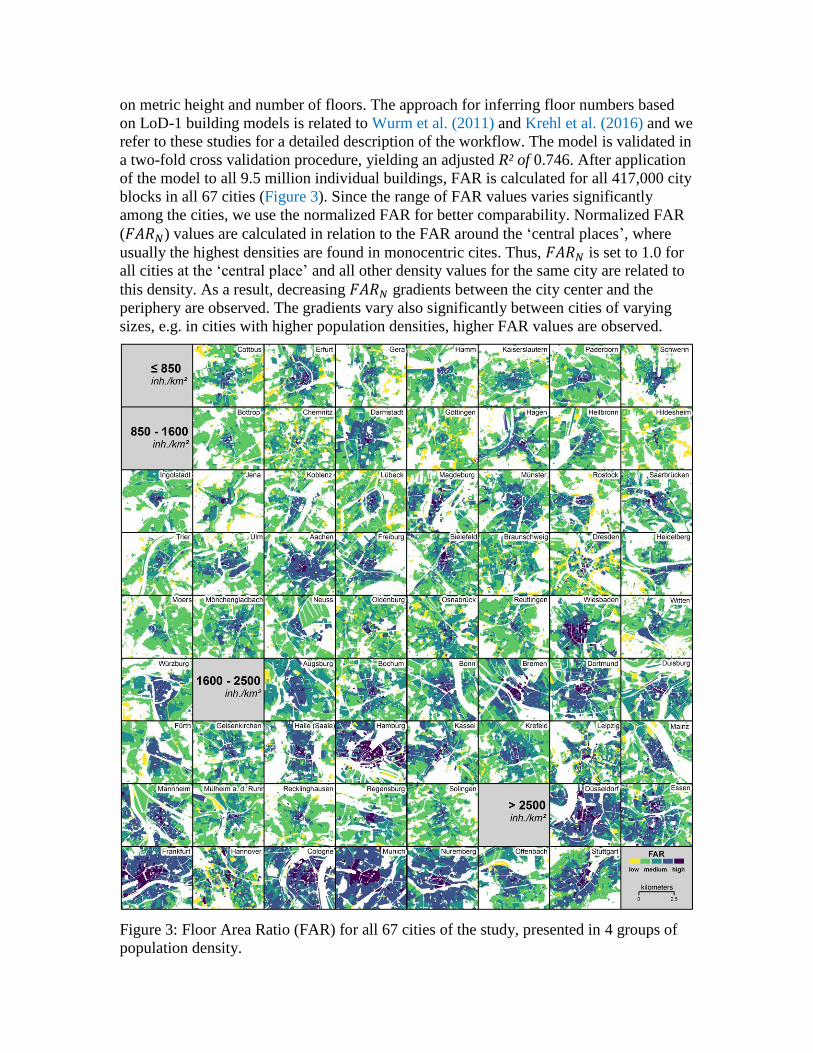
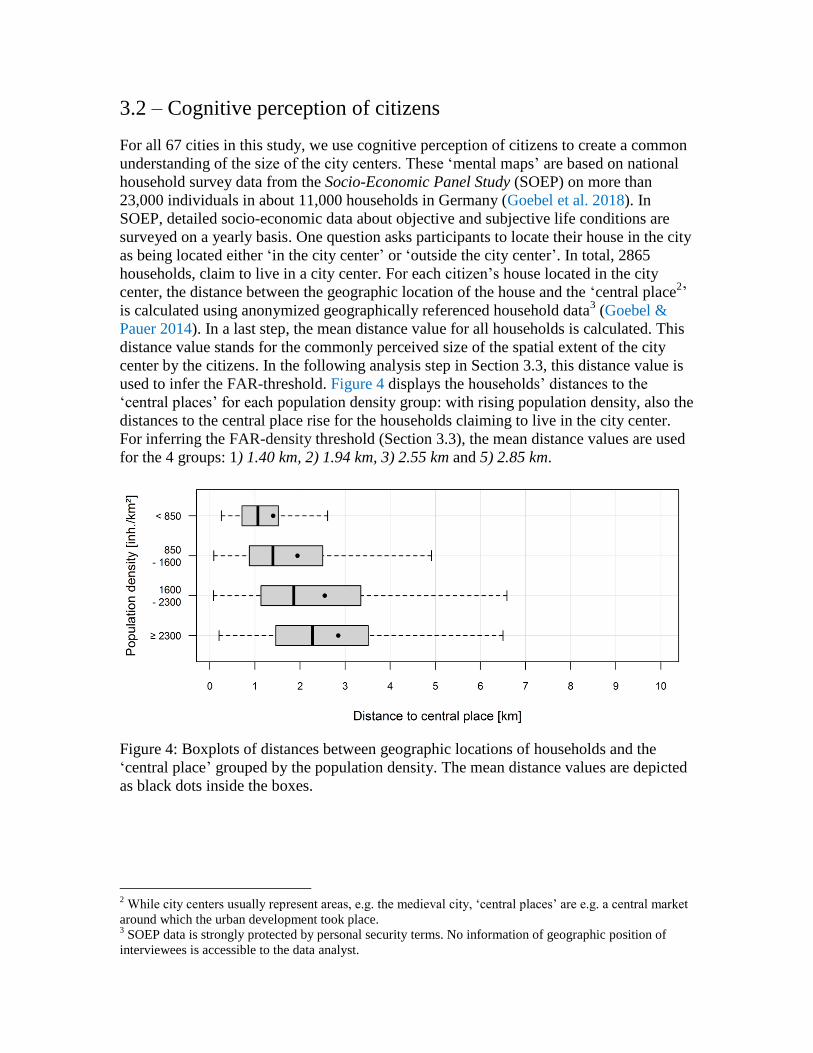
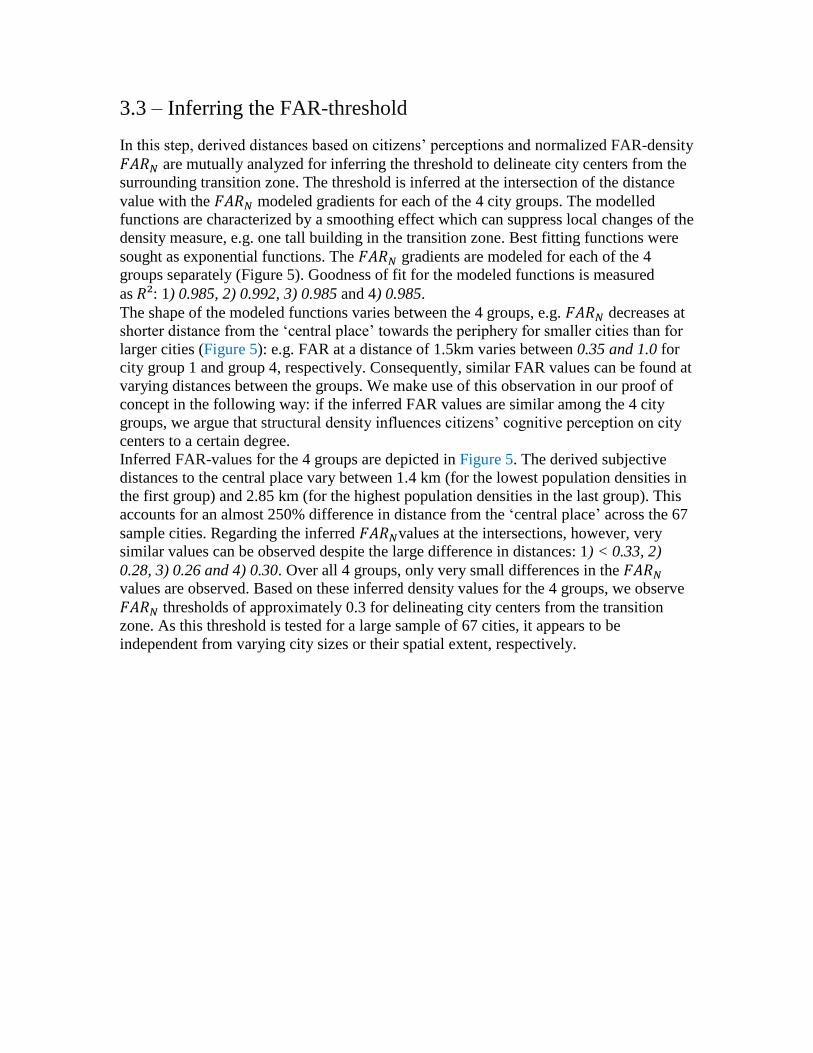
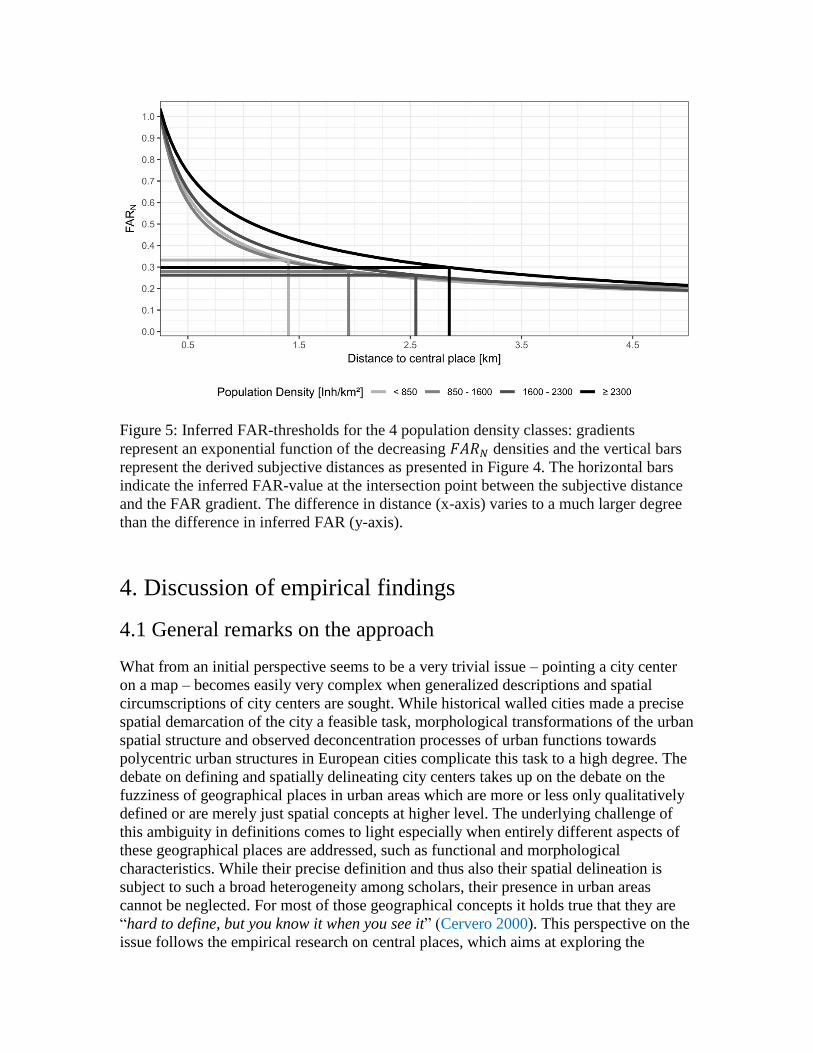
3.1 – Calculation of FAR
Structural density represents a key feature for the characterization of urban morphology
and is crucial for describing urban activities (e.g. Acioly & Davidson 1996). It stands for
proximity because with rising density of a city, distances are decreasing and citizens
cover more distances walking in the city, by bike or public transport. Density serves as a
trigger for synergies and concurrences, thus having a positive impact on prosperity and
innovation. Despite its wide application in urban studies and planning, structural density
still represents a fuzzy concept (e.g. Krehl et al. 2016; Taubenböck et al. 2016). For its
calculation, usually building footprint areas or volumes are related to the area of the land
lot or the city block. An objective and comparable measure of structural density for
analyzing the urban spatial structure represents the floor area ratio (FAR) (Barr & Cohen
2014; Wurm et al. 2014). It is defined as the ratio of total usable floor space to the size of
the plot, e.g. the FAR of a plot with a 5-story building constructed over the entire plot
would equal to 5, while a 10-story building over half the plot size would also equal to 5
(Barr & Cohen 2014). For the current study, FAR is calculated based on ministerial 3D
building models at the Level-of-Detail-1 (LoD-1) and data on city block geometries.
LoD-1 building models represent the shape of buildings as block model incorporating
building footprint geometries (e.g. area) and a metric building height value, however
these data usually do not incorporate the number of floors. Thus, these data represent a
simple 3D representation of buildings. For detailed information on the related LoD-1
building model, we refer to the official product catalogue for federal agencies on the
website of the data provider1. Since for calculation of FAR, the buildings’ areas and the
number of floors are required, we infer the number of floors based on empirically
established linear regression models with a sample of 600,000 buildings including data
1
http://www.geodatenzentrum.de/geodaten/gdz_rahmen.gdz_div?gdz_spr=eng&gdz_akt_zeile=2&gdz_anz_zeile=0&gdz_user_id=0 (LoD-1 description can be found on page 25, documentation in German).
on metric height and number of floors. The approach for inferring floor numbers based
on LoD-1 building models is related to Wurm et al. (2011) and Krehl et al. (2016) and we
refer to these studies for a detailed description of the workflow. The model is validated in
a two-fold cross validation procedure, yielding an adjusted R² of 0.746. After application
of the model to all 9.5 million individual buildings, FAR is calculated for all 417,000 city
blocks in all 67 cities (Figure 3). Since the range of FAR values varies significantly
among the cities, we use the normalized FAR for better comparability. Normalized FAR
(𝐹𝐴𝑅𝑁) values are calculated in relation to the FAR around the ‘central places’, where
usually the highest densities are found in monocentric cites. Thus, 𝐹𝐴𝑅𝑁 is set to 1.0 for
all cities at the ‘central place’ and all other density values for the same city are related to
this density. As a result, decreasing 𝐹𝐴𝑅𝑁 gradients between the city center and the
periphery are observed. The gradients vary also significantly between cities of varying
sizes, e.g. in cities with higher population densities, higher FAR values are observed.
Figure 3: Floor Area Ratio (FAR) for all 67 cities of the study, presented in 4 groups of
population density.
3.2 – Cognitive perception of citizens
For all 67 cities in this study, we use cognitive perception of citizens to create a common
understanding of the size of the city centers. These ‘mental maps’ are based on national
household survey data from the Socio-Economic Panel Study (SOEP) on more than
23,000 individuals in about 11,000 households in Germany (Goebel et al. 2018). In
SOEP, detailed socio-economic data about objective and subjective life conditions are
surveyed on a yearly basis. One question asks participants to locate their house in the city
as being located either ‘in the city center’ or ‘outside the city center’. In total, 2865
households, claim to live in a city center. For each citizen’s house located in the city
center, the distance between the geographic location of the house and the ‘central place2’
is calculated using anonymized geographically referenced household data3 (Goebel &
Pauer 2014). In a last step, the mean distance value for all households is calculated. This
distance value stands for the commonly perceived size of the spatial extent of the city
center by the citizens. In the following analysis step in Section 3.3, this distance value is
used to infer the FAR-threshold. Figure 4 displays the households’ distances to the
‘central places’ for each population density group: with rising population density, also the
distances to the central place rise for the households claiming to live in the city center.
For inferring the FAR-density threshold (Section 3.3), the mean distance values are used
for the 4 groups: 1) 1.40 km, 2) 1.94 km, 3) 2.55 km and 5) 2.85 km.
Figure 4: Boxplots of distances between geographic locations of households and the
‘central place’ grouped by the population density. The mean distance values are depicted
as black dots inside the boxes.
2 While city centers usually represent areas, e.g. the medieval city, ‘central places’ are e.g. a central market
around which the urban development took place. 3 SOEP data is strongly protected by personal security terms. No information of geographic position of
interviewees is accessible to the data analyst.
3.3 – Inferring the FAR-threshold
In this step, derived distances based on citizens’ perceptions and normalized FAR-density
𝐹𝐴𝑅𝑁 are mutually analyzed for inferring the threshold to delineate city centers from the
surrounding transition zone. The threshold is inferred at the intersection of the distance
value with the 𝐹𝐴𝑅𝑁 modeled gradients for each of the 4 city groups. The modelled
functions are characterized by a smoothing effect which can suppress local changes of the
density measure, e.g. one tall building in the transition zone. Best fitting functions were
sought as exponential functions. The 𝐹𝐴𝑅𝑁 gradients are modeled for each of the 4
groups separately (Figure 5). Goodness of fit for the modeled functions is measured
as 𝑅²: 1) 0.985, 2) 0.992, 3) 0.985 and 4) 0.985.
The shape of the modeled functions varies between the 4 groups, e.g. 𝐹𝐴𝑅𝑁 decreases at
shorter distance from the ‘central place’ towards the periphery for smaller cities than for
larger cities (Figure 5): e.g. FAR at a distance of 1.5km varies between 0.35 and 1.0 for
city group 1 and group 4, respectively. Consequently, similar FAR values can be found at
varying distances between the groups. We make use of this observation in our proof of
concept in the following way: if the inferred FAR values are similar among the 4 city
groups, we argue that structural density influences citizens’ cognitive perception on city
centers to a certain degree.
Inferred FAR-values for the 4 groups are depicted in Figure 5. The derived subjective
distances to the central place vary between 1.4 km (for the lowest population densities in
the first group) and 2.85 km (for the highest population densities in the last group). This
accounts for an almost 250% difference in distance from the ‘central place’ across the 67
sample cities. Regarding the inferred 𝐹𝐴𝑅𝑁values at the intersections, however, very
similar values can be observed despite the large difference in distances: 1) < 0.33, 2)
0.28, 3) 0.26 and 4) 0.30. Over all 4 groups, only very small differences in the 𝐹𝐴𝑅𝑁
values are observed. Based on these inferred density values for the 4 groups, we observe
𝐹𝐴𝑅𝑁 thresholds of approximately 0.3 for delineating city centers from the transition
zone. As this threshold is tested for a large sample of 67 cities, it appears to be
independent from varying city sizes or their spatial extent, respectively.
Figure 5: Inferred FAR-thresholds for the 4 population density classes: gradients
represent an exponential function of the decreasing 𝐹𝐴𝑅𝑁 densities and the vertical bars
represent the derived subjective distances as presented in Figure 4. The horizontal bars
indicate the inferred FAR-value at the intersection point between the subjective distance
and the FAR gradient. The difference in distance (x-axis) varies to a much larger degree
than the difference in inferred FAR (y-axis).
4. Discussion of empirical findings
4.1 General remarks on the approach
What from an initial perspective seems to be a very trivial issue – pointing a city center
on a map – becomes easily very complex when generalized descriptions and spatial
circumscriptions of city centers are sought. While historical walled cities made a precise
spatial demarcation of the city a feasible task, morphological transformations of the urban
spatial structure and observed deconcentration processes of urban functions towards
polycentric urban structures in European cities complicate this task to a high degree. The
debate on defining and spatially delineating city centers takes up on the debate on the
fuzziness of geographical places in urban areas which are more or less only qualitatively
defined or are merely just spatial concepts at higher level. The underlying challenge of
this ambiguity in definitions comes to light especially when entirely different aspects of
these geographical places are addressed, such as functional and morphological
characteristics. While their precise definition and thus also their spatial delineation is
subject to such a broad heterogeneity among scholars, their presence in urban areas
cannot be neglected. For most of those geographical concepts it holds true that they are
“hard to define, but you know it when you see it” (Cervero 2000). This perspective on the
issue follows the empirical research on central places, which aims at exploring the
organization of urban systems in an analytical way without the restrictions of formal
theory (Burger & Meijers 2012).
In the direction of these related studies, we also embed the presented study on cognitive
perception and the urban spatial structure. This study presents an empirical approach to
link cognitive perceptions of citizens and the structural density of cities. In this way, the
concept of mental maps is integrated into the study design. Mental maps are very relevant
because every citizen has his/her own individual perspective of the urban spatial structure
and the location as well as the spatial circumscription of the city center. The individual
perception of the location and extension of the city center is influenced by each citizen’s
unique subjective, personal history and understanding of the urban spatial structure
(Rengert & Pelfrey 1997). From the vast amount of morphological or functional
attributes which characterize city centers, each citizen structures the city wittingly or
unwittingly in his/her mind.
The presented approach allows for integrating a larger quantity of samples and cities than
approaches using in-depth interviews. The latter mostly aim at precise spatial
circumscriptions of city centers drawn by participants on a map, mostly as a case-study
for just one or a few cities (e.g. Lüscher and Weibel 2012). These approaches may
eventually lead to higher spatial precision and they can be analyzed in geographical
information systems, but results are mostly restricted to a handful of case studies.
Contrarily, our approach cannot predict a precise delineation for individual cities, but
aims at associating urban structure and density on a more generalizable level. Therefore,
it must be underlined that the inferred distances from cognitive perceptions cannot be
transferred back to single cities for comparison with the actual situation since there is
only one value for all cities from the same group of population density.
For a meaningful interpretation of this empirical study, general preconditions must be
considered and therefore we highlight the following points:
- the approach derives a Euclidian distance for finding the extent of city centers. Since
only one distance is used, a radial extension of the city center around the most ‘central
place’ is assumed together with a circular circumscription of the transition zone around it.
Hence, the approach requires the assumption of a monocentric city model which can be
more or less accepted for most German cities with similar historic city development
(Schlüter 1899). A linear transfer of the approach to cities with a completely different
urban spatial structure, e.g. to polycentric urban structures appears at this point under
consideration of the used data not feasible.
- for all cities where a discrete delineation of the city center is not possible, a precise
association of the respective functional and morphological urban areas into city center
and transition zone is beyond feasibility since these measures do not follow a strict
concept. Moreover, in today’s cities the transition between the city center and the
transition zone is mostly continuous. Therefore, approaches for finding city centers use
selected physical and/or functional, quantifiable characteristics of city centers. The
perception of citizens integrates all objective and subjective characteristics of each
individual’s surroundings. Thus, the vast number of attributes influencing people’s
perception is difficult to fit into a model. To account for all these features, the current
study relates to citizens’ cognitive perceptions of the city center by the location of their
houses.
4.2 Findings
In due consideration of the above mentioned aspects, the presented empirical study aims
at relating the urban spatial structure to the cognitive perception of citizens. Cognitive
perceptions of 2865 households living in a city center are analyzed with regard to their
distances to the most ‘central place’ of each city. Subsequently, the derived distance is
used to delineate the city centers and intersected with the FAR gradient to infer a FAR-
threshold for separating city centers from the transition zone. For comparability between
cities, we use the normalized floor area ratio 𝐹𝐴𝑅𝑁 which is represented as a decreasing
density gradient from the most ‘central place’ towards the periphery. The inferred FAR-
threshold values are very similar for all cities among the 4 groups of city sizes: they range
between 67-74% of the density of the most ‘central place’ for all cities. In other words:
we argue that structural density might play a role in the cognitive perception of citizens
for separating city centers from the transition zone.
5. Conclusion and outlook
The empirical experiments in this study indicate a relation between structural density and
cognitive perception of city centers. The study brings data of great heterogeneity together
for seeking new insights on the complex urban spatial structure. In detail, the
interdisciplinary analysis of spatial and non-spatial data in form of geographical
information system data and socioeconomic surveys are combined. With respect to the
data, we performed the analysis for 67 cities with 9.5 million individual buildings to
calculate the floor area ratio. Furthermore, individual responds from 11,000 households
participating in the SOEP were used to analyze the city centers providing a very large
data base for the experimental setup of study.
For related studies in the future, to gain even more reliable and transferable results, we
propose the use of a higher spatial density of household observations. Furthermore, with
respect to future works, while this approach was empirically set-up and tested for German
cities with similar historic developments, a comparison to cities with different historic
development would be of great interest, e.g. to North-American cities featuring CBDs or
polycentric urban structures; however, the generation of a representative amount of
households data on the individual perception might be the limiting factor. Further, since
the current study focuses solely on the morphologic aspects of the urban spatial structure,
we propose to extend the study by the integration of additional, functional characteristics,
e.g. employment density or commerce.
Funding
The authors received no financial support for the research, authorship, and/or publication
of this article.
References
Acioly C and Davidson F (1996) Density in urban development. Building Issues 8:3–25.
Alarasi H, Martinez J and Amer S (2016) Children's perception of their city centre: a
qualitative GIS methodological investigation in a Dutch city. Children's Geographies 14
(4): 437-452.
Alonso W (1964) Location and Land Use, Cambridge: Harvard University Press,
https://dx.doi.org/10.4159/harvard.9780674730854
Anas A, Arnott R and Small KE (1998) Urban spatial structure. Journal of Economic
Literature, American Housing Association. 36(3): 1426-1464.
Barr J and Cohen JP (2014) The floor area ratio gradient: New York City, 1890-2009.
Regional Science and Urban Economics 48: 110-119.
Batty M (2008) The size, scale, and shape of cities. Science 319: 769-771
Batty M, Besussi E, Maat K and Harts JJ (2004) Representing multifunctional cities:
Density and Diversity in Space and Time. Built Environment 30(4): 324-337.
Besussi, E and Chin, N (2003). Identifying and measuring urban sprawl. In: Longley, PA
and Batty, M (eds): Advanced Spatial Analysis: The CASA Book of GIS, pp. 109-128.
Borruso G and Porceddu A (2009). A Tale of Two Cities: Density Analysis of CBD on
Two Midsize Urban Areas in Northeastern Italy. In: Murgante B, Borruso G, Lapucci A
(eds) Geocomputation and Urban Planning. Studies in Computational Intelligence 176.
Springer, Berlin, Heidelberg
Burrough PA and Frank AU (1996) Geographic objects with indeterminate boundaries.
London, Taylor & Francis
Burger M and Meijers E (2012) Form Follows Function? Linking Morphological and
Functional Polycentricity. Urban studies 49 (5): 1127-1149.
Cervero R (2000) Shapeless, Spread Out, Skipped Over and Scattershot – Sprawl Sweeps
the Globe. In: The World Paper, pp. 5–6.
Chen Y, Liu X, Li X, Liu X, Yao Y, Hu G, Xu X and Pei F (2017) Delineating urban
functional areas with building-level social media data: A dynamic time warping (DTW)
distance based k-medoids method. Landscape and Urban Planning 160: 48-60
D’Acci (2019) Quality of urban area, distance from city centre, and housing value. Case
study on real estate values in Turin. Cities: in press.
Garreau J (1991) Edge City: life on the new frontier. New York City: Doubleday.
Gibson JJ (1979) The Ecological Approach to Visual Perception, Houghton-Mifflin:
Boston, MA.
Goebel J and Pauer B (2014) Datenschutzkonzept zur Nutzung von SOEPgeo im
Forschungsdatenzentrum SOEP am DIW Berlin. Zeitschrift für amtliche Statistik Berlin
Brandenburg 3: 42-47.
Goebel J, Grabka MM, Liebig S, Kroh M, Richter D, Schröder C and Schupp J (2018)
The German Socio-Economic Panel Study (SOEP). Jahrbücher für Nationalökonomie
und Statistik / Journal of Economics and Statistics (online first), doi: 10.1515/jbnst-2018-
0022
Haken H and Portugali J (2003) The face of the city is its information, Journal of
Environmental Psychology 23(4): 385-408.
Hollenstein L and Purves RS (2010) Exploring place through user - generated content:
Using Flickr to describe city cores. Journal of Spatial Information Science 1(1): 21-48
Holmes G (2001) The Oxford illustrated history of Medieval Europe, Oxford: Oxford
University Press.
Hoffmeyer-Zlotnik JHP (2000) Regionalisierung sozialwissenschaftlicher Umfragedaten,
Wiesbaden: Westdeutscher Verlag.
Jiang B (2012) Computing the image of the city. In: Campagna M, De Montis A, Isola F,
Lai S, Pira C and Zoppi C (eds) Planning Support Tools: Policy analysis, implementation
and evaluation, Proceedings of the 7th Int. conf. on Informatics and Urban and Regional
Planning INPUT 2012, 111-121.
Jenks G F, Caspall F C (1971) Error on Choroplethic Maps. Defnition, Measurement,
Reduction. Annals of the Association of American Geographers 61: 217-244.
Krehl A, Siedentop S, Taubenböck H and Wurm M (2016) A Comprehensive View on
Urban Spatial Structure: Urban Density Patterns of German City Regions. ISPRS
International Journal of Geo-Information 5(76), https://dx.doi.org/10.3390/ijgi5060076
Le T, Abrahart R, Aplin R and Priestnall G (2005). Town centre modelling based on
public participation, In: CUPUM 05, Computers in Urban Planning and Urban
Management - 9th international Conference, London.
Lei Y, Tian J, Lin L and Ren C (2015) A method for automatic delineation of city centers
using POI and road networks. Cehui Xuebao/Acta Geodaetica et Cartographica Sinica
44: 42-48
Lloyd DA (2009) GIS-based applications and the English Planning system: modeling
town centers and housing potential, In: Steinebach G, Guhathakurta S, Hagen H (eds):
Visualizing Spatial Planning, Springer.
Lüscher P and Weibel R (2012) Exploiting empirical knowledge for automatic
delineation of city centers from large-scale topographic databases. Computers,
Environment and Urban Systems 37: 18-34.
McMillen DP (2004) Employment densities, spatial autocorrelation & subcenters in large
metropolitan areas. Journal of Regional Science 44: 225-243.
Montello DR, Goodchild MF, Gottsegen J and Fohl, P (2003) Where's Downtown?:
Behavioral Methods for Determining Referents of Vague Spatial Queries. Spatial
Cognition & Computation: An Interdisciplinary Journal 3(2-3): 185-204
Murphy RE and Vance LE (1954) Delimiting the CBD. Economic Geography 30: 189-22
Park RE, Burgess EW (1925) The Growth of the City: An Introduction to a Research
Project. The City. University of Chicago Press.
Ralphs MP, Wyatt P (2003) GIS in Land and Property Management. Taylor & Francis
Ratti C, Pulselli RM, Williams S and Frenchman D (2006) Mobile landscapes: Using
location data from cell phones for urban analysis. Environment and Planning B: Planning
and Design 33(5): 727 –748.
Rengert GF and Pelfrey WV (1997) Cognitive mapping of the city center: comparative
perceptions of dangerous places. In: Weisburd D, McEwen T (eds): Crime mapping and
Crime Prevention.
Roth C, Kang SM, Batty M and Barthélemy M (2011) Structure of Urban Movements:
Polycentric Activity and Entangled Hierarchical Flows. PLoS ONE 6(1): e15923.
Schiller R (2001) The dynamics of property location. Spon Press London: Routledge
Chapman & Hall.
Schlüter O (1899) Über den Grundriß der Städte. Zeitschrift der Gesellschaft für
Erdkunde zu Berlin 34(6): 446-461.
Sert JL (1952) The heart of the city. In: Tyrwhitt J and Sert JL (eds): The heart of the
city. London, Lund Humphries, pp. 3-16.
Sun Y, Fan H and Zipf A (2015) Identifying the city center using human travel flows
generated from location-based social networking data. Environment and Planning B:
Planning and Design 43(3): 480-498.
Taubenböck H, Klotz M, Wurm M, Schmieder J, Wagner B, Wooster M, Esch T and
Dech S (2013) Delineation of Central Business Districts in mega city regions using
remotely sensed data. Remote Sensing of Environment 136: 386-401.
Taubenböck H, Standfuß I, Klotz M and Wurm M (2016) The Physical Density of the
City—Deconstruction of the Delusive Density Measure with Evidence from Two
European Megacities. ISPRS Int. J. Geo-Inf. 5(11): 206.
Taylor PJ (1995) Geographic information systems and geography. In: Pickles, J. (ed):
Ground truth the social implications of geographic information systems, pp. 51-67.
Thurstain-Goodwin M and Unwin M (2000) Defining and Delineating the Central Areas
of Towns for statistical Monitoring using continuous surface representations.
Transactions in GIS 4(4): 305-317.
Thomas CJ and Bromley RDF (2003) Retail revitalization and small town centres: the
contribution of shopping linkages, Applied Geography 23(1): 47-71.
Wurm M, d'Angelo P, Reinartz P and Taubenböck H (2014) Investigating the
applicability of Cartosat-1 DEMs and topographic maps to localize large-area urban mass
concentrations. IEEE Journal of Selected Topics in Applied Earth Observation and
Remote Sensing 7(10): 4138-4152.
Wurm M, Taubenböck H, Schardt M, Esch T and Dech S (2011) Object-based
information fusion using multisensor earth observation data over urban areas.
International Journal of Image and Data Fusion 2(2): 121-147.
Yu W, Ai T, Shao S (2015) The analysis and delimitation of Central Business District
using network kernel density estimation. Journal of Transport Geography 45: 32-47.
Zhu J and Sun Y (2017) Building an Urban Spatial Structure from Urban Land Use Data:
An Example Using Automated Recognition of the City Centre. ISPRS International
Journal of Geo-Information 6(4): 122.