Inferring Trader Behavior from Transaction Data: A Simple Model by David Jackson* First draft: May 08, 2003 This draft: May 08, 2003 * Sprott School of Business Telephone: (613) 520-2600 Ext. 2383 Carleton University email: [email protected]710 Dunton Tower 1125 Colonel By Drive Ottawa, Ontario K1S 5B6
Transcript
Inferring Trader Behavior from Transaction Data:A Simple Model
by
David Jackson*
First draft: May 08, 2003This draft: May 08, 2003
* Sprott School of Business Telephone: (613) 520-2600 Ext. 2383Carleton University email: [email protected] Dunton Tower1125 Colonel By DriveOttawa, Ontario K1S 5B6
Inferring Trader Behavior from Transaction Data:A Simple Model
Abstract
A model is presented that uses trade counts to characterize thearrival of news and the propensity of informed and uninformedtraders to transact. Our model has extremely low data requirements,is very fast to estimate and is adaptable for different researchapplications. The model is used to investigate changes in the bid /ask spread in conjunction with trades. We develop and estimate aninnovative extension of the model that relaxes the assumption thatnews is independent from day to day.
IntroductionIn 1987, Easley and O’Hara (EO) introduced a discrete-time, sequential trade
microstructure model1 that shines a light on the flow of information about an asset and
reveals some characteristics of subsequent informed and uninformed trading. A strength
of the EO model is its limited data requirements. Transaction counts of buying and
selling, along with counts of non-trading periods are enough to estimate the probability
that informed traders are active in a given asset market.
Because most data sets do not provide the buy / sell direction of trades, EO use the Lee
and Ready algorithm2 to classify trade direction. The idea underlying the Lee and Ready
method is to use both transaction and quote data to infer trade direction. A transaction
price above the mid-quote is classified as buy-initiated; a transaction price below the
mid-quote is classified as sell-initiated. As implemented in EO’s published papers, no
allowance is made for the uncertainty introduced by estimating trade direction. In effect,
a researcher using the Lee and Ready algorithm in this way assumes more precise
information than is available. Trade classification schemes have been shown to classify
trades imperfectly,3 however, raising questions about test outcomes that are dependent
upon estimates from the EO model.
In this paper, we derive a sequential trade model that uses trade counts only. There is no
use of the unobserved trade direction, removing any concerns about misclassification of
trades and understated standard errors. Our model, thus, has very low data preparation
1 Easley and O’Hara, Journal of Financial Economics, 1987.2 Lee and Ready, Journal of Finance, 1991.3 Theissen, Journal of International Financial Markets, Institutions & Money, 2000.
03/05/092
requirements, is extremely fast to estimate and is adaptable to different research
applications.
Ours is an example of models in which a subset of traders have private information about
the value of the asset. These traders act to profit from their information at the expense of
uninformed liquidity traders and the market maker. The directed trading behavior of the
informed enables the market maker and other uninformed market observers to make
inferences about the true value of the asset. Glosten and Milgrom provide an early
sequential trade, asymmetric information model.4 Sequential trade models allow only one
trader at a time, and place some limit on the size of an individual trade. Because informed
traders must wait their turn and because trade size is limited, informed trading is not
instantly revealing. Thus, sequential trade models have the potential to show time series
patterns in learning about the asset’s value. Indeed, the process of learning by the market
maker is a primary focus of the Easley and O’Hara BSN model upon which our TNT
model is based. The richness of information provided by buy and sell counts enables the
BSN model to infer a bid / ask spread time series that reflects the parameters of the news
process and the balance of informed and uninformed trading activity. By using trade
counts only, the TNT model gives up the ability to infer the spread. Our contribution is to
provide a model is very easy to work with and that does not suffer from possible
misclassification of trade direction.
We will demonstrate our trade / no-trade (TNT) model and briefly compare our
parameter estimates with those provided by the EO buy / sell / no-trade (BSN) model.
Both the TNT and BSN models assume day-to-day independence of information. We will
03/05/093
test this assumption and extend our model to allow for information that is not revealed to
the public for two days. Finally, we present a generalisation of the TNT model that we
use to investigate whether or not market makers change their quoted spreads in response
to trading activity.
This paper is organised as follows. Section 1 presents the EO buy / sell / no-trade (BSN)
model and our trade / no-trade (TNT) model. The TNT model makes no assumptions
about trade direction. In Section 2 the data is described. In Section 3 the model is
estimated, and some robustness and goodness of fit tests are performed. Section 4
generalizes the model to estimate the propensity of market makers to change spreads
around informed and uninformed trades. In Section 5 we summarise what we have
demonstrated.
1. Two Discrete-Time Sequential Trade ModelsIn a world with a single, risky asset, we model sequential trade between investors and a
market maker. A key feature of the models considered here is that news about the value
of the asset is generated intermittently. On any given day, there is uncertainty about
whether or not the value of the asset has changed since the previous day. Before the start
of trading, news about the end-of-day value of the asset is generated with a probability,
� . Any such news is bad with probability � and good with probability 1 �� . At the end
of each trading day, the news becomes publicly available.
The market maker is risk neutral and faces competition, so quotes are set at the expected
value of the asset, conditional on the trade direction of the next transaction. There are
4 Glosten and Milgrom, Journal of Financial Economics, 1985.
03/05/094
assumed to be a fixed number of trading periods during the day, with one trade possible
during any one period. All trades are for one unit of the asset, with all buys occurring at
the ask and all sells at the bid.
In each trading period, one potential trader arrives at the market. This trader observes any
news with probability � . If news is observed, this (informed) trader always trades,
buying on good news and selling on bad. If news is not observed, this (uninformed)
trader makes a liquidity trade with probability � or chooses not to trade with probability
1 �� . Similarly, on days, with no news, each trader must be uninformed and trades with
probability � or chooses not to trade with probability 1 �� . Uninformed trades are
equally likely to be buys or sells.
The market maker can learn from periods of non-trading because they are more likely on
days with no information than on days with good or bad news.
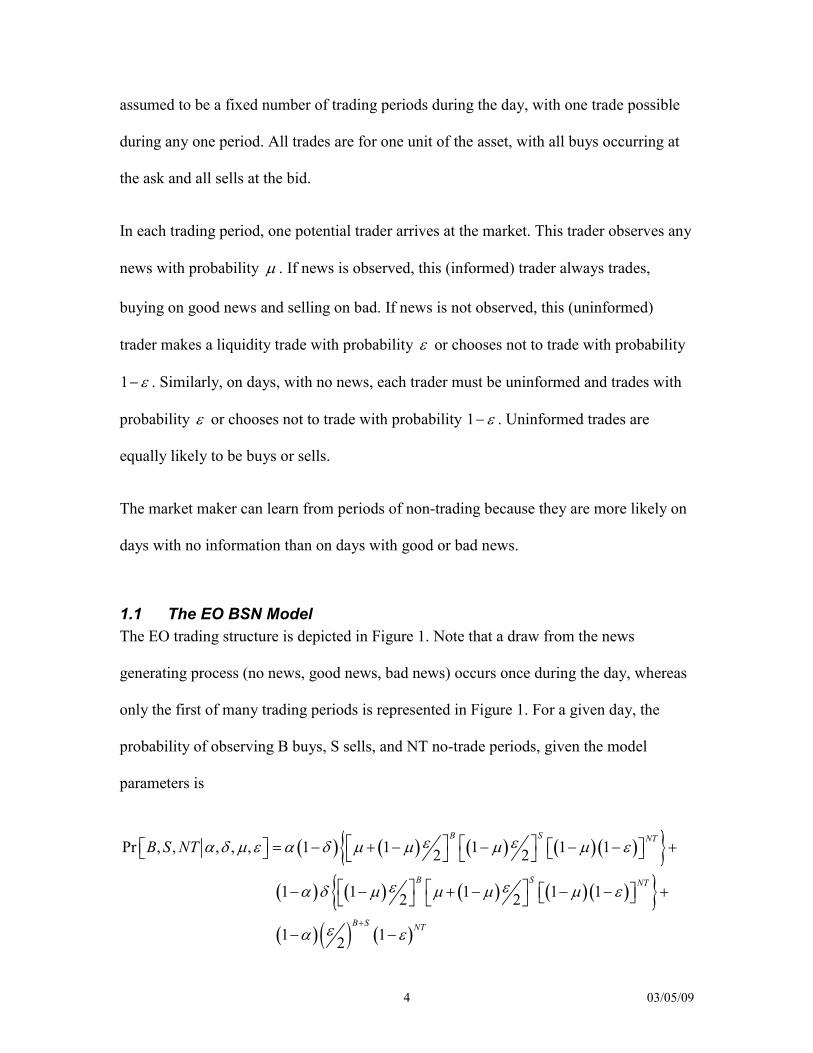
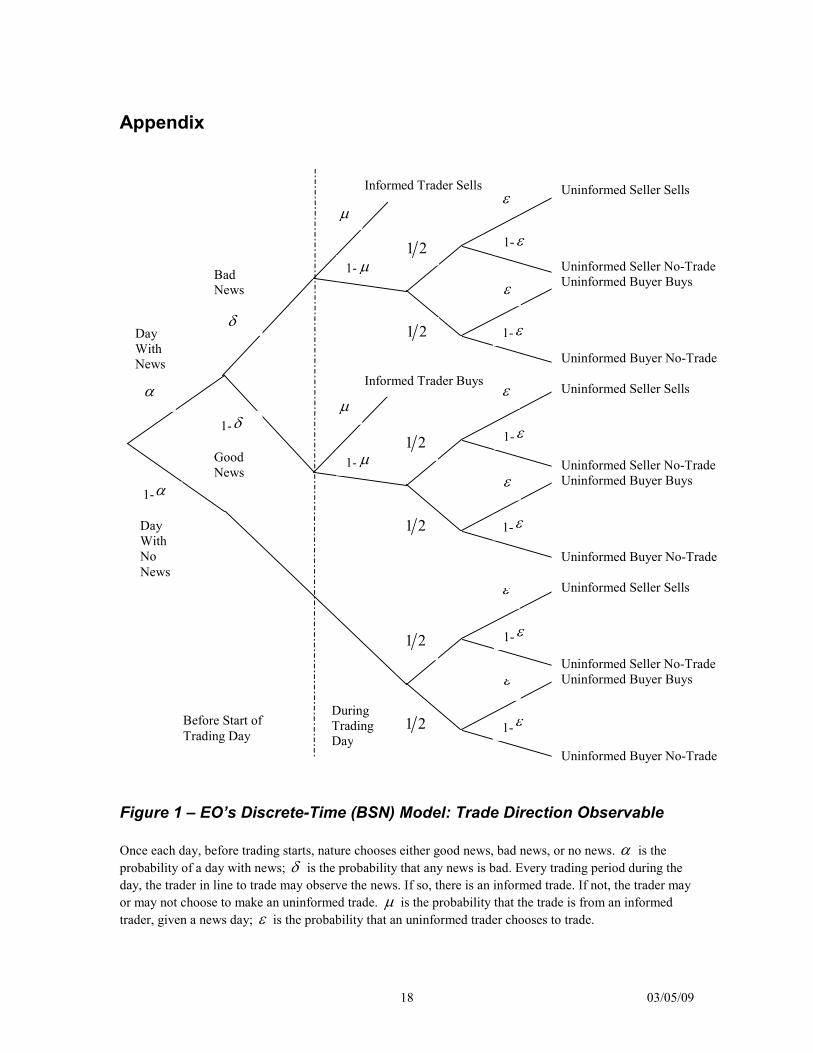
1.1 The EO BSN ModelThe EO trading structure is depicted in Figure 1. Note that a draw from the news
generating process (no news, good news, bad news) occurs once during the day, whereas
only the first of many trading periods is represented in Figure 1. For a given day, the
probability of observing B buys, S sells, and NT no-trade periods, given the model
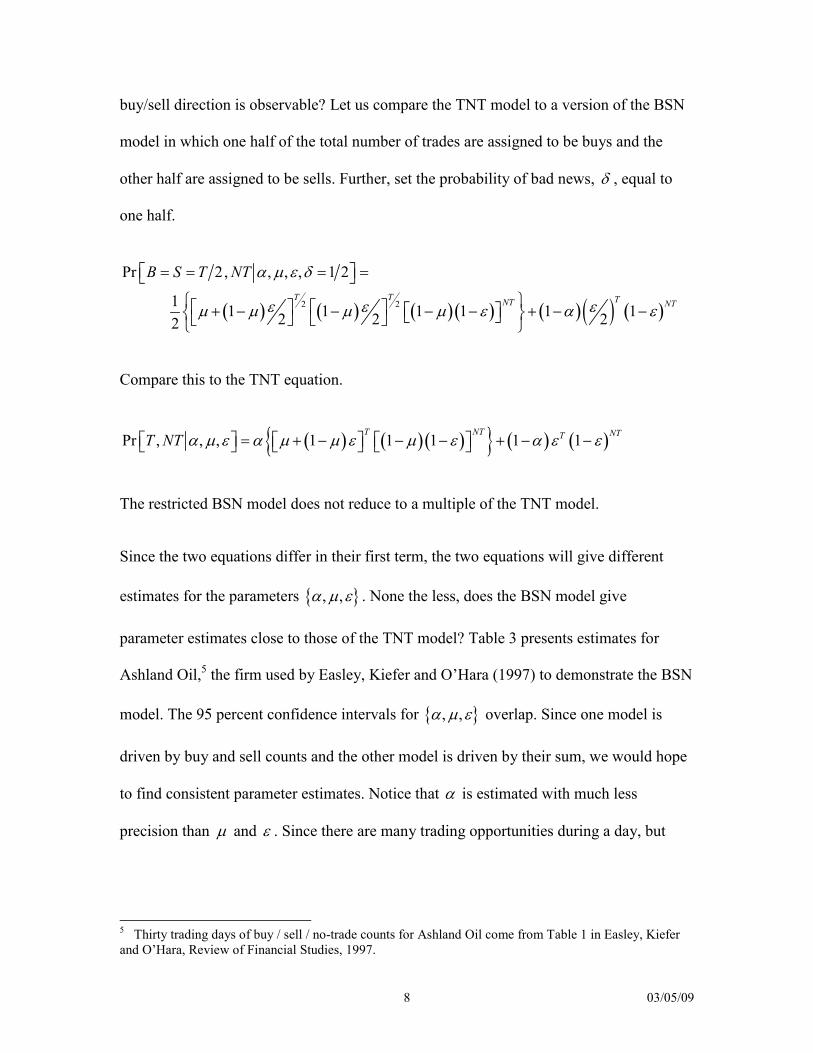
The restricted BSN model does not reduce to a multiple of the TNT model.
Since the two equations differ in their first term, the two equations will give different
estimates for the parameters � �, ,� � � . None the less, does the BSN model give
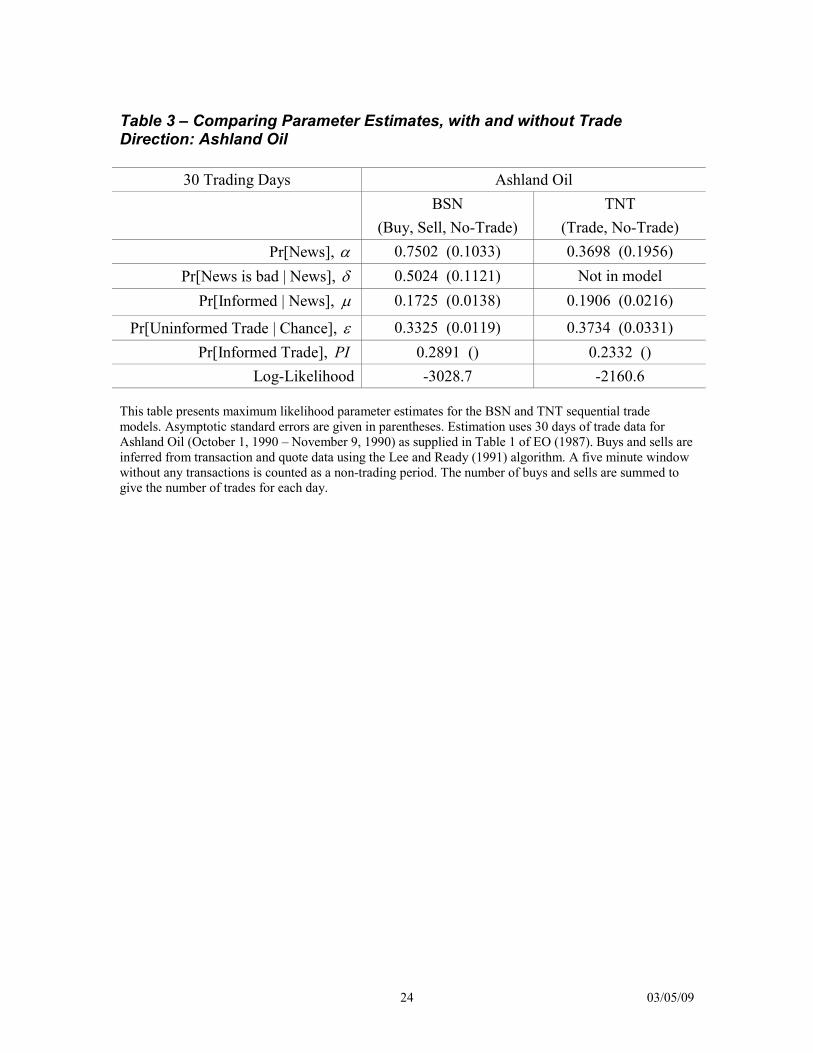
parameter estimates close to those of the TNT model? Table 3 presents estimates for
Ashland Oil,5 the firm used by Easley, Kiefer and O’Hara (1997) to demonstrate the BSN
model. The 95 percent confidence intervals for � �, ,� � � overlap. Since one model is
driven by buy and sell counts and the other model is driven by their sum, we would hope
to find consistent parameter estimates. Notice that � is estimated with much less
precision than � and � . Since there are many trading opportunities during a day, but
5 Thirty trading days of buy / sell / no-trade counts for Ashland Oil come from Table 1 in Easley, Kieferand O’Hara, Review of Financial Studies, 1997.
03/05/099
only one draw from the news process, we effectively have more observations for
estimating � �,� � than � .
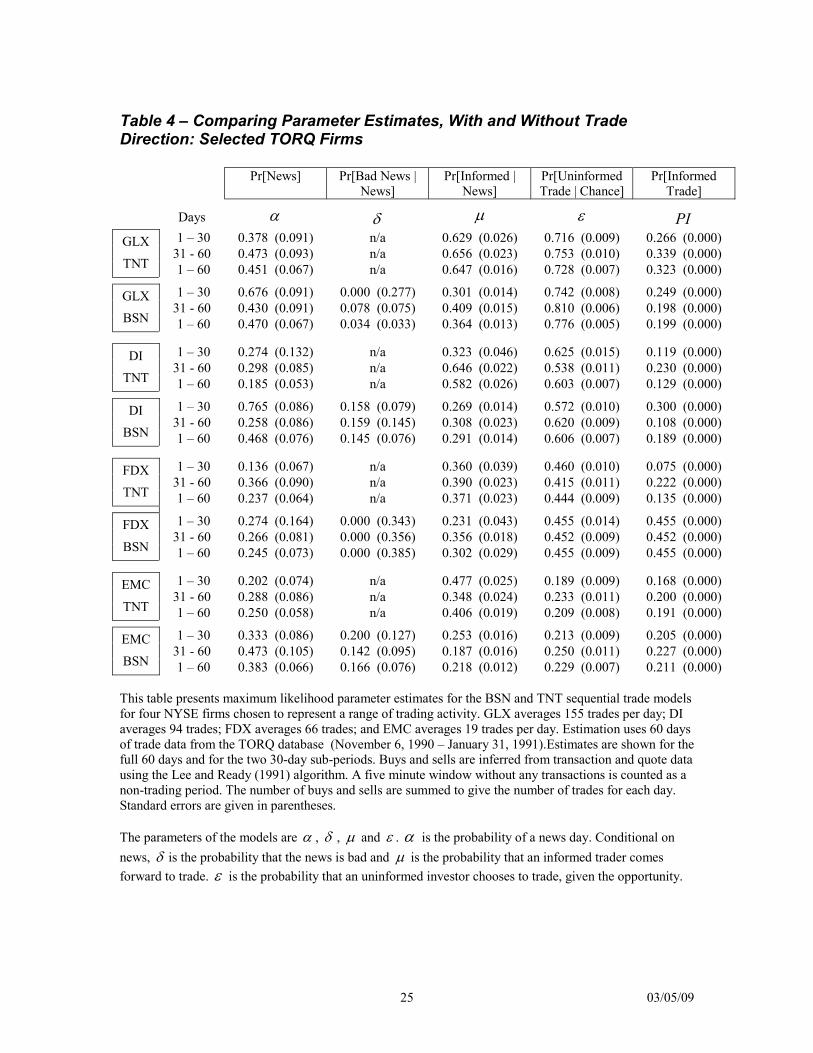
Are parameter estimates always so consistent for the two models? Table 4 presents 30
and 60 day parameter estimates for four NYSE firms that were selected to represent a
range of trading activity. Given the relatively large standard errors, estimates for the
probability of a news day, � , mostly fall within the 95% confidence intervals. Such is
not the case for other parameters, however. The estimates provided by the two models,
for the probability that uninformed traders choose to transact, � , and for the probability
that a trader is informed on a news day, � , differ significantly in many instances.
Estimates of the probability of informed trading, PI, can be quite different too. This
suggests some caution when using either model for research. Tests that rely upon
absolute levels of the parameters may be sensitive to which model is chosen.
Model Specification
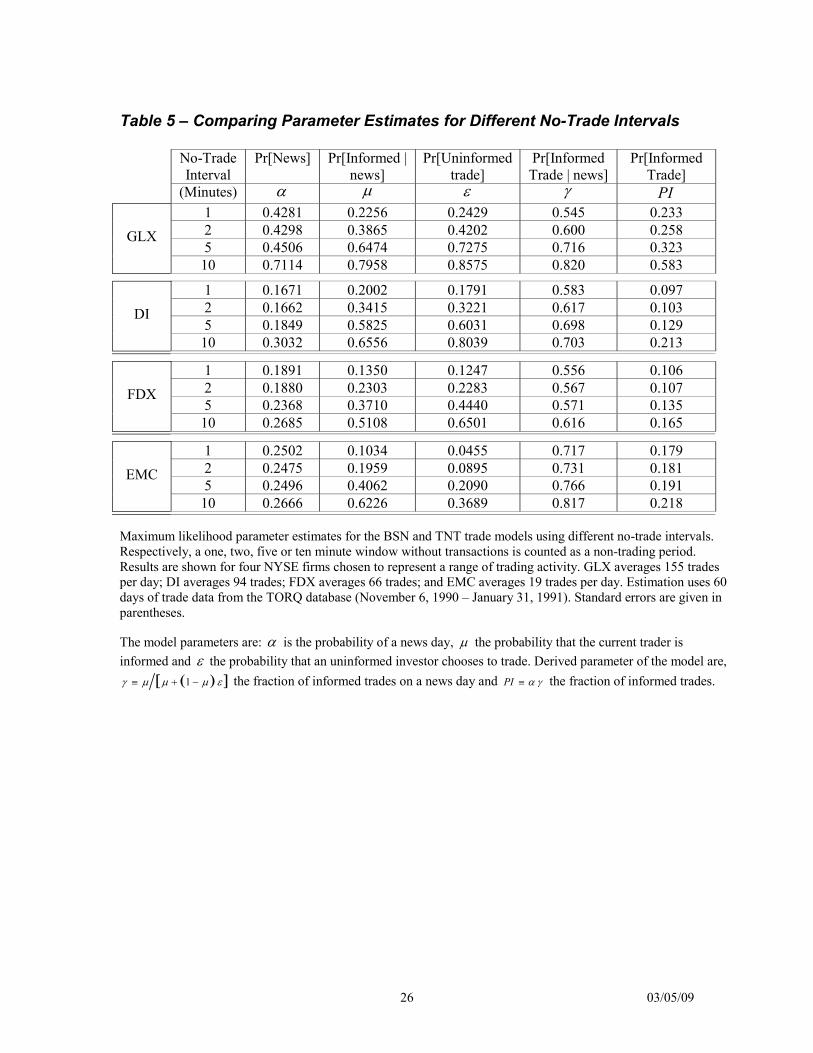
Sensitivity to Choice of No-Trade IntervalA number of specification tests will now be presented. Looking first at parameter
stability, Table 5 shows 60-day parameter estimates as the time specified for a no-trade
period varies from one minute to 10 minutes. All estimates increase with the length of a
no-trade period, especially for the 10 minute interval. Estimates of the probability of
news, � , are fairly consistent for different no-trade periods. This is expected, since �
reflects relative levels of trading from day to day, not relative levels of trading to non-
trading. The probabilities that a trader is informed on a news day, � , and that an
uninformed trader chooses to transact, � , both increase with the length of a no-trade
03/05/0910
period. This is expected, since � and � reflect levels of trading relative to trading
opportunities within each day.
Two important composite measures of trade are � , the fraction of informed trades on a
new days and PI, the fraction of informed trades. We would like the model’s estimates of
� and PI to reflect the flow of private information during a given period, without being
sensitive to the choice of a no-trade interval. Table 5 shows that the increase in the
estimates of � and PI are proportional to the length of the no-trade period. The rate of
increase is small, however, averaging 1.5% per minute for � and 1.6% per minute for PI.
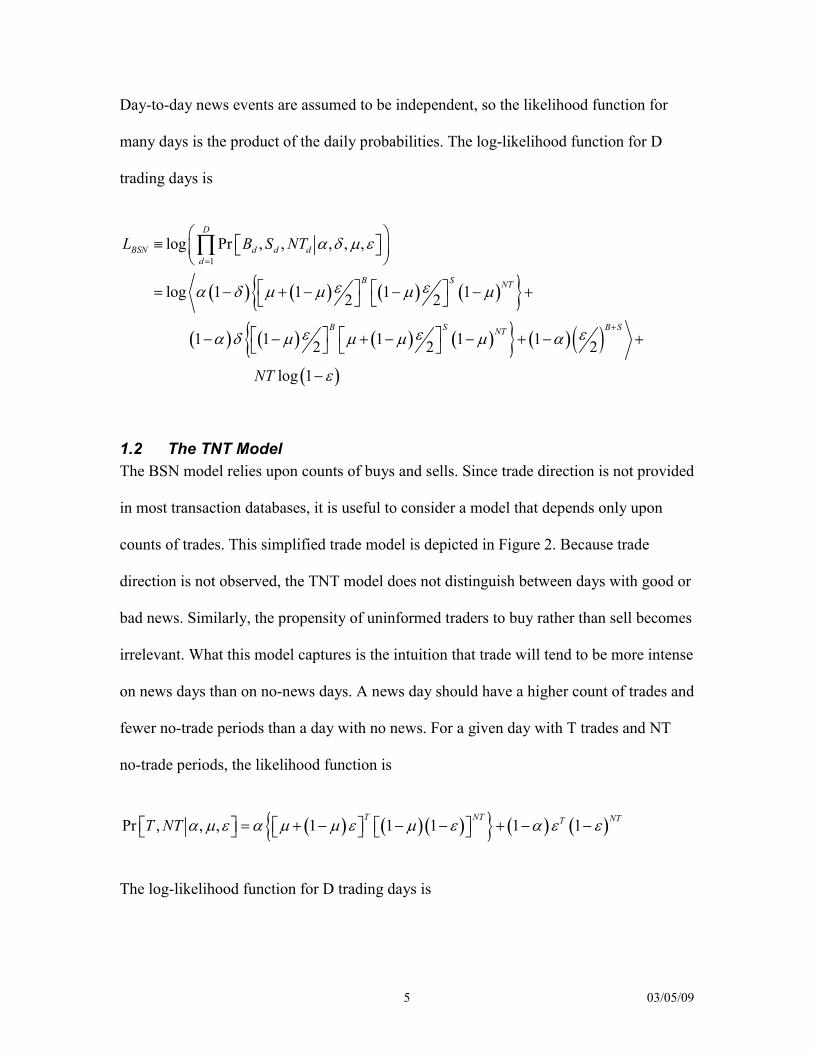
Do Intermittent News and Private Information Help Explain Trade?The TNT model explains daily trade counts in terms of intermittent news events, captured
by � , and traders with different trading propensities on days with news than days
without. One test of the model specification is to compare this model to one in which
news is not intermittent, making trading propensity fixed from day to day. Which model
is more likely given the data? The model restriction constrains the probability of news,
� , to be 1. With one parameter constrained, the likelihood ratio statistic is approximately
distributed chi-squared, with one degree of freedom. We reject the restricted model for
large values of the statistic. The five percent rejection value is 3.84. Likelihood ratio
statistics were calculated from 60-day estimates for the 20 NYSE firms. The smallest
statistic from the 20 firms was 269, soundly rejecting the restricted model. The TNT
model, with news on some days and no news on others better explains the data than a
model in which each day is a news day.
03/05/0911
Are News Events Independent from Day to Day?The two sequential trade models considered so far specify that any news about firm value
is revealed at the end of each trading day. This specification results in a model with a
very simple structure, but may be a poor representation of the information process driving
trades. Easley, Kiefer and O’Hara (EKO 1997), test and cannot reject the hypothesis that
day-to-day news is independent for their one firm, Ashland Oil. One wonders whether or
not this daily independence of news holds more generally. Although it is the quality of
the predictions from a model that matters, not the realism of the assumptions, we will test
for independence of day-to-day news events.
Testing for independence is difficult because news events are not observed. Following
EKO, we use the estimated probability of a news day, � , to infer news events. Consider
the firm, FPL, which has an � of 0.368. We assume that approximately 60 22� � � of
the trading days have news events. When FPL’s daily trade counts are sorted, the twenty-
second highest trade count is found to be 166. All days with trade count greater than 166
are categorized as news days; all days with a count less than 166 are categorized as non-
news days. Days with exactly 166 trades are ignored. For FPL there are n = 21 news days
and m = 38 non-news days. Runs of news and non-news days are counted. Under the null
of news independence, the number of runs is approximately normally distributed, with:
� �2 1mean nm n m� � � and
� � � � � �2var 2 2 1 1iance nm nm n m n m n m� �� � � � � � �
� �.
03/05/0912
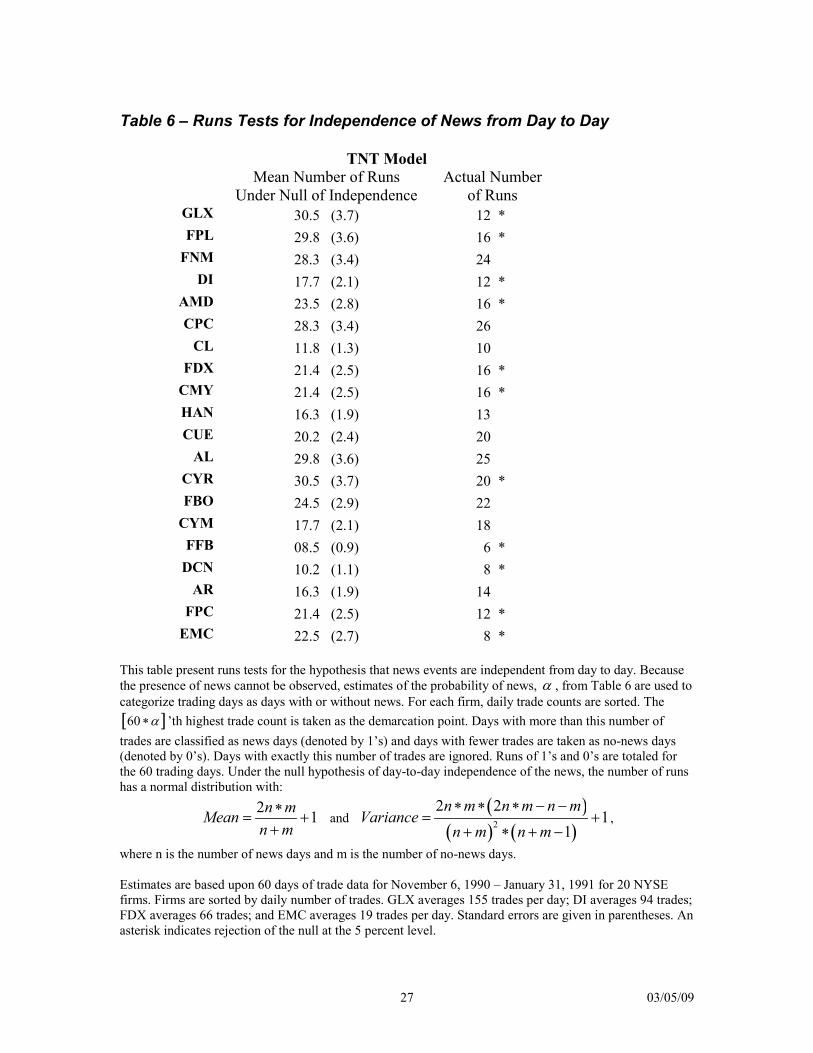
Table 6 presents the results of the runs tests on the 20 NYSE firms. The null hypothesis
of independence is rejected in 11 of the 20 firms.
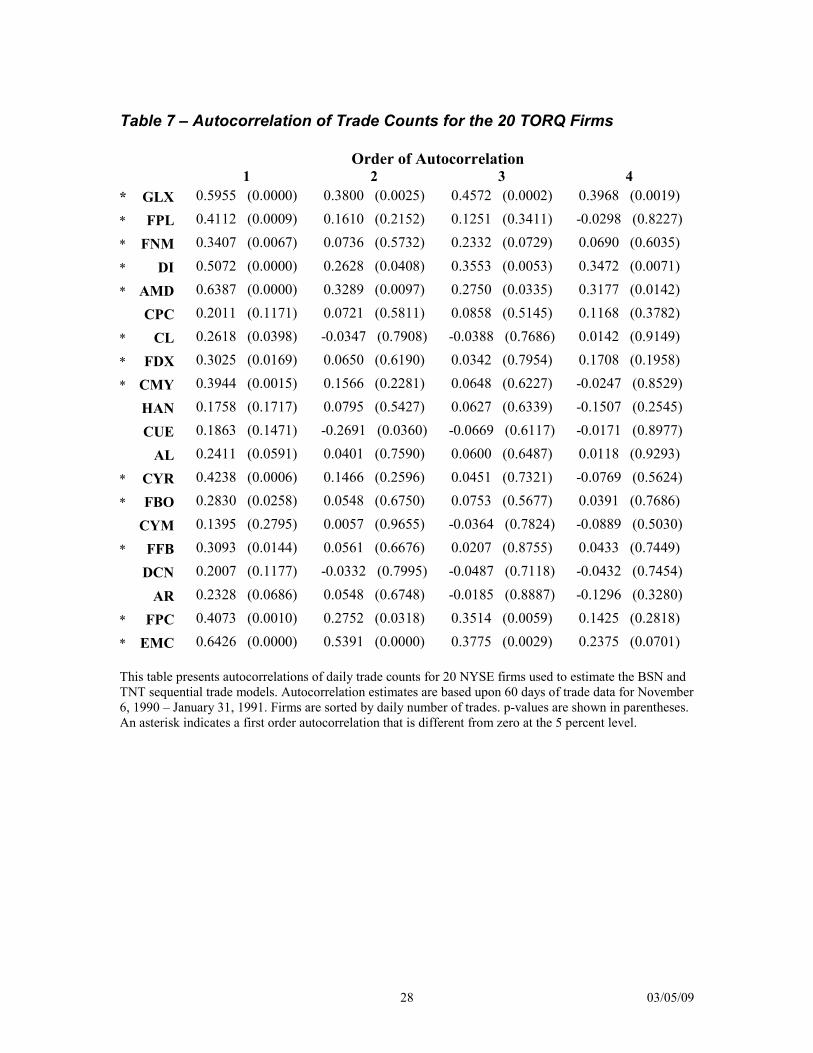
We also look at trade autocorrelations. If news is independent from day to day, there
should be no AR structure to daily trade counts. Table 7 gives the first four
autocorrelations of daily trades for the 20 firms. The first order autocorrelation is
significant for 13 of the firms. Higher order autocorrelations are significant for five of the
13. Together, the runs and autocorrelation tests suggest that news is independent from
day to day for some firms, but not for others.
The TNT model can be adapted to model news that lasts more than one day. Figure 3
depicts a generalisation of the TNT model that allows for news that is revealed to the
public at the end of two days. A new parameter in the two-day model is � , the
probability that yesterday’s news is observed today, given that there was news yesterday.
� becomes the probability that today’s news is observed today, given that there is new
today. It seems plausible that the probability of observing news that has been around for a
while may differ from the probability of observing news that has recently been generated.
Yesterday’s informed trading may have lead to a search for yesterday’s news, increasing
the likelihood of it being observed. Alternatively, after yesterday’s informed trading,
much of the value of the news may already be incorporated into prices, reducing the
incentive to search for the old news.
Extending news beyond one day makes the two-day model considerably more complex
than the one-day news model. In particular, the two-day model is dependent upon the
order of days with and without news. Although it would be possible to write out the
03/05/0913
likelihood function for the two-day TNT model, the path dependence means that the
likelihood function is no longer a product of identical daily terms. We have implemented
estimation of the model in a recursive routine. Estimation is fairly fast, but a linearisation
of the log likelihood function is used to prevent overflow and underflow during the
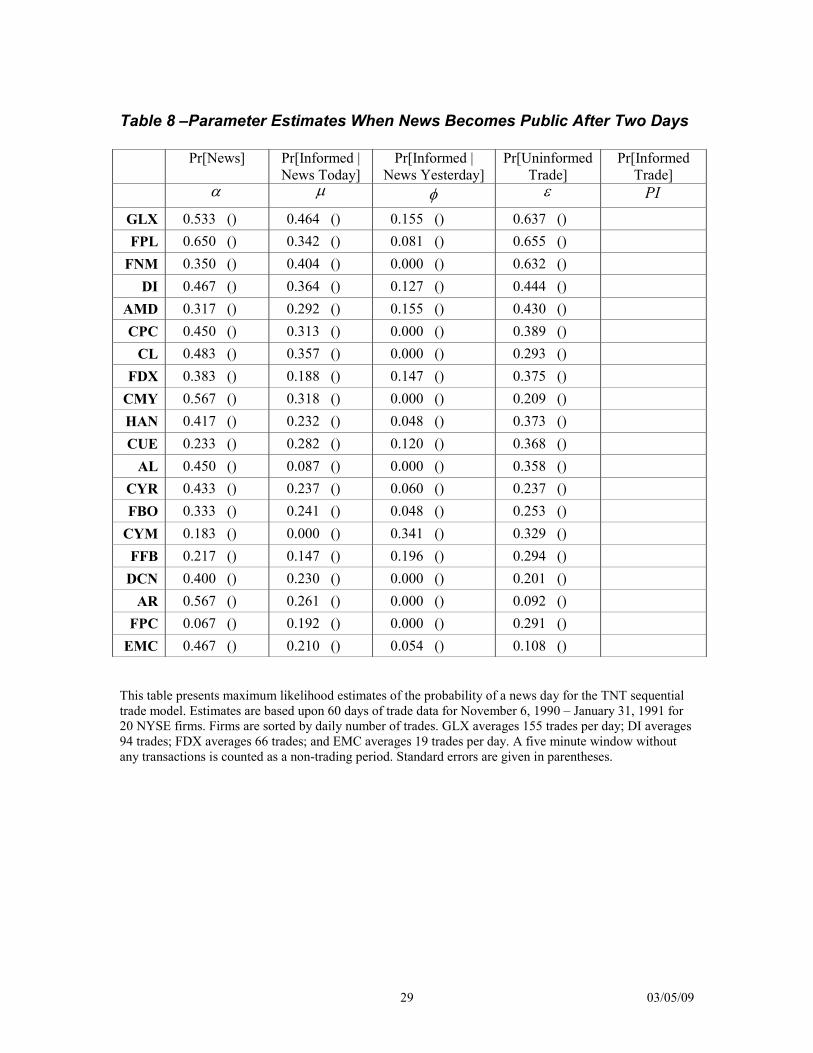
likelihood maximisation. Table 8 presents parameter estimates for the two-day TNT
model. For firms in which news is independent from day to day, we would expect to see a
low value of � , because the probability of seeing yesterday’s news today is zero if the
news was revealed after one day. � should also be smaller than the estimate for the one-
day model, because we are weighting the case in which a trader sees yesterday’s news
yesterday. For firms in which news is not independent from day to day, we expect a non-
zero � , and because yesterday’s news is explaining some of today’s trading, we again
expect � to smaller than the estimate for the one-day model.
4. Extensions: Do Bid / Ask Spreads Respond to Trading?In their 1997 paper, Easley, Kiefer and O’Hara (EKO) demonstrate an extension of the
BSN model to test whether or not informed trades concentrate in larger trade sizes. EKO
find no evidence that larger trades are more likely to be informed trades. In another
paper, we intend to use the TNT model to give this intriguing result a thorough
examination. In this article, we will demonstrate how the TNT model can be extended to
study how market makers behave in changing the bid / ask spread.
Do market makers increase the spread if they believe that informed traders are active? If
so, are the spreads increased before or after the informed trading? Can market makers
even distinguish informed from uninformed trades on average? To investigate these
03/05/0914
questions, we will use quote data in addition to transaction data to count when there is a
spread increase in conjunction with a trade and when there is no spread increase in
conjunction with a trade. Figure 4 depicts the diagram of the trading process for this
extended model. Two new parameters are added to the model. � is the probability that
the spread increases when there is an informed trade. � is the probability that the spread
increases when there is an uninformed trade.
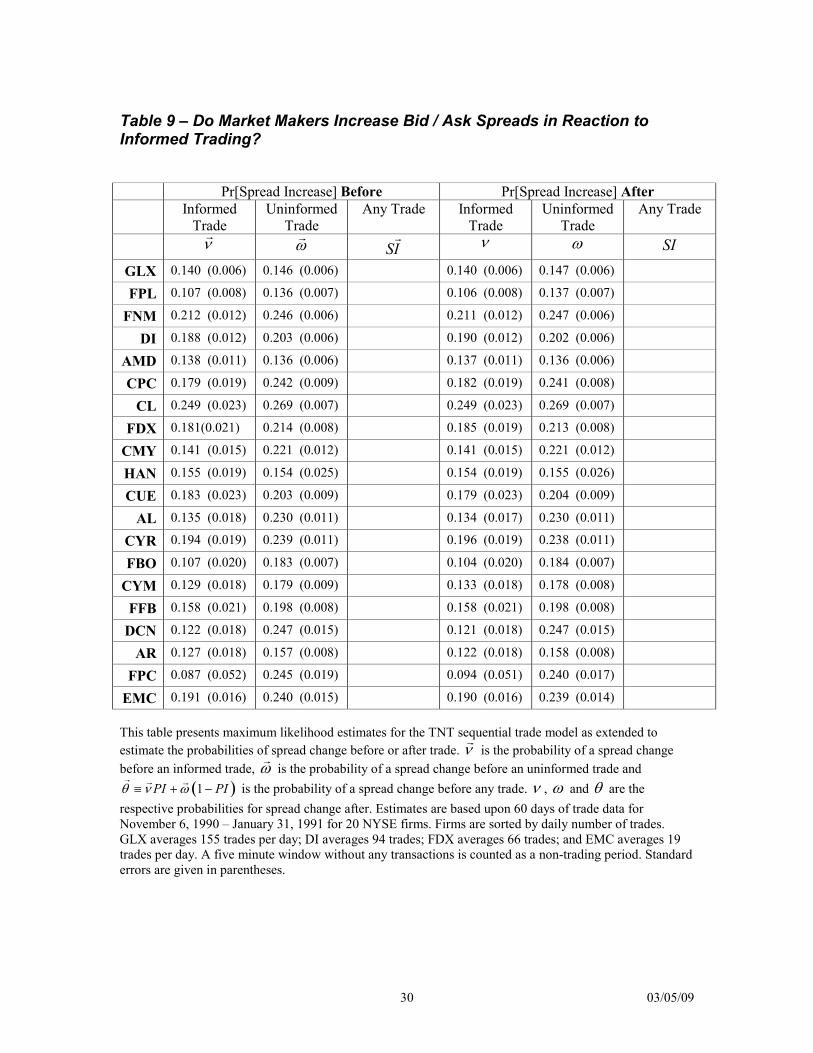
Table 9 presents 60-day estimates of the model for the 20 NYSE firms. The model
parameters have been estimated twice for each firm – for counts of spread increases
before trade, � �,� �
� � , and for counts of spread increases after trade, � �,� � .6 Table 9 also
shows SI , the probability of a spread increase when there is any trade.
Look first at the question whether the spread tends to increase more often before or after
trade. There is no evidence that �� differs from � or that �� differs from � . Spreads are
not more likely to increase before a trade than after, whether that trade is informed or not.
Look next at the question whether or not the spread tends to increase more in conjunction
with informed than uninformed trading. The estimates of the probability of an increase
with informed trades are generally smaller than the estimates for informed trades, but the
difference is significant at the 5 percent level only for CPC, CMY, AL, FBO and FPC.
These results are similar whether we consider spread changes before or after trades. It
6 The quote time series corresponds to bid and ask quotes in effect at the time of market ordertransactions. The spread is the ask minus the bid. A spread change is calculated as the spread in effect forthe market order transaction at time t minus the spread in effect for the market order transaction at time t-1.Note that the spread may change more than once or not at all between market order transactions, it is thecumulative change that is calculated here.
03/05/0915
would seem that spreads are less likely to increase in conjunction with informed than
uninformed trading.
This result is an interpretation of the data in the context of the model. News days are not
observable. Days with relatively many trades are interpreted as days with news, and some
of the trades on these days are interpreted as informed. Given this, we conclude that
market makers prefer to increase spreads around uninformed trades. One might argue that
this result makes little sense, in that it suggests that market makers have some ability to
distinguish informed from uninformed trades, and that they prefer to increase the spread
around the uninformed trades. A more likely interpretation is that the spread increases for
uninformed trades are related to the lighter trading during days without news. At any
time, proportional spreads tend to be higher for lower volume stocks. For many of the
same reasons, one might expect to see time series variation in spread, reflecting
differences in volume from day to day.
5. ConclusionsWe have demonstrated the viability and usefulness of the trade / no-trade (TNT) model
that depends only upon transaction counts to infer features of market maker and trader
behavior. The model’s assumption of intermittent news performs well compared to one in
which news arrives every day. The model’s assumption of day-to-day independence of
the news is not well supported for many firms. We have shown that the model can be
extended to allow for news that lasts for one day.
Using an extension of the basic one-day news model, we find that market makers are no
more likely to increase the bid / ask spread before a trade than after. We do find that the
03/05/0916
spread is more likely to increase around an uninformed trade than around an informed
trade. This may simply reflect higher per share costs of market making under the lower
trade volume of days with no news.
03/05/0917
ReferencesEasley, D., S. Hvidkjaer, and M. O’Hara, 2002, “Is information risk a determinant of asset returns?,”Working paper.
Easley, D., N. Kiefer, and M. O’Hara, 1996, “Cream-skimming or profit-sharing? The curious role ofpurchased order flow,” Journal of Finance, 51, 811-833.
Easley, D., N. Kiefer, M. O’Hara, and J. Paperman, 1996, “Liquidity, information and infrequently tradedstocks,” Journal of Finance, 51, 1405-1436.
Easley, D., and M. O’Hara, 1987, “Price, trade size, and information in securities markets,” Journal ofFinancial Economics, 19, 69-90.
Easley, D., and M. O’Hara, 1997, “One day in the life of a very common stock,” Review of FinancialStudies, 10, 805-835.
Glosten, L., and P. Milgrom, 1985, “Bid, ask, and transaction prices in a specialist market withheterogeneously informed traders” Journal of Financial Economics, 13, 71-100.
Lee, C., and M. Ready, 1991, “Inferring trade direction from intraday data,” Journal of Finance, 46, 733-746.
Theissen, E., 2000, “A test of the accuracy of the Lee/Ready trade classification algorithm,” Journal ofInternational Financial Markets, Institutions & Money, 11, 147-165.
03/05/0918
Appendix
Figure 1 – EO’s Discrete-Time (BSN) Model: Trade Direction Observable
Once each day, before trading starts, nature chooses either good news, bad news, or no news. � is theprobability of a day with news; � is the probability that any news is bad. Every trading period during theday, the trader in line to trade may observe the news. If so, there is an informed trade. If not, the trader mayor may not choose to make an uninformed trade. � is the probability that the trade is from an informedtrader, given a news day; � is the probability that an uninformed trader chooses to trade.
Uninformed Seller Sells
Uninformed Seller No-TradeUninformed Buyer Buys
Uninformed Buyer No-Trade
Uninformed Seller Sells
Uninformed Seller No-TradeUninformed Buyer Buys
Uninformed Buyer No-Trade
Uninformed Seller Sells
Uninformed Seller No-TradeUninformed Buyer Buys
Uninformed Buyer No-Trade
�
�
1-�
1-�
�
�
1-�
1-�
�
�
1-�
1-�
1 2
1 2
1 2
1 2
�
1-�
�
1-�
DayWithNews
�
1-�
DayWithNoNews
BadNews
�
1-�
GoodNews
Informed Trader Sells
Informed Trader Buys
1 2
1 2
Before Start ofTrading Day
DuringTradingDay
03/05/0919
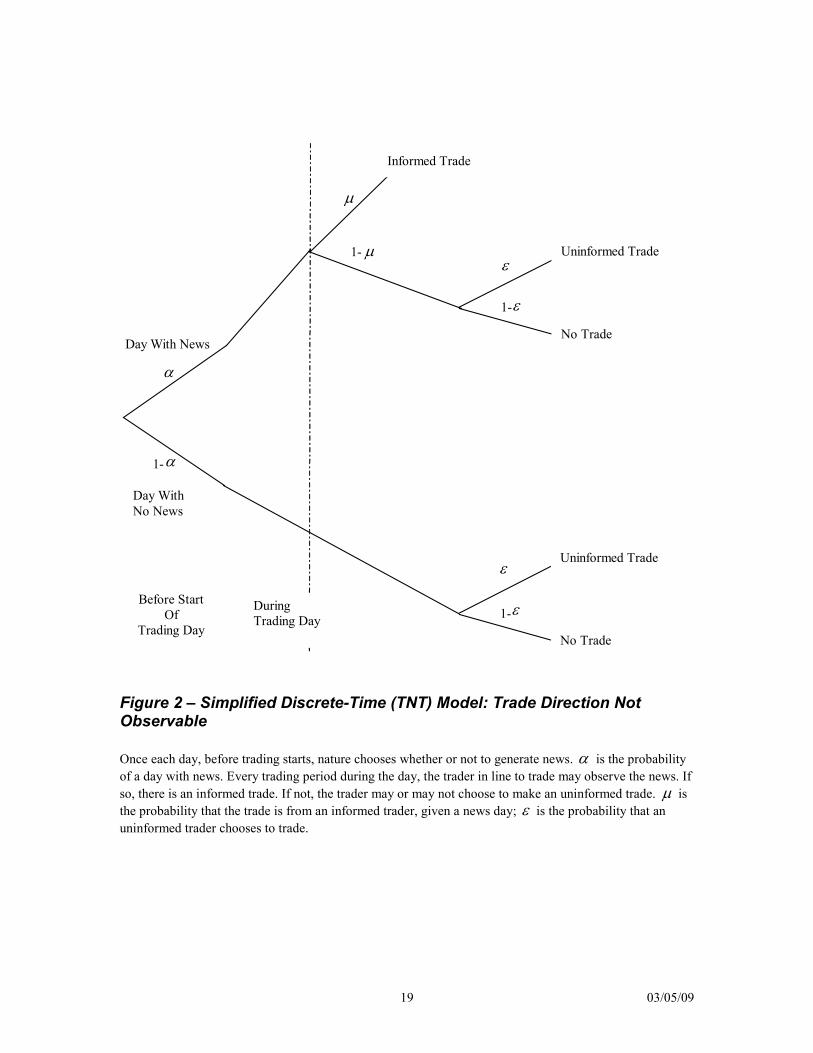
Figure 2 – Simplified Discrete-Time (TNT) Model: Trade Direction NotObservable
Once each day, before trading starts, nature chooses whether or not to generate news. � is the probabilityof a day with news. Every trading period during the day, the trader in line to trade may observe the news. Ifso, there is an informed trade. If not, the trader may or may not choose to make an uninformed trade. � isthe probability that the trade is from an informed trader, given a news day; � is the probability that anuninformed trader chooses to trade.
�
1-�
�
1-�
�
1- �
Day With News
�
1-� Day With No News
Informed Trade
Before Start Of
Trading Day
During Trading Day
Uninformed Trade
No Trade
Uninformed Trade
No Trade
03/05/0920
Before Start ofTrading Day
DuringTrading Day 1
Informed Trade
Uninformed Trade
Uninformed No-TradeInformed Trade
Uninformed Trade
Uninformed No-Trade
1 ��
�
�
1-�
1-�
�
�
1-��
Informed Trade
Uninformed Trade
Uninformed No-Trade
Uninformed Trade
Uninformed No-Trade
�
�
1-�
1-�
�
1-��
1-�
1
�
�
1-�
1-�
�
1-��
1-�
Informed Trade
Uninformed Trade
Uninformed No-Trade
Uninformed Trade
Uninformed No-Trade
Days 2+
Assume NoNews on Day 0
Represent by
Represent by
1
1
2
2
1 ��
1
2
� � � �2
1 1 1� � �� � � �
� � � �1 1 1� � �� � � �
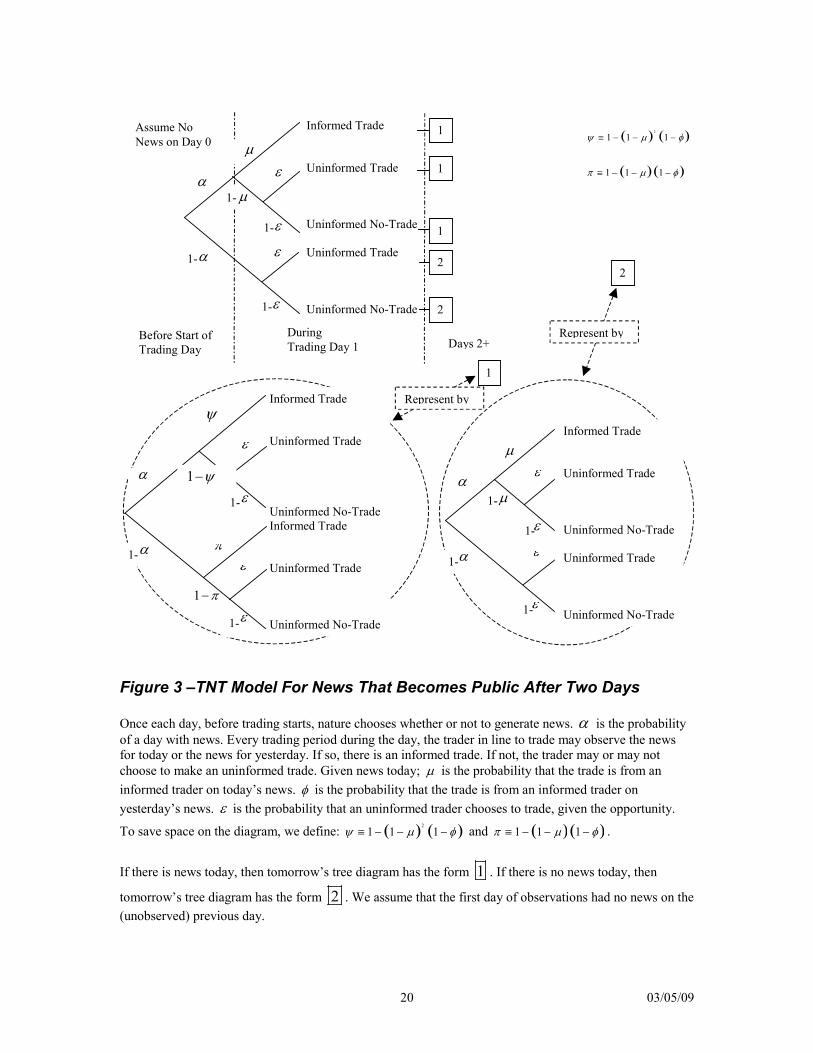
Figure 3 –TNT Model For News That Becomes Public After Two Days
Once each day, before trading starts, nature chooses whether or not to generate news. � is the probabilityof a day with news. Every trading period during the day, the trader in line to trade may observe the newsfor today or the news for yesterday. If so, there is an informed trade. If not, the trader may or may notchoose to make an uninformed trade. Given news today; � is the probability that the trade is from aninformed trader on today’s news. � is the probability that the trade is from an informed trader onyesterday’s news. � is the probability that an uninformed trader chooses to trade, given the opportunity.
To save space on the diagram, we define: � � � �2
1 1 1� � �� � � � and � � � �1 1 1� � �� � � � .
If there is news today, then tomorrow’s tree diagram has the form 1 . If there is no news today, then
tomorrow’s tree diagram has the form 2 . We assume that the first day of observations had no news on the(unobserved) previous day.
03/05/0921
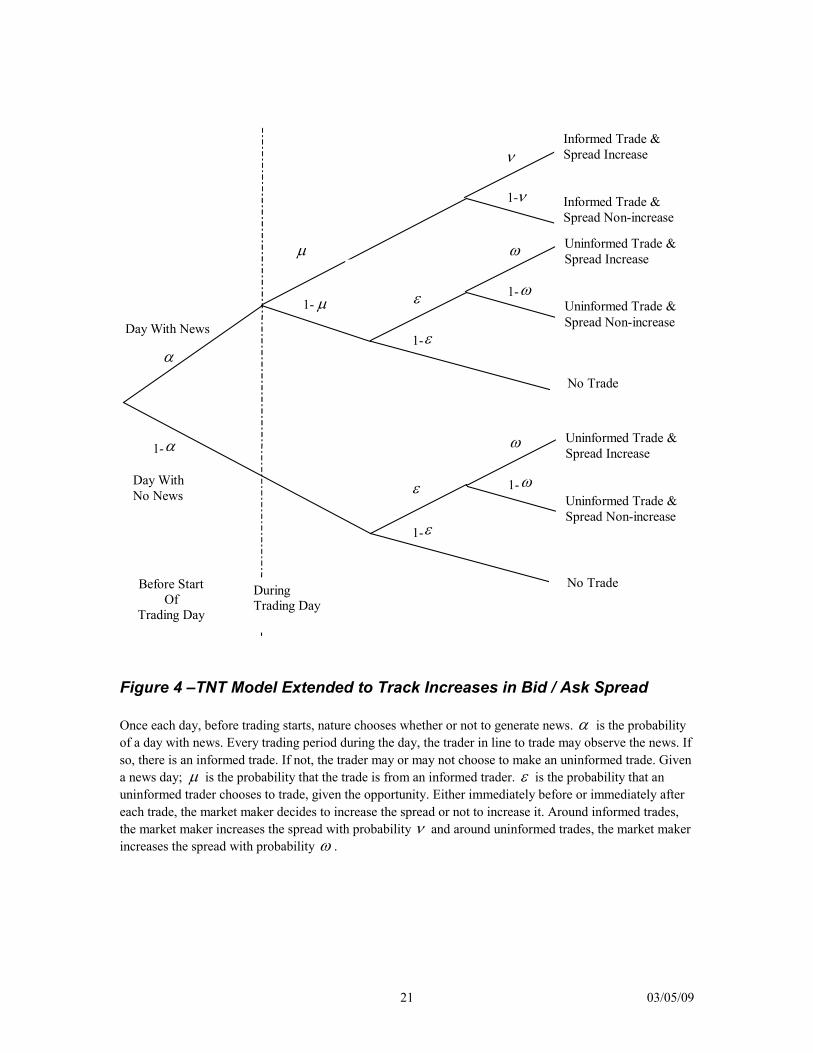
Figure 4 –TNT Model Extended to Track Increases in Bid / Ask Spread
Once each day, before trading starts, nature chooses whether or not to generate news. � is the probabilityof a day with news. Every trading period during the day, the trader in line to trade may observe the news. Ifso, there is an informed trade. If not, the trader may or may not choose to make an uninformed trade. Givena news day; � is the probability that the trade is from an informed trader. � is the probability that anuninformed trader chooses to trade, given the opportunity. Either immediately before or immediately aftereach trade, the market maker decides to increase the spread or not to increase it. Around informed trades,the market maker increases the spread with probability � and around uninformed trades, the market makerincreases the spread with probability � .
�
1-�
�
1- �
Day With News
�
1-� Day With No News
�
1-�
Before Start Of
Trading Day
During Trading Day
No Trade
�
1-�
�
1-�
�
1-�
Informed Trade & Spread Increase
Informed Trade & Spread Non-increase
Uninformed Trade & Spread Increase
Uninformed Trade & Spread Non-increase
No Trade
Uninformed Trade & Spread Increase
Uninformed Trade & Spread Non-increase
03/05/0922
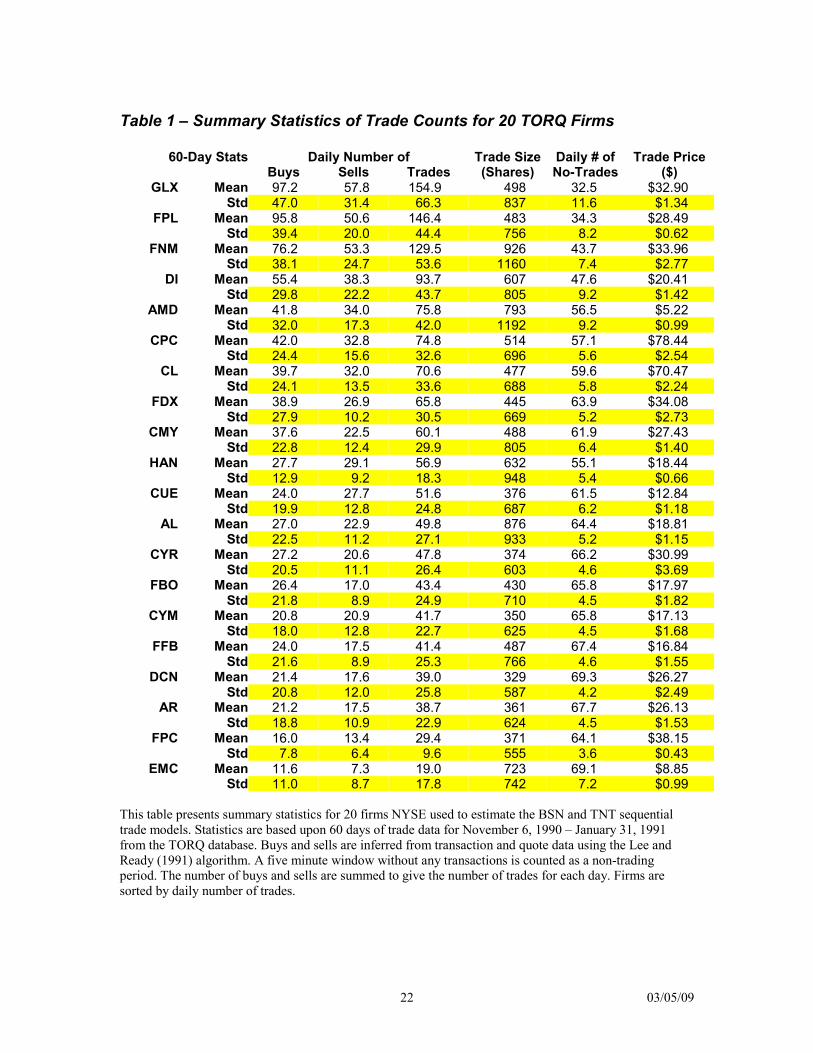
Table 1 – Summary Statistics of Trade Counts for 20 TORQ Firms
60-Day Stats Daily Number of Trade Size Daily # of Trade PriceBuys Sells Trades (Shares) No-Trades ($)
This table presents summary statistics for 20 firms NYSE used to estimate the BSN and TNT sequentialtrade models. Statistics are based upon 60 days of trade data for November 6, 1990 – January 31, 1991from the TORQ database. Buys and sells are inferred from transaction and quote data using the Lee andReady (1991) algorithm. A five minute window without any transactions is counted as a non-tradingperiod. The number of buys and sells are summed to give the number of trades for each day. Firms aresorted by daily number of trades.
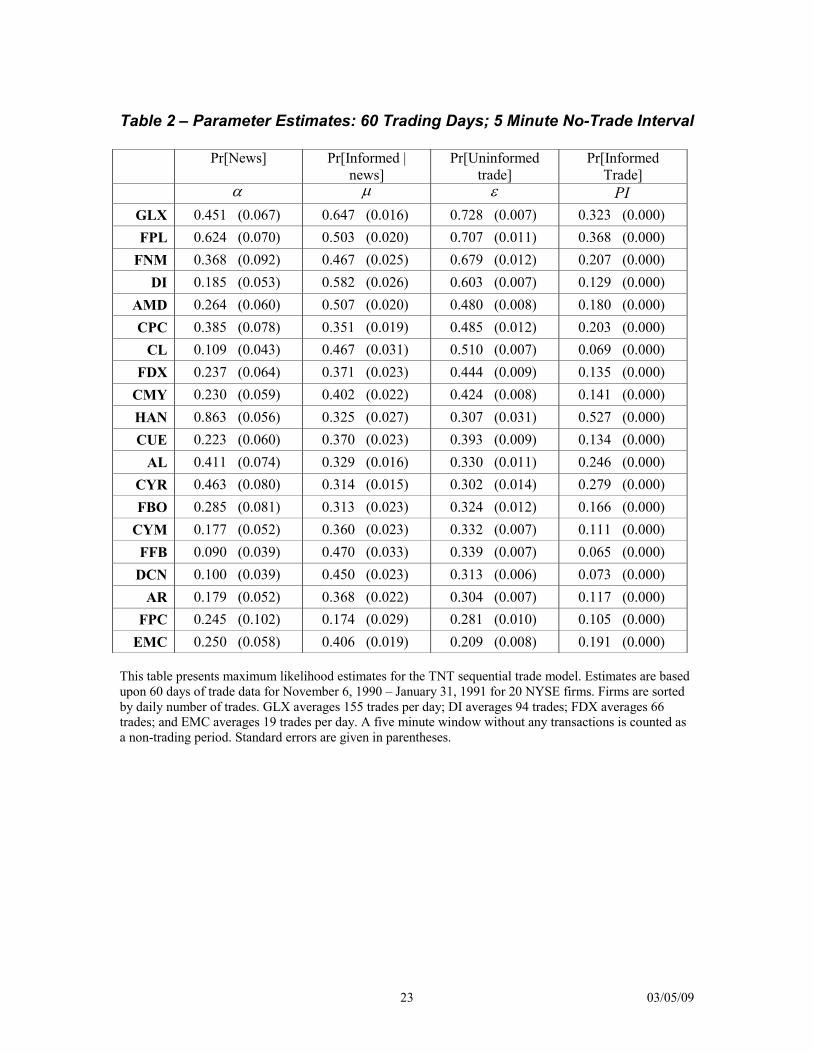
This table presents maximum likelihood estimates for the TNT sequential trade model. Estimates are basedupon 60 days of trade data for November 6, 1990 – January 31, 1991 for 20 NYSE firms. Firms are sortedby daily number of trades. GLX averages 155 trades per day; DI averages 94 trades; FDX averages 66trades; and EMC averages 19 trades per day. A five minute window without any transactions is counted asa non-trading period. Standard errors are given in parentheses.
03/05/0924
Table 3 – Comparing Parameter Estimates, with and without TradeDirection: Ashland Oil
This table presents maximum likelihood parameter estimates for the BSN and TNT sequential trademodels. Asymptotic standard errors are given in parentheses. Estimation uses 30 days of trade data forAshland Oil (October 1, 1990 – November 9, 1990) as supplied in Table 1 of EO (1987). Buys and sells areinferred from transaction and quote data using the Lee and Ready (1991) algorithm. A five minute windowwithout any transactions is counted as a non-trading period. The number of buys and sells are summed togive the number of trades for each day.
03/05/0925
Table 4 – Comparing Parameter Estimates, With and Without TradeDirection: Selected TORQ Firms
This table presents maximum likelihood parameter estimates for the BSN and TNT sequential trade modelsfor four NYSE firms chosen to represent a range of trading activity. GLX averages 155 trades per day; DIaverages 94 trades; FDX averages 66 trades; and EMC averages 19 trades per day. Estimation uses 60 daysof trade data from the TORQ database (November 6, 1990 – January 31, 1991).Estimates are shown for thefull 60 days and for the two 30-day sub-periods. Buys and sells are inferred from transaction and quote datausing the Lee and Ready (1991) algorithm. A five minute window without any transactions is counted as anon-trading period. The number of buys and sells are summed to give the number of trades for each day.Standard errors are given in parentheses.
The parameters of the models are � , � , � and � . � is the probability of a news day. Conditional onnews, � is the probability that the news is bad and � is the probability that an informed trader comesforward to trade. � is the probability that an uninformed investor chooses to trade, given the opportunity.
03/05/0926
Table 5 – Comparing Parameter Estimates for Different No-Trade Intervals
Maximum likelihood parameter estimates for the BSN and TNT trade models using different no-trade intervals.Respectively, a one, two, five or ten minute window without transactions is counted as a non-trading period.Results are shown for four NYSE firms chosen to represent a range of trading activity. GLX averages 155 tradesper day; DI averages 94 trades; FDX averages 66 trades; and EMC averages 19 trades per day. Estimation uses 60days of trade data from the TORQ database (November 6, 1990 – January 31, 1991). Standard errors are given inparentheses.
The model parameters are: � is the probability of a news day, � the probability that the current trader isinformed and � the probability that an uninformed investor chooses to trade. Derived parameter of the model are,
� �� �1� � � � �� � � the fraction of informed trades on a news day and PI � �� the fraction of informed trades.
03/05/0927
Table 6 – Runs Tests for Independence of News from Day to Day
This table present runs tests for the hypothesis that news events are independent from day to day. Becausethe presence of news cannot be observed, estimates of the probability of news, � , from Table 6 are used tocategorize trading days as days with or without news. For each firm, daily trade counts are sorted. The� �60 �� ’th highest trade count is taken as the demarcation point. Days with more than this number oftrades are classified as news days (denoted by 1’s) and days with fewer trades are taken as no-news days(denoted by 0’s). Days with exactly this number of trades are ignored. Runs of 1’s and 0’s are totaled forthe 60 trading days. Under the null hypothesis of day-to-day independence of the news, the number of runshas a normal distribution with:
2 1n mMeann m�
� �
�
and � �
� � � �2
2 21
1n m n m n m
Variancen m n m� � � � �
� �
� � � �
,
where n is the number of news days and m is the number of no-news days.
Estimates are based upon 60 days of trade data for November 6, 1990 – January 31, 1991 for 20 NYSEfirms. Firms are sorted by daily number of trades. GLX averages 155 trades per day; DI averages 94 trades;FDX averages 66 trades; and EMC averages 19 trades per day. Standard errors are given in parentheses. Anasterisk indicates rejection of the null at the 5 percent level.
03/05/0928
Table 7 – Autocorrelation of Trade Counts for the 20 TORQ Firms
This table presents autocorrelations of daily trade counts for 20 NYSE firms used to estimate the BSN andTNT sequential trade models. Autocorrelation estimates are based upon 60 days of trade data for November6, 1990 – January 31, 1991. Firms are sorted by daily number of trades. p-values are shown in parentheses.An asterisk indicates a first order autocorrelation that is different from zero at the 5 percent level.
03/05/0929
Table 8 –Parameter Estimates When News Becomes Public After Two Days
This table presents maximum likelihood estimates of the probability of a news day for the TNT sequentialtrade model. Estimates are based upon 60 days of trade data for November 6, 1990 – January 31, 1991 for20 NYSE firms. Firms are sorted by daily number of trades. GLX averages 155 trades per day; DI averages94 trades; FDX averages 66 trades; and EMC averages 19 trades per day. A five minute window withoutany transactions is counted as a non-trading period. Standard errors are given in parentheses.
03/05/0930
Table 9 – Do Market Makers Increase Bid / Ask Spreads in Reaction toInformed Trading?
Pr[Spread Increase] Before Pr[Spread Increase] AfterInformed
This table presents maximum likelihood estimates for the TNT sequential trade model as extended toestimate the probabilities of spread change before or after trade. �
�
is the probability of a spread changebefore an informed trade, �
�
is the probability of a spread change before an uninformed trade and� �1PI PI� � �� � �
�
� �
is the probability of a spread change before any trade. � , � and � are therespective probabilities for spread change after. Estimates are based upon 60 days of trade data forNovember 6, 1990 – January 31, 1991 for 20 NYSE firms. Firms are sorted by daily number of trades.GLX averages 155 trades per day; DI averages 94 trades; FDX averages 66 trades; and EMC averages 19trades per day. A five minute window without any transactions is counted as a non-trading period. Standarderrors are given in parentheses.