Inferring Urban Land Use from Satellite Sensor Images Using Kernel-Based Spatial Reclassification M.J. Barnsley and S.L. Barr Abstract Per-pixel classification algorithms are poorly equipped to monitor urban land use in images acquired by the current generation of high spatial resolution satellite sensors. This is because urban areas commonly comprise a complex spatial assemblage of spectrally distinct land-cover types. In this study, a technique is described that attempts to derive infor- mation on urban land use in two stages. The first involves classification of the image into broad land-cover types. In the second stage, referred to as spatial reclassification, the clas- sified pixels are grouped into discrete land-use categories on the basis of both the frequency and the spatial arrangement of the land-cover labels within a square kernel. The applica- tion of this technique, known as SPARK (~~~tial Reclassifica- tion erne el), is demonstrated using a SPOT-1 HRV m ultispectral image of southeast London, England. Prelimi- nary results indicate that SPARK can be used to distinguish quite subtle differences of land use in urban areas. Introduction While satellite sensor technology has been used with some success to monitor land use in images of agricultural areas, much less satisfactory results are generally reported for ur- ban scenes (Forster, 1985; Toll, 1985; Barnsley et al., 1989; Sadler and Barnsley, 1990). Initially, this disparity was at- tributed to the relatively coarse spatial resolution of early Earth-resources sensors, such as the Landsat Multispectral Scanning System (MSS) (Jackson et al., 1980; Forster, 1980). By averaging the spectral response of buildings, roads, trees, grass and other component elements of urban scenes within their large instantaneous field-of-view (IFOV), these sensors tended to produce broad, composite signals for urban areas. Consequently, it was often difficult to distinguish between different categories of urban land use in the resultant images. Moreover, the "blocky" appearance of these images inhibited accurate delineation of the urban-rural boundary. Unfortunately, the use of higher resolution data from the current generation of satellite sensors has not always yielded the improvements anticipated (Toll, 1985; Forster, 1985; Martin et al., 1988). Indeed, some studies report a reduction Remote Sensing Unit, Department of Geography, University College London, 16, Bedford Way, London WClH OAP, United Kingdom. M.J. Barnsley is presently with the Department of Geography, University of Wales Swansea, Singleton Park, Swansea SA2 8PP, United Kingdom. S.L. Barr is presently with the Department of Geography, University of Manchester, Mansfield Cooper Building, Oxford Road, Manchester MI3 9PL, United Kingdom. PE&RS August lYYG in the accuracy with which different urban land uses can be distinguished in such images, relative to that obtained using coarser resolution data (Haack et al., 1987; Martin et al., 1988). This apparently paradoxical phenomenon has been as- cribed to the problem of "scene noise" (Gastellu-Etchegorry, 1990; Gong and Howarth, 1990). In other words, as the spatial resolution of the sensor increases, individual scene elements (e.g., buildings, roads, and open spaces) begin to dominate the detected response of each pixel; therefore, the spectral response of urban areas as a whole becomes more varied, making consistent classification of land use problematic (Gastellu-Etchegorry, 1990). Although it is tempting to set this problem in the con- text of inadequate or inappropriate sensor spatial resolution, it is perhaps more accurately expressed in terms of the limi- tations of commonly used information extraction techniques; in particular, standard, per-pixel, multispectral classification algorithms. The fundamental problem involved in producing accurate land-use maps of towns and cities from remotely sensed images is that urban areas comprise a complex spatial assemblage of land-cover types, each of which may have dif- ferent spectral reflectance characteristics (Wharton, 1982a; Wharton, 1982b; Gong and Howarth, 1990; Barnsley et al., 1991; Eyton, 1993). Unfortunately, per-pixel classification al- gorithms are poorly equipped to deal with this type of spatial variability, because they assign each pixel to one of the candidate classes solely on the basis of its spectral reflec- tance properties (Woodcock and Strahler, 1987; Barnsley et al., 1991; Barnsley and Barr, 1992). The location of the pixel within the image and the relationship between its spectral response and that of its neighbors are not taken into account. A further problem for supervised, per-pixel classification is that it is extremely difficult to define suitable training sets for many categories of urban land use, due to the variation in the spectral response of their component land-cover types (Forster, 1985; Gong and Howarth, 1990; Barnsley et al., 1991). Thus, the training statistics may exhibit both a multi- modal distribution and a large standard deviation in each spectral waveband (Sadler et al., 1991). The implication of the former is that the training statistics for urban areas vio- late one of the basic assumptions of the widely used maxi- mum-likelihood decision rule, namely, that the pixel values follow a multivariate normal distribution. The effect of the latter is often to produce a pronounced overlap between ur- ban and non-urban land-use categories in the multispectral Photogrammetric Engineering & Remote Sensing, Vol. 62, No. 8, August 1996, pp. 949-958. 0099-1112/96/6208-949$3.00/0 O 1996 American Society for Photogrammetry and Remote Sensing
Transcript
Inferring Urban Land Use from Satellite Sensor Images Using Kernel-Based Spatial
Reclassification M.J. Barnsley and S.L. Barr
Abstract Per-pixel classification algorithms are poorly equipped to monitor urban land use i n images acquired by the current generation of high spatial resolution satellite sensors. This is because urban areas commonly comprise a complex spatial assemblage of spectrally distinct land-cover types. In this study, a technique is described that attempts to derive infor- mation on urban land use in two stages. The first involves classification of the image into broad land-cover types. In the second stage, referred to as spatial reclassification, the clas- sified pixels are grouped into discrete land-use categories on the basis of both the frequency and the spatial arrangement of the land-cover labels within a square kernel. The applica- tion of this technique, known as SPARK ( ~ ~ ~ t i a l Reclassifica- tion erne el), is demonstrated using a SPOT-1 HRV m ultispectral image of southeast London, England. Prelimi- nary results indicate that SPARK can be used to distinguish quite subtle differences of land use in urban areas.
Introduction While satellite sensor technology has been used with some success to monitor land use in images o f agricultural areas, much less satisfactory results are generally reported for ur- ban scenes (Forster, 1985; Toll, 1985; Barnsley et al., 1989; Sadler and Barnsley, 1990). Initially, this disparity was at- tributed to the relatively coarse spatial resolution of early Earth-resources sensors, such as the Landsat Multispectral Scanning System (MSS) (Jackson et al., 1980; Forster, 1980). By averaging the spectral response of buildings, roads, trees, grass and other component elements of urban scenes within their large instantaneous field-of-view (IFOV), these sensors tended to produce broad, composite signals for urban areas. Consequently, it was often difficult to distinguish between different categories of urban land use in the resultant images. Moreover, the "blocky" appearance of these images inhibited accurate delineation of the urban-rural boundary.
Unfortunately, the use of higher resolution data from the current generation of satellite sensors has not always yielded the improvements anticipated (Toll, 1985; Forster, 1985; Martin et al., 1988). Indeed, some studies report a reduction
Remote Sensing Unit, Department of Geography, University College London, 16, Bedford Way, London WClH OAP, United Kingdom.
M.J. Barnsley is presently with the Department of Geography, University of Wales Swansea, Singleton Park, Swansea SA2 8PP, United Kingdom.
S.L. Barr is presently with the Department of Geography, University of Manchester, Mansfield Cooper Building, Oxford Road, Manchester MI3 9PL, United Kingdom.
PE&RS August lYYG
in the accuracy with which different urban land uses can be distinguished in such images, relative to that obtained using coarser resolution data (Haack et al., 1987; Martin et al., 1988). This apparently paradoxical phenomenon has been as- cribed to the problem of "scene noise" (Gastellu-Etchegorry, 1990; Gong and Howarth, 1990). In other words, as the spatial resolution of the sensor increases, individual scene elements (e.g., buildings, roads, and open spaces) begin to dominate the detected response of each pixel; therefore, the spectral response of urban areas as a whole becomes more varied, making consistent classification of land use problematic (Gastellu-Etchegorry, 1990).
Although it is tempting to set this problem in the con- text of inadequate or inappropriate sensor spatial resolution, it is perhaps more accurately expressed in terms of the limi- tations of commonly used information extraction techniques; in particular, standard, per-pixel, multispectral classification algorithms. The fundamental problem involved in producing accurate land-use maps of towns and cities from remotely sensed images is that urban areas comprise a complex spatial assemblage of land-cover types, each of which may have dif- ferent spectral reflectance characteristics (Wharton, 1982a; Wharton, 1982b; Gong and Howarth, 1990; Barnsley et al., 1991; Eyton, 1993). Unfortunately, per-pixel classification al- gorithms are poorly equipped to deal with this type of spatial variability, because they assign each pixel to one of the candidate classes solely on the basis of its spectral reflec- tance properties (Woodcock and Strahler, 1987; Barnsley et al., 1991; Barnsley and Barr, 1992). The location of the pixel within the image and the relationship between its spectral response and that of its neighbors are not taken into account. A further problem for supervised, per-pixel classification is that it is extremely difficult to define suitable training sets for many categories of urban land use, due to the variation in the spectral response of their component land-cover types (Forster, 1985; Gong and Howarth, 1990; Barnsley et al., 1991). Thus, the training statistics may exhibit both a multi- modal distribution and a large standard deviation in each spectral waveband (Sadler et al., 1991). The implication of the former is that the training statistics for urban areas vio- late one of the basic assumptions of the widely used maxi- mum-likelihood decision rule, namely, that the pixel values follow a multivariate normal distribution. The effect of the latter is often to produce a pronounced overlap between ur- ban and non-urban land-use categories in the multispectral
Photogrammetric Engineering & Remote Sensing, Vol. 62, No. 8, August 1996, pp. 949-958.
0099-1112/96/6208-949$3.00/0 O 1996 American Society for Photogrammetry
and Remote Sensing
a) Commercial / Industrial b) Residential
F ~ - = F d i n ; ; - T = Tree; G = Grass. )
Figure 1. Simulated 3- by 3-pixel windows showing the possible distributions of land cover types for two urban land-use categories.
feature space. This may be further compounded by the fact that the mean spectral response for the urban classes will differ from those of the non-urban classes in a somewhat ar- bitrary and unpredictable manner, depending on the location of the training areas (Barnsley et al., 1991; Sadler et al., 1991).
Various attempts have been made to overcome these problems, including
The use of pre-classification image transformations and fea- ture-extraction techniques, such as median filters (Atkinson et al., 1985; Sadler et al., 1991) and various measures of im- age texture (Haralick, 1979; Baraldi and Parmiggiani, 1990; Franklin and Peddle, 1990; Gong and Howarth, 1990; Sadler et al., 1991); The incorporation of spatially referenced, ancillary data into the classification procedure (Forster, 1984; Sadler and Barns- ley, 1990; Ehlers et al., 1991; SadIer et al., 1991); The use of enhanced classification algorithms, ranging kom contextual classifiers (Gurney, 1981; Gurney and Townshend, 1983; Gong and Howarth, 1992), through knowledge-based expert systems (Mehldau and Schowengerdt, 1990; Moller- Jensen, 1990), to artificial neural networks (Hepner et al., 1990; Kanellopoulos et al., 1992; Civco, 1993; Dryer, 1993); and The application of post-classification spatial processing, rang- ing from simple majority filters to spatial (or contextual) re- classification procedures (Thomas, 1980; Wharton, 1982a; Wharton, 1982b; Gurney and Townshend, 1983; Gong and Howarth, 1990; Whitehouse, 1990; Guo and Moore, 1991; Gong and Howarth, 1992; Wang and Civco, 1992a; Wang and Civco, '1992b; Eyton, 1993).
However, not all of these techniques directly address the problem of inferring land use from a complex spatial mixture of spectrally distinct land-cover types. For example, pre-clas- sification spatial filtering attempts to circumvent the problem by suppressing some of the spatial variability within the im- age. This is achieved only at the expense of a reduction in the effective spatial resolution of the data set. It also pro- duces somewhat arbitrary mean vectors for urban land use categories by aggregating the detected spectral responses of their component land-cover types.
Of the other techniques, spatial (or contextual) reclassifi- cation represents a comparatively simple way to examine the spatial variation in land cover in remotely sensed images, and is easy to implement in most image processing systems. Spatial reclassification techniques divide the classification process into two stages: the first involves a standard, per- pixel classification of the scene; the second involves some form of post-classification spatial processing of these data.
Use of this procedure to infer urban land use from the spa- tial arrangement of land cover was first suggested by Whar- ton (1982a; 1982b). The assumption underlying this approach is that individual categories of land use have characteristic spatial mixtures of spectrally distinct land cover types that enable their recognition in high spatial resolution images (Wharton, 1982a; Wharton, 1982b; Barnsley and Barr, 1992). For example, residential districts might be characterized by the intermixing of roofs, roads, and gardens.
Spatial reclassification can be performed in one of two ways. The k s t , referred to as kernel-based spatial reclassifi- cation (Gurney and Townshend, 1983; Barnsley and Barr, 1992), involves passing a simple convolution kernel across the land-cover image. In the second, referred to as object- based spatial reclassification (Gurney and Townshend, 1983), discrete "objects" (i.e., groups of adjacent pixels with the same class label) are identified within the initial image seg- mentation: information on the size, shape, and spatial ar- rangement of these objects is subsequently used to determine the nature of the land use in different parts of the image (Barr, 1992; Barr and Barnsley, 1993; Barnsley et al., 1993). In this paper, we describe a kernel-based procedure, referred to as SPARK ( ~ ~ ~ t i a l ~eclassification ern el). SPARK examines both the frequency and the spatial arrangement of class (land-cover) labels within a square kernel. This technique is tested using a subscene extracted from a SPOT-1 HRV multi- spectral image of south-east London, England.
SPARK: A SPAtial Reclassification Kernel
Background The work by Wharton (1982a; 1982b) provides an early ex- ample of kernel-based spatial re-classification, in which the initial low-level segmentation of the image is performed us- ing a standard, unsupervised classification algorithm. The frequency of different land-cover types within each n- by n- pixel region is then calculated by convolving a simple, rec- tangular kernel with the classified image. The land use associated with the pixel at the center of the kernel is de- rived using an unsupervised, non-parametric clustering pro- cedure applied to these frequency data. Similar techniques have been used more recently by Whitehouse (1990), Guo and Moore (1991), Gong and Howarth (1992), and Eyton (1993); although, in these studies, with the exception of Eyton (1993), the frequency distribution of land-cover types surrounding each pixel is compared with those of known ar- eas of the candidate land-use categories.
Although the method developed by Wharton examines the frequency with which different class labels occur within the kernel, it does not account for differences in their spatial arrangement. The limitation that this imposes is evident in the following example. Consider two separate 3- by 3-pixel windows, each of which has four pixels labeled as the land- cover class "Building." In an industrial or commercial dis- trict, where these might represent a single large factory or warehouse, the pixels are likely to be clustered together in a block (Figure la). By contrast, in a residential area, where the same class labels might represent individual houses, the "Building" pixels might be arranged in a line (terraced hous- ing) or might be physically separate (detached housing) (Fig- ure lb). However, a procedure which simply calculates the frequency of different class labels within these windows will have no means of distinguishing these two conditions. The example illustrates the need to find a reliable method for re- cording both the frequency and the spatial arrangement of class labels within a given section of the image. One way to do this is to record the number of times that different class labels occur next to one another within a pre-defined, mov-
Jn vertex Adjacency
"L Events
Edge I Adjacency Events
Figure 2. Adjacency events in a 3- by 3-pixel win- dow.
there are several important differences between SPARK and these indices. First, unlike the BCM, the number of elements in SPARK'S adjacency-event matrix is independent of the ker- nel size. Second, SPARK records information on the precise nature of each adjacency event, whereas the BCM simply notes whether adjacent pixels have the same or different class labels. Third, unlike contagion, SPARK examines adja- cency between pixels connected vertex-to-vertex, as well as edge-to-edge. Finally, SPARK produces values ranging between 0 and 1, irrespective of the number of classes (cf., contagion).
Assigning Pixels to Land-Use Categories Using SPARK The land use category, k, for a given pixel is determined by comparing its adjacency-event matrix, M, with those derived from representative sample areas of the candidate land-use categories; the latter will be referred to as "template" matri- ces, T,. Note that the sample areas used to generate the
ing window. A simple technique to achieve this, referred to template matrices are the same size as the spatial reclassifi- as the s ~ ~ t i a l Reclassification erne el (SPARK), is described in cation kernel. Multiple template matrices can be defined for this paper. each land use. These may either be used independently or be
pooled to produce an "average" template matrix. The advan- The SPAtial Reclassification Kernel (SPARK) tage of using a series of independent templates for a single SPARK operates by examining pairs of adjacent pixels within land use is that subtle variations in the spatial arrangement a square kernel (i.e., those connected along an edge or by a of its constituent land-cover types at different locations vertex), the size of which is selected by the user (Figure 2). within the image can be taken into account. However, it also The class label associated with each pixel defines the nature results in a linear increase in computation time. On the other of the "adjacency event." For example, contiguous pixels la- hand, use of pooled or "average" template matrices may re- beled "Building" and "Tree," respectively, produce a Build- sult in overlap between land-use classes in "adjacency ing-Tree adjacency event. Note that each pair of pixels pro- space." duces a single adjacency event, so that the order of the labels As the spatial reclassification kernel is passed over the is not significant: i.e., the adjacency events "Tree-Building3' image, the current adjacency-event matrix is compared with and "Building-Tree" are identical. Thus, in Figure l a there each of the template matrices using Equation 2: i.e., are six Building-Building adjacency events, four of Building- Tree, five of Building-Grass, and so on. By comparison, al- \i C C
though the window in Figure l b contains exactly the same Ak = 1 - 0.5NZ C (Mjj - Tk,j)Z i=1 I = ]
(2 J number of pixels belonging to each class, there are only three Building-Building adjacency events, but six of Build- ing-Tree. O < A k < l (3)
In practice, SPARK is convolved with the land cover image to produce an adjacency-event matrix, M, for each where MZj is an element of the current adjacency-event ma-
pixel: i.e., trix, Tk,, is the corresponding element of the template matrix for land-use category k, N is the total number of adjacency
f i ~ f i ~ f i 3 .om fii events in the kernel (determined by the kernel size, e.g., N =
M ( Iz2 : :: j 20 for a 3- by 3-pixel kernel, N= 72 for a 5- by 5-pixel ker- nel; recall that a pair of adjacent pixels produces a single ad- jacency event), and C is the number of land-cover classes in the image.
The term A, can be thought of as an index of similarity The value of each element, f;,, of the matrix denotes the fre- between the current adjacency-event matrix and the template quency with which pixels belonging to class i are adjacent to matrix for land-use category k. Thus, a value of 1.0 indicates those belonging to class j, for the current position of the ker- a perfect match with one of the land-use templates, while a riel. The number of elements in M is determined by the num- value of 0.0 indicates no match. The pixel at the center of ber of classes, C, in the image and is therefore independent the kernel is, therefore, assigned to the land-use category k of the kernel size. Note that we only consider the upper tri- for which A, is maximized. A user-specified threshold can be angular elements, because M, = Yi. For most studies, where Set to Prevent pixels being assigned to a land-use category on the number of land-cover classes is reasonably small, this the basis of a weak match between the measured adjacency- represents an efficient means of storing information about the event matrix and a land-use spatial arrangement of the land-cover types within the image.
shows the adjacency-event matrices for the TABLE 1. ADJACENCY-EVENT MATRICES FOR SIMULATED 3- BY P PIXEL WINDOWS 3- by 3-pixel windows presented in Figure 1. SHOWN IN FIGURES 1 A AND l B , RESPECTIVELY.
The adjacency-event matrix, M, described above, is simi- lar in some respects to the spatial-dependency (or co-occur- rence) matrix devised by Haralick (1979), though here we deal with class labels rather than with raw digital numbers (DN). It is also closely related to several of the measures of spatial variability used in landscape ecology, notably "Conta- gion" (Robinove, 1986; Turner, 1989) and the Binary Com- parison Matrix (BCM) developed by Murphy (1985). However,
PE&RS August 1996 951
L
TABLE 2. CONFUSION MATRIX FOR PER-PIXEL IANDCOVER CLASSIFICATION.
Average Accuracy 97.09% Overall Accuracy 97.29% Kappa Coefficient (x100) 93.0%
Test Area and Satellite Sensor Data To test SPARK, we selected an area to the southeast of London, England, covering the borough of Bromley. This area encom- passes various types of urban land use, ranging from densely occupied early 20th century housing in the northwest, through major shopping areas and inter-war industrial areas in the center, to low-density suburbs in the southeast. Surrounding the urbanized area are very large tracts of open country, many of which are statutorily protected green belt lands.
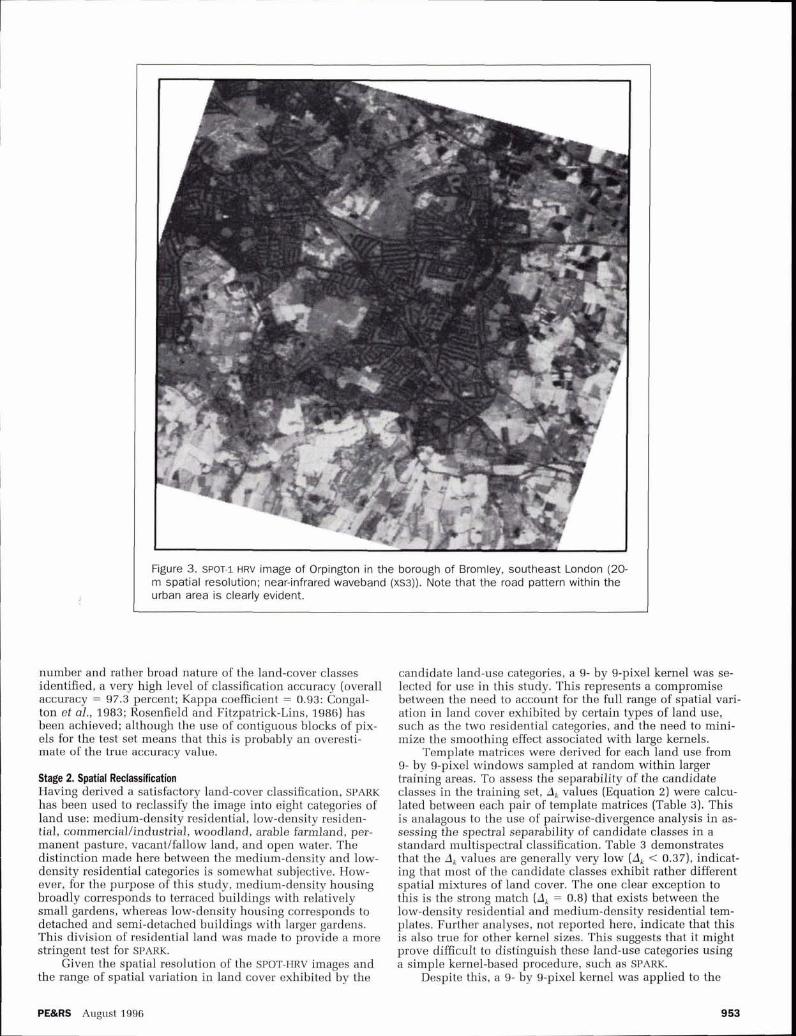
The image data used in this investigation were extracted from a cloud-free, multispectral (XS) SPOT-1 HRV image of London, England (scene 32, 246; +22.46') acquired on 30 June 1986 (Figure 3). In particular, a 512- by 512-pixel sub- section (covering an area of approximately 10 km by 10 km) of the full image, centered on the town of Orpington, was se- lected for detailed study. This area exhibits a complex spa- tial pattern of land cover and land use, providing a stringent test for both conventional and alternative classification tech- niques. The image data were geometrically corrected to con- form to the U.K. national grid and were resampled using nearest-neighbor interpolation prior to further analysis.
Results
Stage 1: Initial Land-Cover Classification. The first stage in the spatial re-classification procedure is the production of an initial land-cover map from the remotely sensed image. A variety of techniques can be used for this purpose, including unsupervised multispectral classification, region growing, and split-and-merge procedures (Chen and Pavlidis, 1979; Mather, 1987; Li and Muller, 1991). Although most other studies of spatial reclassification have tended to make use of clustering algorithms at this stage, a supervised maximum-likelihood algorithm was employed in this investi- gation. This is because it is believed to offer the greatest control over both the number and the nature of the classes defined. In this respect, seven broad land-cover classes have been identified in the Orpington subscene: SMALL STRUC- TURE, LARGE STRUCTURE, TREE, CROP, GRASS, SOIL, and WATER. The SMALL STRUCTURE class corresponds to roads and build- ings within the residential districts of the urban area; no at- tempt has been made to distinguish between these two surfaces, due to the difficulty in identifying pure pixels of ei- ther surface at this spatial resolution. Training areas for a separate class, referred to as LARGE STRUCTURE, have also
been identified on the basis of a pronounced contrast be- tween the spectral properties of these areas and those of the SMALL STRUCTURE class. Detailed examination of the digital image (Figure 3) and the corresponding Ordnance Survey 1: 10,000-scale base maps suggests that the LARGE STRUCTURE class corresponds to large buildings, such as factories, ware- houses, and hospitals, which often have large, flat concrete roofs; these have a much higher reflectance at visible wavelengths than, say, the slate and tile roofs and tarmac roads found in the residential districts. The remaining clas- ses are reasonably self-explanatory. However, it is worth not- ing that the GRASS class incorporates regions of open space (i.e., gardens and recreational land) within the urban area, as well as fields of permanent pasture lying outside it. Simi- larly, the CROP class incorporates, and is dominated by, areas of wheat and barley; no attempt has been made to distin- guish between these two crops in this particular study.
Irregularly shaped regions, sampled systematically within the image, have been used to define several training areas for each of the candidate land-cover classes. A second set of regions has been used to define an independent test set. Some difficulty was experienced in creating the training and testing sets for the SMALL STRUCTURE, WATER, and LARGE STRUCTURE classes. In the case of WATER and LARGE STRUC- TURE, this was because of their relatively limited areal ex- tent, while for the SMALL STRUCTURE class it was primarily due to the comparatively narrow, elongated regions that it forms. Consequently, the number of pixels used to train and to test these classes is quite small (Table 2).
A very low rejection threshold has been set for the maxi- mum-likelihood algorithm (> 5 standard deviations, i.e., < 0.001 percent pixels rejected) to produce an image with no unclassified pixels. This is because an adjacency event in- volving a NULL class pixel (hereafter referred to as a NULL-ad- jacency event) presents a problem at the reclassification stage. More specifically, a NULL-adjacency event may obscure the true spatial pattern of land-cover types present within the kernel. Thus, a SMALL STRUCTURE-NULL adjacency event may, in reality, represent SMALL STRUCTURE-SMALL STRUC- TURE or SMALL STRUCTURE-GRASS, and so on. Moreover, where there is more than one NULL-adjacency event within the kernel, it may be impossible to determine the land use at that location.
The results of the initial classification are presented in Table 2 and Figure 4. Not surprisingly, given the limited
August 1996 PE&RS
Figure 3. SPOT-1 HRV image of Orpington in the borough of Bromley, southeast London (20- m spatial resolution; near-infrared waveband (xs3)). Note that the road pattern within the urban area is clearly evident.
number and rather broad nature of the land-cover classes identified, a very high levcl of classification accuracy (overall accuracy = 97.3 percent; Kappa coeffirient = 0.93: Congal- ton et al., 1983; Rosenfield and Fitzpatrick-Lins, 1986) has been achieved; although the use of contiguous blocks of pix- els for the test set means that this is probably an overcsti- mate of the true accuracy valrre.
Stage 2. Spatial Reclassification Having derived a satisfactory land-cover classification, SPARK has been used to reclassify the imagc into eight categories of land use: medium-density residential, low-density residen- tial, commercial/industrial, woodland, arable farmland, per- manent pasture, vacantlfallow land, and open water. The distinction made here between the medium-density and low- density residential categories is somcwhat subjectivc. How- ever, for the purpose of this studp, medium-density housing broadly corresponds to terraced buildings with relatively small gardens, whereas low-density housing corresponds to detached and semi-detached buildings with larger gardons. This division of residential land was ~ n a d e to provide a more stringent test for SPARK.
Given the spatial resolution of the SPOT-I-IRV images and the range of spatial variation in land cover exhibited by the
PE&RS August 1996
candidate land-use r:ategories, a 9- by %pixel kernel was se- lectfxi for nse in this study. This represents a compromise between the need to account for the full range of spatial vari- ation in land cover exhibited by certain types of land use, such as the two residential categories, and the need to mini- mize the smoothing effect associated with large kernels.
Template matric:es were derived for each land use from 9- by 9-pixel windows sampled at random within larger training areas. To assess the separability of the candidate classes in the training set, A, values (Equation 2) were calcu- lated between each pair of template matrices (Table 3) . This is analagous to the use of pairwise-divergence analysis in as- sessing the spectral separability of candidate classes in a standard multispectral classification. Table 3 demonstrates that the A, values are generally very low (A, < 0.37), indicat- ing that most of the candidate classes exhibit rather different spatial mixtures of land cover. The one clear exception to this is the strong match (A, = 0.8) that exists between the low-density residential and nledium-density residential tem- plates. Further analyses, not reported here, indicate that this is also true for other kernel sizes. This suggests that it might prove difficult to distinguish these land-use categories using a simple kernel-based procedure, such as SPARK.
Despite this, a 9- by %pixel kernel was applied to the
land-cover image in an attempt to identify all eight land-use categories outlined above (Figure 5). The reclassification ac- curacy was tested using an independent set of sample areas. The land use in each of these regions was initally deter- mined from recent Ordnance Survey 1:10,000-scale base maps and was subsequently verified through field observa- tion. Table 4 indicates that SPARK ~erforms very well for all of the candidate land-use categories using a 9- by 9-pixel kernel (overall accuracy = 96.86 percent, Kappa coefficient = 0.921: Congalton et al., 1983; Rosenfield and Fitzpatrick- Lins, 1986); even the two residential classes, whoseAtemplate matrices seemed so similar, appear to be separable in prac- tice.
In addition to examining the standard classification ac- curacv table (Table 4), it is instructive to analyze the 4, val- ues associated with each pixel in Figure 5 (i.&., the strength of the match between the adiacencv-event matrix for that pixel and the template matrix for the land-use category to which it was assigned). This is important because we need to be certain that n&e of the pixels fn the image has been as- siened to a eiven land use on the basis of a weak match, be- " " cause this would reduce our confidence in the resultant land-use map. The results of this analysis are presented in Figures 6 and 7 . These indicate that 4; > 0.5 (i.e., a good match) for 99 percent of the image, and 4, > 0.75 (i.e., a strong match) for approximately 55 percent of the image.
Even where a pixel exhibits a very strong match with one of the template matrices, our confidence in the land use category to which it is assigned may be reduced if that pixel also displays a similarly high 4, value for one or more of the other categories. This situation is most likely to arise where the template matrices for the candidate classes are them- selves similar, as was shown to be the case in this study for two of the three urban categories (Table 3). To evaluate the significance of this effect, sample areas of these three land uses were identified within the image. The 4, values were extracted from each sample area for all three template matri- ces; summary statistics are presented in Table 5. A differ- ence-of-means test (t-test) was used to examine whether the average 4, value for a given sample area was significantly higher for the template matrix of the corresponding land use than for either of the other template matrices. This was, in- deed, found to be the case at the 0.01 significance level (i.e., 99 percent confidence level) for all three sample areas.
Small Structure
Figure 4. Land-cover classification of the Orp~ngton sub- scene generated using a standard per-pixel, maxlmum- likelihood algorithm.
TABLE 3. THE Ax VALUES BETWEEN TEMPLATE MATRICES FOR 9 - BY !&PIXEL KERNEL
Figure 5 . Land-use map produced using the kernel-based spatial reclassification scheme (SPARK) with a 9- by 9- pixel kernel.
Discussion This paper has examined the development and application of a kernel-based spatial reclassification procedure (SPARK) de- signed to infer information on land use from the spatial ar- rangement of land-cover types within an image. A significant feature of this procedure is that it provides a confidence sta- tistic (A,) for each pixel in the output (land-use) image. Pre- liminary results obtained using SPARK have proved very encouraging. In particular, it has proved possible to distin- guish quite subtle differences in urban land use, notably, two types of residential land that differ principally in terms of housing density, within a subscene extracted from a SPOT- HRV multispectral image of southeast London, England.
Despite this, the basic SPARK algorithm could be im- proved in two ways: first, by employing different kernel sizes in different parts of the image, and second, by taking account of the "likelihood" (probability) values associated with the class labels in the land-cover image. In terms of the former, it should be noted that, while a small kernel is generally preferable for non-urban areas (to minimize the smoothing effect associated with larger kernels), a large kernel is usually required to represent the full spatial variability of land cover in urban districts. This issue might be addressed through the
PE&RS August 1996
Figure 6. Image showing A, values produced using SPARK with a 9- by 9-pixel kernel applied to the land-cover map of the Orpington sub-scene. High values indicate a good match between the current adjacency-event matrix and one of the land-use templates; low values indicate a weak match.
Delta-k Value
Figure 7. Cumulative area (%) of land-use image versus A, value.
development of an adaptive SPARK, where the size of the ker- nel varies according to its position within the image. This, in turn, would require some means of determining the most ap- propriate kernel size at any given location. Possible options include
the use of image texture measures, with larger kernels em- ployed over spectrally heterogeneous regions of the image; or
TABLE 4. CONFUSION MATRIX FOR LANDUSE RECLASSIFICATION USING SPARK (9- BY 9-PIXEL KERNEL)
Size of Training Set 1 484 224 36 80 72 126 77 15
Average Accuracy 97.98% Overall Accuracy 96.86% Kappa Coefficient (%) 92.1%
ommerical 1 Mean
TABLE 5. THE A, VALUES OBTAINED FOR SAMPLE AREAS OF KNOWN LAND USE the accuracy of the initial land-cover classification. The de- A N D THREE "URBAN" TEMPLATE MATRICES. gree of sensitivity has not been assessed in this paper, but
will be the subject of future study. This might be achieved by providing SPARK with several land-cover images of the same scene, produced using slightly different training sets or, possibly, different classification algorithms. It will also be important to examine SPARK'S dependence on both the num- ber and nature of the candidate land-cover classes used at this stage.
Finally, although SPARK has proved successful with 20- m-resolution data, the range of spatial scales over which it is applicable has yet to be determined. This will be controlled by the interaction between the spatial resolution of the sen- sor and the spatial variation in land cover in the correspond- ing scene. At one extreme, SPARK will cease to be applicable where the spectral response of several scene elements is av- eraged over the IFOV of the sensor, to produce a homogene- ous, composite signal. For most urban areas in the United Kingdom, this limit is approached in image data acquired by sensors such as the Landsat Multispectral Scanning System (MSS). The other limit of applicability is more difficult to de-
the use of ancillary data [e.g., previous land-use classifica- tions of the study area) to divide the image into discrete seg- ments for separate processing using different kernel sizes.
The second potential improvement would be to take ac- count of the "likelihood" (probability] that each pixel in the land-cover image belongs to the cover type indicated by its class label. This information might be obtained directly from the maximum-likelihood algorithm used to generate the land- cover image. The product of the "likelihood" values for adja- cent pixels might then be used to establish a probability value for that particular adjacency event. For example, con- tiguous pixels labeled "Built" and "Tree" with, respectively, likelihood values of 0.8 and 0.7 would produce a Built-Tree adjacency event with a probability value of 0.56. This infor- mation might, in turn, be used to modify the measured adja- cency-event matrix.
In pursuing this point, it is worth noting that any tech- nique which attempts to infer land use by examining the spatial pattern of land cover in an image will be sensitive to
fine.
Conclusions A number of conclusions can be drawn from this study. First, it appears possible to derive information on urban land use from an analysis of both the frequency and the spatial arrangement of class labels in land-cover data produced from multispectral images acquired by a high spatial resolution satellite sensors. Second, kernel-based spatial reclassification procedures represent a relatively simple method by which this can be achieved. The development and application of one such technique, known as SPARK (Sp~tial Reclassification Kernel), has been described in this paper, SPARK is able to distinguish quite subtle differences in land use within and around urban areas. It is also easy to implement in most im- age processing systems, running on PC platforms upwards. Finally, a number of potential improvements to the basic SPARK algorithm have been suggested; it is believed that, when implemented, these will increase both the accuracy and the sensitivity of this technique.
August 1096 PE&RS
Acknowledgments Eyton, J.R., 1993. Urban land use classification and modelling using
T h e authors would like to thank the U.K.'s Economic a n d cover-type frequencies, Applied Geography, 13:lll-121.
social ~~~~~~h council and ~~~~~~l ~~~i~~~~~~~ Research Forster, B.C., 1980. Urban residential ground cover using Landsat
Council (NERC) for support through a research grant under digital data, Photogrammetric Engineering b Remote Sensing, 46:547-558. their joint program o n Geographical Data Handling. W e
would also l ike to acknowledge the he lp a n d advice of vari- - , 1984. Combining ancillary and spectral data for urban appli-
cations, International Archives of Photogrammetry and Remote ous colleagues, especially Kevin Morris (NERC Image Analy- Sensing, pp. 55-67. sis Unit, University of Plymouth, U.K.), Graham Sadler (Arthur Anderson Consulting), and Andrew Williams (King- , 1985. An examination of some problems and solutions in
monitoring urban areas from satellite platforms, International s ton College, U.K.). Thanks are also d u e to Prof. Paul Mather of Remote Sensing, 6:139-151,
of Nottingham* U'K') for providing and Franklin S E, and D.R. peddle, 1990, Classification of SPOT-HRV advice in h i s r81e as coordinator of the ESRCJNERC Geographi- imaieri a;ld texture features, International Journal of Remote cal Data Handling program. Finally, the authors would like Sensing, 11:551-556. to thank the referees for lheir comments Gastellu-Etchegorry, J.P., 1990. An assessment of SPOT XS and and constructive criticism. Landsat MSS data for digital classification of near-urban land
cover, International Journal of Remote Sensing, 11:225-235.
References Gong, P., and P.J. Howarth, 1990. The use of structural information for improving land-cover classification accuracies at the rural-
Atkinson, P., J.L. Cushnie, J.R.G. Townshend, and A.K. Wilson, urban fringe, Photogrammetric Engineering 6. Remote Sensing, 1985. Improving Thematic Mapper land cover classification us- 56337-73. ing filtered data, International Journal of Remote Sensing, 6:955- 961. , 1992. Frequency-based contextual classification and gray-
level vector reduction for land-use identification, Photogrammet- Baraldi, A., and F. Parmiggiani, 1990. Urban area classification by ric Engineering b Remote Sensing, 58:423-437.
multispectral SPOT images, IEEE Transactions on Geoscience and Remote Sensing, 28:674-680. Guo, Liu Jian, and J. McM. Moore, 1991. Post-classification process-
ing for thematic mapping based on remotely-sensed image data: Barnsley, M.J., S.L. Barr, A. Hamid, J-P. Muller, G.J. Sadler, and J.W. Proceedings of the International Conference of IEEE Geoscience
Shepherd, 1993. Analytical tools to monitor urban areas, Geo- and Remote Sensing Society, Espoo, Finland, 3-7 June, IEEE, graphical Information Handling - Research and Applications (P. New York, pp. 2203-2206. Mather, editor), John Wiley, Chichester, pp. 147-184.
Gurney, C.M., 1981. The use of contextual information to improve Barnsley, M.J., and S.L. Barr, 1992. Developing kernel-based spatial land cover classification of digital remotely sensed data, Interna-
re-classification techniques for improved land-use monitoring tional Journal of Remote Sensing, 2:379-388. using high spatial resolution images, Proc. XXLX Conference of the International Society for Photogrammetry and Remote Sens- Gurney, C.M., and J.R.G. ~ownshend , 1983. t he use of contextual ing (ISPRS'SZ), International Archives of Photogrammetry and information in the classification of remotely sensed data, Photo-
Remote Sensing : Commission 7, Washington D.C., 2-14 August grammetric Engineering b Remote Sensing, 49:55-64. 1992, p p 646-654. Haack, B., N. Bryant, and S. Adams, 1987. An assessment of Landsat
Barnsley, M.J., S.L. Barr, and G.J. Sadler, 1991. Spatial re-classifica- MSS and TM data for urban and near-urban land-cover digital tion of remotely sensed images for urban land use monitoring, classification, Remote Sensing of Environment, 21:201-213. Proceedings of Spatial Data 2000, Oxford, 17-20 September, Re- Haralick, R.M., 1979. Statistical and structural approaches to texture, mote Sensing Society, Nottingham, pp. 106-117. Proceedings of the IEEE, 67:786-804.
Barnsley, M.J., G.J. Sadler, and J.S. Shepherd, 1989. Integrating re- Hepner, G.F., T. Logan, N. Ritter, and N. Bryant, 1990. Artificial neu- motely-sensed images and digital map data in the context of ur- ral network classification using a minimal training set: Compari- ban planning, Proceedings of the 15th Annual Conference of the son to conventional supervised classification, Photogrammetric Remote Sensing Society, Bristol, U.K., 13-15 September, Remote Engineering b Remote Sensing, 56:469473. Sensing Society, Nottingham, pp. 25-32. Jackson, M.J., P. Carter, T.F. Smith, and W. Gardner, 1980. Urban
Barr, S.L., 1992. Object-based re-classification of high resolution land mapping from remotely sensed data, Photogrammetric En- digital imagery for urban land use monitoring, Proc. XXIX Con- gineering 6. Remote Sensing, 46:1041-1050. ference 'f the International for Photogrammetry and Kanellopoulos, I,, A. Varfis, G.G. Wilkinson, and J. Megier, 1992, Remote Sensing (ISPRS'SZ), International Archives of Photo- Land-cover discrimination in SPOT HRV imagery using an artifi- grammetry and Remote Sensing : Commission 7, Washington cia1 neural network - A 20-class experiment, International D.C., 2-14 August, pp. 969-976. Journal of Remote Sensing, 13:917-924.
Barr, S.L., and M.J. Barnsley, 1993. Object-based spatial analytical Li, K., and J-P. Muller, 1991. Segmenting satellite imagery: A reg,on tools for urban land-use monitoring in a raster processing envi- growing scheme, Proceedings of the Conference of the IEEE Geo- ronment, Proceedings 'f Ihe Fourth Conference On Ge- science and Remote Sensing Society (1GARSS391), Val, 2, Espoo, ographical Information Systems (EGIS'SS), Genoa, Italy, April, Finland, pp. 1075-1078. pp. 810-822.
Chen, P.C., and T. Pavlidis, 1979. Segmentation by texture using a Martin, L.R.G., P.J. Howarth, and G. Holder, 1988. Multispectral clas- sification of land use at the rural-urban hinge using SPOT data, co-occurrence matrix and a split-and-merge algorithm, Computer Canadian Journal of Remote Sensing, 14:72-79, Vision, Graphics and Image Processing, 10:172-182.
Civco, D.C., 1993. htificial neural networks for classifica- Mather* Processing Im- tion and mapping, International Journal of Geographical Infor- ages, John Wiley, London, pp. 289-309.
mation Systems, 7:173-186. Mehldau, G., and R.A. Schowengerdt, 1990. A C-extension for rule-
Congalton, R.G., R.G. Oderwald, and R.A. Mead, 1983. Assessing based image classification systems, Photogrammetric Engineen'ng
Landsat classification accuracy using discrete multivariate statis- b Remote Sensing, 56:887-892.
tical techniques, Photogrammetric Engineering 6. Remote Sens- Moeller-Jensen, L., 1990. Knowledge-based classification of an urban ing, 49:1671-1678. area using texture and context information in a Landsat-TM im-
Dryer, p., 1993. Classification of land cover using optimized neural age, Photogrammetric Engineering b Remote Sensing, 56:899-
nets on SPOT data, Photogrammetric Engineering b Remote 904. Sensing, 59:617-621. Murphy, D.L., 1985, Estimating neighborhood variability with a bi-
Ehlers, M., D. Greenlee, T. Smith, and Star, 1991. Integration of re- nary comparison matrix, Photogrammetric Engineering b Re- mote sensing and GIs: Data and data access, Photogrammetric mote Sensing, 51:667-674. Engineering 6. Remote Sensing, 5 7:669-675. Robinove, C.J., 1986. Spatial diversity index mapping of classes in
Rosenfield, G.H., and K. Fitzpatrick-Lins, 1986. A coefficient of agreement as a measure of thematic classification accuracy, Pho- togrammetric Engineering 6 Remote Sensing, 52:223-227.
Sadler, G.J., and M.J. Barnsley, 1990. Use of population density data to improve classification accuracies in remotely-sensed images of urban areas, Proceedings of the First European Conference on Geographical Information Systems (EGIS'SO), Amsterdam, The Netherlands, 10-13 April, EGIS Foundation, Utrecht, pp. 968- 977.
Sadler, G.J., M.J. Barnsley, and S.L. B a r , 1991. Information extrac- tion from remotely-sensed images for urban land analysis, Pro- ceedings of the Second European Conference on Geographical Information Systems (EGIS'Sl), Brussels, Belgium, April, EGIS Foundation, Utrecht, pp. 955-964.
Toll, D.L., 1985. Effect of Landsat Thematic Mapper sensor parame- ters on land cover classification, Remote Sensing of Environ- ment, 17:129-140.
Turner, M.G., 1989. Landscape ecology: The effect of pattern on pro- cess, Annual Review Ecological Systems, 20:171-197.
Wang, Y., and D. Civco, 1992. Spatial modeling-based post-classifica- tion of satellite remote sensing data for improved land cover mapping, Proc. ASPRS/ACSM/RT'SZ Convention, Washington, D.C., 4:122-132.
, 1992. Post-classification of misclassified pixels by evidential reasoning: A GIS approach for improving classification accuracy of remote sensing data, Proc. ASPRS/ACSM/RT'SZ Convention, Washington, D.C., 4:160-170.
Wharton, S.W., 1982a. A contextual classification method for recog- nizing land use patterns in high resolution remotely-sensed data, Pattern Recognition, 15:317-324.
, 1982b. A context-based land use classification algorithm for high resolution remotely sensed data, Journal of Applied Photo- graphic Engineering, 8:46-50.
Whitehouse, S., 1990. A spatial land-use classification of an urban environment using high-resolution rnultispectral satellite data, Proceedings of the 16th Annual Conference of the Remote Sens- ing Society, Remote Sensing and Global Change, Swansea, U.K., 19-21 September, Remote Sensing Society, Nottingham, pp. 433-437.
Woodcock, C.E., and A.H. Strahler, 1987. The factor of scale in re- mote sensing, Remote Sensing of Environment, 21:311-332.
(Received 28 September 1993; revised and accepted 7 October 1994; revised 18 January 1995)
F o r t h c o m i n g A r t i c l e s
Articles listed in the August Forthcoming Articles are those scheduled to run through Februarv 1997. - Michael Abrams, Remo Bianchi, and Dave Pieri, Revised Mapping
of Lava Flows on Mount Etna, Sicily. M. Aniya, H. Sato, R. Naruse, P. Skvarca, and G. Casassa, The Use
of Satellite and Airborne Imagery to Inventory Outlet Glaciers of the Southern Patagonia Icefield, South America.
Ling Bian and Eric West, GIs Modeling of Elk Calving Habitat in a Priairie Environment with Statistics.
M. Les Bober, Duncan Wood, and Raymond A. McBride, Use of Digital Image Analysis and GIs to Assess Regional Soil Com- paction Risk.
Timothy L. Bowers and Lawrence C. Rowan, Remote Mineralogic and Lithologic Mapping of the Ice River Alkaline Complex, British Columbia, Canada, Using AVIRIS Data.
Pat S. Chavez, Jr., Image-Based Atmospheric Corrections-Revised and Improved.
0. Dikshit and D.P. Roy, An Empirical Investigation of Image Re- sampling Effects upon the Spectral and Textural Supervised Classification of a High Spatial Resolution Multispectral Image.
Leila M.G. Fonseca and B.S. Manjunath, Registration Techniques for Multisensor Remotely Sensed Imagery.
Bruno Garguet-Duport, facky Girel, Jean-Marc Chassery, and Guy Pautou, The Use of Multiresolution Analysis and Wavelets Transform for Merging SPOT Panchromatic and Multispectral Image Data.
Greg G. Gaston, Peggy M. Bradley, Ted S. Vinson, and Tatayana P. Kolchugina, Forest Ecosystem Modeling in the Russian Far East Using Vegetation and Land-Cover Regions Identified by Classi- fication of GVI.
Philip T. Giles and Steven E. Franklin, Comparison of Derivative Topographic Surfaces of a DEM Generated from Stereoscopic SPOT Images with Field Measurements.
Clyde C. Goad and Ming Yang, A New Approach to Precision Air- borne GPS Positioning for Photogrammetry.
Joachim Hohle, Experience with the Production of Digital Orthophotos.
Collin G. Homer, R. Douglas Ramsey, Thomas C. Edwards, Jr., and Allan Falconer, Landscape Cover-Type Mapping Modeling Us- ing a Multi-Scene Thematic Mapper Mosaic.
Pamela E. Jansma and Harold R. Lang, Applications of Spectral Stratigraphy to Upper Cretaceous and Tertiary Rocks in South-
ern Mexico: Tertiary Graben Control on Volcanism. N.G. Kardoulas, A.C. Bird, and A.I. Lawan, Geometric Correction
of SPOT and Landsat Imagery: A Comparison of Map and GPS Derived Control Points.
Steven T. Knick, John T. Rotenberry, and Thomas J. Zarriello, Super- vised Classification of Landsat Thematic Mapper Imagery in a Semi-Arid Rangeland by Nonparametric Discriminant Analysis.
Jacek Komorowski-Blaszczynski, Landform Characterization with Geographic Information Systems.
Amnon Krupnik, Using Theoretical Intensity Values as Unknowns in Multiple-Patch Least-Squares Matching.
Kenneth C. McGwire, Cross-Validated Assessment of Geometric Accuracy.
Sunil Narurnalani, John R. Jensen, Shan Burkhalter, John D. Althausen, and Halkard E. Mackey, Jr., Aquatic Macrophyte Modeling Using GIs and Logistic Multiple Regression.
Paul Pope, Ed Van Eeckhout, and Cheryl Rofer, Waste Site Character- ization through Digital Analysis of Historical Aerial Photographs.
Tian-Yuan Shih, The Sign Permutation in the Rotation Matrix and the Formulation of Collinearity and Coplanarity Equations.
C.R. de Souza Filho, S.A. Drury, A.M. Denniss, R.W.T. Carlyon, and D.A. Rothery, Restoration of Corrupted Optical Fuyo-1 [JERS-1) Data Using Frequency Domain Techniques.
R.D. Spencer, M.A. Green, and P.H. Biggs, Integrating Eucalypt Forest Inventory and GIs in Western Australia.
M.D. Tomer, J.L. Anderson, and J.A. Lamb, Assessing Corn Yield and Nitrogen Uptake Variability with Digitized Aerial Infrared Photographs.
A.P. van Deventer, A.D. Ward, P.H. Gowda, and J.G. Lyon, Using Thematic Mapper Data to Identify Contrasting Soil Plains and Tillage Practices.
Jim Vrabel, Multispectral Imagery Band Sharpening Study. Jianjun Wang, Gary J. Robinson, and Kevin White, A Fast Solution
to Local Viewshed Computation Using Grid-Based Digital El- evation Models.
Eric A. Williams and Dennis E. Jelinski, On Using the NOAA AVHRR "Experimental Calibrated Biweekly Global Vegetation Index."
Zhangshi Yin and T.H. Lee Williams, Obtaining Spatial and Tem- poral Vegetation Data from Landsat MSS and AVHRRINOAA Satellite Images for a Hydrologic Model.
David A. Yocky, Multiresolution Wavelet Decomposition Image Merger of Landsat Thematic Mapper and SPOT Panchromatic Data.