38
Economic Analysis Department Warsaw / 8th March 2021 Inflation and economic growth projection of Narodowy Bank Polski based on the NECMOD model
Economic Analysis Department
Warsaw / 8th March 2021
Inflation and economic growth projection
of Narodowy Bank Polski
based on the NECMOD model
Outline:
Inflation and economic growth projection of the NBP
Pandemic: economic
fallout
Projection 2021 – 2023
▪ Economic conditions
abroad
▪ Polish economy
Uncertainty
2
1 Pandemic: economic fallout
2 Projection 2021 - 2023
3 Uncertainty
Outline
Outline:
Inflation and economic growth projection of the NBP
Pandemic: economic
fallout
Projection 2021 – 2023
▪ Economic conditions
abroad
▪ Polish economy
Uncertainty
3
Pandemic: economic fallout
Inflation and economic growth projection of the NBP 4
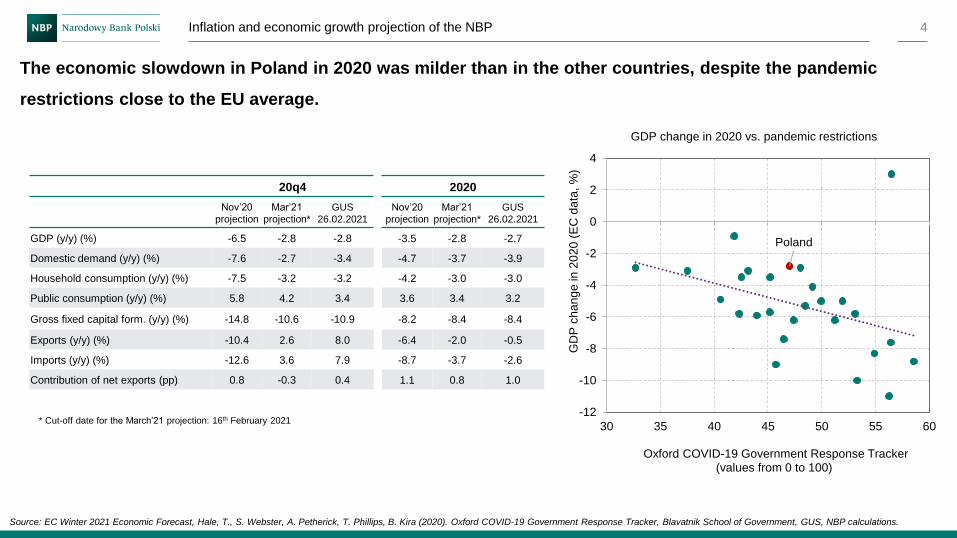
The economic slowdown in Poland in 2020 was milder than in the other countries, despite the pandemic
restrictions close to the EU average.
* Cut-off date for the March’21 projection: 16th February 2021
Source: EC Winter 2021 Economic Forecast, Hale, T., S. Webster, A. Petherick, T. Phillips, B. Kira (2020). Oxford COVID-19 Government Response Tracker, Blavatnik School of Government, GUS, NBP calculations.
Poland
-12
-10
-8
-6
-4
-2
0
2
4
30 35 40 45 50 55 60
GD
P c
ha
ng
ein
20
20
(E
C d
ata
, %
)
Oxford COVID-19 Government Response Tracker(values from 0 to 100)
GDP change in 2020 vs. pandemic restrictions
20q4
Nov’20
projection
Mar’21
projection*
GUS
26.02.2021
GDP (y/y) (%) -6.5 -2.8 -2.8
Domestic demand (y/y) (%) -7.6 -2.7 -3.4
Household consumption (y/y) (%) -7.5 -3.2 -3.2
Public consumption (y/y) (%) 5.8 4.2 3.4
Gross fixed capital form. (y/y) (%) -14.8 -10.6 -10.9
Exports (y/y) (%) -10.4 2.6 8.0
Imports (y/y) (%) -12.6 3.6 7.9
Contribution of net exports (pp) 0.8 -0.3 0.4
2020
Nov’20
projection
Mar’21
projection*
GUS
26.02.2021
-3.5 -2.8 -2.7
-4.7 -3.7 -3.9
-4.2 -3.0 -3.0
3.6 3.4 3.2
-8.2 -8.4 -8.4
-6.4 -2.0 -0.5
-8.7 -3.7 -2.6
1.1 0.8 1.0
Inflation and economic growth projection of the NBP
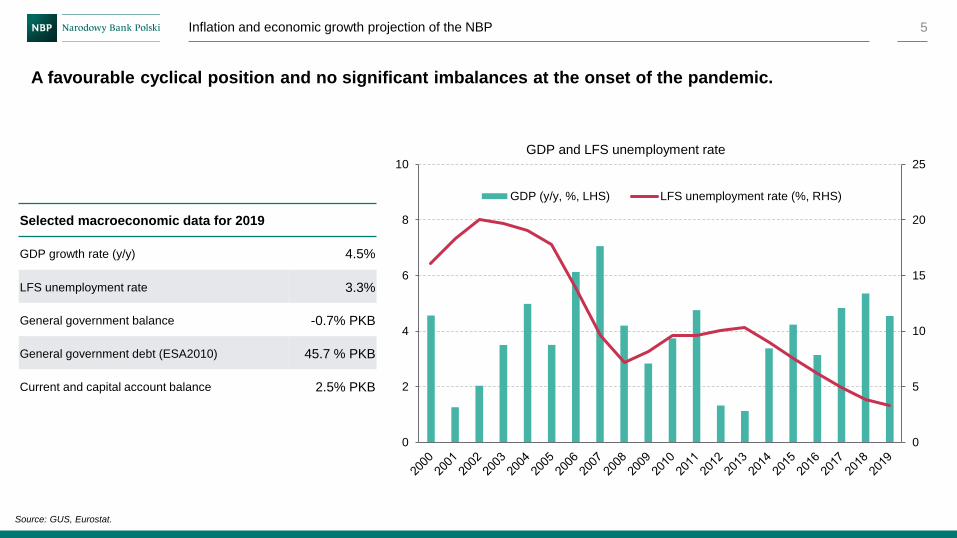
A favourable cyclical position and no significant imbalances at the onset of the pandemic.
5
Source: GUS, Eurostat.
0
5
10
15
20
25
0
2
4
6
8
10
GDP (y/y, %, LHS) LFS unemployment rate (%, RHS)
GDP and LFS unemployment rate
Selected macroeconomic data for 2019
GDP growth rate (y/y) 4.5%
LFS unemployment rate 3.3%
General government balance -0.7% PKB
General government debt (ESA2010) 45.7 % PKB
Current and capital account balance 2.5% PKB
Inflation and economic growth projection of the NBP
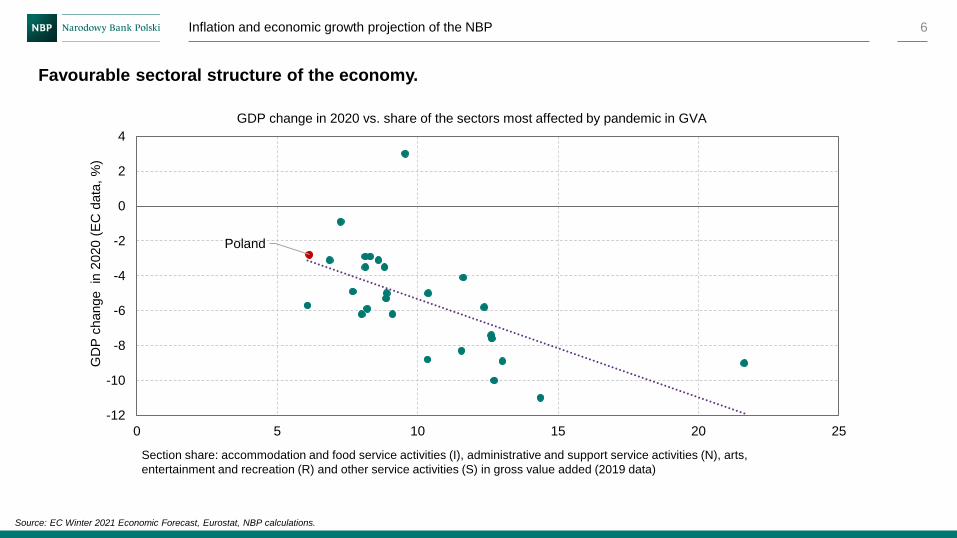
Favourable sectoral structure of the economy.
6
Source: EC Winter 2021 Economic Forecast, Eurostat, NBP calculations.
GDP change in 2020 vs. share of the sectors most affected by pandemic in GVA
Poland
-12
-10
-8
-6
-4
-2
0
2
4
0 5 10 15 20 25
GD
P c
hange
in 2
020 (
EC
data
, %
)
Section share: accommodation and food service activities (I), administrative and support service activities (N), arts,
entertainment and recreation (R) and other service activities (S) in gross value added (2019 data)
Inflation and economic growth projection of the NBP
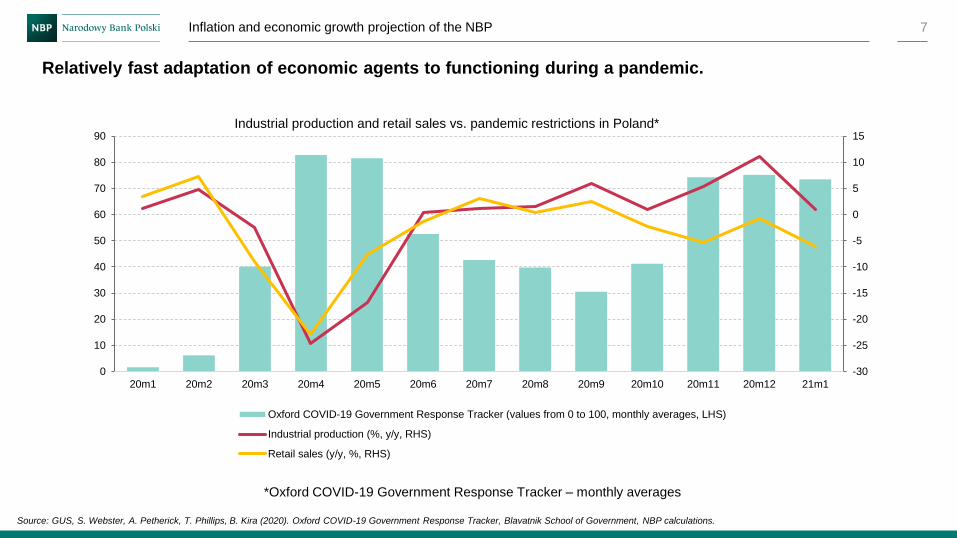
Relatively fast adaptation of economic agents to functioning during a pandemic.
7
Source: GUS, S. Webster, A. Petherick, T. Phillips, B. Kira (2020). Oxford COVID-19 Government Response Tracker, Blavatnik School of Government, NBP calculations.
*Oxford COVID-19 Government Response Tracker – monthly averages
Industrial production and retail sales vs. pandemic restrictions in Poland*
-30
-25
-20
-15
-10
-5
0
5
10
15
0
10
20
30
40
50
60
70
80
90
20m1 20m2 20m3 20m4 20m5 20m6 20m7 20m8 20m9 20m10 20m11 20m12 21m1
Oxford COVID-19 Government Response Tracker (values from 0 to 100, monthly averages, LHS)
Industrial production (%, y/y, RHS)
Retail sales (y/y, %, RHS)
Inflation and economic growth projection of the NBP
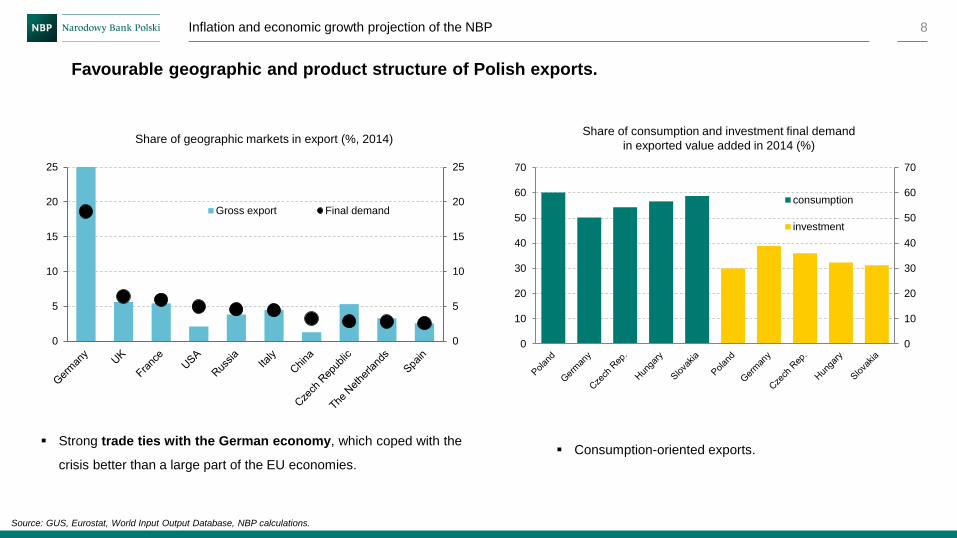
Favourable geographic and product structure of Polish exports.
8
Source: GUS, Eurostat, World Input Output Database, NBP calculations.
▪ Consumption-oriented exports.
Share of consumption and investment final demand
in exported value added in 2014 (%)Share of geographic markets in export (%, 2014)
▪ Strong trade ties with the German economy, which coped with the
crisis better than a large part of the EU economies.
0
10
20
30
40
50
60
70
0
10
20
30
40
50
60
70
consumption
investment
0
5
10
15
20
25
0
5
10
15
20
25
Gross export Final demand
Inflation and economic growth projection of the NBP
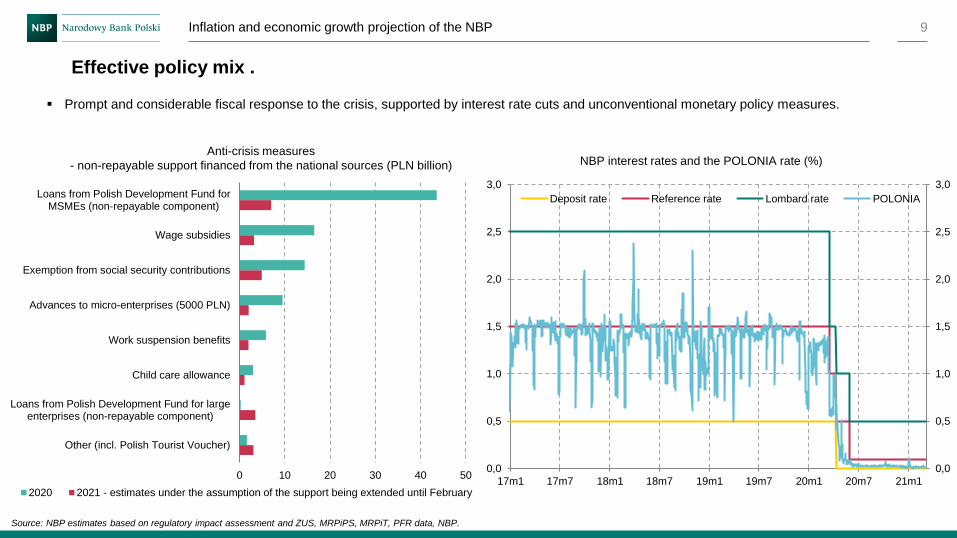
Effective policy mix .
9
Source: NBP estimates based on regulatory impact assessment and ZUS, MRPiPS, MRPiT, PFR data, NBP.
▪ Prompt and considerable fiscal response to the crisis, supported by interest rate cuts and unconventional monetary policy measures.
Anti-crisis measures
- non-repayable support financed from the national sources (PLN billion) NBP interest rates and the POLONIA rate (%)
0 10 20 30 40 50
Other (incl. Polish Tourist Voucher)
Loans from Polish Development Fund for largeenterprises (non-repayable component)
Child care allowance
Work suspension benefits
Advances to micro-enterprises (5000 PLN)
Exemption from social security contributions
Wage subsidies
Loans from Polish Development Fund forMSMEs (non-repayable component)
2020 2021 - estimates under the assumption of the support being extended until February
0,0
0,5
1,0
1,5
2,0
2,5
3,0
0,0
0,5
1,0
1,5
2,0
2,5
3,0
17m1 17m7 18m1 18m7 19m1 19m7 20m1 20m7 21m1
Deposit rate Reference rate Lombard rate POLONIA
Inflation and economic growth projection of the NBP
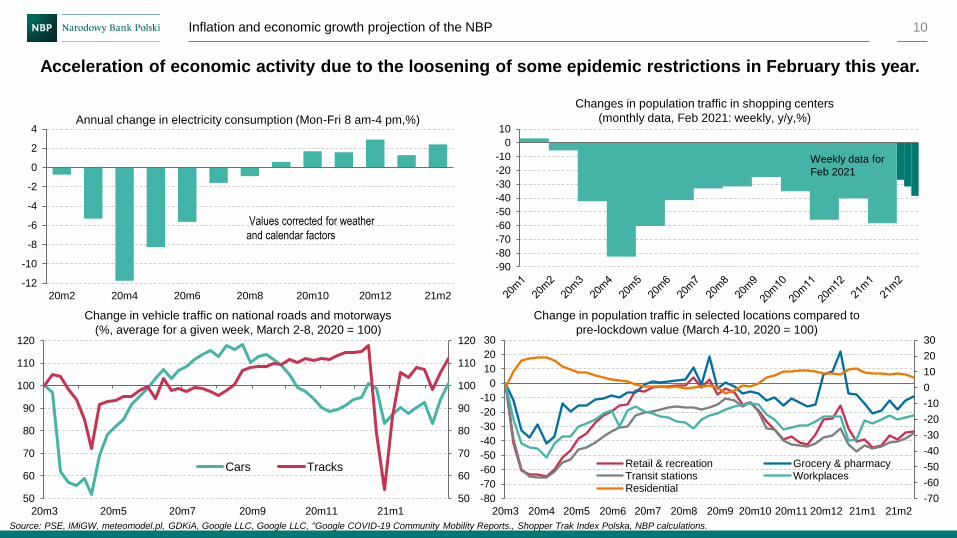
Acceleration of economic activity due to the loosening of some epidemic restrictions in February this year.
10
Source: PSE, IMiGW, meteomodel.pl, GDKiA, Google LLC, Google LLC, "Google COVID-19 Community Mobility Reports., Shopper Trak Index Polska, NBP calculations.
Annual change in electricity consumption (Mon-Fri 8 am-4 pm,%)
Values corrected for weather
and calendar factors
Changes in population traffic in shopping centers
(monthly data, Feb 2021: weekly, y/y,%)
-12
-10
-8
-6
-4
-2
0
2
4
20m2 20m4 20m6 20m8 20m10 20m12 21m2
-90
-80
-70
-60
-50
-40
-30
-20
-10
0
10
Weekly data for
Feb 2021
Change in vehicle traffic on national roads and motorways
(%, average for a given week, March 2-8, 2020 = 100)
50
60
70
80
90
100
110
120
50
60
70
80
90
100
110
120
20m3 20m5 20m7 20m9 20m11 21m1
Cars Tracks
-70
-60
-50
-40
-30
-20
-10
0
10
20
30
-80
-70
-60
-50
-40
-30
-20
-10
0
10
20
30
20m3 20m4 20m5 20m6 20m7 20m8 20m9 20m10 20m11 20m12 21m1 21m2
Retail & recreation Grocery & pharmacyTransit stations WorkplacesResidential
Change in population traffic in selected locations compared to
pre-lockdown value (March 4-10, 2020 = 100)
Outline:
Inflation and economic growth projection of the NBP
Pandemic: economic
fallout
Projection 2021 – 2023
▪ Economic conditions
abroad
▪ Polish economy
Uncertainty
11
Projection 2021-2023
Economic conditions abroad
Inflation and economic growth projection of the NBP 12
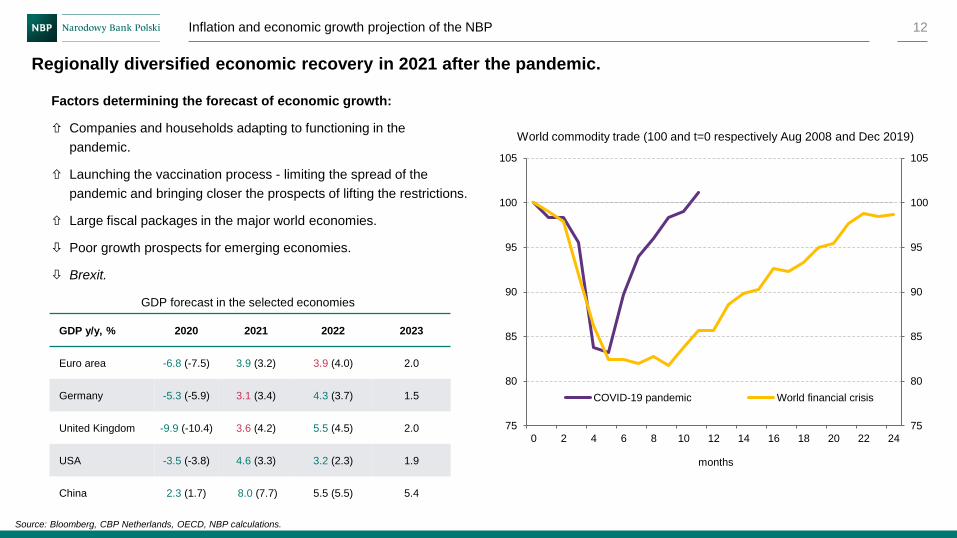
Regionally diversified economic recovery in 2021 after the pandemic.
Source: Bloomberg, CBP Netherlands, OECD, NBP calculations.
GDP forecast in the selected economies
Factors determining the forecast of economic growth:
Companies and households adapting to functioning in the
pandemic.
Launching the vaccination process - limiting the spread of the
pandemic and bringing closer the prospects of lifting the restrictions.
Large fiscal packages in the major world economies.
Poor growth prospects for emerging economies.
Brexit.
World commodity trade (100 and t=0 respectively Aug 2008 and Dec 2019)
GDP y/y, % 2020 2021 2022 2023
Euro area -6.8 (-7.5) 3.9 (3.2) 3.9 (4.0) 2.0
Germany -5.3 (-5.9) 3.1 (3.4) 4.3 (3.7) 1.5
United Kingdom -9.9 (-10.4) 3.6 (4.2) 5.5 (4.5) 2.0
USA -3.5 (-3.8) 4.6 (3.3) 3.2 (2.3) 1.9
China 2.3 (1.7) 8.0 (7.7) 5.5 (5.5) 5.4
75
80
85
90
95
100
105
75
80
85
90
95
100
105
0 2 4 6 8 10 12 14 16 18 20 22 24
months
COVID-19 pandemic World financial crisis
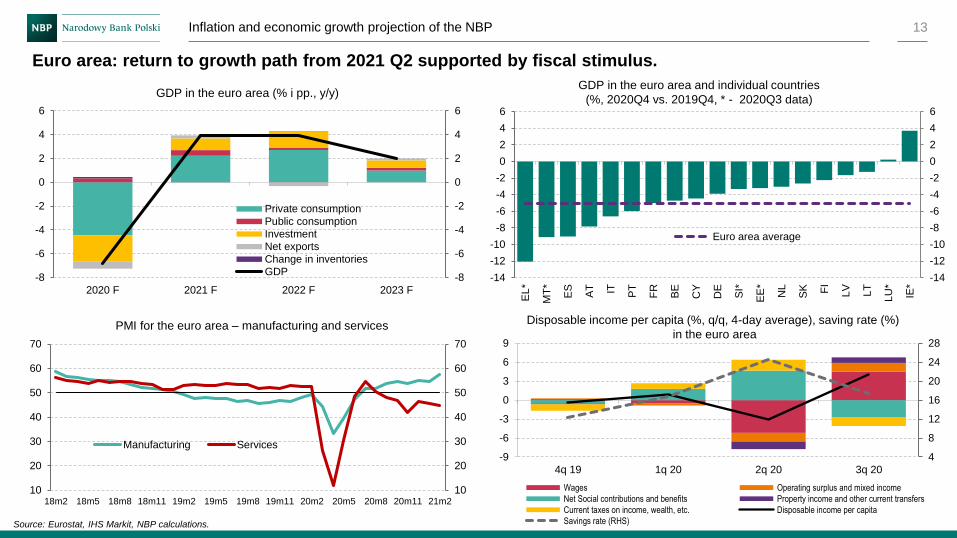
Inflation and economic growth projection of the NBP 13
Source: Eurostat, IHS Markit, NBP calculations.
GDP in the euro area (% i pp., y/y)GDP in the euro area and individual countries
(%, 2020Q4 vs. 2019Q4, * - 2020Q3 data)
Disposable income per capita (%, q/q, 4-day average), saving rate (%)
in the euro area
Euro area: return to growth path from 2021 Q2 supported by fiscal stimulus.
PMI for the euro area – manufacturing and services
-8
-6
-4
-2
0
2
4
6
-8
-6
-4
-2
0
2
4
6
2020 F 2021 F 2022 F 2023 F
Private consumption
Public consumption
Investment
Net exports
Change in inventories
GDP-14
-12
-10
-8
-6
-4
-2
0
2
4
6
-14
-12
-10
-8
-6
-4
-2
0
2
4
6
EL
*
MT
*
ES
AT IT PT
FR
BE
CY
DE
SI*
EE
*
NL
SK FI
LV
LT
LU
*
IE*
Euro area average
10
20
30
40
50
60
70
10
20
30
40
50
60
70
18m2 18m5 18m8 18m11 19m2 19m5 19m8 19m11 20m2 20m5 20m8 20m11 21m2
Manufacturing Services4
8
12
16
20
24
28
-9
-6
-3
0
3
6
9
4q 19 1q 20 2q 20 3q 20
Wages Operating surplus and mixed income
Net Social contributions and benefits Property income and other current transfers
Current taxes on income, wealth, etc. Disposable income per capita
Savings rate (RHS)
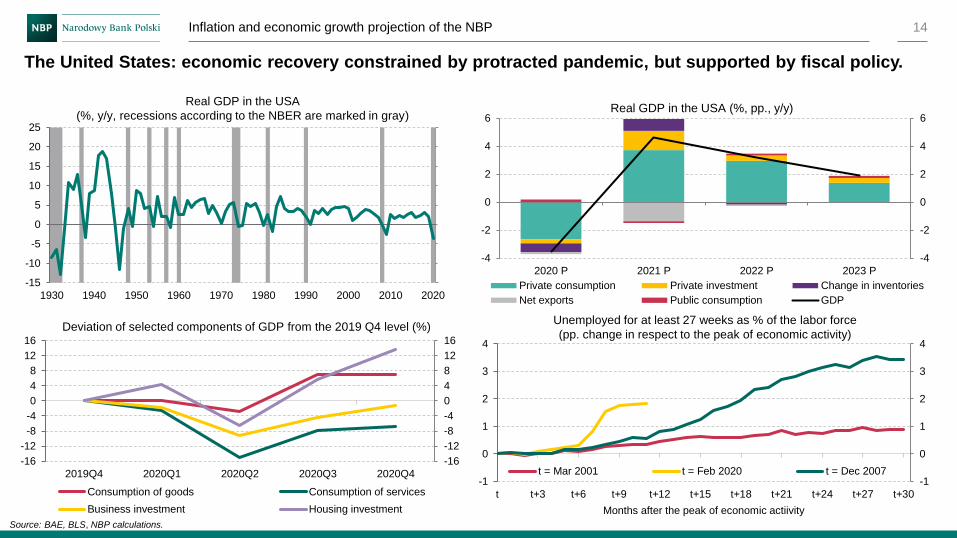
Inflation and economic growth projection of the NBP 14
The United States: economic recovery constrained by protracted pandemic, but supported by fiscal policy.
Source: BAE, BLS, NBP calculations.
Real GDP in the USA (%, pp., y/y)
Deviation of selected components of GDP from the 2019 Q4 level (%)
Real GDP in the USA
(%, y/y, recessions according to the NBER are marked in gray)
Unemployed for at least 27 weeks as % of the labor force
(pp. change in respect to the peak of economic activity)
-4
-2
0
2
4
6
-4
-2
0
2
4
6
2020 P 2021 P 2022 P 2023 P
Private consumption Private investment Change in inventories
Net exports Public consumption GDP
-16
-12
-8
-4
0
4
8
12
16
-16
-12
-8
-4
0
4
8
12
16
2019Q4 2020Q1 2020Q2 2020Q3 2020Q4
Consumption of goods Consumption of services
Business investment Housing investment
-1
0
1
2
3
4
-1
0
1
2
3
4
t t+3 t+6 t+9 t+12 t+15 t+18 t+21 t+24 t+27 t+30
Months after the peak of economic actiivity
t = Mar 2001 t = Feb 2020 t = Dec 2007
-15
-10
-5
0
5
10
15
20
25
1930 1940 1950 1960 1970 1980 1990 2000 2010 2020
Outline:
Inflation and economic growth projection of the NBP
Pandemic: economic
fallout
Projection 2021 – 2023
▪ Economic conditions
abroad
▪ Polish economy
Uncertainty
15
Projection 2021-2023
Polish economy

Inflation and economic growth projection of the NBP 16
Source: GUS, ZUS, MRPiT, NBP calculations.
Partial recovery of labour demand in the second half of 2020. Limited growth of the unemployment
rate, owing to the anti-crisis measures.
Number of employed persons and average employment in enterprise
sector and hours worked in the economy according to LFS (y/y, %)Number of job offers declared during a month (in thous., sa)
20q3: 3.2%
21m1: 6.1%
0
2
4
6
8
10
12
14
0
2
4
6
8
10
12
14
2011 2013 2015 2017 2019 2021 2023
LFS unemployment rate (from 20q4 forecast)
Registered unemployment rate
Registered and LFS unemployment rates (sa, %) Number of employees benefiting from the Anti-crisis Shield
by type of measure (average stock, ths.)
0
500
1 000
1 500
2 000
2 500
3 000
20m4 20m5 20m6 20m7 20m8 20m9 20m10 20m11 20m12 21m1
employees' wage subsidies - European Social Fund
stoppage benefits
employees' wage subsidies - Guaranteed EmployeeBenefits Fund
-8,9
-0.3
-2.0
-1.8
-10
-8
-6
-4
-2
0
2
4
6
-10
-8
-6
-4
-2
0
2
4
6
16m1 16m7 17m1 17m7 18m1 18m7 19m1 19m7 20m1 20m7 21m1
Hours worked in the economy according to LFS (y/y)
Av. employment in enterprise sector
No. of employed persons in enterprise sector 0
20
40
60
80
100
120
140
160
18m1 18m7 19m1 19m7 20m1 20m7 21m1
Job offers excl. subsidised offers Subsidised job offers
Note: Data from labor offices for the last month, due to the date of data availability, refer to offers in general.
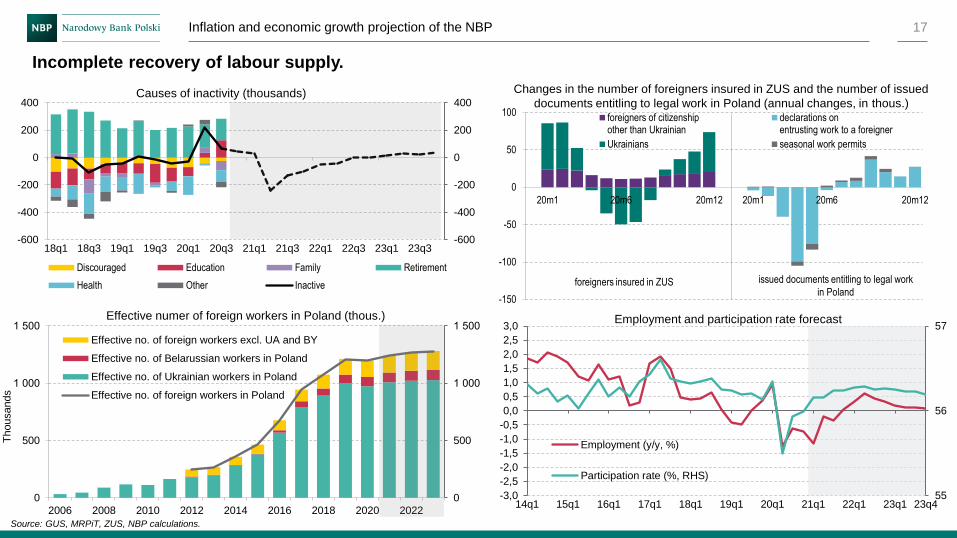
Inflation and economic growth projection of the NBP 17
Source: GUS, MRPiT, ZUS, NBP calculations.
Incomplete recovery of labour supply.
Causes of inactivity (thousands) Changes in the number of foreigners insured in ZUS and the number of issued
documents entitling to legal work in Poland (annual changes, in thous.)
Effective numer of foreign workers in Poland (thous.)
55
56
57
-3,0
-2,5
-2,0
-1,5
-1,0
-0,5
0,0
0,5
1,0
1,5
2,0
2,5
3,0
14q1 15q1 16q1 17q1 18q1 19q1 20q1 21q1 22q1 23q1 23q4
Employment (y/y, %)
Participation rate (%, RHS)
Employment and participation rate forecast
-600
-400
-200
0
200
400
-600
-400
-200
0
200
400
18q1 18q3 19q1 19q3 20q1 20q3 21q1 21q3 22q1 22q3 23q1 23q3
Discouraged Education Family Retirement
Health Other Inactive
0
500
1 000
1 500
0
500
1 000
1 500
2006 2008 2010 2012 2014 2016 2018 2020 2022
Th
ousands
Effective no. of foreign workers excl. UA and BY
Effective no. of Belarussian workers in Poland
Effective no. of Ukrainian workers in Poland
Effective no. of foreign workers in Poland
-150
-100
-50
0
50
100
20m1 20m6 20m12 20m1 20m6 20m12
foreigners of citizenshipother than Ukrainian
declarations onentrusting work to a foreigner
Ukrainians seasonal work permits
foreigners insured in ZUS issued documents entitling to legal work
in Poland
Inflation and economic growth projection of the NBP 18
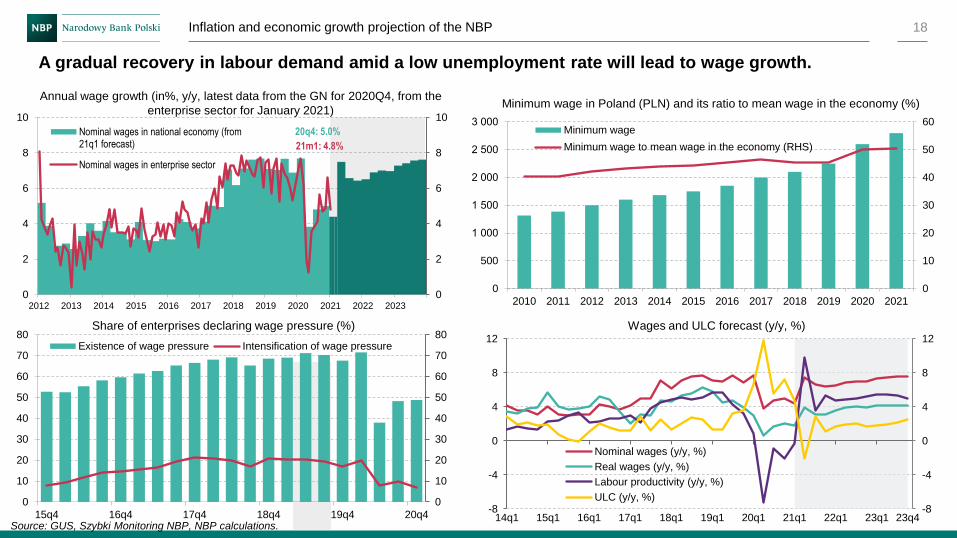
Annual wage growth (in%, y/y, latest data from the GN for 2020Q4, from the
enterprise sector for January 2021)
A gradual recovery in labour demand amid a low unemployment rate will lead to wage growth.
Minimum wage in Poland (PLN) and its ratio to mean wage in the economy (%)
Source: GUS, Szybki Monitoring NBP, NBP calculations.
Share of enterprises declaring wage pressure (%)
-8
-4
0
4
8
12
-8
-4
0
4
8
12
14q1 15q1 16q1 17q1 18q1 19q1 20q1 21q1 22q1 23q1 23q4
Nominal wages (y/y, %)
Real wages (y/y, %)
Labour productivity (y/y, %)
ULC (y/y, %)
Wages and ULC forecast (y/y, %)
0
10
20
30
40
50
60
0
500
1 000
1 500
2 000
2 500
3 000
2010 2011 2012 2013 2014 2015 2016 2017 2018 2019 2020 2021
Minimum wage
Minimum wage to mean wage in the economy (RHS)
20q4: 5.0%
21m1: 4.8%
0
2
4
6
8
10
0
2
4
6
8
10
2012 2013 2014 2015 2016 2017 2018 2019 2020 2021 2022 2023
Nominal wages in national economy (from21q1 forecast)
Nominal wages in enterprise sector
0
10
20
30
40
50
60
70
80
0
10
20
30
40
50
60
70
80
15q4 16q4 17q4 18q4 19q4 20q4
Existence of wage pressure Intensification of wage pressure
Inflation and economic growth projection of the NBP 19
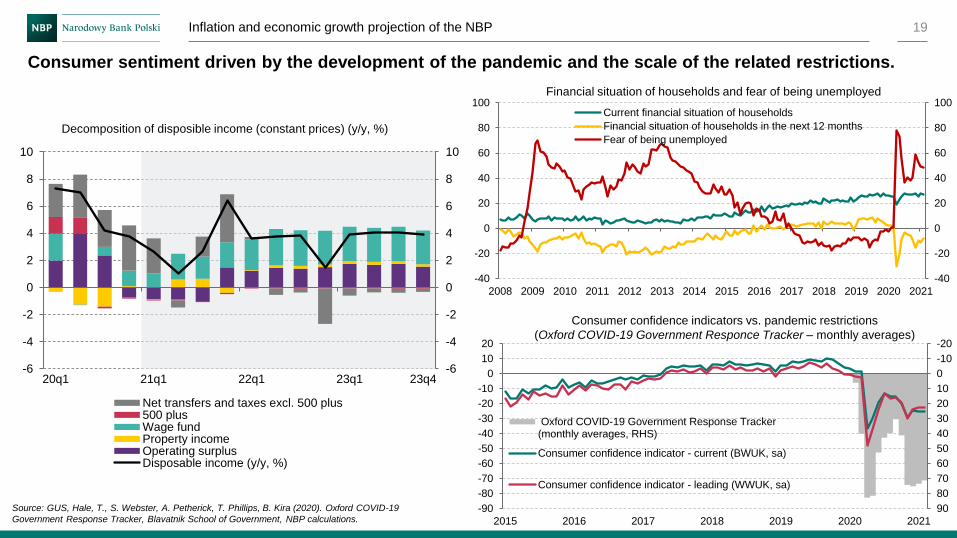
Consumer sentiment driven by the development of the pandemic and the scale of the related restrictions.
Source: GUS, Hale, T., S. Webster, A. Petherick, T. Phillips, B. Kira (2020). Oxford COVID-19
Government Response Tracker, Blavatnik School of Government, NBP calculations.
Financial situation of households and fear of being unemployed
Consumer confidence indicators vs. pandemic restrictions
(Oxford COVID-19 Government Responce Tracker – monthly averages)
-6
-4
-2
0
2
4
6
8
10
-6
-4
-2
0
2
4
6
8
10
20q1 21q1 22q1 23q1 23q4
Net transfers and taxes excl. 500 plus500 plusWage fundProperty incomeOperating surplusDisposable income (y/y, %)
Decomposition of disposible income (constant prices) (y/y, %)
-40
-20
0
20
40
60
80
100
-40
-20
0
20
40
60
80
100
2008 2009 2010 2011 2012 2013 2014 2015 2016 2017 2018 2019 2020 2021
Current financial situation of households
Financial situation of households in the next 12 months
Fear of being unemployed
-20
-10
0
10
20
30
40
50
60
70
80
90-90
-80
-70
-60
-50
-40
-30
-20
-10
0
10
20
2015 2016 2017 2018 2019 2020 2021
Oxford COVID-19 Government Response Tracker(monthly averages, RHS)
Consumer confidence indicator - current (BWUK, sa)
Consumer confidence indicator - leading (WWUK, sa)
Inflation and economic growth projection of the NBP 20
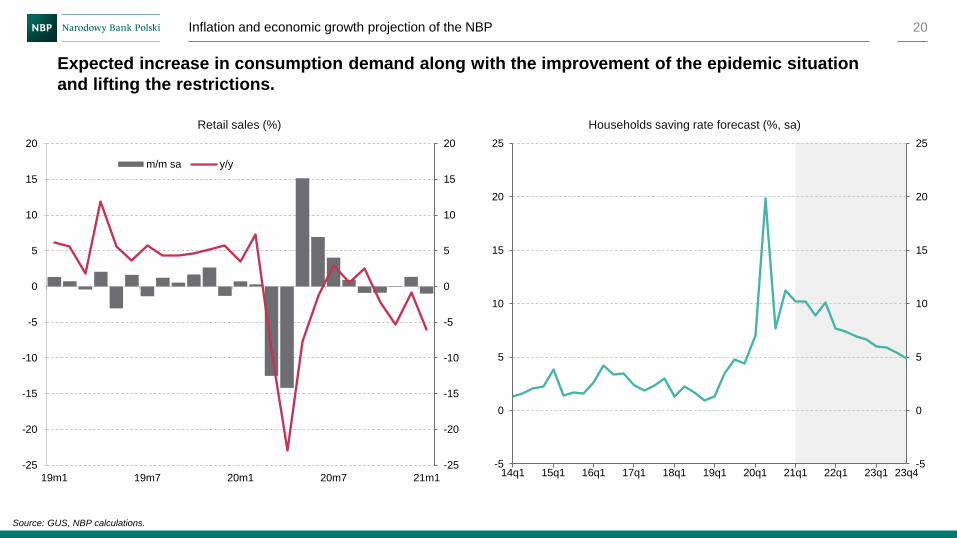
Expected increase in consumption demand along with the improvement of the epidemic situation
and lifting the restrictions.
Source: GUS, NBP calculations.
Retail sales (%)
-5
0
5
10
15
20
25
-5
0
5
10
15
20
25
14q1 15q1 16q1 17q1 18q1 19q1 20q1 21q1 22q1 23q1 23q4
Households saving rate forecast (%, sa)
-25
-20
-15
-10
-5
0
5
10
15
20
-25
-20
-15
-10
-5
0
5
10
15
20
19m1 19m7 20m1 20m7 21m1
m/m sa y/y
Inflation and economic growth projection of the NBP 21
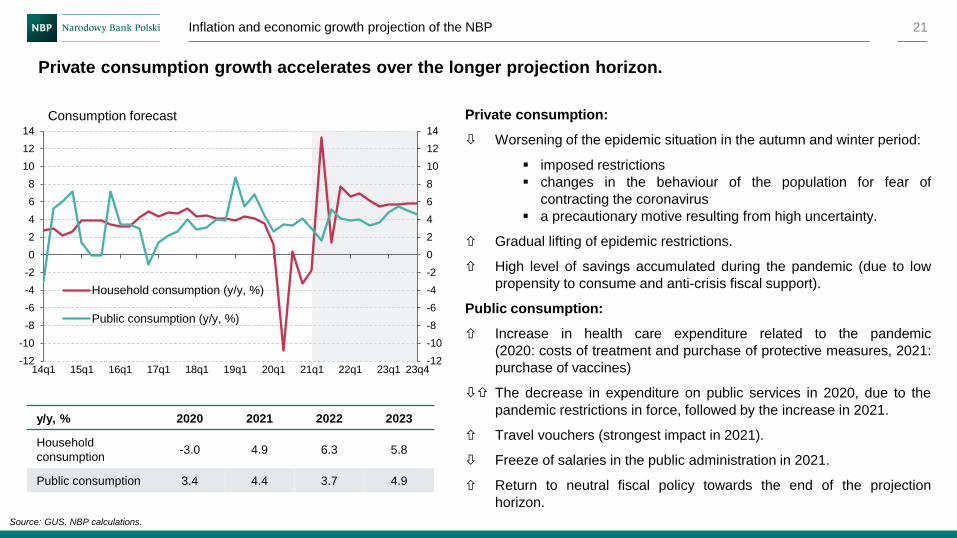
Private consumption:
Worsening of the epidemic situation in the autumn and winter period:
▪ imposed restrictions
▪ changes in the behaviour of the population for fear of
contracting the coronavirus
▪ a precautionary motive resulting from high uncertainty.
Gradual lifting of epidemic restrictions.
High level of savings accumulated during the pandemic (due to low
propensity to consume and anti-crisis fiscal support).
Public consumption:
Increase in health care expenditure related to the pandemic
(2020: costs of treatment and purchase of protective measures, 2021:
purchase of vaccines)
The decrease in expenditure on public services in 2020, due to the
pandemic restrictions in force, followed by the increase in 2021.
Travel vouchers (strongest impact in 2021).
Freeze of salaries in the public administration in 2021.
Return to neutral fiscal policy towards the end of the projection
horizon.
Private consumption growth accelerates over the longer projection horizon.
y/y, % 2020 2021 2022 2023
Household
consumption-3.0 4.9 6.3 5.8
Public consumption 3.4 4.4 3.7 4.9
Source: GUS, NBP calculations.
Consumption forecast
-12
-10
-8
-6
-4
-2
0
2
4
6
8
10
12
14
-12
-10
-8
-6
-4
-2
0
2
4
6
8
10
12
14
14q1 15q1 16q1 17q1 18q1 19q1 20q1 21q1 22q1 23q1 23q4
Household consumption (y/y, %)
Public consumption (y/y, %)
Inflation and economic growth projection of the NBP
38.3 5.6 6.4 16.4 18.1 11.3 3.80
5
10
15
20
25
30
35
40
45
now up to 3 months 4-6 months 6-12 months 12-24 months in more than24 months
never
% o
f com
panie
s w
ith s
pecifie
d
pla
ns
full sample (weighted with employment)
22
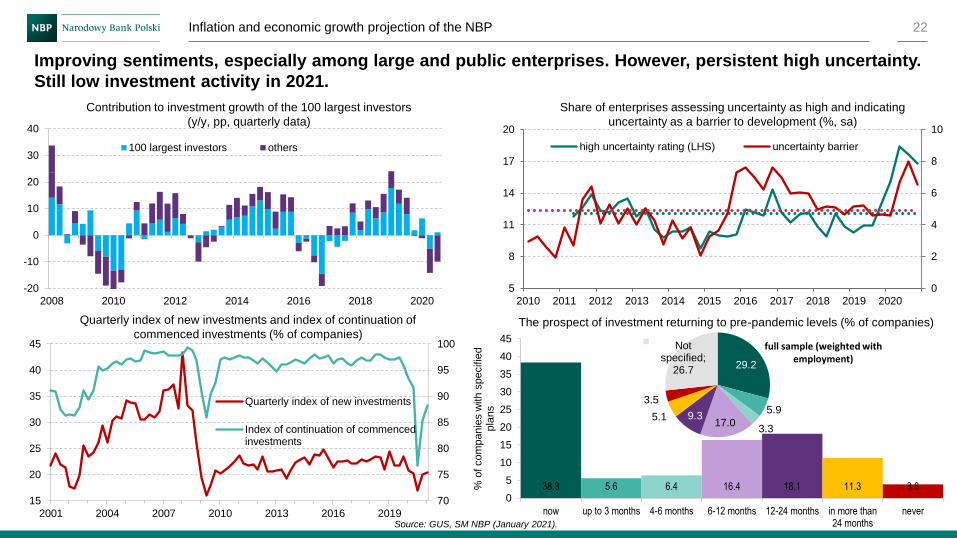
Improving sentiments, especially among large and public enterprises. However, persistent high uncertainty.
Still low investment activity in 2021.
Share of enterprises assessing uncertainty as high and indicating
uncertainty as a barrier to development (%, sa)
Contribution to investment growth of the 100 largest investors
(y/y, pp, quarterly data)
Source: GUS, SM NBP (January 2021).
0
2
4
6
8
10
5
8
11
14
17
20
2010 2011 2012 2013 2014 2015 2016 2017 2018 2019 2020
high uncertainty rating (LHS) uncertainty barrier
-20
-10
0
10
20
30
40
2008 2010 2012 2014 2016 2018 2020
100 largest investors others
Quarterly index of new investments and index of continuation of
commenced investments (% of companies)
70
75
80
85
90
95
100
15
20
25
30
35
40
45
2001 2004 2007 2010 2013 2016 2019
Quarterly index of new investments
Index of continuation of commencedinvestments
The prospect of investment returning to pre-pandemic levels (% of companies)
29.2
5.9
3.317.0
9.35.1
3.5
Not specified;
26.7
Inflation and economic growth projection of the NBP 23
Contributions to public investment growth
(current prices, y/y, %)
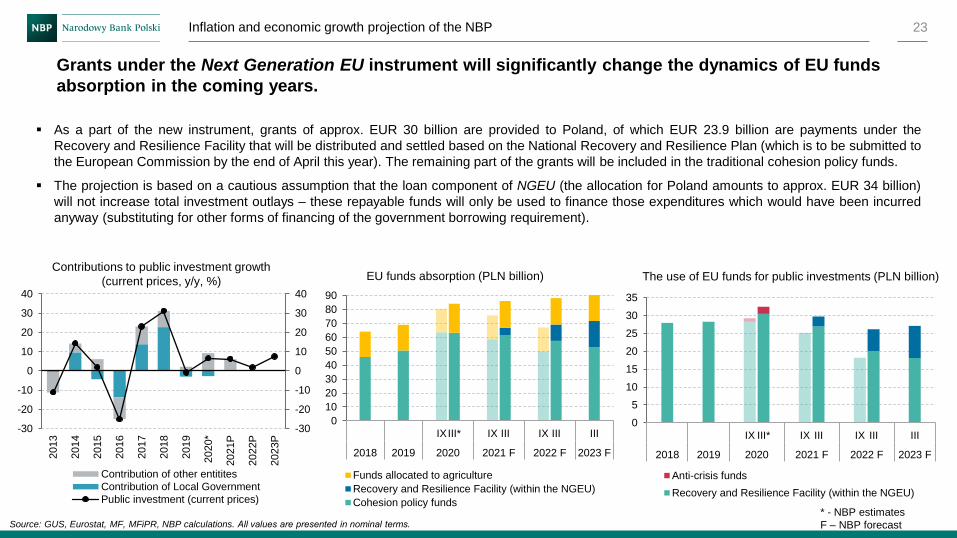
Grants under the Next Generation EU instrument will significantly change the dynamics of EU funds
absorption in the coming years.
Source: GUS, Eurostat, MF, MFiPR, NBP calculations. All values are presented in nominal terms.
EU funds absorption (PLN billion) The use of EU funds for public investments (PLN billion)
* - NBP estimates
F – NBP forecast
▪ As a part of the new instrument, grants of approx. EUR 30 billion are provided to Poland, of which EUR 23.9 billion are payments under the
Recovery and Resilience Facility that will be distributed and settled based on the National Recovery and Resilience Plan (which is to be submitted to
the European Commission by the end of April this year). The remaining part of the grants will be included in the traditional cohesion policy funds.
▪ The projection is based on a cautious assumption that the loan component of NGEU (the allocation for Poland amounts to approx. EUR 34 billion)
will not increase total investment outlays – these repayable funds will only be used to finance those expenditures which would have been incurred
anyway (substituting for other forms of financing of the government borrowing requirement).
-30
-20
-10
0
10
20
30
40
-30
-20
-10
0
10
20
30
40
2013
2014
2015
2016
2017
2018
2019
2020*
2021P
2022P
2023P
Contribution of other entitites
Contribution of Local Government
Public investment (current prices)
0
10
20
30
40
50
60
70
80
90
IXIII* IX III IX III III
2018 2019 2020 2021 F 2022 F 2023 F
Funds allocated to agriculture
Recovery and Resilience Facility (within the NGEU)
Cohesion policy funds
0
5
10
15
20
25
30
35
IX III* IX III IX III III
2018 2019 2020 2021 F 2022 F 2023 F
Anti-crisis funds
Recovery and Resilience Facility (within the NGEU)
Inflation and economic growth projection of the NBP 24
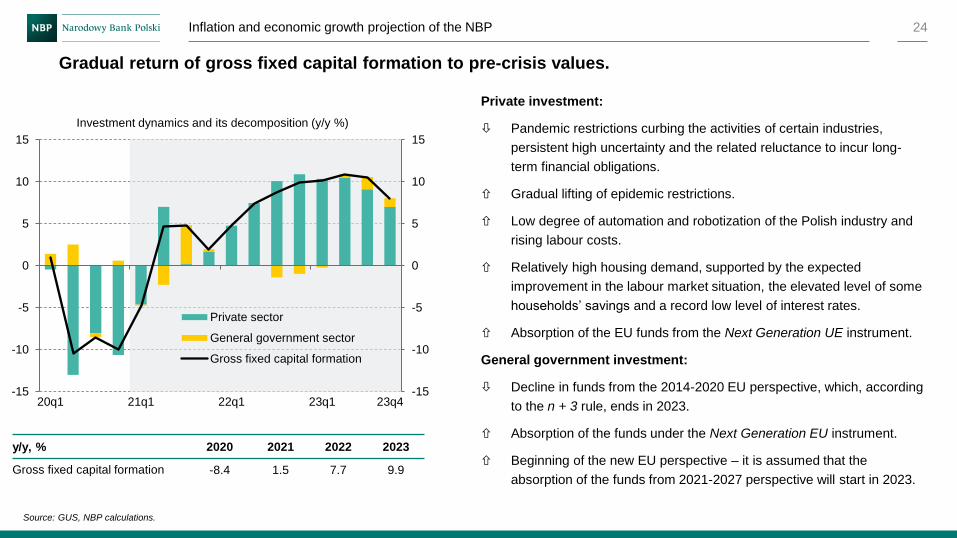
Private investment:
Pandemic restrictions curbing the activities of certain industries,
persistent high uncertainty and the related reluctance to incur long-
term financial obligations.
Gradual lifting of epidemic restrictions.
Low degree of automation and robotization of the Polish industry and
rising labour costs.
Relatively high housing demand, supported by the expected
improvement in the labour market situation, the elevated level of some
households’ savings and a record low level of interest rates.
Absorption of the EU funds from the Next Generation UE instrument.
General government investment:
Decline in funds from the 2014-2020 EU perspective, which, according
to the n + 3 rule, ends in 2023.
Absorption of the funds under the Next Generation EU instrument.
Beginning of the new EU perspective – it is assumed that the
absorption of the funds from 2021-2027 perspective will start in 2023.
Gradual return of gross fixed capital formation to pre-crisis values.
Source: GUS, NBP calculations.
y/y, % 2020 2021 2022 2023
Gross fixed capital formation -8.4 1.5 7.7 9.9
Investment dynamics and its decomposition (y/y %)
-15
-10
-5
0
5
10
15
-15
-10
-5
0
5
10
15
20q1 21q1 22q1 23q1 23q4
Private sector
General government sector
Gross fixed capital formation
Inflation and economic growth projection of the NBP 25
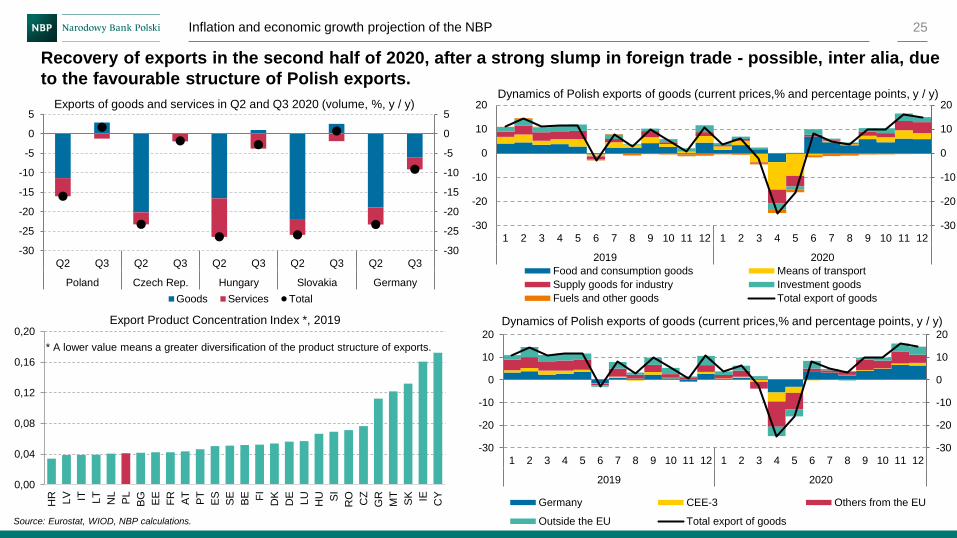
Recovery of exports in the second half of 2020, after a strong slump in foreign trade - possible, inter alia, due
to the favourable structure of Polish exports.
Exports of goods and services in Q2 and Q3 2020 (volume, %, y / y)Dynamics of Polish exports of goods (current prices,% and percentage points, y / y)
Dynamics of Polish exports of goods (current prices,% and percentage points, y / y)
Source: Eurostat, WIOD, NBP calculations.
-30
-25
-20
-15
-10
-5
0
5
-30
-25
-20
-15
-10
-5
0
5
Q2 Q3 Q2 Q3 Q2 Q3 Q2 Q3 Q2 Q3
Poland Czech Rep. Hungary Slovakia Germany
Goods Services Total
-30
-20
-10
0
10
20
-30
-20
-10
0
10
20
1 2 3 4 5 6 7 8 9 10 11 12 1 2 3 4 5 6 7 8 9 10 11 12
2019 2020
Germany CEE-3 Others from the EU
Outside the EU Total export of goods
-30
-20
-10
0
10
20
-30
-20
-10
0
10
20
1 2 3 4 5 6 7 8 9 10 11 12 1 2 3 4 5 6 7 8 9 10 11 12
2019 2020
Food and consumption goods Means of transport
Supply goods for industry Investment goods
Fuels and other goods Total export of goods
0,00
0,04
0,08
0,12
0,16
0,20
HR
LV IT LT
NL
PL
BG
EE
FR
AT
PT
ES
SE
BE FI
DK
DE
LU
HU SI
RO
CZ
GR
MT
SK IE CY
* A lower value means a greater diversification of the product structure of exports.
Export Product Concentration Index *, 2019
Inflation and economic growth projection of the NBP 26
Source: GUS, WIOD, NBP calculations.
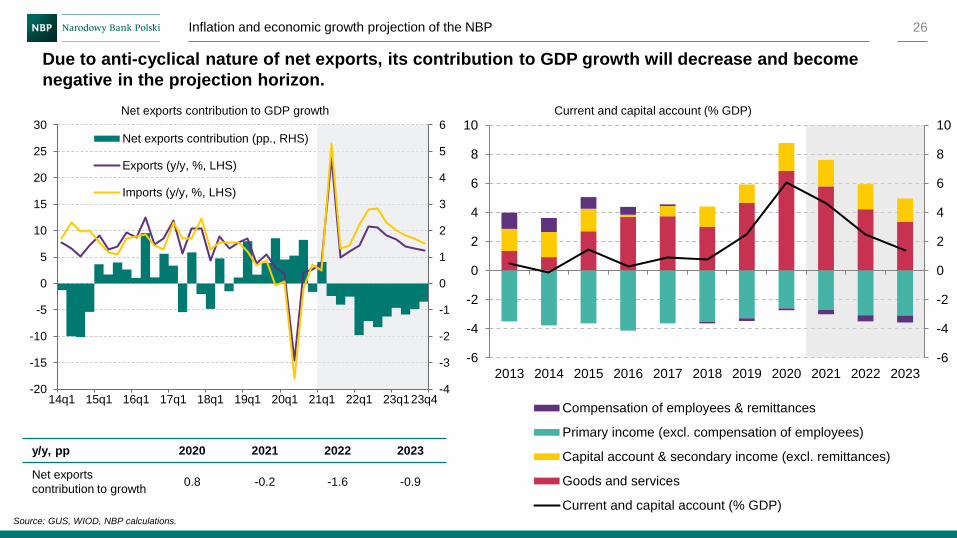
Due to anti-cyclical nature of net exports, its contribution to GDP growth will decrease and become
negative in the projection horizon.
y/y, pp 2020 2021 2022 2023
Net exports
contribution to growth0.8 -0.2 -1.6 -0.9
Net exports contribution to GDP growth Current and capital account (% GDP)
-6
-4
-2
0
2
4
6
8
10
-6
-4
-2
0
2
4
6
8
10
2013 2014 2015 2016 2017 2018 2019 2020 2021 2022 2023
Compensation of employees & remittances
Primary income (excl. compensation of employees)
Capital account & secondary income (excl. remittances)
Goods and services
Current and capital account (% GDP)
-4
-3
-2
-1
0
1
2
3
4
5
6
-20
-15
-10
-5
0
5
10
15
20
25
30
14q1 15q1 16q1 17q1 18q1 19q1 20q1 21q1 22q1 23q123q4
Net exports contribution (pp., RHS)
Exports (y/y, %, LHS)
Imports (y/y, %, LHS)
Inflation and economic growth projection of the NBP 27
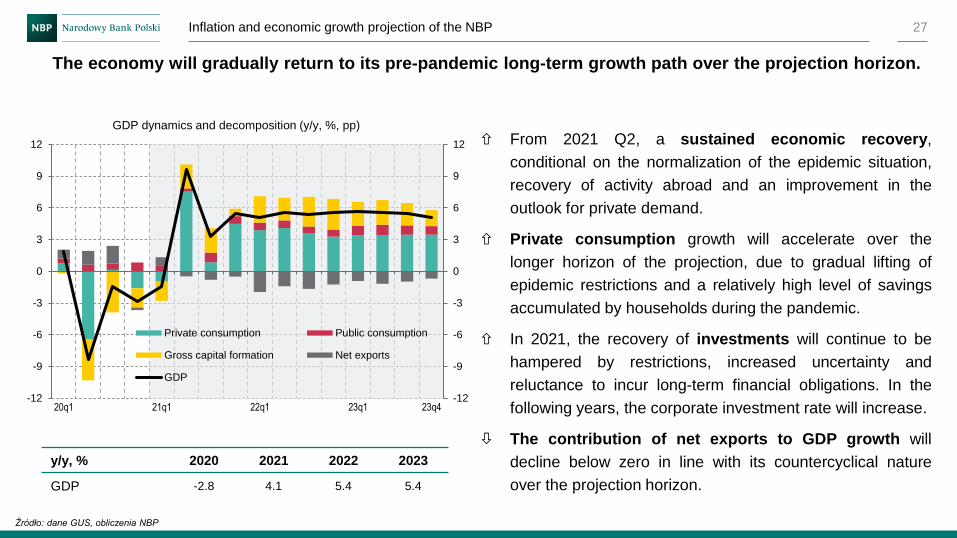
The economy will gradually return to its pre-pandemic long-term growth path over the projection horizon.
From 2021 Q2, a sustained economic recovery,
conditional on the normalization of the epidemic situation,
recovery of activity abroad and an improvement in the
outlook for private demand.
Private consumption growth will accelerate over the
longer horizon of the projection, due to gradual lifting of
epidemic restrictions and a relatively high level of savings
accumulated by households during the pandemic.
In 2021, the recovery of investments will continue to be
hampered by restrictions, increased uncertainty and
reluctance to incur long-term financial obligations. In the
following years, the corporate investment rate will increase.
The contribution of net exports to GDP growth will
decline below zero in line with its countercyclical nature
over the projection horizon.
y/y, % 2020 2021 2022 2023
GDP -2.8 4.1 5.4 5.4
Źródło: dane GUS, obliczenia NBP
GDP dynamics and decomposition (y/y, %, pp)
-12
-9
-6
-3
0
3
6
9
12
-12
-9
-6
-3
0
3
6
9
12
20q1 21q1 22q1 23q1 23q4
Private consumption Public consumption
Gross capital formation Net exports
GDP
Inflation and economic growth projection of the NBP 28
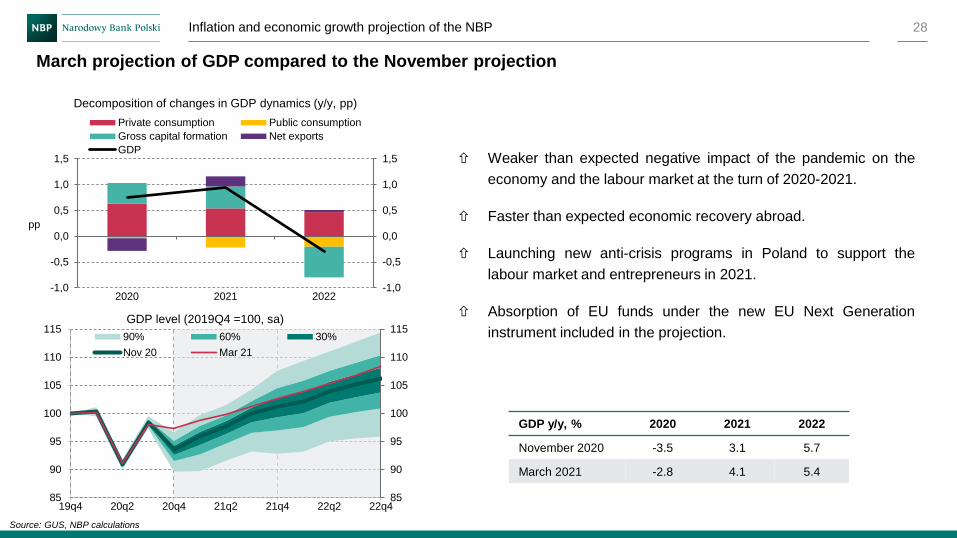
March projection of GDP compared to the November projection
Source: GUS, NBP calculations
Weaker than expected negative impact of the pandemic on the
economy and the labour market at the turn of 2020-2021.
Faster than expected economic recovery abroad.
Launching new anti-crisis programs in Poland to support the
labour market and entrepreneurs in 2021.
Absorption of EU funds under the new EU Next Generation
instrument included in the projection.
GDP y/y, % 2020 2021 2022
November 2020 -3.5 3.1 5.7
March 2021 -2.8 4.1 5.4
pp
-1,0
-0,5
0,0
0,5
1,0
1,5
-1,0
-0,5
0,0
0,5
1,0
1,5
2020 2021 2022
Private consumption Public consumption
Gross capital formation Net exports
GDP
85
90
95
100
105
110
115
85
90
95
100
105
110
115
19q4 20q2 20q4 21q2 21q4 22q2 22q4
90% 60% 30%
Nov 20 Mar 21
GDP level (2019Q4 =100, sa)
Decomposition of changes in GDP dynamics (y/y, pp)
Inflation and economic growth projection of the NBP 29
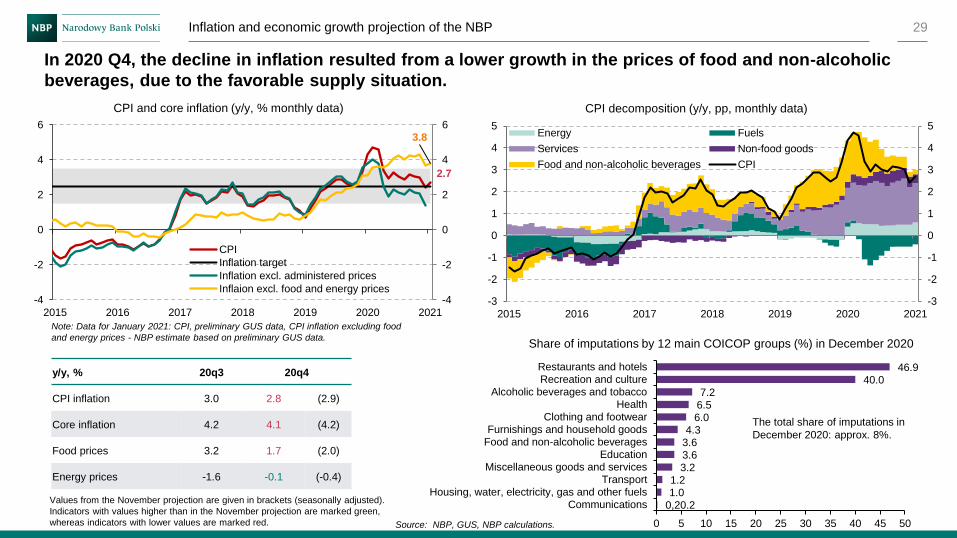
In 2020 Q4, the decline in inflation resulted from a lower growth in the prices of food and non-alcoholic
beverages, due to the favorable supply situation.
Source: NBP, GUS, NBP calculations.
CPI decomposition (y/y, pp, monthly data)
Values from the November projection are given in brackets (seasonally adjusted).
Indicators with values higher than in the November projection are marked green,
whereas indicators with lower values are marked red.
CPI and core inflation (y/y, % monthly data)
2.7
3.8
-4
-2
0
2
4
6
-4
-2
0
2
4
6
2015 2016 2017 2018 2019 2020 2021
CPI
Inflation target
Inflation excl. administered prices
Inflaion excl. food and energy prices-3
-2
-1
0
1
2
3
4
5
-3
-2
-1
0
1
2
3
4
5
2015 2016 2017 2018 2019 2020 2021
Energy Fuels
Services Non-food goods
Food and non-alcoholic beverages CPI
y/y, % 20q3 20q4
CPI inflation 3.0 2.8 (2.9)
Core inflation 4.2 4.1 (4.2)
Food prices 3.2 1.7 (2.0)
Energy prices -1.6 -0.1 (-0.4)
Note: Data for January 2021: CPI, preliminary GUS data, CPI inflation excluding food
and energy prices - NBP estimate based on preliminary GUS data.
0,20.21.01.2
3.2
3.63.64.3
6.06.5
7.240.0
46.9
0 5 10 15 20 25 30 35 40 45 50
CommunicationsHousing, water, electricity, gas and other fuels
Transport
Miscellaneous goods and servicesEducation
Food and non-alcoholic beveragesFurnishings and household goods
Clothing and footwearHealth
Alcoholic beverages and tobaccoRecreation and culture
Restaurants and hotels
The total share of imputations in
December 2020: approx. 8%.
Share of imputations by 12 main COICOP groups (%) in December 2020
Inflation and economic growth projection of the NBP 30
CPI inflation excluding food and energy prices (y/y, %, monthly data)
Decomposition of core inflation (y/y, pp, monthly data)Decomposition of core inflation - contributions
(y/y, pp)
Dynamics of core inflation and its components
(y/y, %)
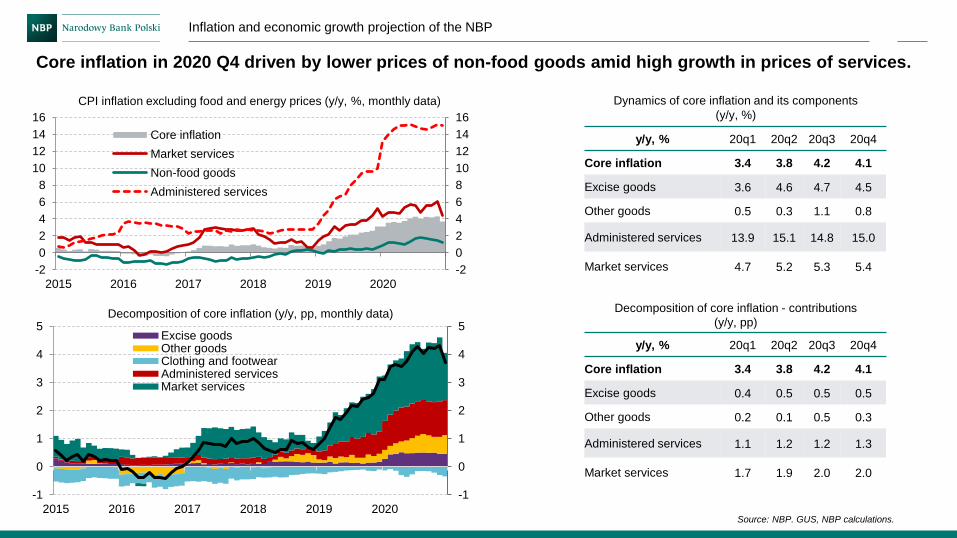
Core inflation in 2020 Q4 driven by lower prices of non-food goods amid high growth in prices of services.
Source: NBP. GUS, NBP calculations.
y/y, % 20q1 20q2 20q3 20q4
Core inflation 3.4 3.8 4.2 4.1
Excise goods 3.6 4.6 4.7 4.5
Other goods 0.5 0.3 1.1 0.8
Administered services 13.9 15.1 14.8 15.0
Market services 4.7 5.2 5.3 5.4
y/y, % 20q1 20q2 20q3 20q4
Core inflation 3.4 3.8 4.2 4.1
Excise goods 0.4 0.5 0.5 0.5
Other goods 0.2 0.1 0.5 0.3
Administered services 1.1 1.2 1.2 1.3
Market services 1.7 1.9 2.0 2.0
-2
0
2
4
6
8
10
12
14
16
-2
0
2
4
6
8
10
12
14
16
2015 2016 2017 2018 2019 2020
Core inflation
Market services
Non-food goods
Administered services
-1
0
1
2
3
4
5
-1
0
1
2
3
4
5
2015 2016 2017 2018 2019 2020
Excise goodsOther goodsClothing and footwearAdministered servicesMarket services
Inflation and economic growth projection of the NBP 31
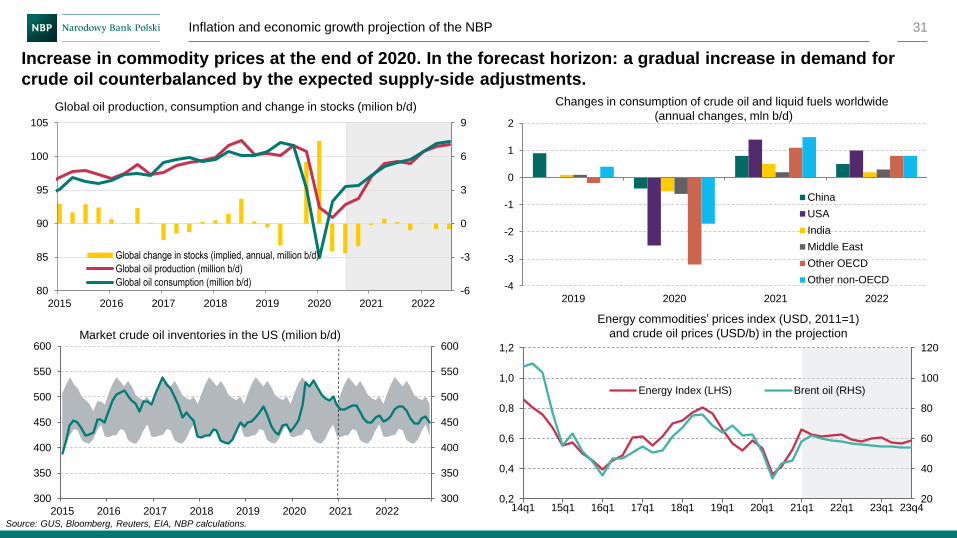
Increase in commodity prices at the end of 2020. In the forecast horizon: a gradual increase in demand for
crude oil counterbalanced by the expected supply-side adjustments.
Source: GUS, Bloomberg, Reuters, EIA, NBP calculations.
Global oil production, consumption and change in stocks (milion b/d)
Market crude oil inventories in the US (milion b/d)
Energy commodities’ prices index (USD, 2011=1)
and crude oil prices (USD/b) in the projection
Changes in consumption of crude oil and liquid fuels worldwide
(annual changes, mln b/d)
20
40
60
80
100
120
0,2
0,4
0,6
0,8
1,0
1,2
14q1 15q1 16q1 17q1 18q1 19q1 20q1 21q1 22q1 23q1 23q4
Energy Index (LHS) Brent oil (RHS)
-6
-3
0
3
6
9
80
85
90
95
100
105
2015 2016 2017 2018 2019 2020 2021 2022
Global change in stocks (implied, annual, million b/d)
Global oil production (million b/d)
Global oil consumption (million b/d) -4
-3
-2
-1
0
1
2
2019 2020 2021 2022
China
USA
India
Middle East
Other OECD
Other non-OECD
300
350
400
450
500
550
600
300
350
400
450
500
550
600
2015 2016 2017 2018 2019 2020 2021 2022
Inflation and economic growth projection of the NBP 32
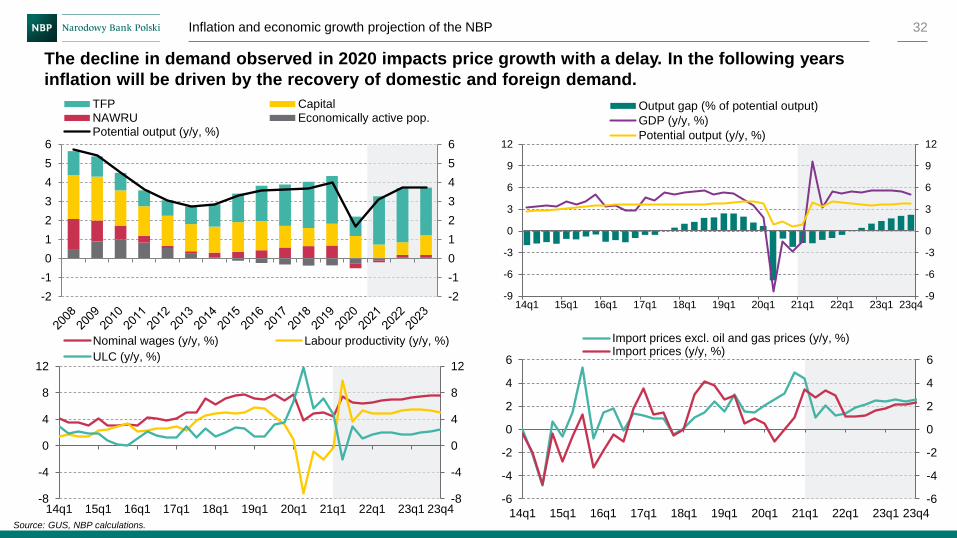
The decline in demand observed in 2020 impacts price growth with a delay. In the following years
inflation will be driven by the recovery of domestic and foreign demand.
Source: GUS, NBP calculations.
-2
-1
0
1
2
3
4
5
6
-2
-1
0
1
2
3
4
5
6
TFP CapitalNAWRU Economically active pop.Potential output (y/y, %)
-8
-4
0
4
8
12
-8
-4
0
4
8
12
14q1 15q1 16q1 17q1 18q1 19q1 20q1 21q1 22q1 23q1 23q4
Nominal wages (y/y, %) Labour productivity (y/y, %)
ULC (y/y, %)
-6
-4
-2
0
2
4
6
-6
-4
-2
0
2
4
6
14q1 15q1 16q1 17q1 18q1 19q1 20q1 21q1 22q1 23q1 23q4
Import prices excl. oil and gas prices (y/y, %)Import prices (y/y, %)
-9
-6
-3
0
3
6
9
12
-9
-6
-3
0
3
6
9
12
14q1 15q1 16q1 17q1 18q1 19q1 20q1 21q1 22q1 23q1 23q4
Output gap (% of potential output)
GDP (y/y, %)
Potential output (y/y, %)
Inflation and economic growth projection of the NBP 33
Source: GUS, NBP calculations.
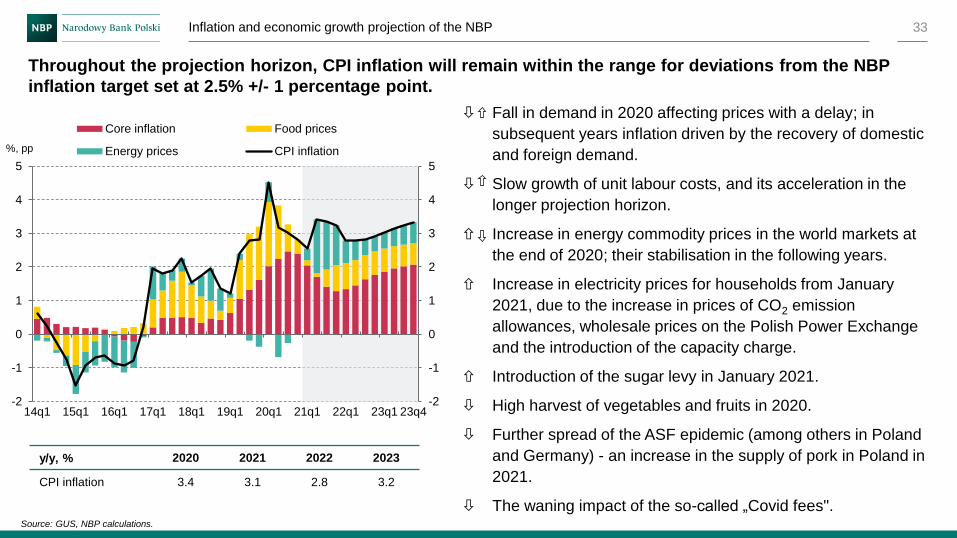
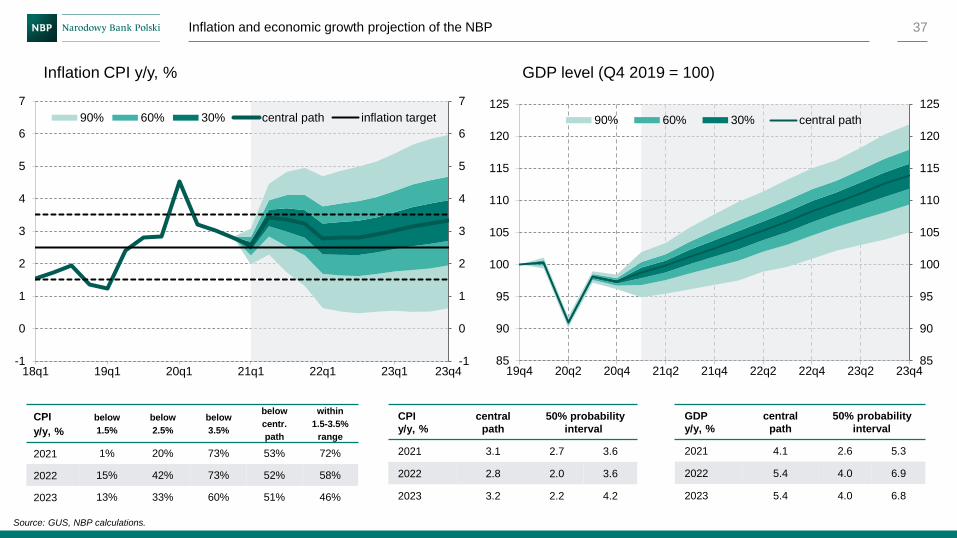
Throughout the projection horizon, CPI inflation will remain within the range for deviations from the NBP
inflation target set at 2.5% +/- 1 percentage point.
Fall in demand in 2020 affecting prices with a delay; in
subsequent years inflation driven by the recovery of domestic
and foreign demand.
Slow growth of unit labour costs, and its acceleration in the
longer projection horizon.
Increase in energy commodity prices in the world markets at
the end of 2020; their stabilisation in the following years.
Increase in electricity prices for households from January
2021, due to the increase in prices of CO2 emission
allowances, wholesale prices on the Polish Power Exchange
and the introduction of the capacity charge.
Introduction of the sugar levy in January 2021.
High harvest of vegetables and fruits in 2020.
Further spread of the ASF epidemic (among others in Poland
and Germany) - an increase in the supply of pork in Poland in
2021.
The waning impact of the so-called „Covid fees".
y/y, % 2020 2021 2022 2023
CPI inflation 3.4 3.1 2.8 3.2
-2
-1
0
1
2
3
4
5
-2
-1
0
1
2
3
4
5
14q1 15q1 16q1 17q1 18q1 19q1 20q1 21q1 22q1 23q1 23q4
Core inflation Food prices
Energy prices CPI inflation%, pp
Inflation and economic growth projection of the NBP 34
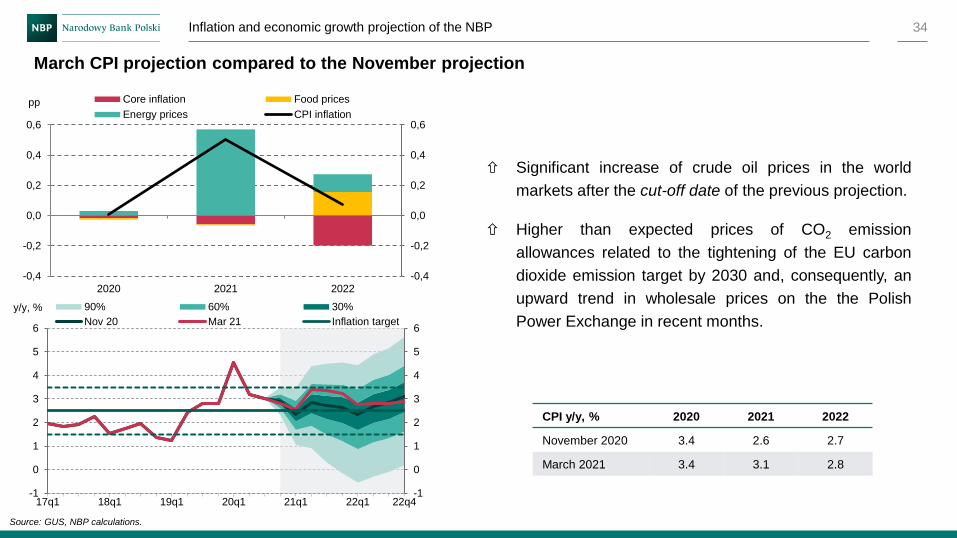
March CPI projection compared to the November projection
Source: GUS, NBP calculations.
CPI y/y, % 2020 2021 2022
November 2020 3.4 2.6 2.7
March 2021 3.4 3.1 2.8
pp
y/y, %
-0,4
-0,2
0,0
0,2
0,4
0,6
2020 2021 2022
-0,4
-0,2
0,0
0,2
0,4
0,6
Core inflation Food prices
Energy prices CPI inflation
-1
0
1
2
3
4
5
6
-1
0
1
2
3
4
5
6
17q1 18q1 19q1 20q1 21q1 22q1 22q4
90% 60% 30%
Nov 20 Mar 21 Inflation target
Significant increase of crude oil prices in the world
markets after the cut-off date of the previous projection.
Higher than expected prices of CO2 emission
allowances related to the tightening of the EU carbon
dioxide emission target by 2030 and, consequently, an
upward trend in wholesale prices on the the Polish
Power Exchange in recent months.
Outline:
Inflation and economic growth projection of the NBP
Pandemic: economic
fallout
Projection 2021 – 2023
▪ Economic conditions
abroad
▪ Polish economy
Uncertainty
35
Uncertainty
▪ Risk factors
▪ Fan charts
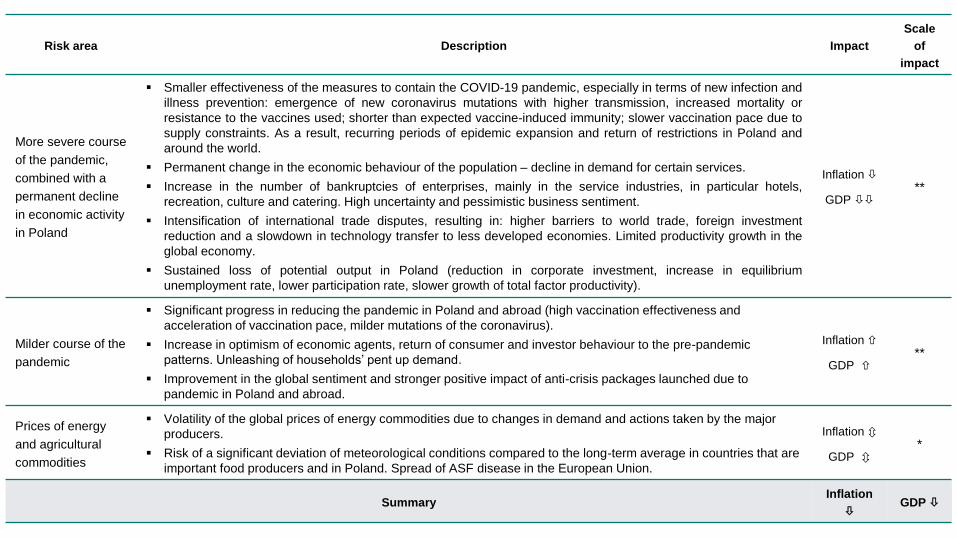
Risk area Description Impact
Scale
of
impact
More severe course
of the pandemic,
combined with a
permanent decline
in economic activity
in Poland
▪ Smaller effectiveness of the measures to contain the COVID-19 pandemic, especially in terms of new infection and
illness prevention: emergence of new coronavirus mutations with higher transmission, increased mortality or
resistance to the vaccines used; shorter than expected vaccine-induced immunity; slower vaccination pace due to
supply constraints. As a result, recurring periods of epidemic expansion and return of restrictions in Poland and
around the world.
▪ Permanent change in the economic behaviour of the population – decline in demand for certain services.
▪ Increase in the number of bankruptcies of enterprises, mainly in the service industries, in particular hotels,
recreation, culture and catering. High uncertainty and pessimistic business sentiment.
▪ Intensification of international trade disputes, resulting in: higher barriers to world trade, foreign investment
reduction and a slowdown in technology transfer to less developed economies. Limited productivity growth in the
global economy.
▪ Sustained loss of potential output in Poland (reduction in corporate investment, increase in equilibrium
unemployment rate, lower participation rate, slower growth of total factor productivity).
Inflation
GDP **
Milder course of the
pandemic
▪ Significant progress in reducing the pandemic in Poland and abroad (high vaccination effectiveness and
acceleration of vaccination pace, milder mutations of the coronavirus).
▪ Increase in optimism of economic agents, return of consumer and investor behaviour to the pre-pandemic
patterns. Unleashing of households’ pent up demand.
▪ Improvement in the global sentiment and stronger positive impact of anti-crisis packages launched due to
pandemic in Poland and abroad.
Inflation
GDP **
Prices of energy
and agricultural
commodities
▪ Volatility of the global prices of energy commodities due to changes in demand and actions taken by the major
producers.
▪ Risk of a significant deviation of meteorological conditions compared to the long-term average in countries that are
important food producers and in Poland. Spread of ASF disease in the European Union.
Inflation
GDP *
SummaryInflation
GDP
Inflation and economic growth projection of the NBP 37
GDP
y/y, %
central
path
50% probability
interval
2021 4.1 2.6 5.3
2022 5.4 4.0 6.9
2023 5.4 4.0 6.8
Source: GUS, NBP calculations.
CPI
y/y, %
below
1.5%
below
2.5%
below
3.5%
below
centr.
path
within
1.5-3.5%
range
2021 1% 20% 73% 53% 72%
2022 15% 42% 73% 52% 58%
2023 13% 33% 60% 51% 46%
CPI
y/y, %
central
path
50% probability
interval
2021 3.1 2.7 3.6
2022 2.8 2.0 3.6
2023 3.2 2.2 4.2
Inflation CPI y/y, % GDP level (Q4 2019 = 100)
-1
0
1
2
3
4
5
6
7
-1
0
1
2
3
4
5
6
7
18q1 19q1 20q1 21q1 22q1 23q1 23q4
90% 60% 30% central path inflation target
85
90
95
100
105
110
115
120
125
85
90
95
100
105
110
115
120
125
19q4 20q2 20q4 21q2 21q4 22q2 22q4 23q2 23q4
90% 60% 30% central path