61
1 Banco de la República Bogotá. D,C,. Colombia ISSN - 1657 - 7973 report Inflation J u n e 2 0 0 6

1
B a n c o d e l a R e p ú b l i c aBogotá. D,C,. Colombia
ISSN - 1657 - 7973
reportInflation
J u n e 2 0 0 6

3
Graphs and Tables 4
Abstract: Inflation at June and the Outlook 7
I, The Current Economic Situation 13A, The External Context 13B, Financial Variables 16C, Economic Activity and Employment 20D, Determinants of Inflation 24E, Inflation at June 29Box 1: The Impact of the Exchange Rate on Prices 32
II, Macroeconomic Perspectives 37A, The External Context. Balance of Payments and the Exchange Rate 37B, The Internal Context 42C, The Inflation Forecast 44Box 2: Inflation and Buying Power of the Low-Income Population in Colombia 53
Appendix: Macroeconomic Projections by Local and Foreign Analysts 55
Monetary Policy Decisions in the Last Three Months 59
Contents
4
Graphs and Tables
I. The Current Economic Situation
Graph 1 Annualized Quarterly GDP Growth
in the United States, the Euro Zone and Japan 14
Graph 2 Price of Oil (WTI) on the New York Stock Exchange 14
Graph 3 Annual Consumer Inflation in the United States 15
Graph 4 Monetary Policy Rate in the United States,
the Euro Zone and Japan 15
Graph 5 Nominal Rate of Exchange for Different Latin American Currencies
against the Dollar 15
Graph 6 Representative Market Rate of Exchange 16
Graph 7 TES Interest Rate on the Secondary Market 17
Graph 8 Monetary Aggregates, Annual Rates of Growth in Monthly Average 18
Graph 9 Real Annual Growth in Cash and Retail Sales 19
Graph 10 Gross Portfolio (L/C) 19
Graph 11 Real Interest Rates 19
Graph 12 Domestic Demand and GDP 20
Graph 13 Job Creation 23
Graph 14 Unemployment Rate 24
Graph 15 Expectations of Annual Inflation on a Monthly Basis:
Banks and Stockbrokers 25
Graph 16 Monthly Inflation Expectations 26
Graph 17 Percentage of Inflation Target Credibility: 2001 to 2006 26

5
Graph 18 Use of Installed Capacity: Fedesarrollo Survey 27
Graph 19 Output Gap 27
Graph 20 Total and Imported PPI Inflation 27
Graph 21 Urban Output per Hour Worked 28
Graph 22 Output per Hour Worked in Industry 29
Graph 23 Annual Consumer Inflation 29
Graph 24 Core Inflation Indicators 29
Graph 25 Annual Food Inflation 30
Graph 26 Annual Inflation in Regulated Goods and Services 30
Graph 27 Tradable Inflation 31
Graph 28 Non-tradable Inflation without Food and Regulated Goods/Utilities 31
Graph 29 Inflation in Rentals and "the Rest" 31
Table 1 Credit Establishments, Selected Monthly Flows 19
Table 2 Growth and Contribution to GDP per Type of Expense 21
Table 3 Sector Growth and Contribution to GDP 23
II. Macroeconomic Perspectives
Graph 30 Total Commodity Price Index, without Oil (WCF) 40
Graph 31 Fedesarrollo Consumer Survey Indexes 42
Graph 32 Annual Growth in the Industrial Production Index (IPI)
of the DANE Monthly Manufacturing Sample 44
Graph 33 Probability Distribution of the Inflation Forecast (Fan Chart) 49
Table 4 Growth Forecast for Colombia's Main Trading Partners 38
Table 5 International Prices 40
Table 6 Balance of Payments Forecast for Colombia 41
Table 7 Real Annual GDP Growth by Sectors 43
Table 8 Real Annual GDP Growth by Type of Expenditure 45
Table 9 Central Model Forecasts (MMT) 45

7
Abstract
Inflationat June andthe Outlook
ABSTRACT
• Consumer inflation declined slightly to 3.9 % in June, mainly because of the drop in foodinflation. The reduction in consumer inflation during the second quarter is explained bysupply factors: lower prices for a number of perishable foods and the decline in inflation inregulated goods/utilities.
• The rise in the exchange rate since April has yet to be reflected fully in the consumer priceindex (CPI). Depreciation usually affects consumer inflation whit a three-months lag, whichmeans the impact would not begin to be evident until July. However, there already hasbeen an increase in producer inflation. If it continues, this would imply pressure on costs.On the other hand, non-tradable inflation without food and regulated goods/utilities hasbeen stable for the past year. This suggests the increase in demand is not reflected inhigher inflationary pressures, or that these have been neutralized by declining inflationaryexpectations that are consistent with the inflation target for 2006 and the range to bedefined for 2007.
• The wage hikes observed during the year to date exceed current inflation and the target.However, the unit labor cost measured for industry is down as a result of importantincreases in labor productivity, which were evident in other urban sectors as well. Monetarypolicy decisions necessitate determining if these improvements in productivity are due tocyclical factors or temporary or permanent supply factors. There is still not enoughinformation in this respect, and the behavior of the different indicators will have to beassessed further.
• In this report, the analysis of the macro economy and its prospects for the future is notradically different from that in recent editions.
• In real terms, the Central Bank’s interest rate and interest on deposits with the financialsystem remain at historically low levels.
• Use of installed capacity is at its historic average values and measurements of theoutput gap suggest levels near zero, even considering the uncertainty surroundingthese estimates.

8
Abstract
• Expectations of inflation for 2006 and 2007 continue to be consistent with the Bank’sinflation targets.
• External conditions remain favorable: external demand and terms of trade contributedto the rise in exports and the increase in national income. High volatility on the financialand stock markets and the increase in risk perception during the second quarter didnothing to change this situation, but did affect some capital flows, especially the short-term variety. As of late, the financial and stock market indicators have seen somerecovery and less volatility, while the country-risk premium has declined.
• Household and business confidence remains high, in keeping with what the surveysshow. Under these circumstances, the economy continues to grow, supported bydomestic demand, which has increased by an annual rate of 8%. The main items inthis respect are the acceleration in household consumption and the high rate ofinvestment.
• Given these conditions, the Board of Directors of Banco de la República (BDBR) has saidthe Colombian economy requires no monetary incentive to continue to operate satisfactorily.In fact, there are several reasons why the monetary incentive will have to be reduced graduallyto lower inflation in the direction of the long-term goal.
• If real interest rates remain low and external and domestic factors continue to favoran increase in spending, the momentum in aggregate demand would continue, makingit harder in the future to lower inflation in non-tradable goods and services.
• If part of the rise in external interest rates or in the country-risk premiums is lasting,the same will apply to a portion of the increase in the real exchange rate, and therelative price of tradable goods will tend to increase. This means tradable inflationwill have less of an impact than before on lowering inflation.
• Credit accelerated, although there was no change in real lending rates; some evendeclined. This increased momentum probably has broadened the current impact ofthe monetary incentive on aggregate demand.
• At its meetings on April 28 and June 20, the BDBR ruled an increase in intervention ratesbased on these considerations. No changes to this effect were adopted at the May 26 andJuly 27 meetings. These decisions consider the fact that monetary policy operates with arelatively long lag. This means the required adjustments must be made well in advance so asnot to jeopardize future targets for inflation and the credibility of the policy itself.
• These decisions also ratify the gradual nature of the changes in the stance of Colombia’smonetary policy. Given the uncertainty under which monetary policy operates, a gradualapproach to decisions makes it possible to include new information that helps to redefinethe BDBR’s perception of important macroeconomic aspects such as changes in productivity,use of installed capacity, the extent of competition in different markets and the movement of

9
Abstract
international capital markets. These elements are crucial to a macroeconomic diagnosis, butare surrounded by a great deal of uncertainty. A gradual approach to adjustments in thestance of monetary policy also avoids excessive volatility in interest rates, output andemployment. However, it is important to recognize that a gradual approach is possible dueto the positive trend in inflationary expectations and the credibility acquired by the country’smonetary policy.
Board of DirectorsBanco de la República

10
Abstract

11
Abstract
Bythe Programming and Inflation Department
Division of Economic Studies
reportInflation

12
Technical ManagementHernando VargasManager
Division of Economic StudiesJorge Hernán ToroDeputy Division Chief
Programming and Inflation DepartmentJuan Mauricio RamírezDirector
Inflation Section (*)Adolfo León CoboSection Chief
Alejandro ReyesAndrés Mauricio VelascoEdgar CaicedoEliana GonzálezJosé Luis TorresJuan Nicolás HernándezLuisa Fernanda CharryLuz Adriana Flórez
(*) This report was prepared with the help of Macroeconomic Programming Section ChiefGloria Alonso, Mario Nigrinis and Martha López of the Special Affairs Unit, Franz Hamann,Director of the Macroeconomic Models Department, Luis Fernando Melo, NorbertoRodríguez and Julián Pérez.

13
External conditions remain favorable for Colombia, despite financialvolatility. The momentum in world demand continues, coupled withhigh terms of trade. At the time this report was written, there was atendency towards less volatility.
The drop in stock and TES prices did not include other assets such asreal estate. Housing prices continued to rise at a moderate pace andthe prices of other domestic assets had recovered by the end of thequarter.
The Colombian economy experienced solid growth during the first halfof 2006. The rise in domestic demand far outpaced the historic average,with a major increase in household consumption. Credit is playing amore important role and some interest rates are lower, despite theincrease in the Central Bank’s rates.
Consumer inflation was down again in the second quarter, mainlybecause of supply factors. The reduction was due to regulated goods/utilities and staple foods. Depreciation continued to have a limited impacton the CPI, but was important for producer prices. There were nomajor demand-pull pressures.
A. The External Context
The external panorama in recent months was characterized by a great deal ofvolatility on the financial markets associated with increases in inflation andwith expectations of higher interest rates in several of the developed economies.However, this situation did not overshadow the good performance of theworld economy. Its growth during the first half of the year was consistent withwhat was anticipated in the previous report.
The increase in the economy worldwide was lead by the United States,with 5.6% growth (annualized quarterly) during the first three months of2006, although the latest indicators suggest this tendency is near the breaking
I. The CurrentEconomic Situation

14
point1. Levels extent of employment and industrialproduction remained favorable, while other figuressuch as those on retail sales and the trade balancesuggested less growth in consumption (Graph 1).Although housing prices remained high, home salesslowed. This suggests the possibility that the housingmarket will wind down, which analysts regard asextremely crucial to the country’s economic per-formance.
Other developed economies, such as the Eurozone and Japan, saw positive momentum, whichindicates they appear to be on a path towardssustained growth. First-quarter growth was 2.4%in the Euro zone (annualized quarterly) and nearly3% in Japan. The improvement in the job marketand in household consumption, particularly inJapan, has become increasingly important (Graph1).
The emerging economies and especially those inAsia, such as China, continued to exhibit anupward tendency. For example, the Chineseeconomy saw more than 11% growth in thesecond quarter. Two of Colombia’s major tradingpartners: Ecuador and particularly Venezuela,experienced a similar situation, thanks to high oilprices.
Commodity prices remained high due to thestrength of world demand and some supplyproblems. Oil is the clearest example. It climbedto US$76 a barrel in recent days, as a result of
political instability in the Middle East (Graph 2). The rise in commodityprices also extends to metals, including those exported by Colombia, suchas gold and nickel (which saw respective increases of 13% and 35%between the first and second quarters). In general, prices for Colombia’sbasic export items ended the quarter close to their historic levels andabove the predictions in previous reports.
Annualized Quarterly GDP Growthin the United States, the Euro Zone and Japan
Source: Datastream.
(Percentage)
-2.0
0.0
2.0
4.0
6.0
8.0
I Qtr. 04 III Qtr.04 I Qtr. 05 III Qtr.05 I Qtr. 06
United States European Union Japan
Graph 1
Graph 2
Price of Oil (WTI) on the New York Stock Exchange
Source: Bloomberg.
(Dollars/Barrel)
39
44
49
54
59
64
69
74
79
Dec-04 Feb-05 Apr-05 Jun-05 Aug-05 Oct-05 Dec-05 Feb-06 Apr-06 Jun-06
1 The preliminary figure for second-quarter growth in the United States was announced at thetime this report was being written. It is 2.5% (annualized quarterly), which is below what themarket expected and implied a negative contribution to residential investment and publicspending. The respective annual growth rate was 3.5%, which is still above that economy'spotential growth.

15
Although the external context continues to favor theregion’s economies, strong economic growth andhigh commodity prices have begun to exertinflationary pressure on the developed economies,raising fears of a sharp reduction in internationalliquidity. The situation of greatest concern withrespect to inflation is in the United States, wherecore inflation has been climbing since March andhas been above the “implicit goals” set by thatcountry’s monetary authorities2 (Graph 3). Althoughstill moderate in the Euro zone and Japan, thesepressures are growing.
These upswings in inflation prompted monetaryauthorities to raise interest rates more than themarket had anticipated. The reference rate went to5.25% in the United States and 2.75% in the Eurozone. Moving quicker than expected, the CentralBank of Japan upped its reference rate by 25 basispoints (bp), after maintaining it at near zero levelsfor almost six years (Graph 4). These expectationsof higher interest rates were reflected in morevolatility in shares, bonds and exchange ratesthroughout the world, demonstrating an increasedaversion to risk.
The volatility in financial markets had an importantimpact on the Latin American economies, particu-larly in Colombia where it was more pronouncedthere than in other parts of the region. From Mayto mid-June, the Colombian peso devaluated by9%. This is more than in Brazil (3%), Chile (4.5%)and Argentina (0.6%) (Graph 5)3. Stocksexperienced a similar situation. In Colombia, theyplummeted by 25.3% during the same period, farmore than in the aforementioned economies.However, it is important to point out that, as of 2004,stock prices in Colombia rose much higher thanthose in other Latin America markets.
Graph 3
Annual Consumer Inflationin the United States
Source: Datastream.
(Percentage)
0.5
1.0
1.5
2.0
2.5
3.0
3.5
4.0
4.5
5.0
Jun-03 Dec-03 Jun-04 Dec-04 Jun-05 Dec-05 Jun-06
Total Core
Graph 4
Monetary Policy Rate in the United States,the Euro Zone and Japan
Source: European Central Bank and Datastream.
(Percentage)
0.0
1.0
2.0
3.0
4.0
5.0
Jul-02 Jan-03 Jul-03 Jan-04 Jul-04 Jan-05 Jul-05 Jan-06 Jul-06
-0.50
-0.25
0.00
0.25
0.50
0.75
1.00
(Percentage)
Euro Zone United States Japan (right scale)
Graph 5
2 Core inflation in July was 2.7% as opposed to the figure inMarch (2.1%), with 4.3% total inflation compared to 3.4%.
3 By mid-June, pressure on the Colombian peso and region'sother currencies was less evident and a new trend towardsappreciation had begun to emerge.
Nominal Rate of Exchange for Different LatinAmerican Currencies against the Dollar
Source: Datastream.
(Index at February 25, 2006=100)
95
100
105
110
115
Mar-06 Apr-06 May-06 Jun-06 Jul-06Feb-06
Argentina(ARS/US$)
Chile(CHP/US$)
Colombia($/US$)
Brazil(BRL/US$)

16
B. Financial Variables
As indicated earlier, the second quarter saw an extraordinary rise in volatilityon the financial markets, along with more expectations of external interestrate hikes, a strong tendency towards peso depreciation, a rise in interest ongovernment bonds (TES) and a sharp drop in stock prices. Also, the growthin monetary aggregates accelerated in recent months, as did the amount ofcredit extended by the financial system. This situation was coupled with anincrease of 50 bp in Banco de la República’s intervention rate: the first sinceApril 2003.
1. The Exchange Rate
Up to the end of the first quarter of 2006, low external interest ratesand the favorable external context allowed surplus liquidity to continueto be channeled towards the emerging economies, helping the currenciesof those countries to appreciate (including the Colombian peso) andlowering their country-risk premiums. This situation changed during thesecond quarter, with the increased likelihood that that interest rates wouldrise. In response to this new circumstance, portfolio capital declinedand domestic agents increased their capital outflows, all of whichweakened the exchange rate.
Consequently, by the end of June 2006, the nominal rate of exchangewas $2,633 pesos per dollar. This meant 15.4% devaluation during theyear to June and an increase of $388 pesos compared to the lowestrate, which was registered in early March (Graph 6). Other Latin
American economies also saw their exchangerates increase during the second quarter; namely,Brazil, Mexico, Chile and Argentina, but withless depreciation than in Colombia. So far thisyear, the Colombian peso has devaluated in realterms with respect to the country’s tradingpartners, including both the developedeconomies (9.4%) and the developingeconomies (9.6%).
2. Public Debt (TES)
For several years, there has been a close correlationbetween the exchange rate and TES prices andinterest rates. Recent months have been no
Graph 6
Representative Market Rate of Exchange
Source: Banco de la República.
(Pesos per Dollar)
2,200
2,300
2,400
2,500
2,600
2,700
2,800
2,900
3,000
Dec-00 Jun-01 Dec-01 Jun-02 Dec-02Jun-03 Dec-03Jun-04 Dec-04 Jun-05 Dec-05 Jun-06
The second quarter sawan extraordinary rise in
volatility on thefinancial markets...

17
exception. Depreciation in the exchange rate andthe rise in volatility on the world’s financial markets,coupled with less appetite for risk as of late March,translated into a major drop in TES prices and asubsequent rise in the interest on these bonds(Graph 7).
Initially, the increase was only in medium and long-term rates, coinciding with higher country-riskpremiums and a greater perception of risk on worldfinancial markets, which sharpened the yield curve.However, with the rate changes made by Bancode la República (25 bp on April 28 and again onJune 20), plus the anticipation of further hikes,short-term rates also reacted upward, re-establishing the slope of the yield curve, but at ahigher rate level.
Although the recent momentum in TES is associated with the external factorsmentioned already, and with the change in the stance of monetary policy, theextensive rise in interest rates –more than 300 bp in the longest-term rates–also reflects a correction in what might have been an excessive price rise theyear before. In effect, the reduction in rates was continuous as of May 2004and added nearly 700 bp to those for the longest terms. Although low externalrates and the confidence reining in the markets were contributing factors, thisalso seems to have been the result of extensive leveraging possibilities fordomestic market agents.
TES rates began to decline again in recent weeks, but moderately so, and stillamidst considerable volatility (Graph 7). This tendency, also observed in otherlocal assets and in most of the emerging economies, coincided with statementsby the Federal Reserve Bank (Fed) suggesting the reduced likelihood of furtherinterest-rate hikes in that country.
3. Prices of Other Assets : Stocks and Real Estate
As with TES, the Colombian stock market also devaluated sharply andexperienced considerable volatility during the second quarter. BetweenMarch and June of this year, the General Colombian Stock ExchangeIndex (IGBC in Spanish) dropped by 31%. In fact, the Colombian stockexchange experienced the biggest price slide worldwide. However, bythe last week of June and early July, this tendency had reversed itself andthe IGBC saw another major price increase, but not enough compared tothe levels in March.
Graph 7
TES Interest Ratea/
on the Secondary Market
a/ Data at July 27, 2006.Source: SEN, Banco de la República.
(Percentage)
5.0
7.0
9.0
11.0
13.0
15.0
Jan-04 Mar-04 Jun-04 Sep-04 Dec-04 Mar-05 Jun-05 Sep-05 Dec-05 Mar-06 Jun-06
Mar-07 Apr-08 Feb 10 Apr-12 Sep-14 Jul-20
…however, the pastmonth has seen pricesfor domestic assetsrecover substantially.

18
January figures suggest housing prices continued to rise slowly, as theyhave for the past two years. Apparently, Colombian real estate nationwidehas yet to experience the sort of sharp price increase witnessed for stocksand TES as of mid-2004, although this might have happened to someextent in a few specific markets such as urban housing for high-incomehouseholds.
4. Monetary Aggregates
One implication of the high volatility in TES and stock prices has been anincrease in market risk. This is particularly important to financial brokers,whose exposure to TES is now considerable4 and might have affected thebehavior of bank assets and liabilities.
With respect to liabilities in the financial system, the entire second quartersaw evidence of accelerated growth in the supply of funds for credit(or, from the standpoint of savers, an increase in demand for deposits).One reason might be that companies and households have not onlyreplaced TES and stocks with assets in foreign currency, but also withliabilities subject to reserve requirements (LSRR), such as savingsaccounts and term deposits (CDs), among others. Graph 8 illustratesthe acceleration in M3 and LSRR during the preceding months, althoughtheir nominal growth rates at the start of the year were already relativelyhigh.
Besides the additional growth in LSRR, there has been even more of astep up in cash. Although this may be due tochanges in agents’ portfolios, it might also signalan acceleration in consumer spending. Until theend of the nineties, the tendency in cash wasassociated with consumption. However, thiscorrelation disappeared with the shift in demandfor money at the start of this decade, partlybecause of the tax on financial transactions.However, the fact that this tax has been stable inrecent years may have opened the way for areappearance of this correlation (Graph 9).
Monetary AggregatesAnnual Rates of Growthin the Monthly Average
Source: Banco de la República.
(Percentage)
4.0
10.0
16.0
22.0
28.0
34.0
Jun-02 Dec-02 Jun-03 Dec-03 Jun-04 Dec-04 Jun-05 Dec-05 Jun-06
LSRR Cash M3
Graph 8
4 Figures for May 2006 show 32.0% of all TES were held by thefinancial system. This is equivalent to $26.4 trillion pesos.Including pension and severance funds, the share is 52.6% or$44.4 trillion.

19
Real Annual Growth in Cashand in Retail Sales(Tendential Components of the Series)
Source: DANE and Banco de la República.
(Percentage)
-15.0
-10.0
-5.0
0.0
5.0
10.0
15.0
20.0
25.0
Jun-86 Jun-88 Jun-90 Jun-92 Jun-94 Jun-96 Jun-98 Jun-00 Jun-02 Jun-04 Jun-06
Cash Retail Sales
Graph 10
Credit EstablishmentsSelected Monthly Flows(Billions of pesos)
I Qtr. 06 II Qtr. 06
Net Portfolio 2,383.2 8,541.2Investments 2,012.0 (4,780.4)
TES B fin. System - changes in cash (1,561.0)
Source: Colombian Superintendent of Finance.
Table 1As to assets in the financial system, indicationssuggest that banks have increased their supply ofcredit to mitigate the higher market risk resultingfrom the devaluation in TES. Credit establishmentsincreased their loan portfolios considerably moreduring the second quarter than in the first,coinciding with a sizeable reduction in otherinvestments (Table 1).
The substantial growth in credit includes portfoliosof every type, but particularly consumer loans andrecovery on mortgages. Growth with respect tothe latter is in positive terrain, but still very low(Graph 10). Even so, the total portfolio and theportfolio directed to households (consumer credit,plus mortgage loans) is still a long ways from thehistoric highs, when measured in relation to grossdomestic product (GDP).
The recent tend in interest rates supports the ideathat the acceleration in credit during the secondquarter is more the result of an increase in supplyon the part of financial establishments than a shift indemand. Lending rates on household loans (con-sumer and credit card) continued to declinesubstantially during May and June, in both real andnominal terms. Less of a reduction also was seenin the rates on ordinary credit (Graph 11). However,
Graph 9
Gross Portfolio (L/C)(Annual Growth)
Source: Colombian Superintendent of Finance. Calculations by Banco de la República.
(Percentage)
-20.0
-10.0
0.0
10.0
20.0
30.0
40.0
50.0
Jun-02 Dec-02 Jun-03 Dec-03 Jun-04 Dec-04 Jun-05 Dec-05 Jun-06
Total Commercial without IFI Adjusted mortgageConsumer and micro-credit
Graph 11
Real Interest Rates(Monthly Averages)
Source: Colombian Superintendent of Finance. Calculations by Banco de la República.
(Percentage)
14.0
16.0
18.0
20.0
22.0
24.0
Jun-02 Dec-02 Jun-03 Dec-03 Jun-04 Dec-04 Jun-05 Dec-05 Jun-06
Consumer Credit Card Usury

20
it is important to point out that the reduction in the usury rate might havecontributed to this downturn as well.
The decline in most lending rates contrasts with the rise in the interbank rateand interest on deposits, including the rate on fixed-term deposits (DTF inSpanish). As was expected, the increase in Banco de la República’s inter-vention rates in April and June (25 bp on both occasions) was transferredquickly to the interbank rate; transfer to the DTF began when it increasedby 30 bp at the start of July. In other words, the relationship between boththese nominal rates is being re-established after several years of apparentdetachment.
C. Economic activity and employment
1. First-quarter Growth in 2006
The National Department of Statistics (DANE) reported 5.2% real growthin GDP for the first quarter of 2006. This was consistent with what anumber of analysts had predicted and quite close to Banco de laRepública’s projections. The current growth phase of the economic cyclehas continued for 14 quarters, considering that average quarterly growthsince the end of 2002 is 4.6% and has been characterized by more of anincrease in domestic demand than in output (Graph 12). However, giventhe figures available at March, the current account in the balance ofpayments has not yet to show the signs of deterioration that are evidentwhen examining the figures in constant pesos (real net external demandreached –5.0% of GDP)5. Part of this discrepancy could be explained bythe effect higher terms of trade had on national revenue.
The force of domestic demand largely explains thegrowth in GDP during the first quarter of 2006 andconfirms what was anticipated by the consumer andinvestor confidence indicators. The contribution ofhousehold consumption to GDP is a high point (Table2), especially consumption of durable goods, whichwas up by an annual rate of 18% this quarter, andhad increased by 20.5%, on average, since the startof 2004. The only unsatisfactory outcome continued
5 DANE frequently revises the figures on foreign trade; that is,exports and imports (in constant pesos). Therefore, the currentamounts should not be regarded as definitive.
Domestic Demand and GDP
Source: DANE. Calculations by Banco de la República.
(Percentage)
0.0
2.0
4.0
6.0
8.0
10.0
12.0
I Qtr. 03 III Qtr. 03 I Qtr. 04 III Qtr. 04 I Qtr. 05 III Qtr. 05 I Qtr. 06
GDP Domestic Demand
Graph 12
The total portfolio, as aportion of GDP,
remains at relativelylow levels.

21
Growth and Contribution to GDP per Type of Expense(Percentage)
I Quarter of 2006
Percentage Contributionto Growth of Growth
End Consumption 4.6 3.7Household 5.0 3.1Government 3.2 0.6
Gross Capital Formation 26.8 5.2Gross Fixed Capital Formation (GFCF) 14.7 2.7
GFCF without Civil Works 14.0 2.1Civil Works 17.8 0.6
Variation in stock 287.4 2.5
Domestic Demand 8.8 8.9
Total Exports 6.6 1.3Total Imports 23.1 (5.0)
GDP 5.2 5.2
Source: DANE. Calculations by Banco de la República.
Table 2
to be consumption of non-durables (3.6% in the first quarter, 3.2% in the twoyears before).
There was a real increase of 26.8% in gross capital formation, with majorgrowth in all items except for home and building construction, which wasdown by 1.2%. The reasons for this slump are not clear, considering thepositive trends in the variables associated with home construction, particu-larly the terms on mortgage loans and credit for builders, the increase inbuilding permits and the number of works in progress. Halted works wasthe only indicator that suggests some deterioration in the sector, based onthe construction census for seven cities with an annual increase of 7.5%, thefirst since early 2000.
Imports mirrored the force of investment and were up by 23.1% in realterms. According to estimates by Banco de la República, real imports ofcapital goods registered an increase of 25% during the first quarter, whileimports of intermediate goods rose by 17.7%. On the other hand, realimports of consumer goods increased at an annual rate of 24% during thesame period, accelerating compared to the pace they exhibited in previousyears (an average of 10% since 2004). Nonetheless, their share of totalimports was still less than 20%.

22
There was a real rise of 3.2% in public spending, which contributed only0.6% to GDP growth. The limited increase in this item during the firstquarter compared to the government’s goals for the year (approximately6% real growth) might be associated with the impact of the ElectoralAssurances Act on government contracting during the period. An increasein public spending within what was budgeted would have allowed for 5.8%GDP growth during the first quarter and, consequently, more of a rise indomestic demand and in the production of non-durables.
Total exports saw a real increase of 6.6% and continued to benefit fromfavorable external conditions. Traditional exports were not as dynamic asnon-traditional exports, mainly because of the shortcomings in coffee andferronickel exports. In March, the figures on foreign trade showedtremendous growth in non-traditional exports to Venezuela and the UnitedStates. The increase in exports to Ecuador is much slower and is leaningtowards standstill, after having peaked in the last quarter of 2005.
Growth at the sector level during the first quarter of 2006 was propelledmore by non-tradables than tradables (Table 3). This is consistent withthe favorable trend in domestic demand and its determining factors, andwith the way the exchange rate performed.
The main factors in the tradable sectors include the drop in coffeeproduction (-14.2%) due to weather problems in 2005 and the growth inmanufacturing (7.3%). The latter is explained, in part, by three moreworking days (the effect of the Easter holiday).
Another important factor with respect to tradables is the recent stability incrude oil production, which increased a bit in the two previous quarters,even though a decline in production was anticipated a few years back. Inthis case, high international oil prices have made it more profitable toproduce heavy crudes (which are less profitable) and prompted moreexploration in Colombia.
Growth in the non-tradable sectors was responsible for nearly 70% ofthe increase during the first quarter of 2006. The construction of civilworks was up, thanks to the telecommunications sectors and several majorhighway projects being developed by government agencies at the territo-rial level.
Energy generation, commerce, financial services, real estate agencies, bu-siness services and restaurants grew at a good pace, backed by industrialgrowth, abundant liquidity, good conditions on the job market and consu-mer confidence. According to the Fedesarrollo Index, consumer confi-dence rose throughout the first quarter.
Growth during the firstquarter was propelled
by the non-tradablesectors….
…while consumerconfidence continued to
grow.
Conditions on the jobmarket are still
improving.

23
Sector Growth and Contribution to GDP(Percentage)
I Qtr. 2006
Percentage Contributionto Growth of Growth
Agriculture, forestry, hunting and fishing 0.8 0.1Mining and quarrying 1.7 0.1Electricity, gas and water 3.2 0.1Manufacturing industry 7.3 1.1Construction 5.7 0.3
Buildings (1.1) 0.0Civil works 17.8 0.3
Commerce, repairs, restaurants and hotels 8.4 1.0Transport, storage and communications 9.7 0.8Financial establishments, insurance, real estate agencies
and business services 6.5 1.1Social, community and personal services 2.9 0.5
Financial brokerage services measured indirectly 13.6 (0.6)
Subtotal: Aggregate value 4.8 4.5
GDP 5.2 5.2
Taxes minus subsidies 10.3 0.7Net FBMI financial services a/ 4.2 0.5
Tradables b/ 4.4 1.7Non-tradables 5.7 3.5
a/ FBMI: financial brokerage services measured indirectly.b/ Agriculture and livestock, mining, manufacturing, air and water transport services, both complementary and auxiliary, and certain privateservices for companies are classified as tradable sectors.Source: DANE. Calculations by Banco de la República.
Table 3
2. Employment
Available indicators show a steady improvementin conditions on the job market. The number ofemployed in the thirteen major cities rose by 4.3%during the second quarter of 2006, which is a signthe rate of economic growth is being maintained.In June, the unemployment rate declined by 1.3percentage points (pp) compared to the rate inJune 2005. Throughout most of the first six monthsof the year, the increase in employment wassustained by formal jobs (as opposed to unde-remployment) (Graphs 13 and 14). However, un-deremployment rose during May and June,particularly outside the thirteen major metropolitan
Graph 13
Job Creation
Source: DANE. Calculations by Banco de la República.
(Thousands of persons in 13 cities, three-month moving average)
-300
-200
-100
0
100
200
300
400
500
600
Feb-04 Jun-04 Oct-04 Feb-05 Jun-05 Oct-05 Feb-06 Jun-06
EmployedUnderemployed Not Underemployed

24
areas6. Although the figures are too limited for aconclusive explanation, the fact that thisphenomenon was seen mainly in the small cities andrural areas could be due, in part, to more demandfor labor associated with temporary agriculturalactivities and/or with other seasonal demands suchas recreation and tourism.
All considered, the figures for the first six monthssupport the hypothesis in the last report in thesense that the job market is continuing to adjust.The decline in unemployment has occurred onpar with a standstill in the global participationrate (GPR). This suggests there has been noincrease in the labor supply in relative terms.On the supply side, employment is up and therate of hourly underemployment dropped by 1.5
pp in June of this year compared to the same month in 2005.
D. Determinants of inflation
1. The Exchange Rate
Consumer prices in Colombia are usually affected by a variation in theexchange rate (Box 1). For example, during the last major episode ofexchange-rate instability, which occurred between 2002 and 2003, oneof the results of 30% depreciation was an approximate 2 pp accelerationin consumer inflation. Normally, transmission to the CPI takes about threemonths. This is contrary to the effect on the producer price index (PPI),which tends to be immediate7.
Consequently, a large portion of the depreciation registered in the secondquarter would have been transferred to producer prices in recent months,but would not have had much effect on consumer prices. The impact inthis respect would begin only as of the third quarter. This being the case,during the second quarter, the CPI continued to benefit from the favora-ble effects of exchange stability in previous quarters, with small pricevariations for tradable goods (or those affected by the exchange rate) and
Unemployment Rate(Three-month moving average)
Source: DANE-CHS.
10.0
12.0
14.0
16.0
18.0
20.0
Jun-02 Dec-02 Jun-03 Dec-03 Jun-04 Dec-04 Jun-05 Dec-05 Jun-06Nationwide Urban
Graph 14
6 Although the June underemployment rate for the thirteen major cities showed no change withrespect to the same month the year before (31.4%), it was up by 3.9 pp nationwide (34.4% atJune 2006).
7 It is partly because producer prices for numerous imported goods are expressed in dollars andconverted into pesos at the representative market rate (RMR) in effect at the time.
25
with an annual rate of inflation in the sub-basket that was well below thetargets set by the Central Bank.
In the future, several particular features of the current situation that can alterthe extent of exchange-rate transmission will have to be taken into account:
• First of all, the extent of transmission can vary during the economiccycle. Unlike what happened in 2002-2003, the economy is nowexperiencing solid growth. In this context, companies are likely to bequicker about passing on the full increase in the exchange rate to prices,because the risk of losing customers is low.
• Secondly, many imported raw materials have increased substantially inprice and these hikes will tend to be passed on to the local producer orconsumer, magnifying the effect of depreciation.
• An opposite situation is created by the fact that the Colombian economyis now more involved with the world market. This means local companiesface more competition on the domestic market and are less able to setprices. With globalization and involvement in the world market bycountries with an abundant supply of manpower, the production costsand prices of many manufactured goods imported by Colombia havebeen reduced.
• Finally, to determine the impact on inflation, it is important to considernot only the magnitude of depreciation but also its duration, and howpermanent the increase in the exchange rate is. A short hike such as theone that seems to be underway, given the change since mid-July, canhave much less of an impact on prices than a longer one, as occurred in2002.
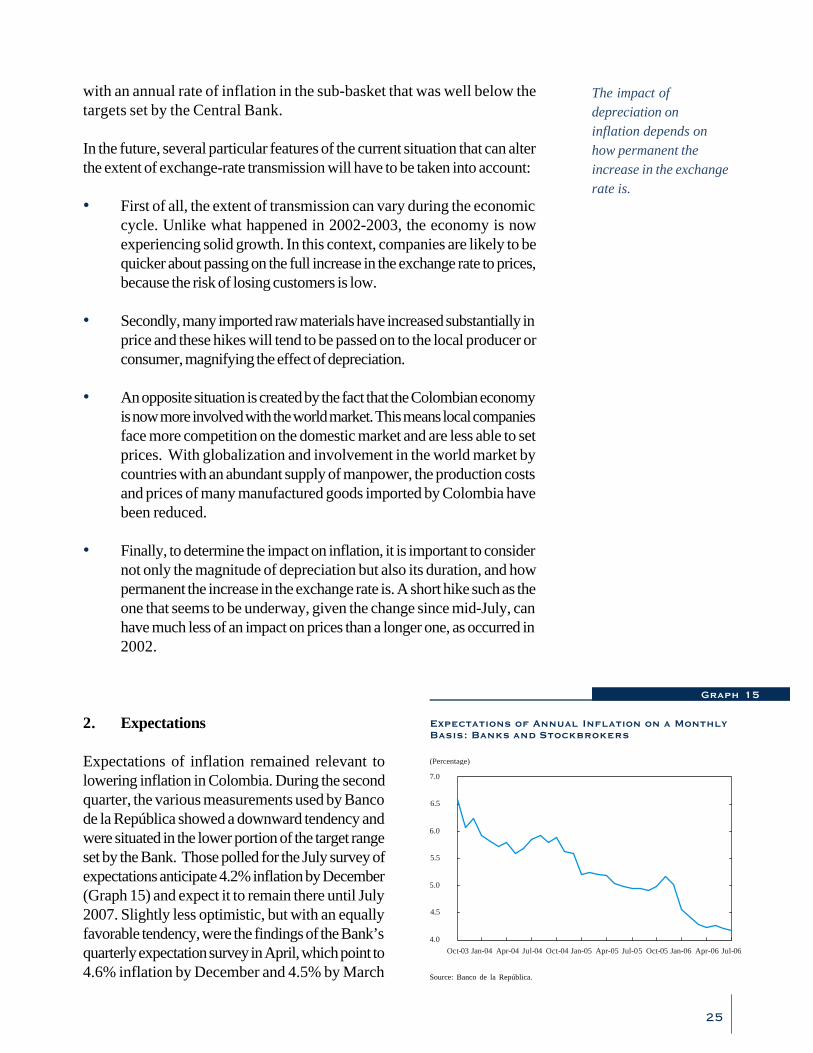
2. Expectations
Expectations of inflation remained relevant tolowering inflation in Colombia. During the secondquarter, the various measurements used by Bancode la República showed a downward tendency andwere situated in the lower portion of the target rangeset by the Bank. Those polled for the July survey ofexpectations anticipate 4.2% inflation by December(Graph 15) and expect it to remain there until July2007. Slightly less optimistic, but with an equallyfavorable tendency, were the findings of the Bank’squarterly expectation survey in April, which point to4.6% inflation by December and 4.5% by March
Graph 15
Expectations of Annual Inflation on a MonthlyBasis: Banks and Stockbrokers
Source: Banco de la República.
(Percentage)
4.0
4.5
5.0
5.5
6.0
6.5
7.0
Oct-03 Jan-04 Apr-04 Jul-04 Oct-04 Jan-05 Apr-05 Jul-05 Oct-05 Jan-06 Apr-06 Jul-06
The impact ofdepreciation oninflation depends onhow permanent theincrease in the exchangerate is.

26
2007 (Graph 16). It is important to bear in mindthat the findings of this last survey are usually higherthan the other measurements and the actual figures.
In addition to the favorable trend in expectations,the inflation target continues to be regarded as highlycredible. The vast majority of those polled for thequarterly survey in April (90.1%) believe the 2006target is feasible (Graph 17). This is the highestpercentage for the month of April since data becameavailable (Graph 17).
These expectations may have offset certaininflationary pressures that might have begun toemerge with respect to costs or because of the rapidgrowth in demand. They also may have helped torestrain wage hikes, despite the upward signal thatcould have come from this year’s increase in theminimum legal wage, which exceeded the inflationtarget by three pp.
3. Surplus Capacity and Demand-pullInflationary Pressures
The strong growth in demand during the past threeyears has been accompanied by a constant increasein the economy’s potential supply. This hasprevented the surplus production capacity inheritedfrom the crisis at the end of the nineties fromdisappearing quickly. The productivity gainsdetected in several production sectors alsocontributed to this situation. Even so, as noted in
previous editions of this report, the growth in demand has been high, with atendency to exceed productive capacity, which is why these surpluses havebeen slow to disappear.
This tendency probably continued during the first half of 2006, as evidencedby the wide range of indicators concerning use of productive-capacity(Graph 18) and by estimates of the output gap developed with differentmethods. An analysis of this information suggests surplus productive capacityis now less than what was estimated at the beginning of the year and in2005. This conclusion is possible, even with the sizeable growth in investmentduring the previous year and in the first half of 2006.
Monthly Inflation Expectations
Source: Banco de la República.
4.0
4.5
5.0
5.5
6.0
6.5
7.0
7.5
8.0
Sep-02 Mar-03 Sep-03 Mar-04 Sep-04 Mar-05 Sep-05 Mar-06 Sep-06 Mar-07
Actual Survey-October 2005
Survey-January 2006
Survey-July 2005
Survey-April 2006
Graph 16
Graph 17
Percentage of Inflation Target Credibility:2001 to 2006(Survey of Expectations Done EachYear in April)
Source: Banco de la República.
0.0
10.0
20.0
30.0
40.0
50.0
60.0
70.0
80.0
90.0
100.0
Apr-01 Apr-02 Apr-03 Apr-04 Apr-05 Apr-06
6.0% 5.0%-6.0% 4.5%-5.5% 4.0%-5.0%Target: 8.0%
90.1
79.0
70.4
16.1
69.1
51.4

27
Use of Installed Capacity:Fedesarrollo Survey(Seasonally Adjusted Series)
Source: Fedesarrollo.
(Percentage)
60.0
64.0
68.0
72.0
76.0
80.0
Jun-82 Jun-94 Jun-98 Jun-02 Jun-06Jun-86 Jun-90
UCI Fedesarrollo Historic Average Average up to 1998
Graph 18
Graph 19
Output Gap
Source: Banco de la República.
(Percentage of Potential GDP)
-8.0
-6.0
-4.0
-2.0
0.0
2.0
4.0
Mar-92 Mar-94 Mar-96 Mar-98 Mar-00 Mar-02 Mar-04 Mar-06
Graph 20
The view in this report is that factor use andproductive capacity, in general, would beapproaching a threshold as of which anaccelerated increase in demand results in pressureon prices. Accordingly, the assumption is thatthe output gap has closed during 2006 and mighteven be marginally above zero, given DANE’srecent upward revision of the growth figures for2005 (Graph 19).
It is, however, important to bear in mind thatvarious measurements of core and non-tradableinflation continue to reflect considerable stability,or have declined during the year to date. Thissuggests that inflationary pressures attributed todemand are being contained or are very limited.Low inflationary expectations might have beenan important contributing factor in this respect,but the recently detected apparent accelerationin labor productivity gains in various sectors, suchas industry and commerce, might also be exertingan influence, as will be explained later. Also, theforce of globalization may have slowed price hikesin both the tradable and non-tradable sectors byreducing production costs and increasingcompetition for local companies.
4. Costs
Second-quarter depreciation and price increasesfor a number of raw materials purchased on theworld market have affected producer prices,especially in the imported PPI, and could spellupward pressure on costs. In effect, after ahistoric low in March of this year (1.5%), totalproducer inflation rose sharply during months thatfollowed and was 4.8% in June. The increase inthe imported PPI was even higher: 4.7% in June(Graph 20).
Prices for petroleum, its by-products and possiblesubstitutes were among the external prices mostresponsible for higher producer inflation and costs.
Total and Imported PPI Inflation
Source: Banco de la República.
(Percentage)
0.0
2.0
4.0
6.0
8.0
10.0
12.0
14.0
16.0
Jun-00 Jun-01 Jun-02 Jun-03 Jun-04 Jun-05-5.0
0.0
5.0
10.0
15.0
20.0
25.0
(Percentage)
Jun-06Total PPI Imported PPI (right scale)

28
This last group includes various products of agricultural or agro-industrialorigin, such as corn, sugar cane and sugar. Until not long ago, the link betweentheir price cycle and fuel was limited. However, as a result of technologicalprogress and the limited supply of crude oil, they are beginning to be regardedas an important energy alternative. Aside from energy, price increases havebeen reported for metals, including gold, given the surge in demand due tostrong growth in Asia.
In the case of petroleum, its by-products and metals, the price hikes appearto be the result of a permanent adjustment based on new market conditions.This poses a new situation for the Colombian economy, which will have to betranslated into higher production costs. As to depreciation, it is less clear if itwill have a sustained impact on costs, volatility and the downward revisionsobserved since July.
5. Wages and Productivity
The pattern of productivity is a key variable for analyzing non-inflationarygrowth and surplus production capacity in the economy. As noted in previousreports, the only way to obtain indicators of this measurement is indirectly,through other variables. Consequently, based on the strategy defined in theSeptember 2005 Inflation Report, the following is the trend in output perhour worked, as the best indicator of work productivity.
Based on the national accounts, the continuoushome surveys (CHS) and assuming an increase of6.0% in urban GDP during the first half of the year,without government services8, it is estimated thatproductivity per worker at the urban level (Y/L)would have increased by 1.5% in the first half ofthe year and that labor productivity (Y/H) was upby 2.5% (where H is the total number of hoursworked) (Graph 21).
There have been labor-productivity gains in both thetradable and non-tradable sectors. In the case of in-dustrial manufacturing, the rate of growth in output
Urban Outputper Hour Worked a/
a/ GDP without government services, agriculture and mining.b/ a projection by Banco de la República.Source: Banco de la República.
I half,01 I half,02 I half,03 I half,04 I half,05 I half,06 36,000
37,000
38,000
39,000
40,000
41,000
42,000
(1994 pesos)
I Quarter: GDP = 6.0%; hours = 3.4% 2.5%
3.8%
Annual average
b/
Graph 21
8 This assumption is consistent with the growth forecast for thesecond quarter, which is outlined in Chapter II of this report.
High prices for oil andits by-products havepushed up costs andproducer inflation.
Productivity hasincreased in both the
tradable and non-tradable sectors.

29
per hour worked has increased, leaving behind thetemporary reduction seen in the second half of 2005and noted in the March edition of this report. Onthe other hand, the growth in sales per worker inthe retail trade also accelerated throughout the year,indicating headway in the sector’s productivity(Graph 22).
The added gains in labor productivity and themoderate industrial wage hikes have had an influenceon the stability of the nominal unit cost of labor.Based on figures available in April, the annualincrease was only 0.6%. In recent months, wagehikes in non-tradable sectors such as constructionand commerce have been moderate as well.Consequently, labor costs should have generatedno major inflationary pressure during the first half ofthe year.
Nonetheless, decisions on monetary policynecessitate identifying whether or not theseimprovements in productivity are due to cyclicalfactors or to temporary or permanent supply factors.The data available is still insufficient in this respect,and the pattern in the various indicators will have tobe evaluated further.
E. Inflation at June
Consumer inflation dropped to 3.9% during thefirst half of 2006 (as opposed to 4.9% inDecember and 4.1% in March. This is below thebottom of the range of the target set by the Bankfor the current year (Graph 23). The favorablepattern in total inflation also was evident in themeasurements of core inflation: CPI without foodwas 3.6% at June (Graph 24), which is well belowthe bottom of the target range. The other twoindicators of core inflation (nucleus 20 and CPIwithout staples, fuel and public utilities) havedeclined on par with non-food inflation, despitea few recent increases. In all, the three indicatorsaveraged 3.6% at June.
Output per Hour Worked in Industry(Tendential Component)
Source: DANE. Monthly Manufacturing Sample.
0.90
0.95
1.00
1.05
1.10
1.15
1.20
1.25
Apr-01 Oct-01 Apr-02 Oct-02 Apr-03 Oct-03 Apr-04 Oct-04 Apr-05 Oct-05 Apr-06
Graph 22
Graph 23
Annual Consumer Inflation
Source: DANE. Calculations by Banco de la República.
(Percentage)
3.5
4.0
4.5
5.0
5.5
6.0
6.5
7.0
7.5
Jun-03 Dec-03 Jun-04 Dec-04 Jun-05 Dec-05 Jun-06
Graph 24
Core Inflation Indicators
Source: DANE. Calculations by Banco de la República.
3.0
4.0
5.0
6.0
7.0
8.0
9.0
Jun-01 Dec-01 Jun-02 Dec-02 Jun-03 Dec-03 Jun-04 Dec-04 Jun-05 Dec-05 Jun-06
(Percentage)
Nucleus 20 Non-food CPI
CPI without staples, fuel or public utilities

30
Although core inflation indicators for the first halfof the year were good, the bulk of their reductionand most of the decline in total inflation was due tosupply factors with a possible temporary effect.This could have had a positive impact on two CPIsub-baskets: food and regulated goods/services.
Food inflation decreased to 4.7% (Graph 25) inJune, compared to 6.5% in December, thanks tothe slow adjustment in the price of perishables.The supply of perishables was boosted by anincrease in the amount of area under cultivationand by favorable rains. Processed foods did notperform as well as perishables. Their prices ten-ded to increase faster than during the previousyear, due to rising international prices anddepreciation in the exchange rate.
On the other hand, the increase in June for priceson regulated goods/utilities (fuel, transport andpublic utilities) was only equivalent to an annualrate of 3.7% (as opposed to 6.6% in Decemberand 4.2% in March). This is the lowest rise since1982 (Graph 26) for a sub-basket that has all butdeclined steadily since September 2003 (Graph26).
As part of regulated goods/utilities, the CPI forpublic transportation CPI (the most important onein the group) is the component that has done themost to lower inflation. By June, publictransportation rates had increased at an annual rateof just 3.1%. In several urban areas, includingBogotá, these rate hikes have been postponed for
up to 18 months, even though fuel prices soared during the same period.Public utilities were a contributing factor as well (2.9% at June). Theirgood performance was coupled with new regulations on water introducedat the start of the year and with an abundance of rainfall. This helped tolower the price of hydroelectric energy, which is the main source of energyin Colombia. The third component (fuel) has kept price increases relativelyhigh. These, in turn, exerted an upward effect on inflation, particularly duringthe second quarter. Even so, the hikes in domestic gasoline prices have yetto reflect the entire rise in external prices and in the exchange rate.
The first half of the year saw no major changes in the pace of price increaseswith respect to the “rest” of the CPI components (tradables and non-
Annual Food Inflation
Source: DANE. Calculations by Banco de la República.
Annual Inflation in Regulated Goods/Utilities(Annual Variation)
Source: DANE. Calculations by Banco de la República.
(Percentage)
1.0
3.0
5.0
7.0
9.0
11.0
13.0
Jun-02 Dec-02 Jun-03 Dec-03 Jun-04 Dec-04 Jun-05 Dec-05 Jun-06
(Percentage)
3.0
5.0
7.0
9.0
11.0
13.0
15.0
17.0
Jun-02 Dec-02 Jun-03 Dec-03 Jun-04 Dec-04 Jun-05 Dec-05 Jun-06
Graph 25
Graph 26

31
tradables without food or regulated goods/utilities).As a result, tradable inflation without food orregulated goods/utilities was 2.2% at June, a figu-re similar to the one in December and only slightlyabove the figure at March (Graph 27). Inflation inthis group does not appear to reflect the recentsurge in the exchange rate, and the small increasewitnessed in recent months may be due to the effectof higher prices for precious metals such as goldand silver and their impact on the CPI formerchandise such as jewelry.
Inflation in non-tradables (without food andregulated goods/utilities) fluctuated within a rangeof 4.4% to 4.6% during the last six months. Thiswas similar to the pattern observed in the secondhalf of 2005 (Graph 28). The behavior of the CPIfor rentals, as part of this sub-basket, was animportant factor, having grown more than expectedat the start of the year, even though these hikesdeclined during the second quarter (Graph 29).This pattern may be associated with the reductionin interest rates on home loans, which has sparkedincreased competition among banks to extendmortgage loans. Lower interest rates make it lessattractive to rent a home than to buy, therebyreducing the demand for services of this type.Added to this is the extensive supply of real estateoriginating with the recovery in construction duringprevious years.
Tradable Inflation(Annual Variation)
Source: DANE. Calculations by Banco de la República.
Non-tradable Inflation without Food orRegulated Goods/Utilities(Annual Variation)
Source: DANE. Calculations by Banco de la República.
1.5
2.5
3.5
4.5
5.5
6.5
7.5
8.5
9.5
(Percentage)
Jun-02 Dec-02 Jun-03 Dec-03 Jun-04 Dec-04 Jun-05 Dec-05 Jun-06
(Percentage)
Jun-02 Dec-02 Jun-03 Dec-03 Jun-04 Dec-04 Jun-05 Dec-05 Jun-06
3.0
3.5
4.5
5.0
6.0
5.5
4.0
Graph 27
Graph 28
Graph 29
Inflation in Rentals and the "Rest"(Annual Variation)
Source: DANE. Calculations by Banco de la República.
(Percentage)
1.0
2.0
3.0
4.0
5.0
6.0
7.0
Jun-02 Dec-02 Jun-03 Dec-03 Jun-04 Dec-04 Jun-05 Dec-05 Jun-06
Inflation in Rentals Inflation in the “Rest”

32
The Impact of the Exchange Rate on Prices
Edgar Caicedo G.*
Recent peso depreciation has sparked new concern about how it might affectconsumer prices1. Therefore, this article is intended as a review of domestic andinternational literature on how and to what extent the exchange rate can affectprice dynamics.
What does theory say about the impact of the exchange rate on prices?
In Anglo-Saxon economic literature, the response of domestic prices to changesin the exchange rate is referred to as the pass-through effect (hereinafter PT) ortransmission of the exchange rate to prices. One of the principal approaches,known as the unitary price law, indicates the prices of an item - measured in thesame currency - is the same in any country, regardless of where the item mightbe produced or sold2. Consequently, the PT in a small and open economy wouldbe equal to 100%, which means exchange rate pass-through to prices would becomplete. Other approaches consider the effects of depreciation on productioncosts and on demand.
How big is the PT in Colombia and how far does it lag?
There have been a number of studies in Colombia that quantify the PT calculationby estimating the direct association between the exchange rate and the CPI, orindirectly through the impact of import prices on the CPI (Table B1.1). In themid-nineties, using a static approach with an input-product matrix, Leibovich andCaicedo (1996) concluded that an increase in the exchange rate equivalent to10% was transformed into an acceleration of 1% in consumer inflation. Laterstudies, such as those by Rincón (2000) and Rowland (2003) with differenteconometric techniques, concluded that 80% to 84% of peso devaluation withrespect to the dollar is transferred in the long run to producer prices on importedgoods, 28% to 61% to producer prices as a whole, and between 8% and 15% to
, An inflation expert who works with the Inflation Section of the Programming and Inflation Department in the EconomicStudies Division. The opinions expressed in this article are the sole responsibility of the author and do not necessarily reflectthose of Banco de la República or its Board of Directors.
1 The peso lost 13.8% of its value with respect to the dollar between March 1 and July 18, 2006.2 This law applies under the assumption of a perfect arbitrage and mobility of goods at domestic and international level, without
measuring the differences in homogeneity and substitutability of products with the rest of the world.
Box 1

33
3 Sector estimates such as those by Rosas (2004) and Rincón et al. (203) found a broad range of PT coefficients that go from 0%to 100%.
Table R1,1Comparison of Several Pass-Through Studies in Colombia
Authors Long-term Pass-Through a/ Period Analyzed
Imported Prices Total PPI Total CPI
Leibovich and Caicedo (1996) 10.0% n.a.Rincón (2000) 84.0% 61% b/ 11.0% 1980-1998Rolawd (2003 ) 80.0% 28% 8%-15% 1983:01 - 2002:10Banco de la República Economic
Models Department (2003) 4.0% - 5.5% c/ 1984 - 2002Rosas (2004) 50% - 100% d/ 1991:01 - 2002:09Rincón, Caicedo and Rodríguez (2005) 10% - 80% d/ 1995:01 - 2002:11Deutsche Bank (2006) 4.4%
a/ The pass-through coefficients are the percentage of exchange rate devaluation transmitted to price inflation.b/ On export prices.c/ On core inflation.d/ PT range for the different industrial sub-sectors analyzed.n.a. Not applicable.
consumer prices. Other studies that directly calculated the total CPI response toan exchange rate shock (DMM-BR, 2003 and Deutche Bank, 2006) also foundlong-term effects between 4% and 6%3.
According to the aforementioned literature, the effect of depreciation on consumerinflation in Colombia is limited and incomplete. The reasons are varied and includethe existence of imperfect competition and substitutability among tradable goods,the heterogeneity of goods, the different ways agents perceive the transmissionof depreciation and, above all, the relatively low participation of marketable ortradable sectors in the Colombian consumer basket (35%).
The speed with which pass-through occurs depends on the basket of goods inquestion. With the PPI, especially imported goods, PT is almost immediate. Forthe CPI, various studies coincide in that full pass-through can take up to a year, butimportant effects begin to be felt after a quarter, especially on the tradable CPI.
Has the pass-through effect declined in Colombia?
According to the BR-EMD study (2003), the two previous decades saw a declinein imported inflation PT on core inflation in Colombia from 8.6% in the mid-eighties to levels between 4% and 5% at the end of 2002. On the other hand,

34
Table B1.2Pass-Through international comparison
(Percentage)
Country 1 month 3 months 12 months
Argentina - 13.1 23.9Brazil 1.1 6.3 9.7Chile - 5.5 5.3Colombia 1.1 3.1 4.4Mexico 3.5 7.5 13.6Latin America average 1.0 7.1 11.4Latin America average without Argentina 1.4 5.6 8.3Latin America since 2000 10.0 20.0 69.0Group of Seven (G7) without EE.UU. n,a, 2.0 11.0EMEA 10.0 17.0 25.0
Source: Deutsche Bank (2006).
the study by Rincón et al. (2005) found the PT for various industrial sectors canbe less during periods when inflation is low and the exchange rate is flexible.These are precisely the conditions found during the last seven years.
How do we compare to the rest of the world?
The recent study by Deutsche Bank (2006) shows Colombia is the country withthe least exchange rate pass-through to consumer prices (Table 1.2). It also foundPT in the Latin American economies has declined to levels found in the developedcountries (G7). Argentina is the exception, with a PT coefficient similar to thoseof the emerging economies in Europe, the Middle East and Africa. Except inMexico and Argentina, where pass-through occurs after one year, in the othercountries of the region it is complete within twelve months. Even so, consumerprices respond faster to an exchange-rate shock in Latin America than in otherregions. According to the study by Edwards (2006), the drastic drop in PT inLatin America is due to decontrol of foreign exchange and the use of inflationtargeting schemes.
Does the PT differ according to the type of exchange shock and the phase ofthe economic cycle?
There is little evidence of how the impact of sharp depreciation in the exchangerate varies compared to appreciation4. A recent study in the United States showed
4 There are no studies in Colombia on the possibility of asymmetries in exchange rate pass-through.

35
depreciation has more of an impact than appreciation on prices in the economy(Ye, Zyren, Shore and Burdette, 2005). In contrast, Mendoza (2004) concludesthe PT in Venezuela is greater when the currency appreciates than when it doesnot. In the case of Peru, the PT of considerable depreciation is 8% to 10% greaterthan with limited depreciation (Winkelried, 2003).
Finally, the PT in Peru doubles when changes in the exchange rate occur in acontext of economic growth, as opposed to a recession. A finding common tomany economies is that the PT also tends to be greater when inflation is high,than when it is low (Mendoza, 2004).
Bibliography
Department of Macroeconomic Models (DMM)-Banco de la República (2003).“Estimación del pass-through variable en el tiempo” (mimeograph), Bancode la República.
Deutsche Bank (2006). “La TAM: Exchange Rate Pass-Through,” Global MarketResearch, July.
Edwards, Sebastian (2006). “The Relationship between Exchange Rates and InflationTargeting Revisited,” in NBER, Background Paper, 12163, April
Leibovich, José; Caicedo, Edgar (1996). “Apertura e inflación en la economíacolombiana, 1990-1995,” in Revista Desarrollo y Sociedad, No. 36-37, CEDE,Universidad de los Andes.
Mendoza Lugo, Omar A. (2004). “Las asimetrías del pass-through en Venezuela,”in Colección Economía y Finanzas, Serie Documentos de Trabajo, No. 62,Banco Central de Venezuela.
Rincón, Hernán (2000). “Devaluación y precios de los agregados en Colombia,1980-1998,” in Revista Desarrollo y Sociedad, No. 46, CEDE, Universidadde los Andes.
___; Caicedo, Edgar: Rodríguez, Norberto (2005). “Efectos del pass-through dela tasa de cambio: un análisis desagregado de las importaciones colombianas,”Borradores de Economía, No. 330, Banco de la República.
Rosas, Efraín (2004). “El pass-through del tipo de cambio en Colombia: un análisissectorial” (master’s dissertation), School of Economics, Universidad de losAndes.

36
Rowland, Peter (2003). “Exchange Rate Pass-Through to Domestic Prices: TheCase of Colombia,” in Borradores de Economía, No. 254, Banco de laRepública.
Ye, Michael; Zyren, John; Shore, Joan; Burdette, Michael (2005). “RegionalComparisons, Spatial Aggregation, and Asymmetry of Price Pass-Through inUS Gasoline Markets,” Atlantic Economic Journal, Vol. 33.
Winkelried, Quezada (2003) “¨¿Es asimétrico el pass-through en el Perú?: unanálisis agregado,” in Documentos de Trabajo, Banco Central de Reservadel Perú.

37
The Colombian economy should continue to be propelled by a favorableexternal context during the remainder of the year and in 2007.Moderate cooling in the United States is expected and would be offsetby increased momentum in other developed economies and Asia.
Projections on the balance of payments indicate stable oil productionand revenue in the next few years. The current account deficit will befinanced easily with foreign direct investment.
The base scenario in this report contemplates little pressure towardsdepreciation in the coming quarters. The exchange rate is unlikely toremain at the levels observed in May and June, but neither is it expectedto return to the low levels seen at the start of the year.
No major changes in the pace of economic growth are anticipated forthis year and the next. There might be a slight slowdown in the secondquarter, due to temporary events. The credit channel is expected to playa more important role in the future.
The economic climate points to a slight acceleration in inflation,particularly during 2007. The inflation target for 2006 will likely bemet. However, surplus capacity eventually will be depleted, heighteningthe risk of inflation. Fuel and transportation probably will generatepressures that could become permanent if they filter into expectationsand wages.
A. External Context, Balance of Paymentsand Exchange Rate
1. General Aspects
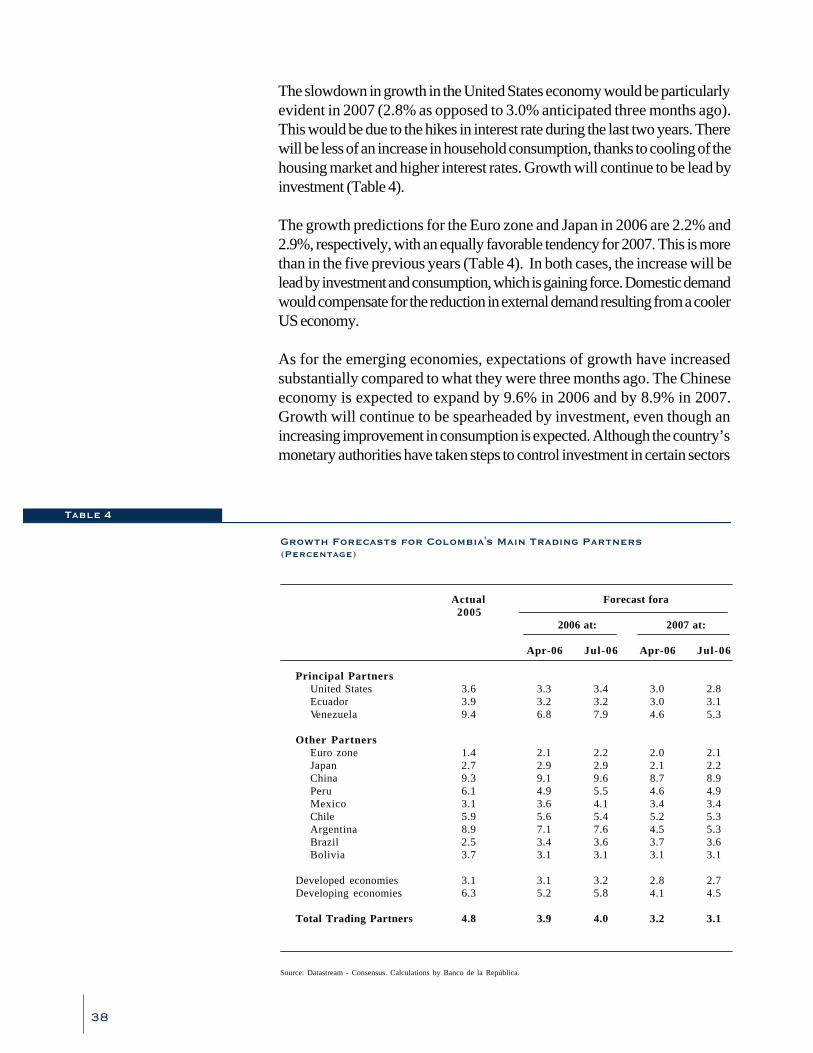
The prospects for world economic growth during the second half of this yearand the next remain favorable. Less of an increase in the US economy is notexpected to seriously effect world growth, which will be boosted by furthermomentum in the Euro zone, Japan and China. On the other hand, theexpectations of growth for Colombia¢s trading partners in the region are betterthan they were three months ago.
II. MacroeconomicPerspectives
38
Growth Forecasts for Colombia's Main Trading Partners(Percentage)
Actual Forecast fora2005
2006 at: 2007 at:
Apr-06 Jul-06 Apr-06 Jul-06
Principal PartnersUnited States 3.6 3.3 3.4 3.0 2.8Ecuador 3.9 3.2 3.2 3.0 3.1Venezuela 9.4 6.8 7.9 4.6 5.3
Other PartnersEuro zone 1.4 2.1 2.2 2.0 2.1Japan 2.7 2.9 2.9 2.1 2.2China 9.3 9.1 9.6 8.7 8.9Peru 6.1 4.9 5.5 4.6 4.9Mexico 3.1 3.6 4.1 3.4 3.4Chile 5.9 5.6 5.4 5.2 5.3Argentina 8.9 7.1 7.6 4.5 5.3Brazil 2.5 3.4 3.6 3.7 3.6Bolivia 3.7 3.1 3.1 3.1 3.1
Developed economies 3.1 3.1 3.2 2.8 2.7Developing economies 6.3 5.2 5.8 4.1 4.5
Total Trading Partners 4.8 3.9 4.0 3.2 3.1
Source: Datastream - Consensus. Calculations by Banco de la República.
The slowdown in growth in the United States economy would be particularlyevident in 2007 (2.8% as opposed to 3.0% anticipated three months ago).This would be due to the hikes in interest rate during the last two years. Therewill be less of an increase in household consumption, thanks to cooling of thehousing market and higher interest rates. Growth will continue to be lead byinvestment (Table 4).
The growth predictions for the Euro zone and Japan in 2006 are 2.2% and2.9%, respectively, with an equally favorable tendency for 2007. This is morethan in the five previous years (Table 4). In both cases, the increase will belead by investment and consumption, which is gaining force. Domestic demandwould compensate for the reduction in external demand resulting from a coolerUS economy.
As for the emerging economies, expectations of growth have increasedsubstantially compared to what they were three months ago. The Chineseeconomy is expected to expand by 9.6% in 2006 and by 8.9% in 2007.Growth will continue to be spearheaded by investment, even though anincreasing improvement in consumption is expected. Although the country’smonetary authorities have taken steps to control investment in certain sectors
Table 4

39
and high real estate prices, the anticipated impact on growth will still be quitelimited.
In the case of Venezuela, our main trading partner in the region, the expectationsare better than they were three months ago, thanks to higher oil prices. Thisreport lists a substantial increase in the growth forecast for 2006 and 2007,which is up from 6.8% and 4.6%, respectively, to 7.9% and 5.3%. However,growth in Ecuador’s economy will remain at around 3% because of lessinvestment, which has been affected by political instability. Given the foregoing,in our basic scenario, the amount of growth anticipated for our trading partners,according to the estimated balance of payments, is 4.0% in 2006 and 3.1% in2007 (Table 4).
The current situation with respect to inflation in the United States is one of themost complex in recent years. On the one hand, inflationary pressure originatingwith high prices for raw materials remains a factor and is even increasing at atime when the economy is growing at relative high rates, despite some signs ofa slowdown, and when indications of higher inflationary expectations arebeginning to emerge. On the other, the indicators show productivity appearsto have continued to expand a good pace, suggesting that potential non-inflationary growth is still significant.
The tendency among analysts has been to increase their inflation forecasts forthe United States, given the recent upswing in prices, the new hikes in pricesfor raw materials and the inertia that comes with economic growth. Accordingly,the analysts’ consensus forecasts9, which are part of our basic scenario, rosefrom 2.9% to 3.5% for 2006 in the case of total inflation, and from 2.4% to2.7% for core inflation. For 2007, the forecast increased from 2.3% to 2.7%for total inflation and from 2.4% to 2.6% for core inflation.
This outlook is associated with an increase of 25 to 50 bp in interest rates,which places them somewhere between 5.5% and 5.75% by the end of 2006.This is more than anticipated three months ago (5.25%). However, we stillbelieve the Fed’s response will depend on new information with respect toboth inflation and growth.
In the case of the Euro zone and Japan, the forecasts for interest rates are upas well, although marginally so, and are expected to end the year at 3.25% at0.5%, respectively.
The forecasts for commodity prices have increased as a result of stronggrowth worldwide and low surplus production capacity for certain primarygoods. The Economist Intelligence Unit estimates oil will be US$71.62
9 JP Morgan, Deutsche Bank, Goldman Sachs, Credit Suisse and Dresdener Kleinwort W., amongothers.

40
a barrel in 2006 and US$67.56 in 2007, which is US$10 more than theforecasts three months ago. In the short term, continuous geopolitical problemscontinue to exert pressure on prices. The current war in the Middle East is acase in point.
The prices forecast for commodities (without energy) are much higher aswell, particularly in the case of metals. According to the World CommodityForecast (WCF), prices will be up by 21.1% in 2006; the step up forecastthree months ago was 5.0%, with a drop (1.2% in 2007; 9.4% previously).This should be an incentive to production in the years ahead; however,whether or not this is the case will be clear only as of 2008 (Graph 30). Forthe long term, strong growth in several Asian countries, such as China andIndia, might keep up prices for oil and other commodities in high nucleuses.On this basis, the prices for Colombia’s major exports have increased forthe base scenario of this report, compared to what they were three months
ago (Table 5).
Although the base scenario for the externalcontext remains favorable, the financial marketscould become highly volatile in the months ahead,given reining uncertainty and less liquidityworldwide. The crucial part of the externalcontext for the countries in the region, includingColombia, will be strong world growth, whichmakes prices for our products less vulnerable.Better terms of trade will continue to boost foreigndirect investment, especially investment to tapnatural resources.
International Prices
Average Projection for 2006 Projection for 2007
2003 2004 2005 Current a/ Previous b/ Current a/ Previous b/
Coffee (ex-dock) (dollars/pound) 0.7 0.8 1.1 1.2 1.1 1.0 1.0Oil (dollars/barrel) 29.0 37.3 49.8 59.0 53.5 61.8 52.9Coal (dollars/ton) 28.2 36.1 47.9 47.9 47.5 50.2 48.8Ferronickel (dollars/pound) 1.4 2.3 2.4 2.4 2.4 2.2 2.2Gold (dollars/troy ounce) 362.5 409.3 445.0 560.2 560.2 590.2 590.2
a/ Balance of payments estimated in July 2006.b/ Balance of payments estimated in April 2006.Source: Banco de la República.
Table 5
Total Commodity Price Index,without Oil (WCF)
Source: The Economist Intelligence Unit.
Graph 30
(Percentage)
0.0
20.0
40.0
60.0
80.0
100.0
120.0
140.0
160.0
Sep-96 Sep-98 Sep-00 Sep-02 Sep-04 Sep-06 Sep-08
WCF April 2006 Forecast July 2006 Forecast

41
Therefore, even with the persistence of high volatility on financial markets, theexchange rate is not expected to remain at the levels observed in May andJune. The adjustment since July verifies this tendency. On the other hand, italso is unlikely the exchange rate will return to the levels witnessed at thebeginning of the year. In all, it is important to emphasize that any exchange-rate forecast is surrounded by a great deal of uncertainty, even the short-termforecasts.
2. Balance of Payments Prospects for 2006 and the Medium Term
The current account deficit estimated for 2006 is US$1,589 million (1.2% ofGDP as opposed to 1.6% in 2005), basically due to less of a deficit in factorincome (down from 4.5% to 4.% of GDP) and in non-factor services (from1.7% to 1.4%). This would more than compensate for a smaller merchandisetrade surplus, which is expected to drop from US$1,595 m in 2005 (1.3% ofGDP) to US$1,050 m (0.8% of GDP) (Table 6). The improvement in factorincome is due to less interest paid by the government, because of the way ithas managed its liabilities.
The deficit in the current account is expected to be financed with resourcesfrom net foreign direct investment10, which should remain dynamic in the oil,
Balance of Payments Forecast for Colombia
(proj) Projected.(pr) Preliminary.a/ Includes operations in the public and private sectors, errors and omissions, plus the variation in gross international reserves.
Millions of Dollars Percentage of GDP
2004 2005 (pr) 2006 (proj) 2004 2005 (pr) 2006 (proj)
I . Current Account (938) (1,978) (1,589) (1.0) (1.6) (1.2)A. Goods and non-factor services (333) (505) (768) (0.3) (0.4) (0.6)
1. Goods 1,346 1,595 1,050 1.4 1.3 0.82. Non-factor services (1,679) (2,100) (1,818) (1.7) (1.7) (1.4)
B. Factor income (4,332) (5,562) (5,181) (4.4) (4.5) (4.0)C. Transfers 3,727 4,089 4,360 3.8 3.3 3.4
II. Capital and Financial Account, and Changein Gross International Reserves 6,021 5,435 1,153 6.2 4.4 0.9A. Net direct investment 2,975 5,754 3,952 3.0 4.7 3.1B.Other capital movements a/ 3,046 (319) (2,799) 3.1 (0.3) (2.2)
Table 6
10 This takes into account US$1,162 million (m) in resources scheduled to originate with theprivatization of Telecom, ISA, Granbanco, Ecogas, Propal, and Monómeros ColomboVenezolanos, among other companies.

42
coal and manufactured goods sectors. The flow of direct foreign investmentwould partially offset outflows of private capital. The forecasts in this reportassume there will be no additional capital outflows during the second half ofthe year.
Finally, the Bank´s mid-term projections show the current account deficit inthe balance of payments will continue to average around 2.5% of GDP duringthe next five years, given the gradual reduction in terms of trade, growingworld demand (2.8% per year) and approximately 4% economic growth inColombia. This forecast also takes into account the possible change in sourcesof external financing.
In this scenario, revenue from exports of oil, its by-products and coal shouldremain relatively stable at around 4.5% and 2.2% of GDP, respectively. Thisprojection is based on no decline in crude oil production during the periodand on international prices that should remain relatively high.
B. The Domestic Context
1. The GDP Short-term Forecast
Available figures for domestic demand show the momentum in earlier quartershas continued during the year to date. In June 2006, indicators of consumerconfidence, consumption expectations and economic conditions were still onthe rise and reflected levels above those registered during the same period theyear before (Graph 31).
In addition to the confidence indicators for householdconsumption, there also are signs that privateinvestment should continue to grow at a good pace.The figures announced by DANE in May and thoseprovided in June (preliminary) by the NationalDepartment of Customs and Revenue (DIAN) showa solid situation with respect to imports, most ofwhich were comprised of intermediate and capitalgoods. Coupled with the portfolio data, investorconfidence, the continued improvement inemployment conditions and the favorable externalcontext, this suggests growth in domestic demandwill remain the driving force of GDP growth.
Despite the continuance of good domestic andexternal conditions for growth, the central scenarioin this report forecasts an increase of 3.7% in GDP
Fedesarrollo ConsumerSurvey Indexes
Source: Fedesarrollo.
Graph 31
-40.0
-30.0
-20.0
-10.0
0.0
10.0
20.0
30.0
40.0
50.0
Dec-01 Jun-02 Dec-02 Jun-03 Dec-03 Jun-04 Dec-04 Jun-05 Dec-05 Jun-06
Consumer confidence
Economic conditions
Consumption expectations

43
Real Annual GDP Growth by Sectors(Percentage)
2005 2006
I Qtr. II Qtr. a/ III Qtr. a/
Agriculture and livestock, forestry, hunting and fishing 2.9 0.8 1.2 2.5Mining and quarries 3.0 1.7 (4.6) 6.7Electricity, gas and water 3.2 3.2 1.2 3.1Industrial manufacturing 3.9 7.3 2.8 3.6Construction 11.9 5.7 11.2 3.9
Buildings 4.3 (1.1) 2.4 2.2Civil works 28.1 17.8 30.0 6.8
Commerce, repairs, restaurants and hotels 9.4 8.4 6.4 6.3Transportation, storage and communication 5.1 9.7 5.8 5.1Financial establishments, insurance companies, real estate
agencies and business services 3.5 6.5 (2.9) (0.4)Social, community and personal services 4.0 2.9 1.9 9.1
Financial brokerage measured indirectly 8.5 13.6 (17.6) (7.1)
Subtotal: aggregate value 4.6 4.8 3.1 5.0
GDP 5.2 5.2 3.7 5.2
Taxes, minus subsidies 13.3 10.3 11.6 8.3Net financial services -FBMI b/ 1.9 4.2 2.3 2.0
Tradables c/ 4.0 4.4 2.9 4.4Non-tradables 6.0 5.7 4.1 5.7
a/ Projection.b/ FBMI: financial brokerage services measured indirectly.c/ Agriculture and livestock, mining, manufacturing, air and water transport services, including those of a complementary and auxiliary nature, and certain private services for businesses are regardedas tradable sectors.
during the second quarter of 2006 due to several supply shocks (Table 7).The poor coffee harvest, in particular, is expected to have somewhat of negativeimpact on growth. The same can be said of the strike against the coal companyDrummond, the heavy rains that jeopardized harvests for some perishables,and the fewer number of working days in the second quarter of the year(three), together with the effect of the Electoral Assurances Act on somegovernment services and the possible impact of financial volatility on brokerageservices in the financial system.
The same central scenario also indicates the pace of growth will recover duringthe third quarter of 2006, with an increase of 5.2% compared to the samequarter in 2005. The prediction is that coal exports will be reinstated entirelyduring that period and there will be a moderate drop in coffee production,although output for the 2005/2006 coffee year is expected to be down bynearly 6.0%, on average.
Public spending is likely to increase sharply during the third quarter andgenerally throughout the second half of the year, the reason being that thisdemand was curbed during the first six months of the year by the Electoral
Table 7

44
Assurances Act. Consequently, the third and fourthquarters would have to witness an increase of almost10.0% in public spending to comply with the budgetfor 2006.
In view of the foregoing, the non-tradable sectorsshould expand by 4.9%, on average, between thesecond and third quarters, while growth in thetradable sectors would be only 3.7%. However,when these projections were made, there was noinformation available on industrial growth in May(12% according to the DANE monthlymanufacturing sample), which turned out to be morethan predicted. According to Banco de laRepública’s calculations, with a revision for workingdays and seasonality, growth in the tendential
component of industrial manufacturing might exceed 4.0% (Graph 32), whichwould surpass the forecasts contemplated in the central scenario of this report.
2. GDP Forecast for 2006 and 2007
The external context and the various elements in the domestic context thatsupport the short-term central forecast for GDP guarantee good growth during2006, which is already expected to be 4.8% for the year as a whole.Household consumption should climb to 5.3%, accelerating compared to 2005and making an important contribution to growth (Table 8). Total investmentwill continue to boost growth, even though the annual variations anticipatedfor the second half of 2006 are expected to be less dynamic than in the firsthalf of the year. The growth forecast for gross fixed capital formation (GFCF),without civil works, is 12.7%, according to what has been budgeted by thegovernment. This being the case, the end of the year should see a level ofinvestment near 24% of GDP, which is well above the historic average (17.4%).
In 2007, the economy is expected to continue to grow at a good pace, withno major shocks. The primary external fundamentals, particularly high termsof trade and solid external demand, should allow for 4.3% to 5.2% GDPgrowth.
C. Inflation Forecasts
1. Forecasts
The inflation forecasts based on the Bank’s central model (TMM) are shownin Table 9. They were developed according to the assumptions outlined in the
Annual Growth in the Industrial ProductionIndex (IPI) of the DANE Monthly ManufacturingSample
Source: DANE-MMM. Calculations by Banco de la República.
Graph 32
12.03
-4
-2
0
2
4
6
8
10
12
14
16
May-03 Nov-03 May-04 Nov-04 May-05 Nov-05 May-06
IPI 12 month IPI average

45
Real Annual GDP Growth by Type of Expenditure(Percentage)
a/ Projection by Banco de la República.Source: DANE. Calculations by Banco de la República.
2004 2005 2006 a/
End Consumption 3.8 4.7 5.5Households 4.0 4.7 5.3Government 3.3 4.8 6.2
Gross Capital Formation 14.5 25.2 15.2Gross Fixed Capital Formation (GFCF) 13.6 19.4 11.5
GFCF without Civil Works 23.4 17.7 11.2Civil Works (18.8) 28.1 12.7
Domestic Demand 5.6 8.4 7.5
Total Exports 11.3 6.3 4.8Total Imports 15.8 22.6 17.2
GDP 4.8 5.2 4.8
Table 8
Table 9
Central Model Forecasts
Total Food Non-food inflation Outputinflation inflation Gap
Total Non-tradables Tradables Regulated
Jun-06 3.9 4.7 3.6 4.6 2.2 3.8 0.3Sep-06 3.9 4.2 3.8 4.6 2.5 4.2 0.6Dec-06 3.9 3.9 4.0 4.7 2.6 5.1 0.9
Mar-07 4.6 4.3 4.7 4.8 3.5 6.0 1.0Jun-07 4.5 4.0 4.7 4.9 3.3 6.2 0.8Sep-07 4.1 3.7 4.3 4.8 2.9 5.8 0.6Dec-07 4.0 4.0 4.0 4.7 2.5 5.6 0.4
Mar-08 4.1 4.1 4.1 4.7 2.3 6.4 0.1Jun-08 4.1 4.1 4.1 4.6 2.6 6.3 (0.1)
Source: Banco de la República.
two preceding sections. As usual, the results of the model contemplate aninterest rate that adjusts itself endogenously to ensure the long-term inflationtargets are met. Therefore, when interpreting a rate of this type, it is importantto bear in mind that changes in the stance of monetary policy have a significantimpact on inflation only after a time horizon of more than three quarters.
According to the TMM central path, no major changes in inflation are expectedduring the second half of 2006, with respect to the levels registered at June.

46
Total inflation should stay near the bottom of the target range as a result of adecline in food inflation, which would offset a slight rise in non-food inflation.Thus, these forecasts rule out major reductions in inflation during the secondhalf of the year, contrary to what occurred during the first six months. Theyalso signal a break in the downward trend in non-food inflation, which wouldhave hit bottom at mid-year.
For a longer time horizon, the model again envisages an upward tendencyfor total and non-food inflation, at least while the changes in monetarypolicy endogenous to the forecast begin to take effect. Even whencompared to the results published for the March report, the new fore-casts suggest slightly higher inflationary pressures within a mid-term horizon(from three to six quarters). One example would be the rise in the non-food inflation forecast at March 2007, which is up from 4.3% in the lastreport to 4.7% herein.
The increase in mid-term forecasts is explaines by the exchange-ratedepreciation during the second quarter, which was underestimated in theMarch report. When included in the model, that episode added nearly100 bp to the annual rate of tradable inflation anticipated for the first halfof 2007 (excluding non-regulated foods). As usual, this outcome obeysto the direct impact of the increase in the exchange rate and its indirecteffect through the impact on inflationary expectations and inertia.
However, the anticipated increase in inflation is moderate compared tothe situation during other episodes of depreciation: no more than 40 bpon non-food inflation and even less on total inflation, even after consideringthe likely increases in prices for imported foods. This is possible becausethe recent weakening in the peso would be largely temporary. Hence,pressure towards depreciation would be much less in the second half ofthis year and in 2007, as was explained earlier in this chapter.
Nevertheless, with the model, tradable inflation is determined not only bythe exchange rate, but also by the course of expectations, by past infla-tion and by growth in demand with respect to available productive capacity.In the long run, these factors cause it to converge towards the targets,even if the exchange rate remains stable. In view of this fact, the currentforecasts also reflect an underlying upward trend for tradable inflationassociated with its currently low level compared to the Bank’s long-termtargets and with the continued force of domestic demand anticipated forthe coming quarters.
Together with the revised forecasts for tradable inflation, this report alsoenvisions a slight increase for inflation in regulated goods/utilities during2007. The TMM still expects an upward tendency in this indicator duringthe next four quarters, for several reasons. The most important one concernshigh fuel prices on today’s world market and the extreme likelihood that
Major reductions ininflation during the
second half of the yearare ruled out.
The new forecastssuggest slightly more
inflationary pressure atmid-term.

47
they will remain at the current levels for quite some time. This wouldnecessitate an increase in domestic prices during the remainder of 2006and in 2007, above and beyond the inflation targets, to close the gap thatnow exists with respect to international prices. The recent increases inexternal prices and depreciation during the second quarter make thisscenario even more feasible.
By the same token, fuel-price hikes that exceed the targets are likely tohave an effect on the price of public transportation in Colombia, particu-larly because transportation rates do not seem to reflect the major increasesaccumulated in recent years. Within the sub-basket of regulated goods/utilities, fuel and public transportation account respectively for 11% and50% of the total CPI, which means their tendency largely determines thebehavior of prices in this group.
Another reason to expect more of an increase in prices for regulated goods/utilities is the currently low annual rate of inflation for this sub-basket. Sofar this year, there has been very little change in public utility rates (theannual increase at June was 2.9%). These minimal adjustments werepossible thanks to special circumstances, such as abundant rainfall, whichlowered the prices of energy on the exchange. This situation is not likelyto repeat itself in 2007. Consequently, for the next 18 months, it is prudentto anticipate increases that are closer to the goals than is now the case.
As to the three components of the non-food CPI, only non-tradables –with the closest link to demand– have a slightly lower forecast in thisreport, compared to the forecast in March. This is because the results inthe first half of the year tended to be less than anticipated. Even so, withthe assumptions for growth (4.8% in 2006 and around 4.7% in 2007)and the actual size of the gap (0.5% on average for 2006) non-tradableinflation is expected to increase during 2007, as indicated in earlier reports.Convergence towards the long-term targets for inflation would begin onlyas of the third quarter in 2007, once the changes in monetary policy beginto have an impact.
Although the change in non-tradable inflation depends primarily on theanticipated growth in demand compared to the increase in potential ornon-inflationary output, there are other factors that affect these forecasts.The course of expectations and past inflation are the most important ones,considering the inertia still shown by inflation in Colombia. Thus, temporaryprice hikes due to supply shocks (in foods or in regulated goods/utilities),or to short increases in the exchange rate have a permanent effect oninflation through these channels. In the current situation, this implies thatactual depreciation during the second quarter, plus actual and anticipatedincreases in fuel and transportation prices, also affect the upward tendencyin the forecast for non-tradables. The exchange rate can have a direct
Inflation in regulatedgoods/utilities isexpected to increase…
… tradable inflation isexpected to move higherin 2007.

48
influence on non-tradables as well (via costs or prices of tradablesubstitutes).
The food CPI forecasts show less inflation during the second half of 2006.This tendency takes into account two factors that exert upward pressureon food prices; namely, depreciation in the exchange rate and higher in-ternational prices (for sugar, cereals and edible oils) during the year todate and those anticipated for the next two quarters. Although it is difficultto determine the individual importance of these two factors, the assumptionin this report is that more lasting pressure would originate with high externalprices and the possibility of new increases, as explained at the beginningof this chapter. Depreciation during the second quarter also would exertan upward effect during the second half of the year; however, it would bemoderate if the peso again recovers part of its value, as is expected.
The reduction in food inflation during the second half of 2006 wouldoriginate primarily with prices for unprocessed or staple foods. Althoughthis tendency is contradictory, given the pressures mentioned earlier, itsexplanation lies with the currently high relative prices for staple foods,due to the constant increases observed since early 2004. In the past, aquick drop in food prices has been preceded by periods when priceswere relatively high and provided a strong incentive to supply. This is thesequence of events being detected by the models, with the added ingredientthat ample rainfall during the second quarter would further increase theproductivity of crops and, hence, the supply in the coming months.
In summary, the forecasts in this report indicate the possibility of someinflationary pressure at mid-term, if domestic credit and demand continueto grow as expected, and particularly if the increase begins to exceedgrowth in the economy’s productive capacity and in productivity. Accordingto the model, this situation would begin to be evident at some point betweenthe remainder of 2006 and the start of 2007. Although actual depreciationof the exchange rate would have a certain upward impact on prices, itwould be limited, since the remainder of this year and 2007 are expectedto see a return to stability in the exchange rate, with less of a tendencytowards depreciation compared to the situation in May and June. Thehigh forecast for external prices would have a more permanent effect onfuture inflation. This is particularly true of fuel prices, given their effect ontransportation and the impact they can have on expectations and wagebargaining. Finally, staple food prices are expected to be influenced byshort-term downward pressure attributed to reasons associated with theirproduction cycle.
The forecasts point toless food inflation
during the second halfof this year.
The impact of recentdepreciation on
inflation would belimited.
The increases in fueland transportation ratescould have a permanentimpact via expectations
and wages.

49
2. Risks
The fan chart (Graph 33) shows the central path of the total inflation forecastand the probability of its distribution, which illustrates the uncertaintysurrounding this projection. The primary risk factors that can steer inflationaway from its central or most probable forecast are considered whencalculating this distribution.
The following are the main factors that could result in an inflation forecastsuperior to the central scenario.
• More growth during the second quarter than contemplated in the basescenario11: this risk is supported by the positive trend in industrialproduction for May, which was not fully included in the forecasts. Also,the effect of the supply shocks anticipated during the second quartermight be less than envisioned in the base scenario, given the latestindicators for several sectors. On the demand side, consumer confi-dence at June remained on the rise and, by May, imports of capitalgoods had climbed more than expected. Finally, the anecdotal evidencecollected at the consultative committee meetings held by the Board ofDirectors with members of the business community indicates theirperception of current economic conditions is more favorable than itwas last year.
• More depreciation transmitted to consumer inflation than contemplatedin the forecast, inasmuch as the economy is in a growth stage. The
11 In addition, the possibility of an upward revision of first-quarter growth figures by DANE is notruled out.
Source: Calculations by Banco de la República.
Probability Distribution of the InflationForecast (Fan Chart)
Inflation Probability (%)ranges
2006 2007 2008(%)
Sep. Dec. Mar. Jun. Sep. Dec. Mar. Jun.
Above 5.5 0.0 0.0 0.2 0.8 0.5 0.5 0.8 1.2Below 5.5 100.0 100.0 99.8 99.2 99.5 99.5 99.2 98.8Below 5.0 100.0 100.0 91.5 88.6 94.9 95.6 94.2 93.2Below 4.5 100.0 99.5 40.2 49.9 75.4 79.2 76.9 76.3Below 4.0 77.7 57.6 2.4 10.0 38.4 46.7 46.5 48.2Below 3.5 0.0 0.9 0.0 0.5 9.2 16.1 18.4 21.8Below 3.0 0.0 0.0 0.0 0.0 0.9 2.8 4.4 6.6
Accumulated Probability of ActualConsumer Inflation withinthe Indicated Range
Graph 33
(Percentage)
2.5
3.0
3.5
4.0
4.5
5.0
5.5
6.0
II Qtr. 04 II Qtr. 05 II Qtr. 06 II Qtr. 07 II Qtr. 08
2.0
2.5
3.0
3.5
4.0
4.5
5.0
5.5
6.0
(Percentage)
2.0

50
extent of this transmission can vary with the economic cycle, which isnot detected by the central model.
• Higher oil prices in the future, given the geopolitical risks weighingon this market. The result would be increased pressure ondomestic fuel costs, on transportation fares and on inflation ingeneral.
• Higher frequency of wage hikes that exceed the targets for infla-tion due to a tighter labor market. The recent, more-than-expectedrise in employment, the increased rate of work factor utilization,and good prospects for growth would raise the demand for laborfaster than in past years. In contrast to this risk, the labor supplymight not expand as quickly in the mid-term, especially amongworkers who are not household heads. This would be the resultof more family income and job stability.
• Higher prices for processed and staple foods, due to pressurefrom costs that were not fully contemplated in the base scenario.These increases would be the result of higher prices for importedraw materials or tradables (cereals, edible oils, sugar, and fertilizers)associated with higher fuel prices and with a higher exchange rage.
• The possible first and second round effects of an extension in thevalue-added tax (VAT) to include a number of family market-bas-ket items that have been exempt up to now, plus the impact of anincrease in existing rates. None of these events have been includedin the central path of the forecast. Moreover, experience showsthat changes in VAT are quick to affect the CPI and considerablyso, and can influence the creation of expectations, thereby havinga more lasting impact on inflation.
• The last factor underscores a risk common to a number of transitorysupply shocks (such as increases in the price of staple foods andregulated goods/utilities). It is the possibility of transmission toinflation through an increase in inflationary expectations. In thiscase, its transitional nature becomes less important in terms ofinflationary processes and monetary-policy implications.
The following are the more important factors that would explain lessinflation than in the base scenario.
• The beneficial impact compliance with the inflation target has onexpectations and on the price-formation process for 2007.
Certain risks toinflation originate with
higher costs,particularly because of
their impact on foodprices
The effects of a possibleextension in VAT also
pose risks.

51
• More gains in productivity than contemplated in the calculationfor potential GDP and the gap: the growth in investment and thesharp rise in imports of capital goods can encourage technicalchange and favor growth in productivity. By the same token,increased competition from imports of consumer goods can sparkgains in productivity by acting as a “disciplinary mechanism” forthe market.
• The negative impact on exports and growth that would resultfrom failure to extend the tariff advantages provided under theAndean Trade Promotion and Drug Eradication Act (ATPDEA)and Venezuela’s departure from the Andean Community ofNations (CAN). Although these events could also speed thepace of depreciation, with an upward impact on prices, thedownward effects due to less demand should prevail.
• The effect recent financial volatility could have on real activity,and specifically on domestic demand. The drop in stock andTES prices could lower the collateral value (wealth) householdsand businesses use to leverage loans for spending12. As tocompanies, the financial volatility also could imply fewerfinancing and investment possibilities, by discouraging stockand bond issues.
Finally, developments in the external context and especially the situationin the United States pose a major risk with an uncertain effect on inflation,because of their various implications. Controlling inflation in the UnitedStates might require more changes in interest rates than those anticipatedin this report and/or a more abrupt landing for that economy. If so, worlddemand could be hurt if other major economies fail to offset the slowdown.Our terms of trade would be affected, as would the economic growth ofvarious trading partners.
In view of the foregoing, the risk analysis indicates that, with an activemonetary policy, inflation is likely to end the current year below the ceilingof the target range announced by the BDBR. The fan chart shows 42.4%probability that inflation will be between 4.0% and 5.0% at the end of2006. There is even a high probability (57.6%) that it will be less than4%.
12 If this is to be important, the assets in question must account for a relevant share of wealth,which does not appear to be the case with Colombian households. According to several estimatesdeveloped by Banco de la República, stocks account for only 1% of household assets. Theamount of TES (including pension and severance funds) in the hands of private individuals is low(no more than 17%). These estimates show the bulk of the wealth would be in housing
The gains inproductivity could begreater than thoseenvisioned in thisreport.
It is highly probablethat inflation will end2006 below the ceilingof the target range.

52
Much of the distribution in 2007 will be concentrated in the 4.0%-to-5.0%range (48.9%). Also, the likelihood that inflation will be within the announcedrange (3% to 4.5%) is high (76.4%) and is more than it was three months ago(62.4%). These results assume an active monetary policy that tends to be lessaccommodating than the current one.

53
Inflation and Buying Power Amongthe Low-Income Population in Colombia
Alejandro Reyes,
Consumer inflation was 3.9% at June. However, this rate differs according to theincome bracket of the population. At June, inflation in the low-income bracketwas 3.3%, as opposed to 4.5% in the middle-income bracket and 4.3% in theupper income bracket (Graph B2.1).
What explains these differences and how have they changed?
The differences are due to the fact that the items in the basket are of differentimportance to each income group. For example, food represents 41% for thosein the low-income bracket, as opposed to 15% for the high-income bracket (TableB2.1). This makes changes in the price index for the entire basket different foreach group. If food inflation accelerates, that increase will be reflected more ininflation for the low-income brackets than in inflation for the high-income brackets.
These differences are not always the same. Sometimes one bracket experienceshigher inflation than another, and vice versa. During the year to date, inflation forthe middle-income bracket has been higher than the rest, because this group hasbeen affected the most by rising fuel prices and because inflation in rentals has been
Graph B2.1Consumer Inflation by Income Bracket
(Annual variation)
Source: DANE. Calculations by Banco de la República.
(Percentage)
3.0
4.0
5.0
6.0
7.0
8.0
9.0
10.0
11.0
Jun-00 Jun-01 Jun-02 Jun-03 Jun-04 Jun-05 Jun-06
Nationwide Low Income Middle Income Upper Income
Box 2
4 An expert with the Inflation Section of the Programming and Inflation Department in the Economic Studies Unit. The opinionsexpressed in this article are solely the responsibility of the author and do not necessarily reflect those of Banco de laRepública or its Board of Directors.

54
Table B2.1Consumer Spending Basket a/
Income
Low Medium High
Food 41.42 30.18 14.70Housing 28.31 29.12 31.37Clothing 7.29 7.92 5.78Health 4.26 4.06 3.39Education 3.57 5.30 4.95Entertainment, culture and recreation 2.25 3.77 4.69Transport and telecommunications 7.29 12.17 23.67Other expenses 5.60 7.48 11.46
a/ Percentage of spending with respect to total expenditure.Source: DANE. Calculations by Banco de la República.
higher than in the upper and lower brackets. On the other hand, inflation for the low-income bracket has declined during 2006, thanks to the drop in food inflation andthe slight increases in public transportation fares, which are more important to consumersin this group than to those in the middle and upper income brackets.
Past years have seen more of an increase in inflation in the low-income brackets.This is mainly because of the tendency in prices for regulated goods/utilities andparticularly the elimination of subsidies that were more important to the spendingbasket for this group. However, although inflation in regulated goods/utilities mighthave increased, this segment of the population has benefited considerably fromthe decline in total inflation. As illustrated in Graph B2.2, the real minimum wageprovided for by law in the nineties – deflated with the consumer price index atthe low-income level – lost buying power. However, since the year 2000, it hasrecovered considerably as a result of major hikes in the nominal minimum wage,accompanied by declining inflation rates.
Graph B2.2Real Minimum Wage a/
a/ The wage was deflated by the average annual CPI for the low-income bracket.Source: DANE and Banco de la República. Calculations by Banco de la República.
(1990 = 100)
88
92
96
100
104
108
112
19941990 1992 1996 1998 2000 2002 2004 2006

55
Macroeconomic Projectionsby Domestic and Foreign Analysts
The following are the latest projections by domestic and foreign analysts concerningthe main variables of the Colombian economy in 2006 and 2007. They weredeveloped with information available at June 2006.
I. Projections for 2006
Table A1 shows the predictions for 2006. On average, the domestic analystsexpect 4.8% economic growth, which is 34 bp more than the forecast during theprevious quarter. The foreign analysts anticipate 4.7% (4 bp more). Apparently,expectations continue to improve. This would be consistent with the goodperformance displayed by industry, the acceleration in credit and the fact thatFedesarrollo’s consumer confidence index in June reached a new historic high.This indicates growth could continue at a good pace, backed by privateconsumption.
Attachment
Table A1Projections for 2006
n.a. Not available.Source: Dinero.
Real GDP CPI Nominal Nominal Fiscal UnemploymentGrowth inflation exchange TDR deficit rate
(Percentage) (Percentage) rate (Percentage) (GDP (13 cities)(end of) percentage) (Percentage)
Domestic AnalystsRevista Dinero 4.5 4.4 2,600 6.8 1.3 11.5Corredores Asociados 4.8 4.2 2,450 6.5 1.6 9.5BBVA Ganadero 4.8 4.2 2,400 6.8 1.5 n.a.Bancolombia and Suvalor 4.8 4.2 2,660 6.8 1.0 11.5Corficolombiana-Corfivalle 5.0 4.5 2,647 7.4 1.2 12.0Fedesarrollo 4.7 4.5 2,450 7.0 1.8 10.7
Average 4.8 4.3 2,535 6.9 1.4 11.0
Foreign AnalystsC. S. First Boston 5.3 4.5 2,550 6.7 1.0 11.4Bear Stearns 5.2 4.2 2,250 6.8 (0.1) 10.0Merrill Lynch 4.2 4.6 2,350 7.7 1.5 n.a.JP Morgan Chase 4.5 4.3 2,400 6.8 1.0 n.a.Economist Intelligence Unit 4.8 4.2 2,551 6.5 1.3 11.1Deutsche Bank 4.2 4.1 2,440 7.3 1.0 11.6
Average 4.7 4.3 2,424 7.0 1.0 11.0
56
The domestic analysts reduced their 2006 inflation forecast by 2 bp; the foreignanalysts lowered theirs by 4 bp. Both placed inflation at 4.3%. As has been thecase for the past seven quarters, all the analysts are confident the inflation targetwill be met (between 4% and 5% for 2006), and eleven of the twelve predict itwill be slightly below the middle of the range.
With respect to the exchange rate, the domestic analysts raised their forecasts byCol$200 (to Col$2,535); the foreign analysis increased theirs by Col$91 (toCol$2,424). . In other words, the former expect 10% appreciation in foreignexchange and the latter, 6%, on average, compared to the price at the end of2005. Therefore, the maximum appreciation anticipated by these analysts is 14%and the minimum, -1.5%. This is the first time in 18 months the forecasts havebeen revised upward, probably influenced by the volatility of the markets in thesecond quarter. In contrast, downward revisions can be expected hereinafter,following the sizeable reduction in aversion to risk on international markets, asmirrored by a build-up in the Latin American currencies
The analysts expect interest on term deposits (DTF in Spanish) to be 7% by theend of 2006. This might denote expectations of additional rate hikes by theBDBR during the remainder of the year. Also, the consolidated deficit is expectedto be around 1.2%, which is 20 bp below what it was last quarter (70 bp less thantwo quarters ago) and slightly less than the CONFIS projection (2% for theconsolidated public sector). Finally, the forecast for unemployment in 13 citieswas adjusted downward to 11%. This amounts to an average reduction of 20 bp.
II. Projections for 2007
The domestic analysts expect 4.4% growth in 2007; the foreign analysts anticipate4.3% (Table A2). The domestic analysts predict inflation will be 4.1% and theforeign analysts, 4.3%, which is near the ceiling of the target range set by theBoard of Directors for that year (3% to 4.5%). As to the exchange rate, 2.3%average annual devaluation is anticipated; this is compared to the forecasts forthe end of 2006. Therefore, by the end of 2007, the representative market rate(TRM in Spanish) would be Col$2,535, which is similar to what it was in July2002.
When compared to the end of 2005, these forecasts imply 11% accrued nominalpeso devaluation between 2006 and 2007. On average, 76% of this devaluationis expected to occur in 2006 and the other 24% in 2007 (although two analystsexpect the exchange rate to appreciate next year, while another anticipates someappreciation in 2006).

57
Table A2Projections for 2007
Real GDP CPI NominalGrowth Inflation Exchange Rate
(Percentage) (Percentage) (end of)
Domestic AnalystsRevista Dinero 4.1 4.3 2,782Corredores Asociados 4.5 4.0 2,400BBVA Ganadero 4.6 3.9 2,472Bancolombia and Suvalor 4.4 4.0 2,424Corficolombiana-Corfivalle 4.4 4.5 2,820Fedesarrollo 4.5 4.0 2,500
Average 4.4 4.1 2,566
Foreign AnalystsC. S. First Boston 4.8 4.5 2,570Bear Stearns 5.0 4.0 2,332Merrill Lynch 3.6 5.0 2,475JP Morgan Chase 4.0 4.5 2,450Economist Intelligence Unit 4.4 3.9 2,655Deutsche Bank 4.2 4.0 2,536
Average 4.3 4.3 2,503
Source: Dinero.

58
Monetary PolicyDecisions in theLast ThreeMonths

59
Background Information: The March 2006 Inflation Report
Economic growth remained good during the first quarter of 2006, propelledlargely by domestic demand. Expectations of consumer spending continued torise at a fast pace and consumer credit was dynamic. The same can be said ofprivate investment; for the most part, its growth was reflected in imports ofcapital goods and in industrial production of machinery and equipment. Goodprices for several major export products have allowed for more accelerated growthin national income than in production. Besides the rise in domestic demand, adynamic world economy in the first quarter increased beyond expectations.
The exchange rate and TES interest rates have been climbing since early March,due to higher interest rates expected in the United States and in other developedcountries. Nevertheless, the central scenario in the March edition of the InflationReport assumed that part of this tendency towards peso depreciation wastemporary. This was because of high prices for exported raw material, the strongincrease in demand worldwide, and the stability of FDI flows would have helpedthe Colombian economy, and other emerging economies, to adjust more easily toa situation with less international liquidity. However, it was acknowledged thatchanges in the exchange rate were subject to a great deal of uncertainty. Dependingon their magnitude and duration, the short- and mid-term inflation forecastsmight have to be revised upward
With a currently dynamic world economy and a favorable external context, theBDBR decided the Colombian economy did not require the same monetaryincentive to maintain its growth, which rests on a solid foundation explained bydomestic and external elements that should remain in play during the comingquarters. This fact, coupled with the changes in interest rates on domestic andinternational financial markets, necessitates a change in the country’s monetarypolicy to help maintain the force of output and employment in the future, in anatmosphere of low and stable inflation.
Based on these considerations, the Board of Directors decided at a meeting onApril 28, 2006 to raise its money market intervention rates by 25 bp. This increasedthe base expansion-auction rate from 6% to 6.25%.
Monetary Policy Decisionsin the Last Three Months

60
Monetary Policy Decisions in the Second Quarter of 2006
The most important development in the external context during the second quarterwas the growing expectation of further interest rate hikes by the Fed and byother developed economies. The result was a shift in portfolios towards investmentsin foreign currency and implied considerable exchange-rate movement in theregional economies. These factors also raised interest rates on government bondsand the country-risk premium on the sovereign debt. These variations wereparticularly important in Colombia. Between March and June, the interest rateson short-term TES (maturing in March 2007 and April 2008) registered approximateincreases of 200 bp to 250 bp, while the long-term rate was up by 300 bp. At thesame time, the exchange rate was Col$2,633 at the end of June. This is equivalentto 15.4% depreciation during the year to date and an increase of Col$388 pesoscompared to the lowest price, which was registered at the beginning of March.
In this context of high volatility, the BDBR decided not to change its monetarystance and to wait for new information that might suggest how the financialmarkets, the exchange rate and prices on domestic assets would behave. Thisdecision was reached at the Board’s meeting on May 20. On six occasionsduring the second quarter, increases in the exchange rate during short periodsactivated the automatic auction of call options to control volatility. Accordingly,Banco de la República’s intervention in the exchange market during this periodimplied the sale of US$944.3 m in foreign currency (Table A).
Although, given the reduction in international liquidity, peso depreciation cameas no surprise, particularly compared to the levels during the first quarter, anassessment of the external context showed no deterioration in the fundamental
Table AForeign Exchange Purchase-Sale Options, Banco de la República
(Millions of dollars)
2005 2006
January February March April May June July AccumulatedJan-jul
Purchases 4,658.4 454.7 655.9 86.1 0.0 0.0 0.0 180.0 1,376.7Put Options 0.0 0.0 0.0 0.0 0.0 0.0 0.0 180.0 180.0
To accumulate international reserves 0.0 0.0 0.0 0.0 0.0 0.0 0.0 0.0 0.0To control volatility 0.0 0.0 0.0 0.0 0.0 0.0 0.0 180.0 180.0
Discretionary Intervention 4,658.4 454.7 655.9 86.1 0.0 0.0 0.0 0.0 1,196.7
Sales 3,250.0 600.0 400.0 0.0 168.5 608.0 167.8 0.0 1,944.3Call Options 0.0 0.0 0.0 0.0 168.5 608.0 167.8 0.0 944.3
To control volatility 0.0 0.0 0.0 0.0 168.5 608.0 167.8 0.0 944.3National Government 3,250.0 600.0 400.0 0.0 0.0 0.0 0.0 0.0 1,000.0
Net Purchases 1,408.4 (145.3) 255.9 86.1 (168.5) (608.0) (167.8) 180.0 (567.6)
Source: Banco de la República.

61
factors of the Colombian economy that would explain a larger adjustment thanthe one observed in other economies of the region at that point in time. For thisreason and based on projections for the balance of payments, the centralmacroeconomic forecasts developed by the technical team for May and Juneassume a partial reversal of the exchange rate with respect to the actual levelsduring those months. However, the uncertainty surrounding future changes inthis variable and the persistence of shocks made it necessary to consider variousalternative scenarios in which the exchange rate increased more and/or remainedhigh for a longer period of time, in order to assess its implications on the requiredstance of monetary policy.
Other elements of the macroeconomic scenario were not substantially differentfrom those presented in the March edition of this report:
• The Bank’s interest rates and the deposit rates in the financial systemremained at historically low levels, in real terms.
• The use of installed capacity was at historic average levels and measurementsof the output gap remained near zero, although there was a great deal ofuncertainty surrounding this last estimate.
• Expectations of inflation in 2006 and 2007 continued to be in line with theinflation targets.
• External demand and terms of trade continued to favor export growth andan increase in national income, while household and business confidenceremained high, according to the results of the surveys. In this context theeconomy retained its momentum, with growth based largely on domesticdemand, which was up by an annual rate of more than 8%. Householdconsumption ad investments were the high points in this respect.
Consideration given to the possible negative portfolio effects associated with thedepreciation in TES and stocks did not change the growth forecast for the Colombianeconomy in 2006, at least not fundamentally. Existing indicators and the expectationsurveys indicated as much, having shown no significant negative impact on economicgrowth or agent confidence. Moreover, asset prices underwent an upward changeat the end of the quarter, following the reductions during the previous months.
Under these circumstances, the reasons given in the March report for reducingthe monetary incentive and making it compatible with long-term price stabilityare still valid.
• To the extent that real interest rates remain low and external and domesticfactors continue to favor more spending, aggregate demand could continueto grow at a rate that would make it difficult to lower inflation in non-tradable goods and services, especially if limitations in productive capacitywere to become evident. Several estimates of the output gap suggest this

62
could occur in the near future. However, as indicated earlier, these estimatesare highly uncertain.
• On the other hand, if part of the rise in external interest rates or risk premiumswere to last, some of the increase in the real exchange rate would as well,and the relative price of tradables would increase. To this extent, tradableinflation would do less to reduce inflation than during the last two years.
• Recent depreciation implied higher domestic prices (after a certain lag), throughits direct impact on tradable prices and on the growth in net exports. Thiswould be different from depreciation originating with a current account shock(e.g. terms of trade or external demand), where the shock itself would offsetthe inflationary effect of depreciation by slowing down economic activity.
• The accelerated growth in credit witnessed in recent months probablyenhanced the effect of the existing monetary incentive on aggregate demand.The increased supply of bank credit, in response to more market risk, wouldhave been a contributing factor. This hypothesis was consistent with thetrend in prices and quantities on that market, which showed declining interestrates on loans (in real and nominal terms), coupled with an increase in theloan approval and disbursement rate, especially for ordinary and consumerloans, and a recovery in mortgage loans.
Based on these considerations, the BDBR decided, at its meeting on June 20, toadd 25 bp to its intervention interest rates, for a total increase of 50 bp during theyear to date. This placed the interest rate for expansion auctions at 6.5% (TableB). These decisions take into account the relatively long lag in monetary-policytransmission. In other words, changes in the stance of monetary policy must bemade far in advance, so as not to jeopardize future inflation targets or the credibilityof the policy itself.
Finally, at its meeting on July 27, the Board of Directors agreed not to change itsinterest rates. This decision took into account that an analysis of the financialsituation and the inflation forecasts, including the partial reversal predicted forthe exchange rate, allowed for a cautious approach to lowering the monetaryincentive. In effect, given the climate of uncertainty in which monetary policyoperates, the gradual nature of these decisions makes it possible to include newinformation that helps the Board of Directors to enhance its perception of importantmacroeconomic aspects, such as changes in productivity, use of installed capacity,the extent of competition in different markets, and movement on internationalcapital markets. These elements, which are central to a macroeconomic diagnosis,are also the subject of considerable uncertainty. Gradual adjustments in monetarystance also minimize costs derived from changes in interest rates and help toavoid sharp adjustments in the future that often lead to a loss of growth in outputand employment. Finally, it is important to bear in mind that this gradual approachis possible thanks to the positive trend in inflationary expectations and the credibilityacquired by the country’s monetary policy.

63
Table BModificaciones de las tasas de intervención del Banco de la República
(Porcentaje)
Date a/ Contraction Expansion
Lombard Auction Auction Lombard
2001 17 Dec. 6.25 7.50 8.50 12.25
2002 21 Jan. 6.00 7.00 8.00 11.7518 Mar. 5.25 6.25 7.25 11.0015 Apr. 4.25 5.25 6.25 10.0020 May 3.75 4.75 5.75 9.5017 Jun. 3.25 4.25 5.25 9.00
2003 20 Jan. 4.25 5.25 6.25 10.0029 Apr. 5.25 6.25 7.25 11.0023 Feb. 5.00 6.00 7.00 10.75
2004 23 Mar. 4.75 5.75 6.75 10.5020 Dec. 4.50 5.50 6.50 10.2522 Dec. n.a. n.a. 6.50 10.25
2005 19 Sep. n.a. n.a. 6.00 9.75
2006 02 May n.a. n.a. 6.25 10.0021 Jun. n.a. n.a. 6.50 7.50
n.a. Not applicable. The Bank suspended all monetary contraction operations (auction and Lombard) as of 22 December 2004.
(*) The working day immediately after the decision by the BDBR.
Source: Banco de la República.


