25
Asian Development Outlook 2011 South-South Economic Links Joseph E. Zveglich, Jr. Assistant Chief Economist Economics and Research Department OECD Development Centre Paris 8 April 2011

8/3/2019 Inflation in SE Asia
http://slidepdf.com/reader/full/inflation-in-se-asia 1/25
Asian Development
Outlook 2011South-South Economic Links
Joseph E. Zveglich, Jr.
Assistant Chief Economist
Economics and Research Department
OECD Development Centre
Paris
8 April 2011
8/3/2019 Inflation in SE Asia
http://slidepdf.com/reader/full/inflation-in-se-asia 2/25
Outline
Economic outlook Global outlook
Developing Asia’s outlook
Key challenges Managing inflation
Finding new growth source:South-South economic links?
2

8/3/2019 Inflation in SE Asia
http://slidepdf.com/reader/full/inflation-in-se-asia 3/25
3
Key Messages
Asia’s recovery is firm, with growthnearing 8% in the next 2 years
Asia is leading the global recovery
Rising inflation is a concern
Expanding South-South links present asupplementary growth source
But structural weaknesses need to beaddressed to maximize their potential
8/3/2019 Inflation in SE Asia
http://slidepdf.com/reader/full/inflation-in-se-asia 4/25
Economic outlook
4
8/3/2019 Inflation in SE Asia
http://slidepdf.com/reader/full/inflation-in-se-asia 5/25
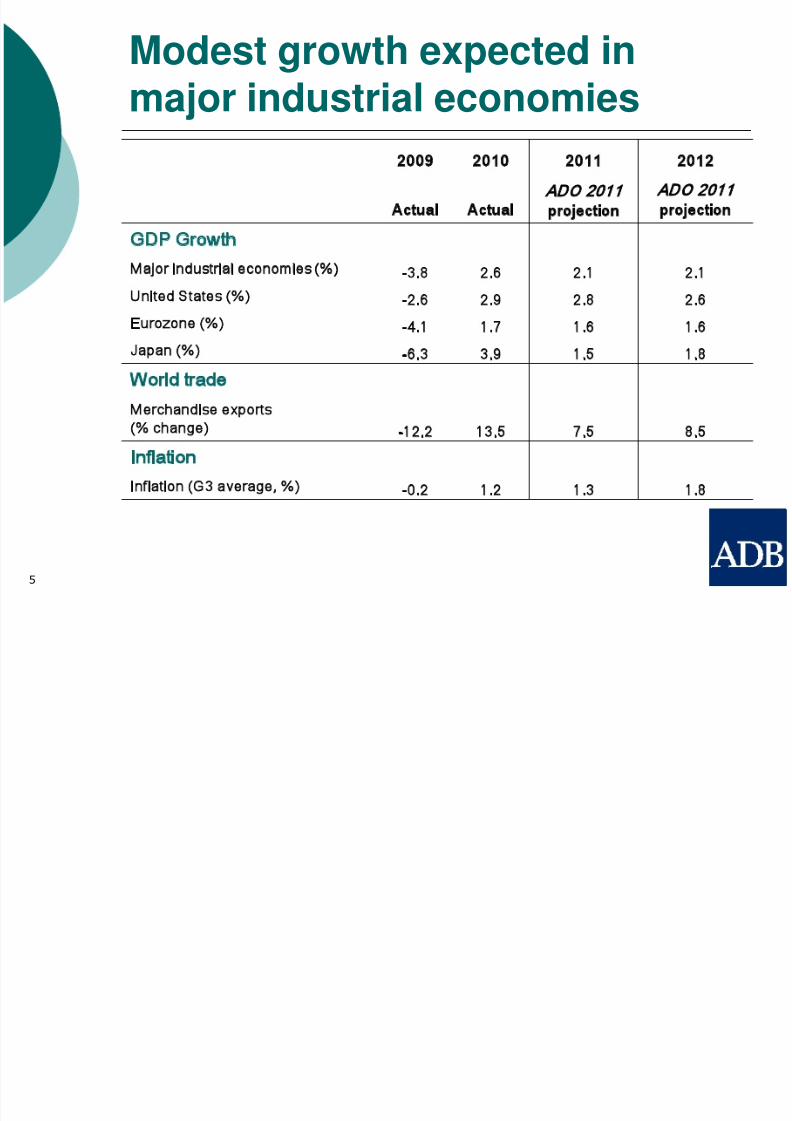
Modest growth expected inmajor industrial economies
2009 2010 2011 2012 Actual Actual ADO 2011
projection ADO 2011
projection GDP Growth
Major industrial economies
(%) -3.8 2.6 2.1 2.1United States (%) -2.6 2.9 2.8 2.6
Eurozone (%) -4.1 1.7 1.6 1.6
Japan (%) -6.3 3.9 1.5 1.8
World trade Merchandise exports(% change) -12.2 13.5 7.5 8.5
Inflation
Inflation (G3 average, %) -0.2 1.2 1.3 1.8
5

8/3/2019 Inflation in SE Asia
http://slidepdf.com/reader/full/inflation-in-se-asia 6/25
6
But risks remain
Recent surge in oil and foodprices
Sovereign debt problems in theeurozone periphery
High unemployment and weak
housing market in the US Impacts of the Japan earthquake

8/3/2019 Inflation in SE Asia
http://slidepdf.com/reader/full/inflation-in-se-asia 7/25
Developing Asia’s recovery is
firming
7
…due to robust domestic demand
9,4
10,1
6,75,9
9,07,8 7,7
0
4
8
12
2006 2007 2008 2009 2010 2011 2012
GDP growth
5-year moving average

8/3/2019 Inflation in SE Asia
http://slidepdf.com/reader/full/inflation-in-se-asia 8/258
-5
0
5
10
15
20
PRC INO KOR MAL PHI SIN THA
Percentage points
Contributions to GDP growthPrivate consumption Government consumption
Investment Net exports
Statistical discrepancy GDP growth
Propelled by robust domesticdemand
PRC=People’s Republic of China; INO=Indonesia; KOR=Republic of Korea;
MAL=Malaysia; PHI=Philippines; SIN=Singapore; THA=Thailand.

8/3/2019 Inflation in SE Asia
http://slidepdf.com/reader/full/inflation-in-se-asia 9/259
Region’s recovery is widespread
GDP growth
0
2
4
6
8
10
Central Asia
East Asia South Asia Southeast Asia
The Pacific Developing Asia
%2010 2011 2012

8/3/2019 Inflation in SE Asia
http://slidepdf.com/reader/full/inflation-in-se-asia 10/2510
Southeast Asia moderating
SEA=Southeast Asia
INO=Indonesia
SIN=Singapore
THA=Thailand
MAL=Malaysia
PHI=Philippines
VIE=Viet Nam
0
5
10
15
SEA INO MAL PHI SIN THA VIE
%GDP growth
2010 2011 2012
8/3/2019 Inflation in SE Asia
http://slidepdf.com/reader/full/inflation-in-se-asia 11/25
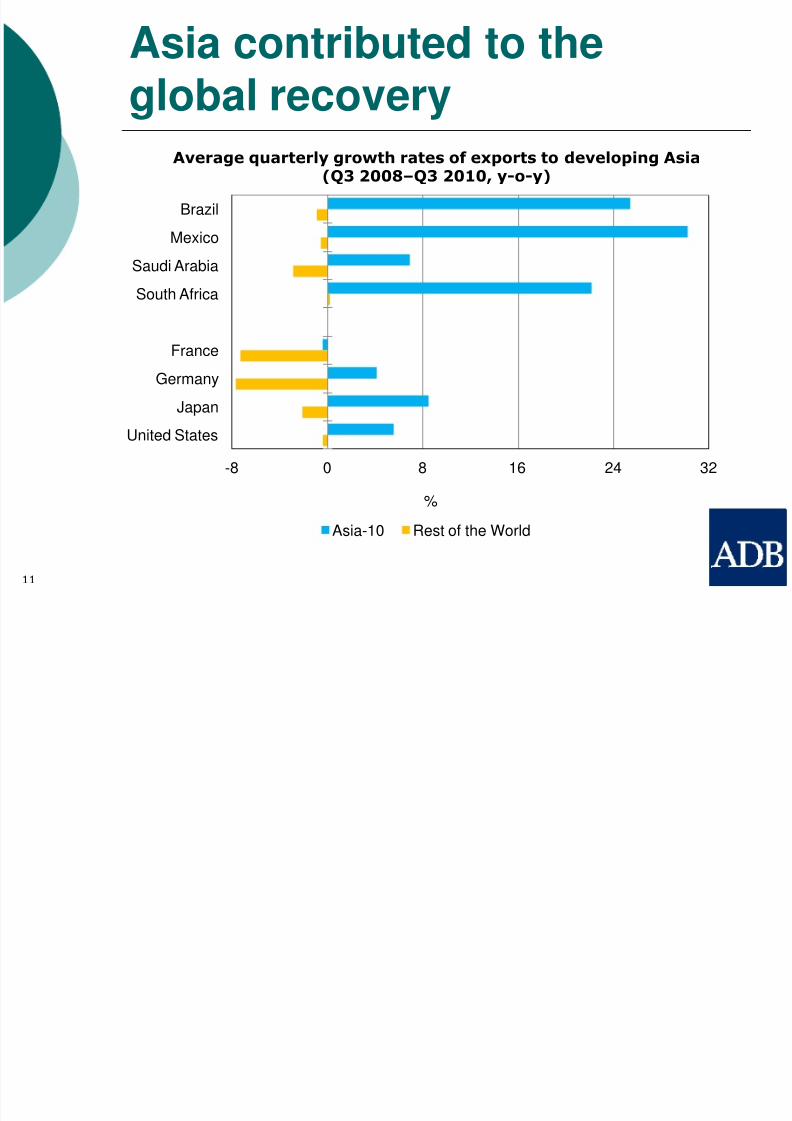
Asia contributed to theglobal recovery
11
-8 0 8 16 24 32
Brazil
Mexico
Saudi Arabia
South Africa
France
Germany
JapanUnited States
%
Asia-10 Rest of the World
Average quarterly growth rates of exports to developing Asia(Q3 2008–Q3 2010, y-o-y)
8/3/2019 Inflation in SE Asia
http://slidepdf.com/reader/full/inflation-in-se-asia 12/25
Key challenge:Managing inflation
12

8/3/2019 Inflation in SE Asia
http://slidepdf.com/reader/full/inflation-in-se-asia 13/25
Inflation pressures are building…
13
3,3
4,4
6,9
1,2
4,4
5,34,6
0
2
4
6
8
2006 2007 2008 2009 2010 2011 2012
%
Inflation
5-year moving average
8/3/2019 Inflation in SE Asia
http://slidepdf.com/reader/full/inflation-in-se-asia 14/25
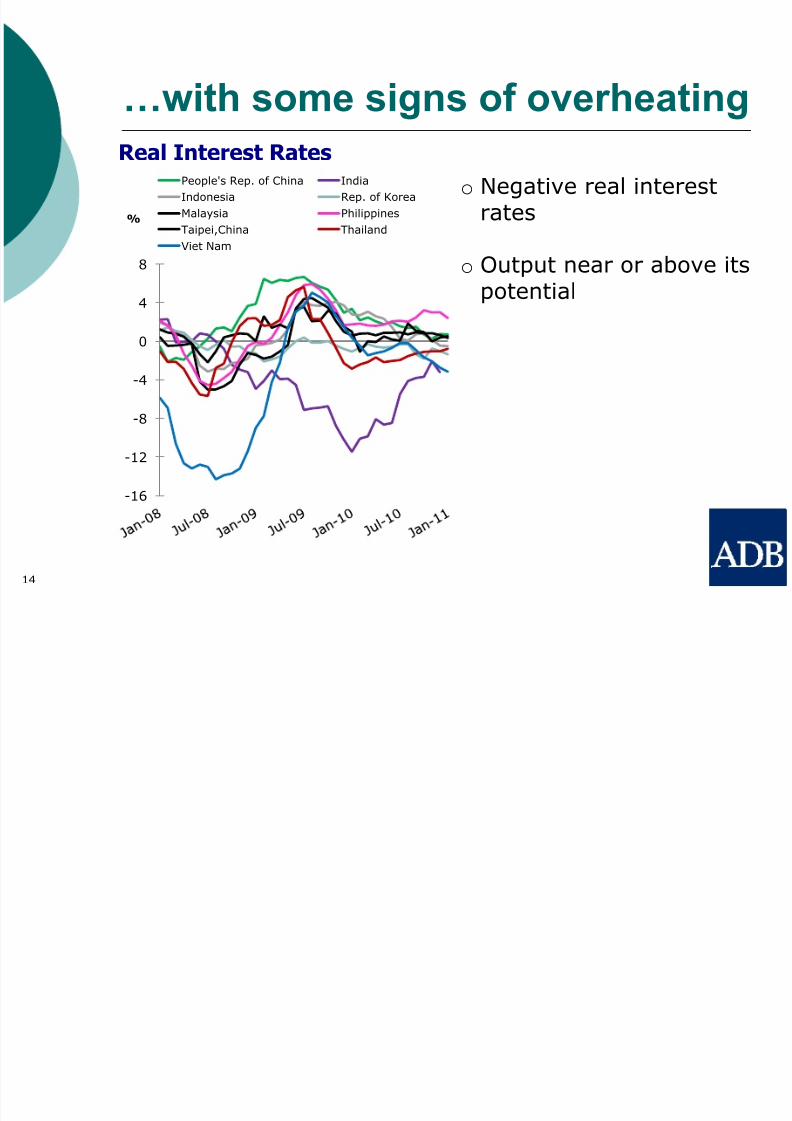
…with some signs of overheating
14
-16
-12
-8
-4
0
4
8
%
Real Interest RatesPeople's Rep. of China India
Indonesia Rep. of Korea
Malaysia Philippines
Taipei,China Thailand
Viet Nam
o Negative real interestrates
o Output near or above itspotential

8/3/2019 Inflation in SE Asia
http://slidepdf.com/reader/full/inflation-in-se-asia 15/25
Inflation matters more for Asia
Bangladesh 58.8
Philippines 46.6
India 46.2
Sri Lanka 45.5Cambodia 44.9
Pakistan 40.3
Viet Nam 39.9
Indonesia 36.2Thailand 33.0
Malaysia 31.4
PRC 30.2
United States 14.8
Eurozone 14.0
Japan 25.9
15
Food share in CPI (%)
o The poor are especiallyvulnerable
o Rising in part to Asia’sfaster recovery
o Inflation expectationscan fuel wage-pricespiral
8/3/2019 Inflation in SE Asia
http://slidepdf.com/reader/full/inflation-in-se-asia 16/25
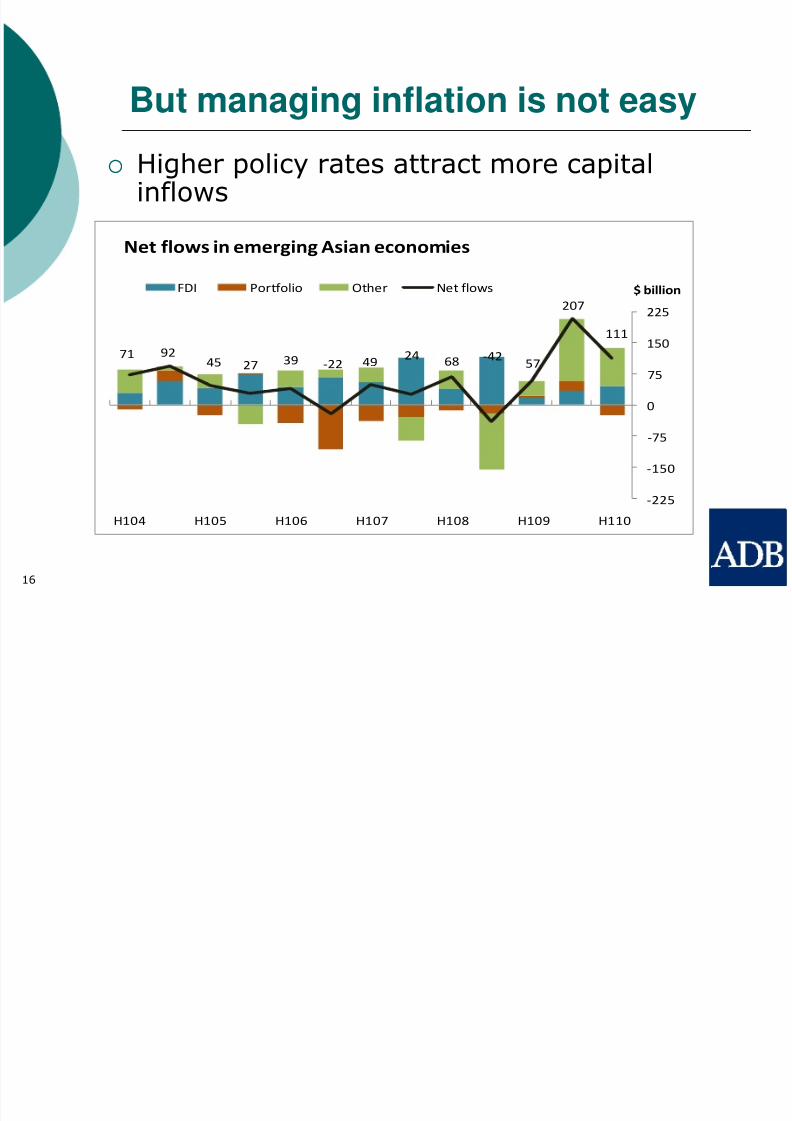
But managing inflation is not easy
Higher policy rates attract more capitalinflows
16
71 9245 27
39 -22 4924
68-42
57
207
111
-225
-150
-75
0
75
150
225
H104 H105 H106 H107 H108 H109 H110
$ billion
Net flows in emerging Asian economies
FDI Portfolio Other Net flows
8/3/2019 Inflation in SE Asia
http://slidepdf.com/reader/full/inflation-in-se-asia 17/25
Coherent policy mix is key to success
For countries with persistent currentaccount imbalances and misalignedexchange rates: More flexible exchangerates
For countries without the abovesymptoms: Internationally coordinatedtemporary measures, such as capitalcontrols
G20 could provide useful tools: practicalindicative guidelines and principles forcapital controls
17
8/3/2019 Inflation in SE Asia
http://slidepdf.com/reader/full/inflation-in-se-asia 18/25
Key challenge:South-South economic links
18

8/3/2019 Inflation in SE Asia
http://slidepdf.com/reader/full/inflation-in-se-asia 19/25
Share of the South in global GDP isrising
Share of South in world GDP(%)
27
3233
37
45
0
10
20
30
40
50
1990 1995 2000 2005 2010
Developing Asia’s share in SouthGDP, 2010
PRC30%
OtherAsia
34%
OtherSouth36%
DevelopingAsia
64%
19
PRC = People’s Republic of China

8/3/2019 Inflation in SE Asia
http://slidepdf.com/reader/full/inflation-in-se-asia 20/2520
South-South trade is growing
Developing Asia’s share inSouth-South trade, 2009
OtherSouth26%
OtherAsia
34%
PRC40%
DevelopingAsia74%
Note: Merchandise trade, non-fuel
7
10
1516 17
1990—91* 2000—01* 2006—07* 2008 2009
South-South trade as share of world merchandise trade (%)
PRC = People’s Rep. of China

8/3/2019 Inflation in SE Asia
http://slidepdf.com/reader/full/inflation-in-se-asia 21/25
But developing Asia’s trade is driven
by factory Asia
0
10
20
30
40
50
60
97 99 01 03 05 07 09
(%)
Developing Asia PRC
Africa Latin America
0
10
20
30
40
50
60
97 99 01 03 05 07 09
(%)
Developing Asia PRC
Africa Latin America
Exports Imports
Share of parts and components (%)
21
• Factory Asia: intermediate goods sourced from South for assemblyand subsequent export to North
• Growing South-South links do not necessarily mean greater
economic independence!

8/3/2019 Inflation in SE Asia
http://slidepdf.com/reader/full/inflation-in-se-asia 22/25
Structural weaknesses need to beaddressed
22
4,25,5 5,1
3,73,2
19,6 20,6
16,0
12,1
9,3
0
5
10
15
20
25
1985-89 1990-94 1995-99 2000-04 2005-08
%
Applied tariffs, simple mean
North South

8/3/2019 Inflation in SE Asia
http://slidepdf.com/reader/full/inflation-in-se-asia 23/25
Other barriers remain too
Trade-relatedinfrastructure andlogistics performance
of the South lagconsiderably behindthe North
South-South FTAsare generally less
consistent with WTOand other global rules
23
2,0
2,5
3,0
3,5
North South
Average Logistic PerformanceIndex scores, North and South
2007 2010

8/3/2019 Inflation in SE Asia
http://slidepdf.com/reader/full/inflation-in-se-asia 24/25
Potential gains from strongerSouth-South links are large
Lowering tariffs could increaseSouth-South trade by 6% points
Industrial migration among theSouth could boost global growth
Recycling South savings for
investment could help globalrebalancing
24
8/3/2019 Inflation in SE Asia
http://slidepdf.com/reader/full/inflation-in-se-asia 25/25
Key Messages
Asia’s recovery is firm, with growthnearing 8% in the next 2 years
Asia is leading the global recovery
Rising inflation is a concern
Expanding South-South links present asupplementary growth source
But structural weaknesses need to beaddressed to maximize their potential


